DOI:10.32604/csse.2023.025195
| Computer Systems Science & Engineering DOI:10.32604/csse.2023.025195 | |
| Article |
Histogram Matched Chest X-Rays Based Tuberculosis Detection Using CNN
1Department of Information Technology, Sri Sivasubramaniya Nadar College of Engineering, Rajiv Gandhi Salai (OMR), Kalavakkam, Chennai, 603110, Tamil Nadu, India
2Gullas College of Medicine-University of Visayas, Banilad, Mandaue City, 6014, Cebu, Philippines
*Corresponding Author: Joe Louis Paul Ignatius. Email: joelouisi@ssn.edu.in
Received: 15 November 2021; Accepted: 27 December 2021
Abstract: Tuberculosis (TB) is a severe infection that mostly affects the lungs and kills millions of people’s lives every year. Tuberculosis can be diagnosed using chest X-rays (CXR) and data-driven deep learning (DL) approaches. Because of its better automated feature extraction capability, convolutional neural networks (CNNs) trained on natural images are particularly effective in image categorization. A combination of 3001 normal and 3001 TB CXR images was gathered for this study from different accessible public datasets. Ten different deep CNNs (Resnet50, Resnet101, Resnet152, InceptionV3, VGG16, VGG19, DenseNet121, DenseNet169, DenseNet201, MobileNet) are trained and tested for identifying TB and normal cases. This study presents a deep CNN approach based on histogram matched CXR images that does not require object segmentation of interest, and this coupled methodology of histogram matching with the CXRs improves the accuracy and detection performance of CNN models for TB detection. Furthermore, this research contains two separate experiments that used CXR images with and without histogram matching to classify TB and non-TB CXRs using deep CNNs. It was able to accurately detect TB from CXR images using pre-processing, data augmentation, and deep CNN models. Without histogram matching the best accuracy, sensitivity, specificity, precision and F1-score in the detection of TB using CXR images among ten models are 99.25%, 99.48%, 99.52%, 99.48% and 99.22% respectively. With histogram matching the best accuracy, sensitivity, specificity, precision and F1-score are 99.58%, 99.82%, 99.67%, 99.65% and 99.56% respectively. The proposed methodology, which has cutting-edge performance, will be useful in computer-assisted TB diagnosis and aids in minimizing irregularities in TB detection in developing countries.
Keywords: Tuberculosis detection; chest x-ray (CXR); convolutional neural networks (CNNs); transfer learning; histogram matching
Tuberculosis (TB) is a contagious illness caused by the bacillus Mycobacterium tuberculosis. To reduce the disease burden, TB can be treated by early identification and appropriate categorization from other disorders with similar radiologic findings. According to the World Health Organization (WHO), TB is the second leading cause of death from an infectious disease, behind Human Immunodeficiency Virus, with a global mortality rate of over 1.8 million people and 10.4 million new cases per year Human Immunodeficiency Virus (HIV). Tuberculosis is becoming more common in a number of developing nations. It can affect both men and women, although it is more prevalent in men. Patients with active tuberculosis will undergo a long course of antibiotic medication and treatment [1]. WHO and other organizations have suggested chest radiography, also known as Chest X-Rays (CXRs), as an effective method for successful case finding and prevalence surveys for the detection of TB. CXRs have been discovered to be the most common screening tool for detecting lung abnormalities [2]. Generally, CXRs will show white patches in the lungs and it will be useful for determining the level of disease spread [3]. Furthermore, it demonstrates the changes in the lungs caused by the existence of TB over time, necessitating subsequent more expensive and time-consuming investigations.
According to various research and surveys, radiology interpretation is inadequate in many TB-affected areas, resulting in reduced screening efficacy. The majority of TB CXR images are misdiagnosed as other illnesses with similar radiologic characteristics. In fact, this leads to ineffective medicine and a deterioration in the patient’s health. An effective automated and cost-effective technique could aid in the accuracy of screening evaluations and enable for earlier disease detection in developing countries [4,5].
Artificial intelligence (AI) is playing a tremendous role in the development of prominent tools for diagnosing various diseases. AI is the superset of Machine Learning (ML) and data-driven deep learning (DL) is the subset of ML. DL uses a number of layers for feature extraction and transformation of data [6]. Artificial intelligence has the ability to transform the way diseases are diagnosed, classified, and identified in the future. Clinical-decision support algorithms for medical imaging, on the other hand, confront hurdles in terms of reliability and interpretability. DL models automatically extract significant properties from data and have been shown to achieve state-of-the-art accuracy, in many cases outperforming human output. One of the most common deep learning designs is the convolutional neural network (CNN). Deep learning has gained appeal as a result of its functional efficacy. CNN is computationally efficient and recognizes essential qualities without the need for human intervention. In image classification, CNNs trained on natural images perform remarkably well. CNN is frequently used in the research field due to its superior automated feature extraction capability [7].
CNNs are utilized to analyze CXR images in recent research centered on the identification of lung illnesses such as pneumonia and TB. CNN-based approaches are utilized to identify the novel coronavirus infection from CXR images and to distinguish COVID-19 pneumonia, TB, and normal patients in accordance to the COVID-19 global scenario [8]. Histogram matching is an image processing technique that improves the effect of an image by changing the gray histogram into the matching shape. The image’s detail can get clearer when processed by histogram matching because the grayscale spacing can be made larger and the grayscale distribution must be consistent [9]. As a result, the contrast of the CXR images is enhanced, which improves the detection performance and accuracy of deep CNN models for tuberculosis detection.
The following are the major contributions of this research.
i) On the basis of CXR images, a deep CNN-based approach for detecting tuberculosis is proposed, which can be utilized to improve abnormality detection and initial tuberculosis screening.
ii) For effective detection, a performance analysis of notable pretrained CNN architectures are performed.
iii) To improve the accuracy and detection performance of the CNNs models, a fusion of CXR images with histogram matching has been deployed.
iv) A comprehensive analysis was performed with the state-of-the-art TB detection methods.
This paper is organized as follows. Section 2 describes the related works relevant to TB detection using deep CNNs. Section 3 introduces the methodology of the entire system. Sections 4 details about the pre-processing, data augmentation and histogram matching used in this study. Section 5 illustrates the results and discussions on the performance of various CNN models on TB detection with and without histogram matching. Finally, Section 6 presents the conclusion.
Tuberculosis is one of the leading causes of death worldwide, therefore early detection is essential for effective treatment and management. Since radiologists are scarce in developing areas, computer-assisted detection is essential to aid in the early identification of tuberculosis in order to improve human life. Combining transfer learning with multiple approaches raised the TB diagnosis accuracy from 50 to 94.8 percent [10]. Despite the numerous risks posed by this disease, one of the United Nations’ Sustainable Development Goals for 2015 is to eradicate the TB pandemic by 2030. New therapies and diagnostic methods must be established in order to contribute to this goal. X-ray imaging incompatibilities are very common, particularly in areas where radiological facilities and radiologists are scarce, or where X-ray equipment’s are technologically different [11].
Machine Learning (ML) has developed rapidly in the last decade, with supervised learning methods like Artificial Neural Networks (ANNs) achieving superior output in classification and regression tasks. Deep Learning (DL) is becoming increasingly common in various fields, including malware detection, health care and medicine, and speech recognition [12]. These advancements were made possible by deep learning’s ability to learn features from data rather than hand-designed features based on domain-specific information. Presently, the medical field is one which requires utmost care and investigation, with medical sciences at a level that necessitates substantial research and technical proposals in order to address the increasingly complicated medical challenges [13]. Deep learning is rapidly becoming the industry standard, leading in improved outcomes in a wide range of medical applications. As a result, these advancements make diagnosing and identifying such medical disorders easier for clinicians. There has been a lot of work in the recent literature on using DL techniques on medical images to automate diagnosis [14,15].
Medical images are crucial in the care and diagnosis of patients. The aim of Computer-Aided Diagnosis (CAD) is to provide doctors with accurate interpretations of medical images, so that a large number of patients can be treated more effectively [16]. Full training and fine-tuning a CNN that has been pre-trained using a large number of labeled natural images are the two methods. In this study, both profoundly fine-tuned CNNs and completely qualified CNNs outperformed the handcrafted alternatives, highlighting the potential of CNNs for medical imaging applications. Transfer learning has been used to fine-tune deep CNN models to increase training and validation performance. Partial data augmentation strategies are used to extend the training dataset in a balanced way. The tests were conducted, and the model’s robustness was demonstrated by the scores obtained, which included accuracy, recall, precision, and the area under the curve (AUC) ranking. The proposed model achieved a 98.857 percent accuracy and a high F1 score of 99.002, confirming its efficacy [17].
Six separate convolutional neural network models are used to identify the data collection composed of CXR images, including Densenet121, Inception v3, NASNet mobile, Resnet50, VGG16, and Xception. The classification output of Densenet121 is the best in six models [18]. In medical image modality classification, three CNNs with different depths, such as CNN-6, VGGNet-16, and ResNet-50, are integrated by a weighted average of the prediction probabilities. After employing two data augmentation methods, the results such as 76.87 percent in ImageCLEF2015 and 87.37 percent in ImageCLEF2016 are obtained. This suggests that using transfer learning techniques and data augmentation, CNNs can more efficiently classify modalities of medical images [19].
Nine different deep CNNs were trained and tested for classification of TB and normal cases using transfer learning. This study included three different experiments: CXR image segmentation using two different U-net models, CXR image classification, and segmented lung images. The accuracy, precision, sensitivity, F1-score and specificity of best performing model ChexNet were 96.47%, 96.62%, 96.47%, 96.47%, and 96.51% respectively. However, for the segmented lung CXR images, the accuracy, precision, sensitivity, F1-score and specificity of DenseNet201 were 98.6%, 98.57%, 98.56%, 98.56%, and 98.54%. The researchers demonstrated that CNN learning predominantly from segmented lung areas results in high accuracy using a visualization method [20]. Image analysis and feature extraction using AI have been used to identify and diagnose a broad variety of chest-related diseases [21]. The majority of TB diagnostic deep neural networks were adapted from natural image categorization. These models contain many parameters and high system requirements, making them prone to overfitting and challenging to employ in usual environment [22]. A portable CXR (pCXR) is an essential tool in the treatment of COVID-19 lung infection. COVID-19 lung infections on pCXR were differentiated from common and associated lung disorders using deep CNNs, possibly enabling for more prompt and accurate diagnosis. This approach has the potential to help radiologists and clinicians by improving the accuracy of the diagnosis [23].
As a result, radiologists can detect anomalies on both original CXR examinations and digital images of CXR films. Deep learning has recently produced impressive results, with its output becoming increasingly human-like in recent years [24]. The primary goal of technology is to create tools and algorithms that will improve human life. The detection of such defects using CXR images is a problem that must be addressed. Deep learning algorithms that can detect such abnormalities with high accuracy and that are accurate and interpretable must be developed. While several models have been built over time, there is still room for improvement [25].
The methodology of the proposed system is illustrated in Fig. 1. This proposed study includes two separate tests for categorizing TB and non-TB patients using deep CNNs with and without histogram matching respectively.
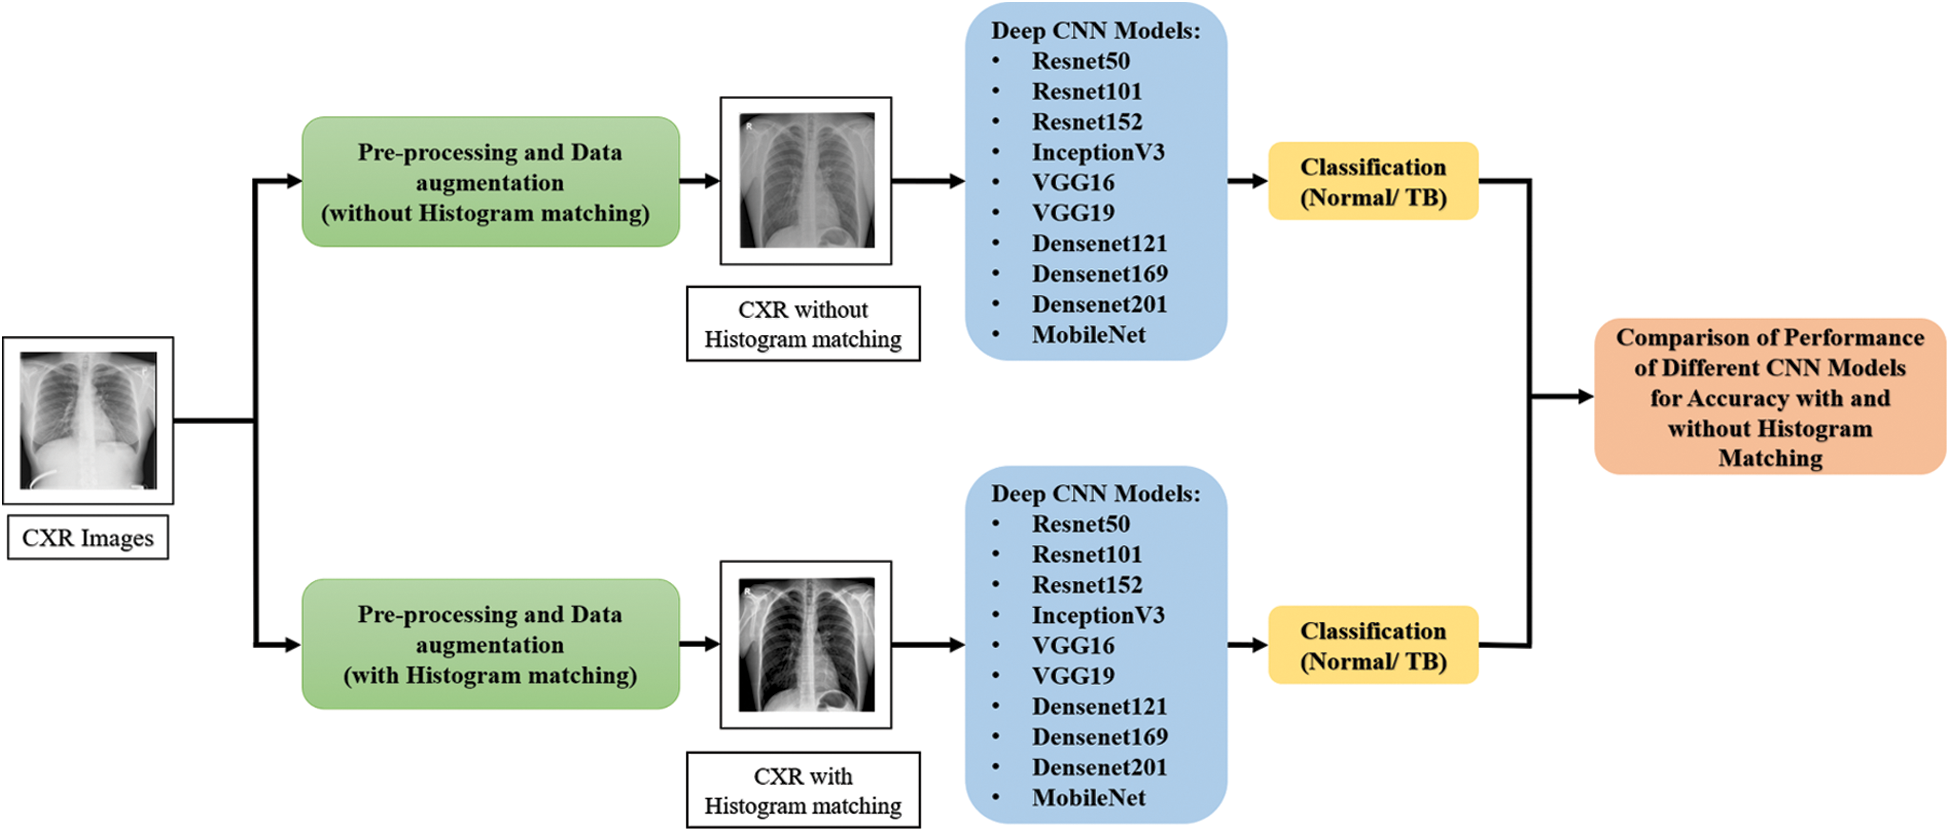
Figure 1: Methodology of the proposed system
The datasets used in this study are freely accessible posterior-anterior (PA) chest radiographs from the National Library of Medicine in the United States (NLM), RSNA CXR dataset, NIAID TB dataset and Belarus dataset which are accessed from Kaggle.
Shenzhen chest X-ray set (CHN) and Montgomery County chest X-ray set (MC): This dataset contains 662 CXRs images, 326 of which belong to healthy participants and 336 of which belong to TB patients. The Montgomery County dataset is made up of 138 frontal CXRs from Montgomery County’s TB Screening Program, 80 of which are normal and 58 of which have TB.
RSNA CXR dataset, which consists about 30,000 CXR images, where 10,000 CXR images are normal and 20,000 CXR images are abnormal.
NIAID TB dataset, which contains 3000 TB CXR images from about 3087 cases. All images were collected from seven different countries and the CXR images are in Portable Network Graphics (PNG).
Belarus set was collected for a drug resistance study initiated by the National Institute of Allergy and Infectious Diseases, Ministry of Health, Republic of Belarus. This dataset consists of 306 CXR images collected from 169 patients. Fig. 2 describes the sample of the CXR images used in this study.
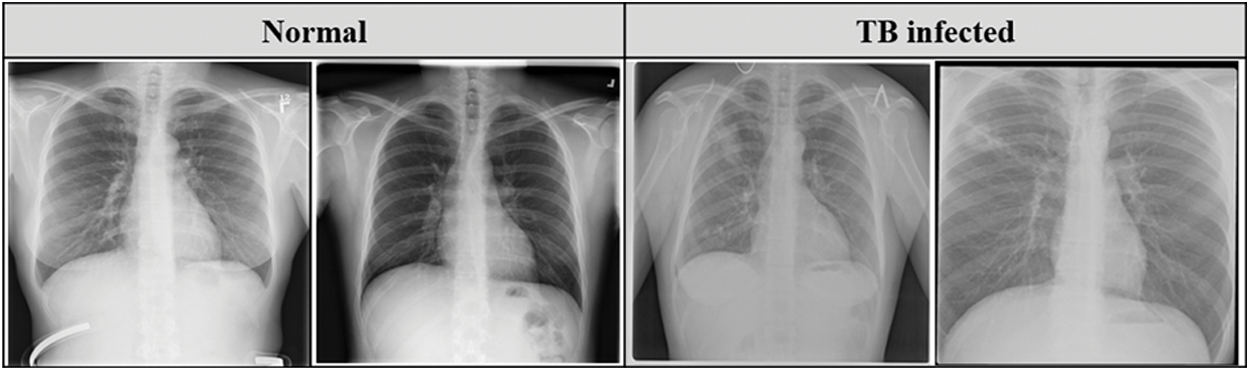
Figure 2: Sample CXR images from the datasets
4 Pre-Processing and Data Augmentation
The CXR images in the dataset vary in size, and the majority of the CXR images contain one color channel (grayscale), but a few images have three color channels (RGB). Initially, all CXR images are converted to RGB images. To remove the effect of the blue color, RGB images are converted to grayscale images. The datasets are pre-processed to resize the CXR images as the size of the input images for various CNN models vary. Portable Network Graphics (PNG) format is used to resize the CXR images to 250 × 250 × 3 pixels. This size was chosen to meet the requirements of the input shape. Fig. 3 depicts the normal and TB images after resizing and pre-processing.
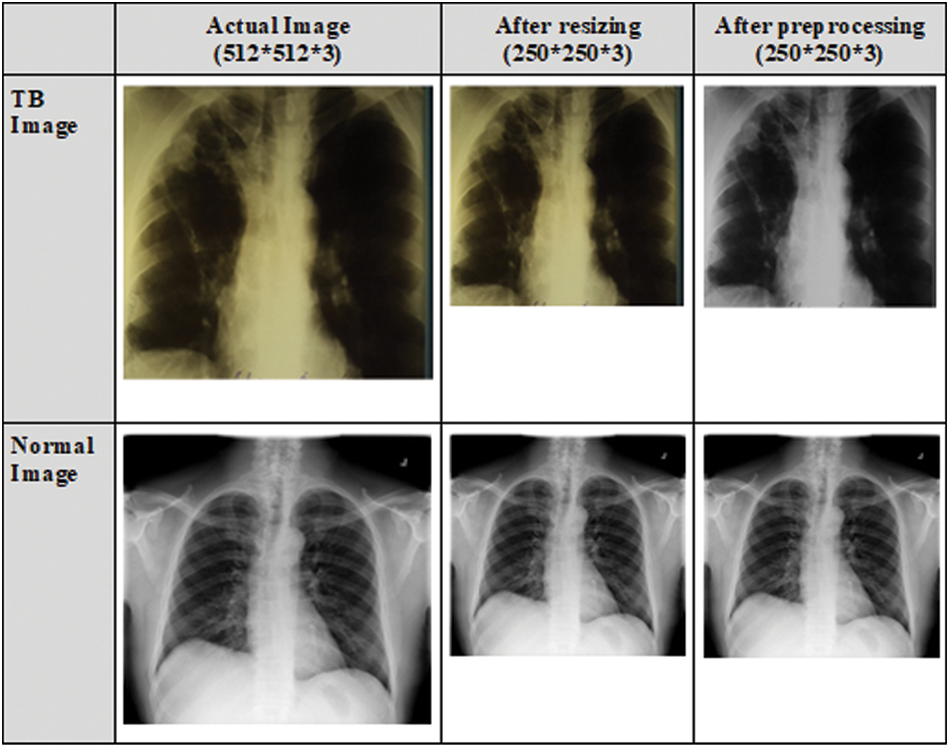
Figure 3: CXR images after resizing and pre-processing
4.2 Data Augmentation and Histogram Matching
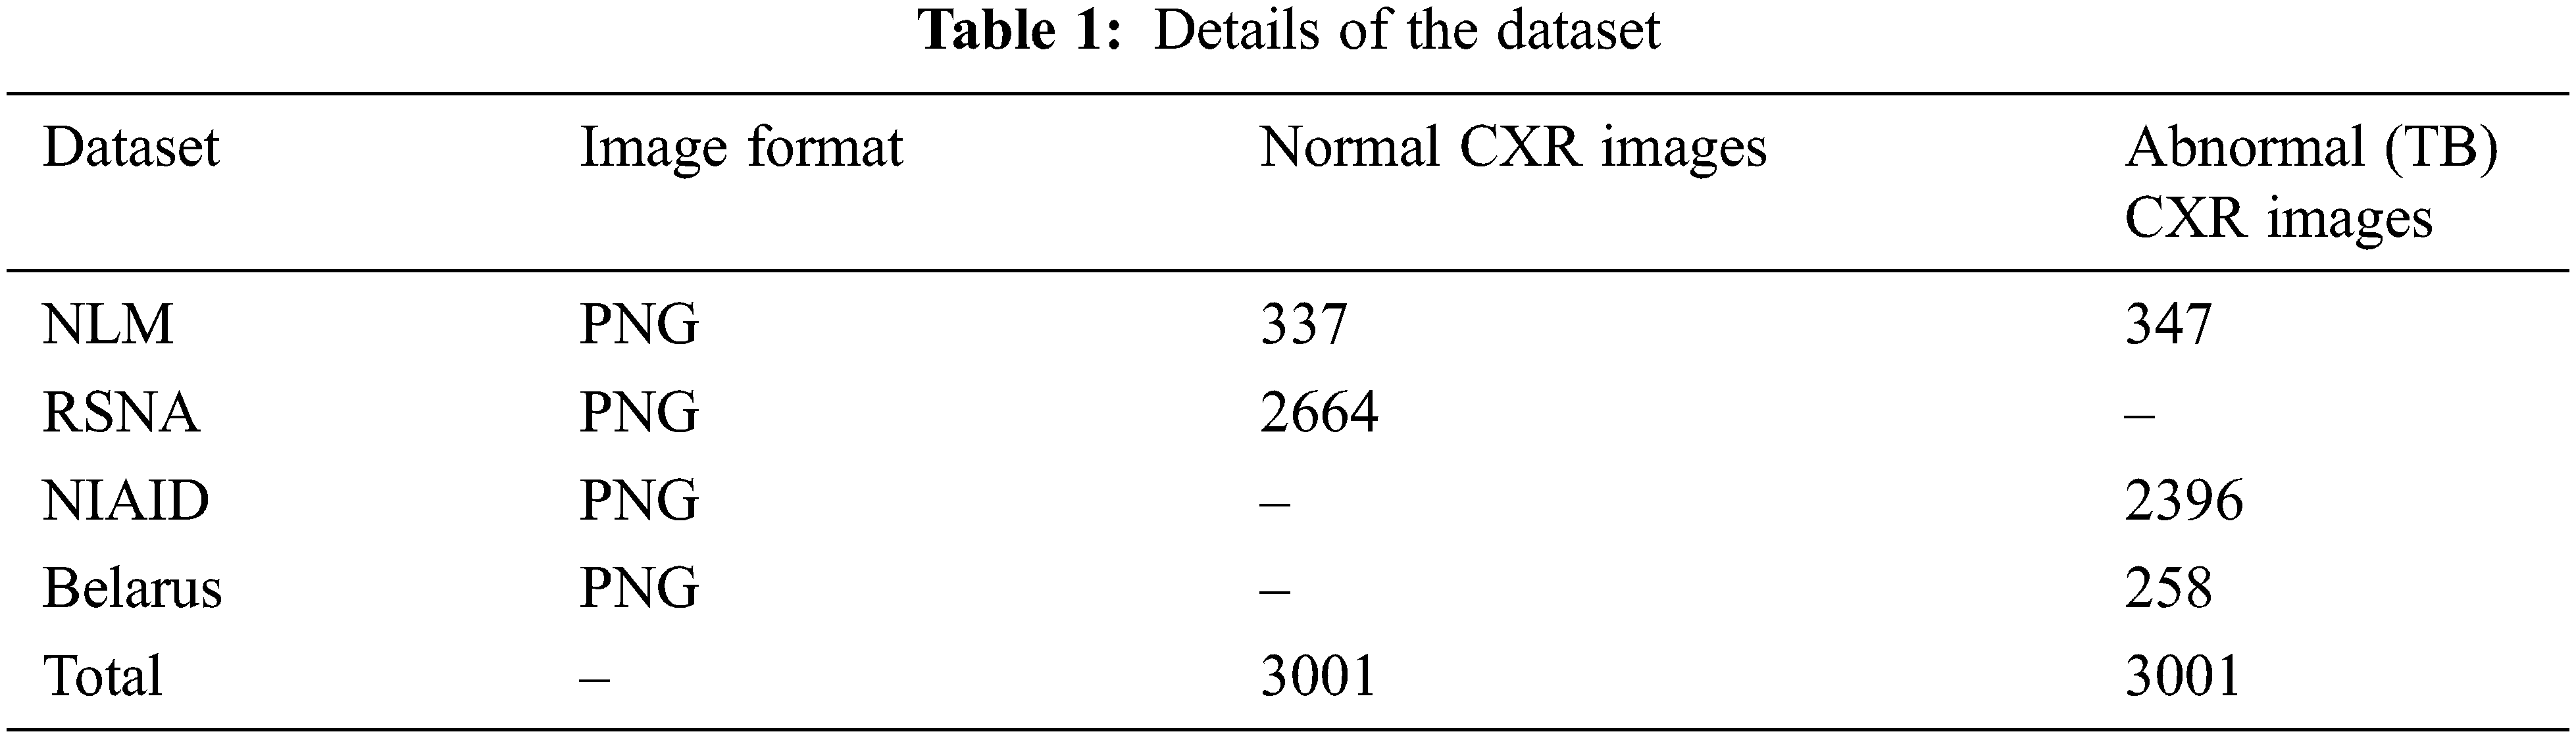
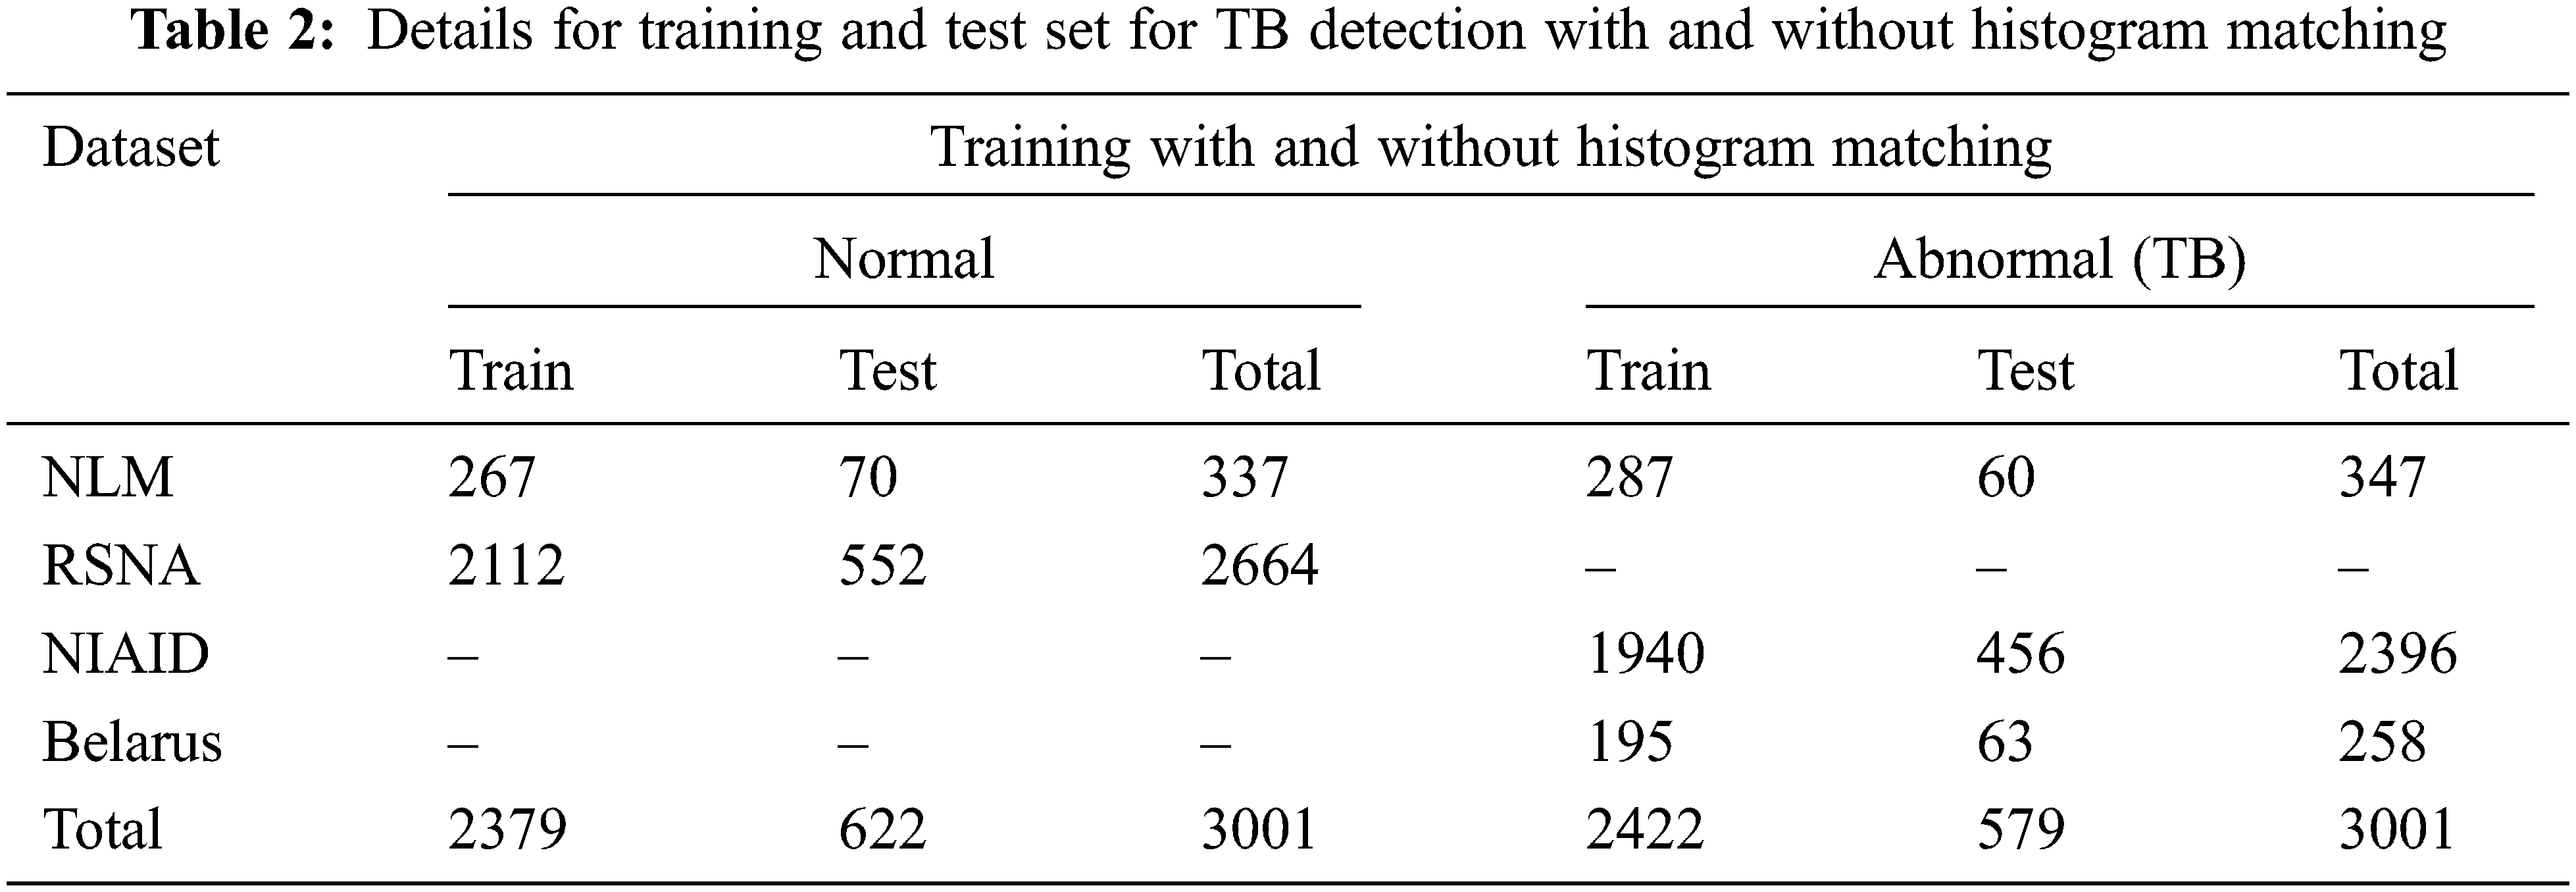
Data augmentation improvise the accuracy of classification of the DL models by augmenting the existing data instead of collecting new data. It also increases the range of data available for training the models. Therefore, it is important to perform augmentation in order to make the dataset balance. Thus, to create a normal database of 6002 CXR images for this study, 3,001 normal images and 3,001 abnormal (TB) images are taken from the datasets. In that 337 normal and 347 abnormal (TB) CXR images are taken from NLM dataset, 2,664 normal CXR images are taken from RSNA dataset, 2,396 abnormal (TB) CXR images are taken from NIAID TB dataset and 258 abnormal (TB) CXR images are taken from Belarus dataset respectively.
Tab. 1 describes the image format of the respective datasets and the number of normal and abnormal images used for detection of TB through deep CNN models.
When the dataset is unbalanced, image augmentation is essential. Thus, Histogram Matching (HM) is utilized to enhance the contrast and correct the exposure anomalies in CXR images. Histogram matching is an image processing operation in which an image’s histogram is matched to the histogram of another reference (template) image’s histogram. The following is a description of the algorithm.
Step 1: For each image, calculate the cumulative histogram.
Step 2: Match the histogram of the input image with the histogram of the template image to determine the appropriate pixel value, xn, in the output image for each given pixel value, xm, in the input image.
Step 3: In the input, swap pixel xm for pixel xn.
The intensities can be better dispersed on the histogram as a result of this modification. This method increases contrast in low-contrast areas without affecting overall contrast. This is accomplished by using the following probability of gray level gi occurrence in an image as follows [26]. Here, the intensity levels of the given image are distinct.
where ni is the number of occurrences of the ith intensity and n represents the size of the image. The normalized histogram pi(gi) is given in Eq. (1). The Cumulative Distribution Function (CDF), ck is determined from the above normalized histogram as given in Eq. (2).
where k represents the number of unique intensities present in the image. The gray levels of the input and output (processed) images are denoted by gi and ci, respectively, with i = 0, 1… [27].
Fig. 4 depicts the categorization database’s CXR images (without histogram matching) and equivalent histogram matched images. Thus, it is notable that the contrast of the CXR images have been improved which has eventually enhanced the intensify our region of interest i.e., the lung region in the CXR images.

Figure 4: Samples of CXR images from classification database (left) and corresponding histogram matched image (right)
Deep CNNs have gained prominence as a result of their improved image classification performance. Transfer learning can be used in various CNN applications if the dataset is small. Transfer learning has recently been implemented in a number of domains, including medical, manufacturing, and object screening. This eliminates the need for a big dataset and shortens the training period that a deep learning system requires when created from scratch [28]. Ten popular pre-trained deep CNN models such as Resnet50, Resnet101, Resnet152, InceptionV3, VGG16, VGG19, DenseNet121, DenseNet169, DenseNet201, and MobileNet are used for TB detection. The intermediate weights for all the models were set as non-trainable. The last layer weights are trainable. For the last output layer, Sigmoid activation function has been used for all the CNN models.
The above ten different CNN models were trained and tested separately with and without histogram matched images for the classification of TB CXR images and normal CXR images to investigate whether the histogram matching can improve the detection performance and enhance the accuracy of the CNN models. The entire CXR image set was divided into two subsets: 80% training and 20% testing respectively. The random state in the train_test_split function is 22. The number of training and test images used in the two experiments of CXR images with and without histogram matching is shown in Tab. 2.
All the ten deep CNN models are implemented using TensorFlow library with Python 3.7.10 on the Goggle Colab which uses 12 GB RAM, with a GPU. The TensorFlow random speed is 3. The models are trained with Adam Optimizer and Binary Cross Entropy is used as the loss function. A batch size of 64 images is used. As this is a two-class classification problem, the default threshold value is set to 0.5 to ensure a fair class balance.
The VGG16 has 16 layers, VGG19 has 19 layers and MobileNet has 28 layers. These networks are shallow when compared to the other deep networks used in this study. The same training parameters are used to train ten pre-trained deep CNN models. The test accuracy dropped and the loss increased when the number of the epochs is increased thus, using image augmentation and reducing the number of epochs to 5 from the initial value of 15 epochs, helps in avoiding the overfittings of the deep CNN models.
Maintaining a general system of model assessment in the medical field is a crucial component of establishing a consistent and fair comparison ground with other proposed previous researches. For validating the robustness of our proposed system, six different evaluation metrices are used: (a) Accuracy (Eq. (3)), (b) Sensitivity (Eq. (4)), (c) Specificity (Eq. (5)), (d) Precision (Eq. (6)), (e) F1-score/Dice coefficient (Eq. (7)), and (f) Region of Convergence curve (ROC). These can be computed using the following expressions.
Confusion matrix is a typical method for evaluating model performance using true positive (TP), true negative (TN), false positive (FP), and false negative (FN). This confusion matrix is used as a benchmark for testing the model’s response. Here, the number of CXR images accurately classified as positive cases by each model, is referred to TP. The number of CXR images accurately recognized as negative cases by the model, is referred to TN. The number of CXR images that are truly but classified as tuberculosis by each model, is referred to as the FP. The number of CXR image that are truly positive (tuberculosis) but classified as normal, is referred to as FN. For various threshold settings, the ROC is calculated by plotting the sensitivity against the 1-specificity.
As previously stated, two separate experiments were conducted for the classification of TB and normal (non-TB) patients using CXR images with and without histogram matching to investigate if the histogram matching can enhance the accuracy and improve the detection performance of various CNN models.
5.1 Performance of Various CNN Models for TB Detection without Using Histogram Matching
In Tab. 3, the performance of different CNNs for binary classification is compared using CXR images without using histogram matching.
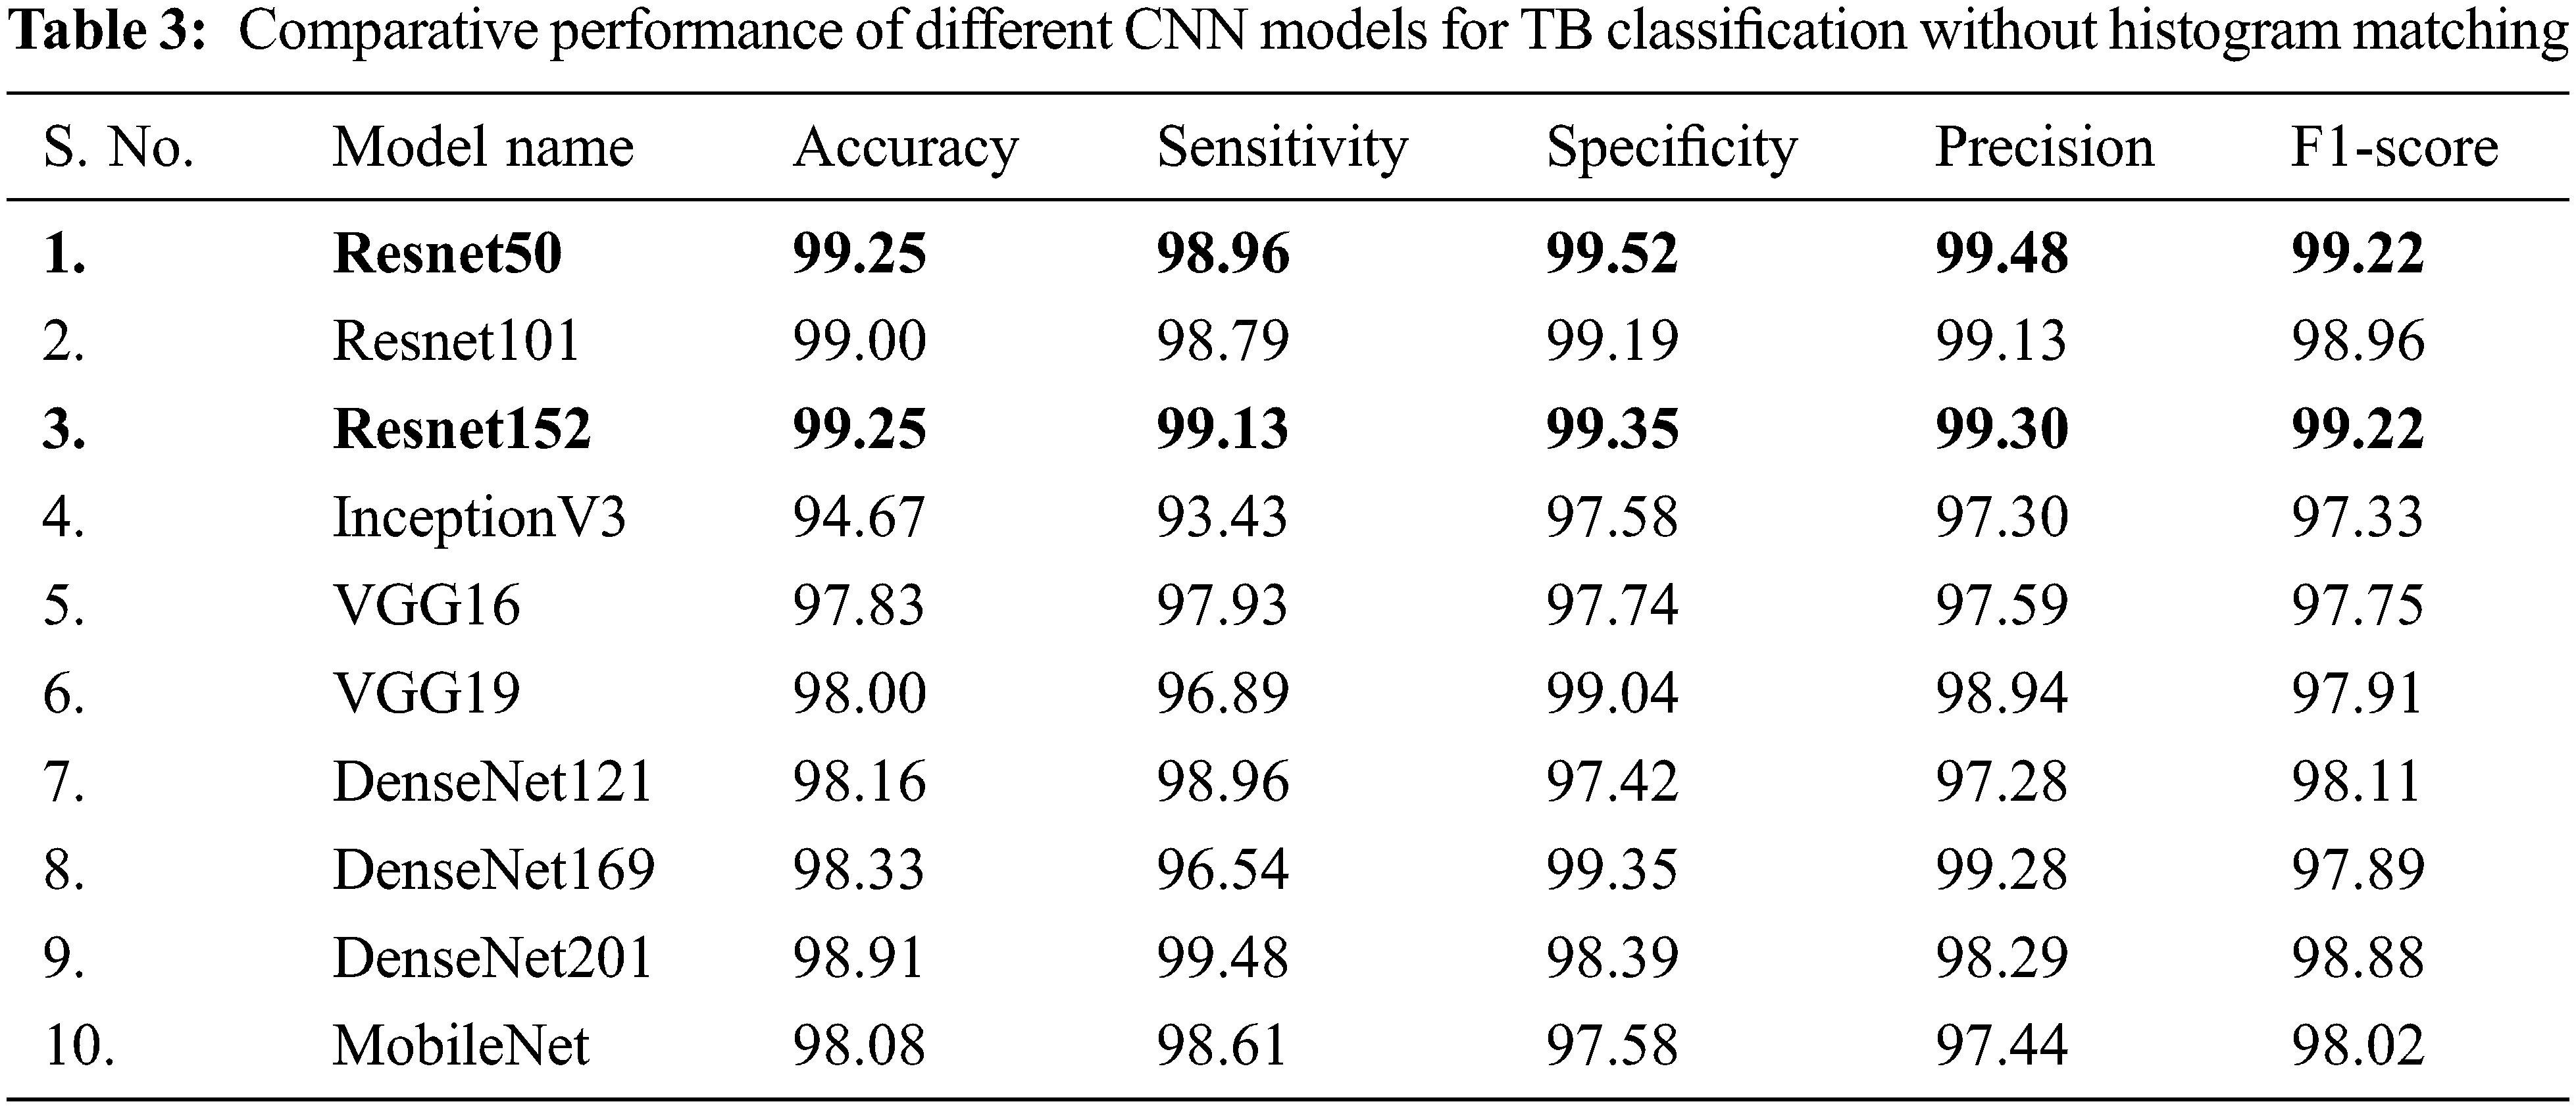
It is inferred that, both Resnet50 and Resnet152 are equally outperforming other networks trained on CXR images without using histogram matching when it comes to categorizing CXR images. Even though Resnet50 is shallower than DenseNet201, it was originally trained on CXR images provide with additional benefits in classifying CXR images and hence it has shown better performance compared to DenseNet201.
Deeper networks do not always perform better; instead, Resnet50 is a great example of transfer learning that outclasses other networks in this task. Resnet101, DenseNet201, DenseNet169, DenseNet121, and MobileNet, on the other hand, showed consistently better performance for image classification without histogram matching.
When evaluating CXR images without histogram matching, Figs. 5a and 5b clearly indicates that DenseNet201’s ROC curve is the best one followed by Resnet152. It is also found that Resnet50, DenseNet121, Resnet101, and MobileNet are also performing well. According to Fig. 5b, Resnet50 and DenseNet121 have overlapping ROC curves, but the remainder of the ROC curves are comparable.

Figure 5: (a) Comparison of ROC curves of different CNN models for TB classification without histogram matching and (b) zoomed view
Figs. 6a and 6b presents the confusion matrix for outperforming the Resnet152 and Resnet50 models on non-histogram matched CXR images respectively. When non- histogram matched CXR images are given as input to the classifier, 6 out of 579 TB test images are misclassified as normal and 3 out of 622 normal CXR test images are misclassified as TB images, when using the equally performing network Resnet50 (as shown in Fig. 6b). When the same CXR images are used as the input to the classifier, only out of 579 TB test images are misclassified as normal and 4 out of 622 normal CXR test images are misclassified as TB images in the top performing network Resnet152 (as shown in Fig. 6a).

Figure 6: Confusion matrix for normal and TB classifications without histogram matching for the best CNN models (a) Resnet152 and (b) Resnet50
5.2 Performance of Various CNN Models for TB Detection Using Histogram Matching
In Tab. 4, CXR images with histogram matching are used to examine the performance of different CNNs for binary classification. Tab. 4 indicates that in this two-class scenario, all of the tested pre-trained models are exceptionally good at distinguishing between TB and normal CXR images.
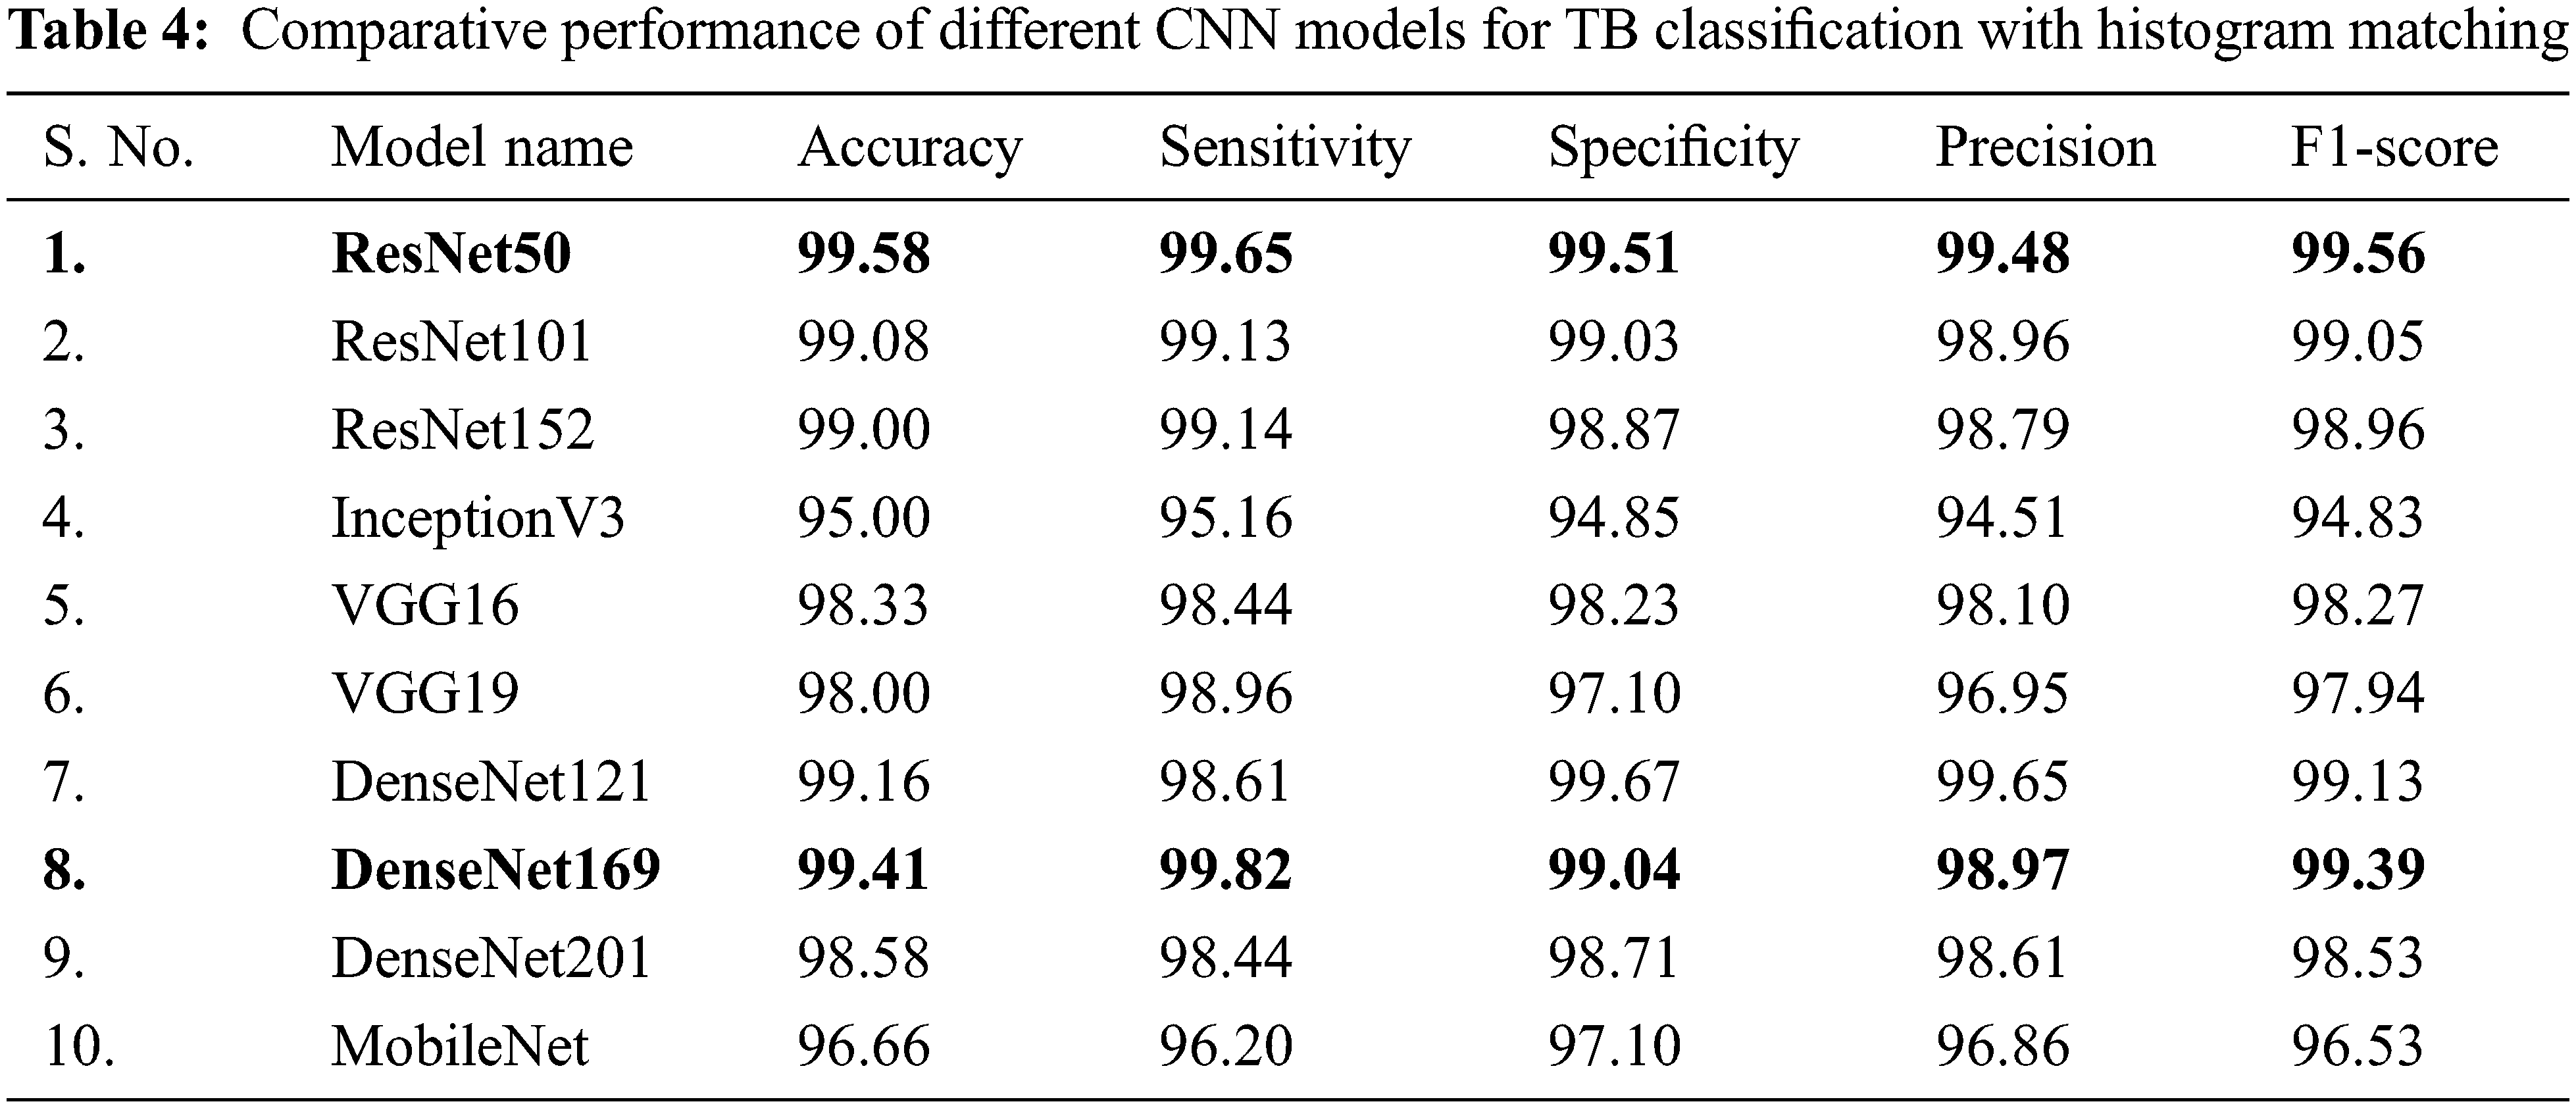
It is inferred that, both Resnet50 and DenseNet169 outperforms other networks trained on CXR images with histogram matching when it comes to categorizing CXR images. Resnet50 is shallower than DenseNet169, but it was first trained on CXR images, which provided it with significant advantages in classification of CXR images, and so it outperformed DenseNet169. Resnet50 is an excellent example of transfer learning and, as previously stated, it outclasses other deep CNN models in this study.
DenseNet121, ResNet101, and ResNet152 all performed comparably in image classification using histogram matching. When utilising histogram matching to evaluate CXR images, Figs. 7a and 7b clearly show that the DenseNet169 ROC curve is the best, followed by ResNet50. ResNet101 and ResNet152 are likewise found to be performing well in comparison. Both ResNet50 and DenseNet169 perform better with and without histogram matched CXR images, according to the results. DenseNet201 and VGG16 have overlapping ROC curves, and ResNet101 and ResNet152 have almost overlapping curves, while the rest of the networks’ ROC curves are comparable as shown in Fig. 7b.

Figure 7: (a) Comparison of ROC curves of different CNN models for TB classification with histogram matching and (b) zoomed view
Figs. 8a and 8b presents the confusion matrices for outperforming the Resnet50 and DenseNet169 models on histogram-matched CXR images respectively. When histogram matched CXR images are given as input to the classifier, 1 out of 579 TB test images are misclassified as normal and 6 out of 622 normal CXR test images are misclassified as TB images, when using the second highest performing network DenseNet169 (as shown in Fig. 8b). When the same CXR images following histogram matching is used as the input to the classifier, only 2 out of 579 TB test images were misclassified as normal and 3 out of 622 normal CXR test images were misclassified as TB images in the top performing network Resnet50 (as shown in Fig. 8a). This is certainly an outstanding performance from any models with a computer-aided classifier, and it may greatly benefit the radiologists and the doctors in early diagnosis of TB after collecting the CXR images.

Figure 8: Confusion Matrix for Normal and TB Classifications with histogram matching for the Best CNN Models (a) Resnet50 and (b) DenseNet169
Form Fig. 9, it is inferred that, the accuracy of TB detection has been significantly increased for Resnet50 (0.33%), Resnet101 (0.08%), InceptionV3 (0.33%) VGG16 (0.5%), DenseNet121 (1%), and DenseNet169 (1.08%) respectively using histogram matching. Moreover, the histogram matching is found to be very useful in improving the accuracy for DenseNet169 and DenseNet201 CNN models. On the other hand, it also is inferred that the accuracy of TB detection has been significantly reduced for Resnet152 (0.25%), DenseNet201 (0.33%), MobileNet (1.42%) CNN models respectively with the use of histogram matching. It is also found that there is no change in the accuracy performance of VGG19 model in comparison with and without using histogram matching.

Figure 9: Comparison of detection accuracy of the CNN models with and without histogram matching
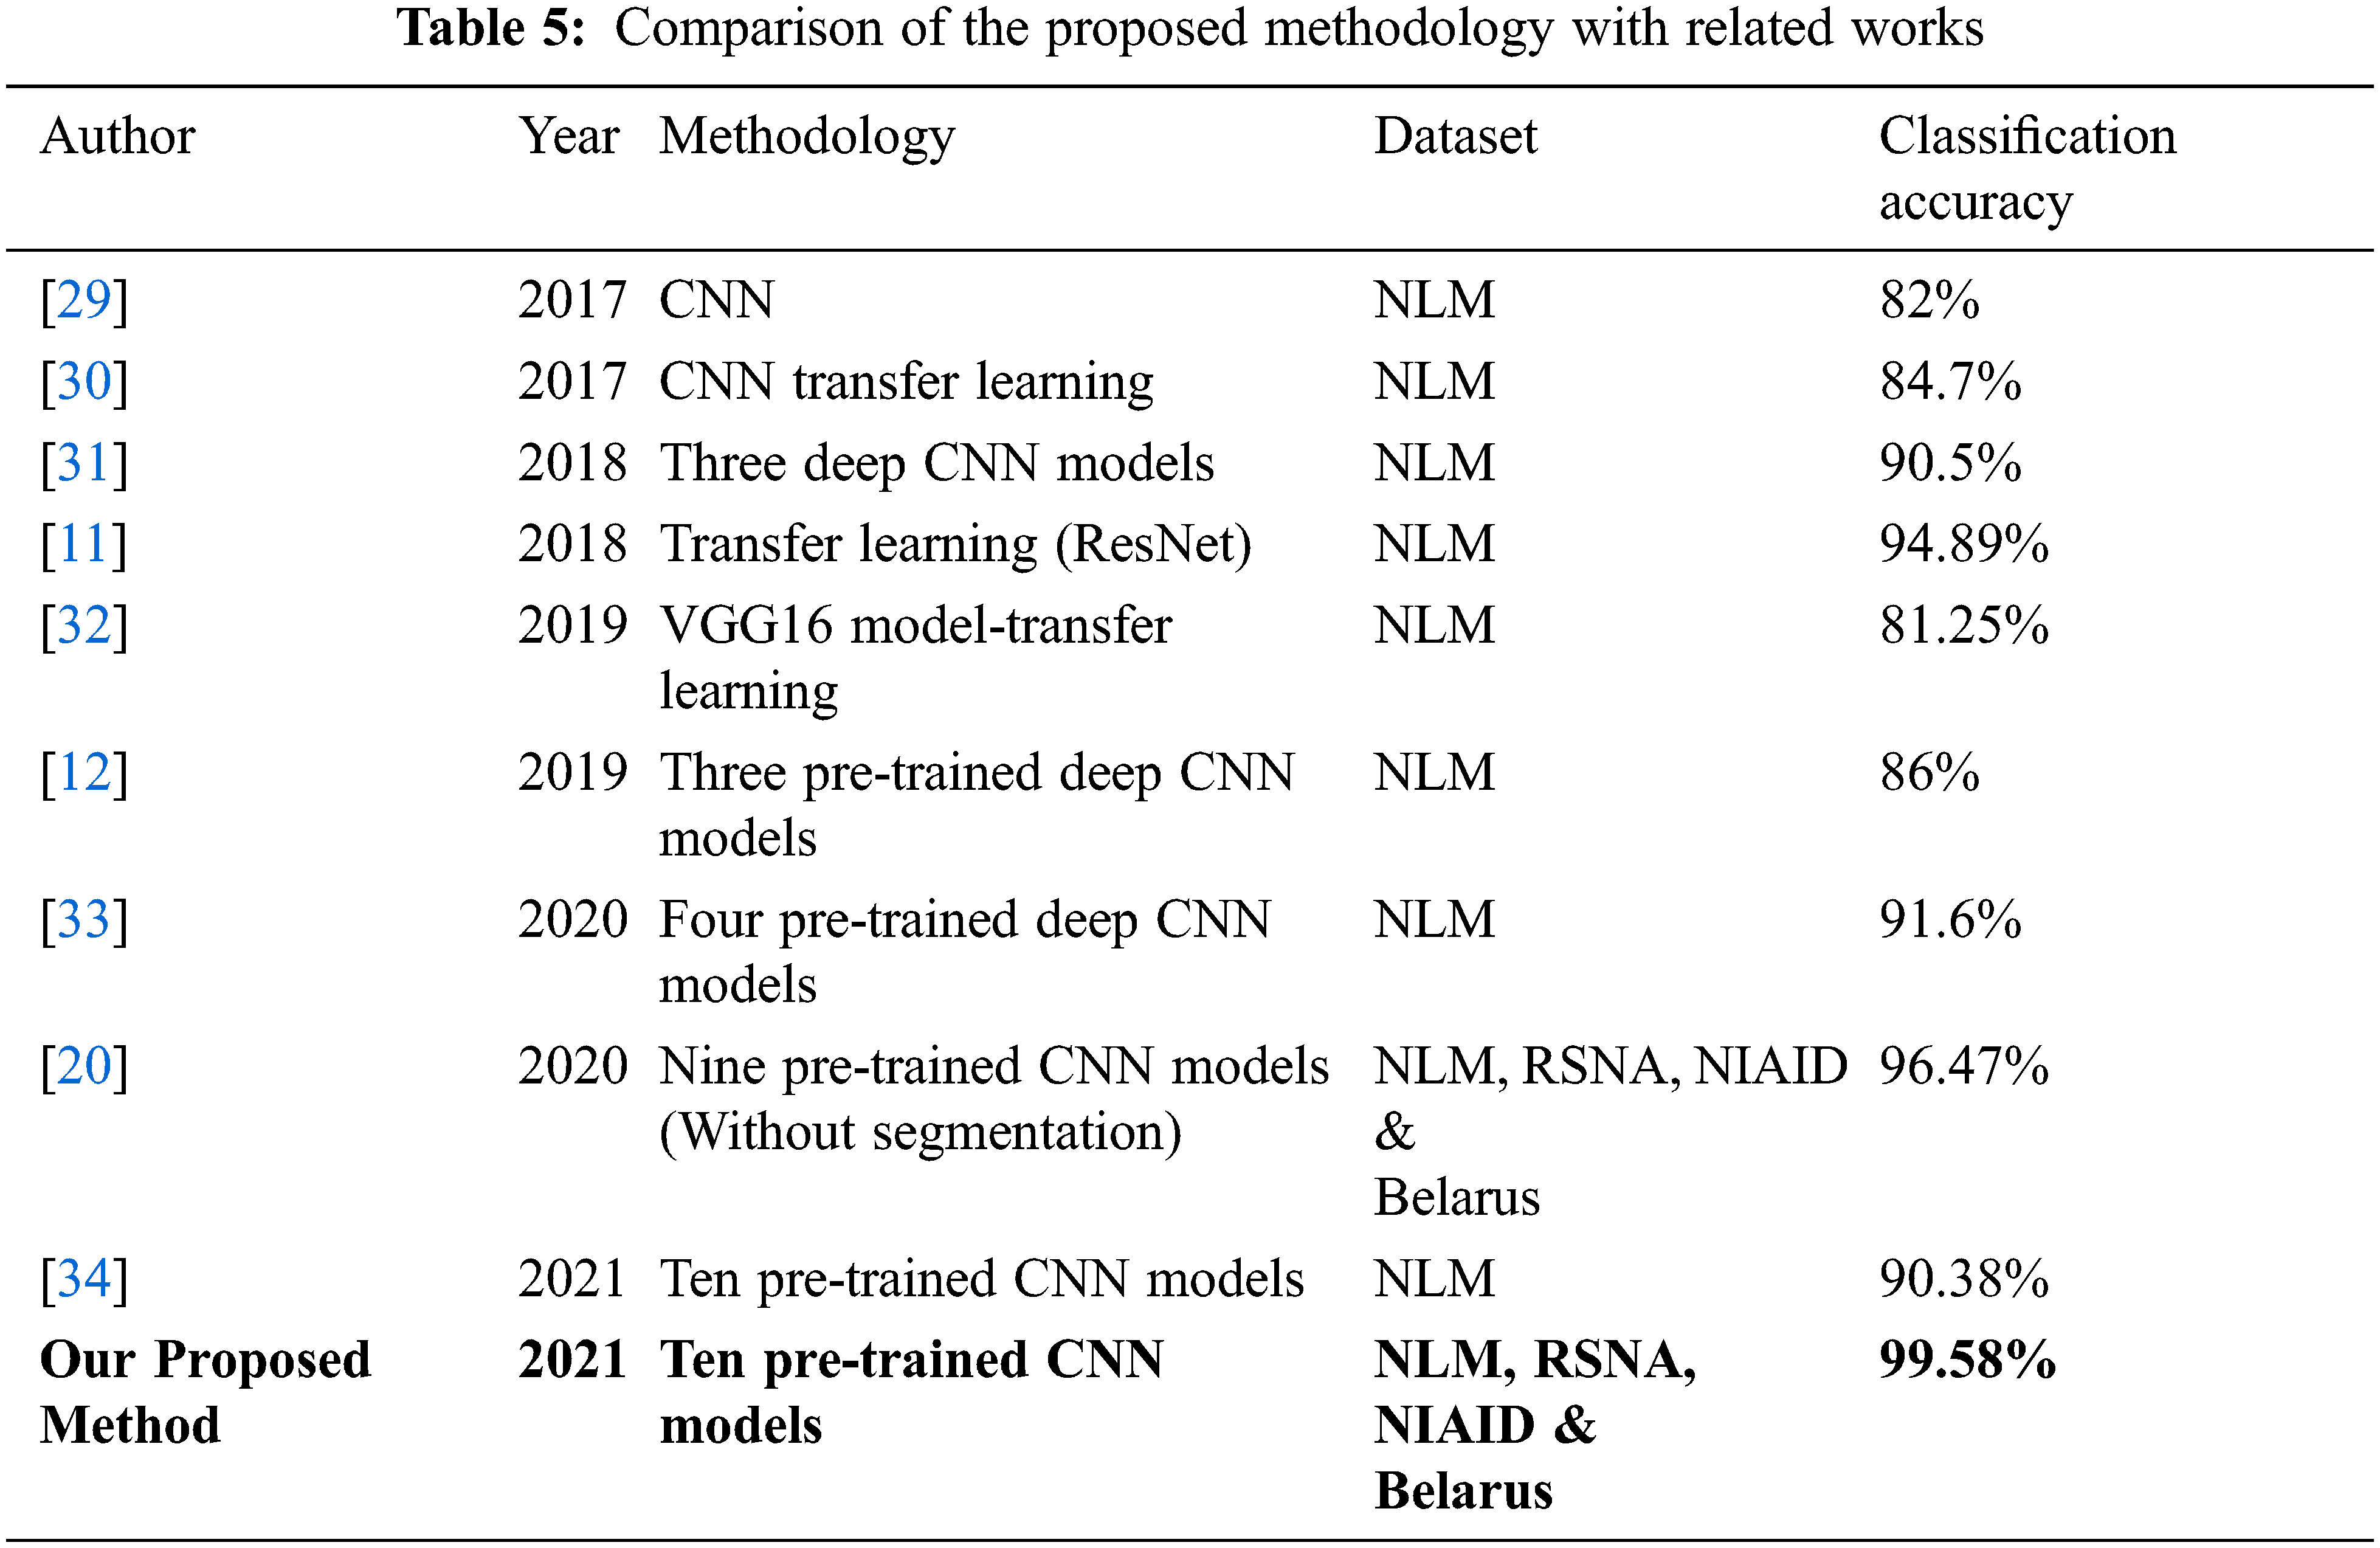
Our proposed approach’s classification accuracy was compared to various recently published articles in the detection of tuberculosis. Tab. 5 compares the classification accuracy obtained in this investigation to that obtained in other studies employing CXR images to diagnose tuberculosis. Many datasets from large databases were employed in this investigation, and consistent results were achieved. This demonstrates the generalizability of the proposed system. With 10 deep CNN models, histogram matching is also used to evaluate classification performance, resulting in a more reliable and efficient system with 99.58 percent classification accuracy.
When training accuracy is high but testing accuracy is low, overfitting is said to occur. In our situation, however, all of the models perform well during the training and testing phases, thus there is no overfitting. The dataset utilised is a standard dataset that has been used in a number of articles, demonstrating that the model is generalizable. Transfer learning was utilised to fine-tune the model for the TB detection challenge at hand.
As there is a scarcity of radiologists in resource-constrained and developing areas, technology-assisted TB detection is needed to aid in the reduction of time and effort spent in TB detection. This article presents a transfer learning strategy that uses deep CNN for automated diagnosis of tuberculosis from CXR images. For the classification of TB and normal CXR images, the performance of ten different CNN models is evaluated with and without using histogram matching.
i) Without histogram matching the best accuracy, sensitivity, specificity, precision and F1-score in the detection of tuberculosis using CXR images among ten models are 99.25%, 99.48%, 99.52%, 99.48% and 99.22% respectively. With histogram matching the best accuracy, sensitivity, specificity, precision and F1-score are 99.58%, 99.82%, 99.67%, 99.65% and 99.56% respectively.
ii) When it comes to classification of normal and TB infected CXR images, both Resnet50 and Resnet152 are found to outperform other networks trained on CXR images without histogram matching. With histogram matching, both Resnet50 and DenseNet169 outperforms other networks trained on CXR images.
iii) It is also shown that the histogram matching has improved the accuracy and enhanced the detection performance of the deep CNN models including Resnet50, Resnet101, InceptionV3, VGG16, DenseNet121 and DenseNet169. This research indicates that by integrating recent advances in deep learning and applying histogram matching, it is possible to achieve a higher level of performance, which improves the accuracy of deep CNN models.
iv) Histogram matching improves the image’s visual appeal. It can also aid the clinician in the manual detection of tuberculosis. Histogram matching can produce good contrast with absolutely no effort in terms of algorithm inputs or processing time.
This cutting-edge performance has the potential to be a highly reliable and fast diagnostic tool, possibly saving a huge number of people each year who depart as a result of delayed or incorrect diagnosis of TB. More clinical data can be acquired in the future to greatly enhance the accuracy and detection performance. A large-scale TB CXRs database will greatly aid in the development of generalized models that are accurate over a wide range of CXR datasets.
Funding Statement:The authors received no specific funding for this study.
Conflicts of Interest:The authors declare that they have no conflicts of interest to report regarding the present study.
1. E. D. Moya, A. Pietrus and S. M. Oliva, “A mathematical model for the study of effectiveness in therapy in tuberculosis taking into account associated diseases,” Contemporary Mathematics, vol. 2, no. 1, pp. 77–102, 2021. [Google Scholar]
2. G. Nino, J. Zember, R. Sanchez-Jacob, M. J. Gutierrez, K. Sharma et al., “Pediatric lung imaging features of COVID-19: A systematic review and meta-analysis,” Pediatric Pulmonology, vol. 56, no. 1, pp. 252–263, 2021. [Google Scholar]
3. B. A. A. Ubaidi, “The radiological diagnosis of pulmonary tuberculosis (TB) in primary care,” Journal of Family Medicine and Disease Prevention, vol. 4, no. 1, pp. 1–7, 2018. [Google Scholar]
4. M. K. Puttagunta and S. Ravi, “Detection of tuberculosis based on deep learning based methods,” Journal of Physics: Conference Series, vol. 1767, no. 1, pp. 1–10, 2021. [Google Scholar]
5. E. Tasci, C. Uluturk and A. Ugur, “A voting-based ensemble deep learning method focusing on image augmentation and preprocessing variations for tuberculosis detection,” Neural Computing and Applications, vol. 33, no. 22, pp. 15541–15555, 2021. [Google Scholar]
6. R. I. Chang, Y. H. Chiu and J. W. Lin, “Two-stage classification of tuberculosis culture diagnosis using convolutional neural network with transfer learning,” The Journal of Supercomputing, vol. 76, no. 11, pp. 8641–8656, 2020. [Google Scholar]
7. S. Rajaraman, I. Kim and S. K. Antani, “Detection and visualization of abnormality in chest radiographs using modality-specific convolutional neural network ensembles,” PeerJ, vol. 8, pp. e8693, 2020. [Google Scholar]
8. A. M. Tahir, Y. Qiblawey, A. Khandakar, T. Rahman, U. Khurshid et al., “Coronavirus: Comparing COVID-19, SARS and MERS in the eyes of AI,” 2020. [Online]. Available: https://arxiv.org/abs/2005.11524. [Google Scholar]
9. H. Wang and P. Zhang, “The research of mapping laws for image histogram matching,” in Proc. Int. Conf. on Intelligent Systems Research and Mechatronics Engineering (ISRME), Advances in Intelligent Systems Research, Zhengzhou, China, pp. 309–314, 2015. [Google Scholar]
10. L. G. C. Evangelista and E. B. Guedes, “Computer-aided tuberculosis detection from chest x-ray images with convolutional neural networks,” in Anais do XV Encontro Nacional de Inteligência Artificial e Computacional, São Paulo, SP, Brazil, pp. 1–10, 2018. [Google Scholar]
11. O. Yadav, K. Passi and C. K. Jain, “Using deep learning to classify x-ray images of potential tuberculosis patients,” in Proc. IEEE Int. Conf. on Bioinformatics and Biomedicine (BIBM), Madrid, Spain, pp. 2368–2375, 2018. [Google Scholar]
12. A. Hernández, Á. Panizo and D. Camacho, “An ensemble algorithm based on deep learning for tuberculosis classification,” in Proc. Intelligent Data Engineering and Automated Learning–IDEAL 2019, IDEAL 2019, In: H. Yin, D. Camacho, P. Tino, A. Tallón-Ballesteros, R. Menezes, R. Allmendinger (Eds.Vol. 11871, Cham: Lecture Notes in Computer Science, Springer, pp. 145–154, 2019. [Google Scholar]
13. L. M. Goyal, M. Mittal, M. Kumar, B. Kaur, M. Sharma et al., “An efficient method of multicolor detection using global optimum thresholding for image analysis,” Multimedia Tools and Applications, vol. 80, no. 12, pp. 18969–18991, 2021. [Google Scholar]
14. K. Munadi, K. Muchtar, N. Maulina and B. Pradhan, “Image enhancement for tuberculosis detection using deep learning,” IEEE Access, vol. 8, pp. 217897–217907, 2020. [Google Scholar]
15. M. Mittal, M. Arora, T. Pandey and L. M. Goyal, “Image segmentation using deep learning techniques in medical images,” in Advancement of Machine Intelligence in Interactive Medical Image Analysis. Algorithms for Intelligent Systems, In: O. Verma, S. Roy, S. Pandey, M. Mittal (Eds.Singapore: Springer, pp. 41–63, 2019. [Google Scholar]
16. M. A. Al-antari, C.-H. Hua, J. Bang and S. Lee, “Fast deep learning computer-aided diagnosis of COVID-19 based on digital chest x-ray images,” Applied Intelligence, vol. 51, no. 5, pp. 2890–2907, 2021. [Google Scholar]
17. M. F. Hashmi, S. Katiyar, A. G. Keskar, N. D. Bokde and Z. W. Geem, “Efficient pneumonia detection in chest Xray images using deep transfer learning,” Diagnostics, vol. 10, no. 6, pp. 1–23, 2020. [Google Scholar]
18. J. Liu and Y. Huang, “Comparison of different CNN models in tuberculosis detecting,” KSII Transactions on Internet and Information Systems, vol. 14, no. 8, pp. 3519–3533, 2020. [Google Scholar]
19. Y. Yu, H. Lin, J. Meng, X. Wei, H. Guo et al., “Deep transfer learning for modality classification of medical images,” Information-an International Interdisciplinary Journal, vol. 8, no. 3, pp. 1–13, 2017. [Google Scholar]
20. T. Rahman, A. Khandakar, M. A. Kadir, K. R. Islam, K. F. Islam et al., “Reliable tuberculosis detection using chest X-ray with deep learning, segmentation and visualization,” IEEE Access, vol. 8, pp. 191586–191601, 2020. [Google Scholar]
21. S. Albahli, H. T. Rauf, A. Algosaibi and V. E. Balas, “AI-driven deep CNN approach for multi-label pathology classification using chest X-Rays,” PeerJ Computer Science, vol. 7, no. 2, pp. e4951, 2021. [Google Scholar]
22. F. Pasa, V. Golkov, F. Pfeiffer, D. Cremers and D. Pfeiffer, “Efficient deep network architectures for fast chest X-ray tuberculosis screening and visualization,” Scientific Reports, vol. 9, no. 1, pp. 1–9, 2019. [Google Scholar]
23. S. Kikkisetti, J. Zhu, B. Shen, H. Li and T. Q. Duong, “Deep-learning convolutional neural networks with transfer learning accurately classify COVID-19 lung infection on portable chest radiographs,” PeerJ, vol. 8, pp. e10309, 2020. [Google Scholar]
24. A. Becker, C. Blüthgen, V. D. Phi van, C. Sekaggya-Wiltshire, B. Castelnuovo et al., “Detection of tuberculosis patterns in digital photographs of chest X-ray images using deep learning: Feasibility study,” The International Journal of Tuberculosis and Lung Disease, vol. 22, no. 3, pp. 328–335, 2018. [Google Scholar]
25. P. Chhikara, P. Singh, P. Gupta and T. Bhatia, “Deep convolutional neural network with transfer learning for detecting pneumonia on chest X-rays,” in Advances in Bioinformatics, Multimedia, and Electronics Circuits and Signals. Advances in Intelligent Systems and Computing, In: L. Jain, M. Virvou, V. Piuri, V. Balas (Eds.Vol. 1064, Singapore: Springer, pp. 155–168, 2019. [Google Scholar]
26. R. Grag, B. Mittal and S. Grag, “Histogram equalization techniques for image enhancement,” International Journal of Electronics & Communication Technology, vol. 2, no. 1, pp. 107–111, 2011. [Google Scholar]
27. H. I. Ashiba, H. M. Mansour, H. M. Ahmed, M. F. El-Kordy, M. I. Dessouky et al., “Enhancement of Infrared Images Based on Efficient Histogram Processing,” Wireless Personal Communications, vol. 99, no. 2, pp. 619–636, 2018. [Google Scholar]
28. S. Christodoulidis, M. Anthimopoulos, L. Ebner, A. Christe and S. Mougiakakou, “Multisource transfer learning with convolutional neural networks for lung pattern analysis,” IEEE Journal of Biomedical and Health Informatics, vol. 21, no. 1, pp. 76–84, 2017. [Google Scholar]
29. R. Hooda, S. Sofat, S. Kaur, A. Mittal and F. Meriaudeau, “Deep-learning: A potential method for tuberculosis detection using chest radiography,” in Proc. IEEE Int. Conf. on Signal and Image Processing Applications (ICSIPA), Kuching, Malaysia, pp. 497–502, 2017. [Google Scholar]
30. U. K. Lopes and J. F. Valiati, “Pre-trained convolutional neural networks as feature extractors for tuberculosis detection,” Computers in Biology and Medicine, vol. 89, no. 7639, pp. 135–143, 2017. [Google Scholar]
31. R. Rashid, S. G. Khawaja, M. U. Akram and A. M. Khan, “Hybrid RID network for efficient diagnosis of tuberculosis from chest X-rays,” in Proc. 9th Cairo Int. Biomedical Engineering Conf. (CIBEC), Cairo, Egypt, pp. 167–170, 2018. [Google Scholar]
32. M. Ahsan, R. Gomes and A. Denton, “Application of a convolutional neural network using transfer learning for tuberculosis detection,” in Proc. IEEE Int. Conf. on Electro Information Technology (EIT), Brookings, SD, USA, pp. 427–433, 2019. [Google Scholar]
33. M. B. Mizan, M. A. M. Hasan and S. R. Hassan, “A comparative study of tuberculosis detection using deep convolutional neural network,” in Proc. 2nd Int. Conf. on Advanced Information and Communication Technology (ICAICT), Dhaka, Bangladesh, pp. 157–161, 2020. [Google Scholar]
34. K. Cao, J. Zhang, M. Huang and T. Deng, “X-ray classification of tuberculosis based on convolutional networks,” in Proc. IEEE Int. Conf. on Artificial Intelligence and Industrial Design (AIID), Guangzhou, China, pp. 125–129, 2021. [Google Scholar]
 | This work is licensed under a Creative Commons Attribution 4.0 International License, which permits unrestricted use, distribution, and reproduction in any medium, provided the original work is properly cited. |