DOI:10.32604/csse.2023.025230
| Computer Systems Science & Engineering DOI:10.32604/csse.2023.025230 | |
| Article |
Multi-Headed Deep Learning Models to Detect Abnormality of Alzheimer’s Patients
Department of Electrical and Electronics Engineering, Thiagarajar College of Engineering, Madurai, 625 015, Tamil Nadu, India
*Corresponding Author: S. Meenakshi Ammal. Email: meenakshiammal@student.tce.edu
Received: 17 November 2021; Accepted: 05 January 2022
Abstract: Worldwide, many elders are suffering from Alzheimer’s disease (AD). The elders with AD exhibit various abnormalities in their activities, such as sleep disturbances, wandering aimlessly, forgetting activities, etc., which are the strong signs and symptoms of AD progression. Recognizing these symptoms in advance could assist to a quicker diagnosis and treatment and to prevent the progression of Disease to the next stage. The proposed method aims to detect the behavioral abnormalities found in Daily activities of AD patients (ADP) using wearables. In the proposed work, a publicly available dataset collected using wearables is applied. Currently, no real-world data is available to illustrate the daily activities of ADP. Hence, the proposed method has synthesized the wearables data according to the abnormal activities of ADP. In the proposed work, multi-headed (MH) architectures such as MH Convolutional Neural Network-Long Short-Term Memory Network (CNN-LSTM), MH one-dimensional Convolutional Neural Network (1D-CNN) and MH two dimensional Convolutional Neural Network (2D-CNN) as well as conventional methods, namely CNN-LSTM, 1D-CNN, 2D-CNN have been implemented to model activity pattern. A multi-label prediction technique is applied to detect abnormal activities. The results obtained show that the proposed MH architectures achieve improved performance than the conventional methods. Moreover, the MH models for activity recognition perform better than the abnormality detection.
Keywords: Alzheimer’s disease; abnormal activity detection; classifier chain; multi-headed CNN-LSTM; wearable sensor
As per the report from World Health Organization (WHO), the elder’s population is increasing faster and it will reach nearly 1.4 billion in 2030 and will increase nearly 2.1 billion in 2050. Globally, 50 million elders are affected by dementia. The population of dementia is estimated to increase 82 million in 2030 and will reach nearly 152 million in 2050. The report from the Alzheimer’s Association states that $7.9 trillion of medical costs could be saved if the AD is diagnosed in Mild Cognitive Impairment (MCI) stage.
AD is a mental illness which deteriorates the cognitive skills such as thinking, reasoning and remembering and makes problems in mobility and creates trouble in performing physical tasks. AD makes difficulties to carry out the basic activities in daily life and to complete the familiar tasks. Hence, the ADP depends completely on others to carry out their basic needs in regular life from their loved ones.
The AD typically progresses into three stages such as mild, moderate and severe stage. A report states that mostly 75% of ADP goes unnoticed in the beginning level and so the patients are diagnosed in the moderate or severe level which is the irreversible stage [1]. The progression of AD could be identified using the behavioral changes in daily activities such as sleeping, eating, walking, etc. The abnormal activities are forgetting to eat, taking food multiple times, having long naps in daytime, etc. These are the vital signs and symptoms to evaluate the AD stage and its progression [1]. Hence, there is a strong requirement for constant monitoring of daily activities of ADP in their living location instead of high-cost clinical environment. Recently, the remote activity monitoring systems designed using non-invasive based wearable sensors, information technologies and advanced broadcasting techniques provide efficient, reliable and low-cost promising solutions to assess the behavioral changes in daily activities of ADP [2]. To diagnose the AD in early stage using non-clinical methods is the strong requirement of the medical domain. Although few methods have been proposed experimentally [3–11], they need more real time validation, reliable results and appropriate domain knowledge. Currently, no single medical test is available to determine whether the patient has AD or not and to evaluate the disease progression. Hence, the primary goal of the proposed method is to detect the cognitive decline in advance using deviation found in daily activities of the ADP. Moreover, the continuous monitoring of daily activities of patients in real time using non-invasive wearable sensors will preserve the privacy of ADP and will be cost effective.
Nowadays, deep learning algorithms are applied to detect the activities performed in regular life. These models could extract the most relevant attributes automatically to train the model. Mostly, CNN applies filters and is used to extract local dependency and to detect the patterns in the input. Recurrent Neural Network (RNN) uses activation function to process temporal information.
Although different sensors are used to detect the human activities, wearable inertial sensors provide valuable information than others. Unfortunately, no dataset is available in real time to illustrate the abnormal behavior of ADP using wearables. Moreover, generating that type of data in real time will take long duration and need an experimental environment. Hence, for the proposed work, data simulation is the optimal solution for detecting the behavioral abnormalities of ADP. In this work, synthetic data is created for abnormal activities using the available dataset.
The proposed method provides the following contribution,
1. The proposed work is an innovation method to execute MH CNN-LSTM architectures for detecting abnormal behavior of ADP using wearable sensor data
2. This is a novel work to use multi-label prediction technique called classifier chain for abnormality detection
3. This is a novel work to synthesize the wearable sensor data to generate behavioral abnormalities in daily activities of ADP
The proposed work is prepared as follows. An overview of the previous experiments in detection of human activity and identifying abnormal activity of ADP are described in Section 2. Section 3 discusses the datasets used in this work and the proposed method. The implementation details are given in Section 4 and the obtained outcomes are illustrated in Section 5. Finally, the conclusion for the proposed work is given in Section 6.
Recently, for human activity recognition (HAR), various researches have been carried out using different sensing methods, machine leaning and deep learning algorithms. The different types of deep learning algorithms such as Restricted Boltzmann machine (RBM), Deep Belief Network (DBN), CNN, LSTM-CNN and RNN-LSTM model have been applied to find out human activities using different types of sensors. The smart home dataset is used for modelling human activity using RBM [3]. The inertial sensors present in the smart phone are used to collect the data according to the human activities and DBN is used to train the model to recognize twelve different activities [4].
CNN is applied to extract discriminative features automatically and it captures the same attributes of a time series data [5]. The Convolutional layers combined with LSTM are applied to extract features automatically for recognizing human activity [6]. A combination of inception neural network with RNN is applied to extract multi-dimensional features using different kernel-based convolution layers to classify the human activities [7]. A shallow structure of RNN-LSTM is developed to run on edge device like Raspberry Pi3 [8]. The convolutional RNN is built for human activity detection using two publicly available datasets such as Opportunity and Skoda [9]. The abnormalities found in human activities are detected using various techniques such as Markov Logic Network (MLN), Hidden Markov Model (HMM) and machine learning techniques. A Fine-grained Abnormal Behavior Recognition (FABER) hybrid technique using Markov Logic Network is designed for recognizing abnormalities of MCI patients in smart-home environment [10]. Video sensor-based method is designed to detect abnormal activities of elders and uses kernel discriminant analysis (KDA) to classify different activities and HMM for training the model [11].
The ambient assisted living environment is used to detect the anomalous situations using profiling strategy [12]. Video based anomalous activity recognition system has used adaptive video compression technique to reduce the processing time of the lengthy videos [13]. Infrared motion sensors are used for abnormal behavior detection using motion signals [14]. An HMM combined with statistical method is used to detect the abnormal and irregular activities from the daily activity sequence in the ambient assisted living (AAL) environment [15]. The abnormality is detected using non-intrusive sensors in the smart home environment [16]. Agglomerative clustering is applied to expose the data clusters and the model transitions are executed by Markov chain and Random Forest is used for detecting human behavior patterns. Abnormal activities of dementia patients are detected using MLN in a smart home environment [17]. The AD of the persons is detected using their foot movements [18]. A wearable device is designed to store the gait data while walking [19]. The ceiling-mounted Pyroelectric Infrared (PIR) sensors are fixed to find out the abnormalities using spatial-temporal characteristics [20].
The anomalous activity recognition is evaluated using three variants of RNNs such as LSTM, Vanilla, and Gated Recurrent Unit using smart home datasets [21]. The CNN is used to detect the daily activities and the abnormality of dementia patients [22]. The transfer learning of Recursive Auto-Encoders (RAE) is used to train the model of normal activities of healthy person. The trained model is used to detect the abnormality of patient using synthesis dataset [23]. Prediction of chronic disease has been implemented using multi-label classification problem [24]. The risk of chronic disease is predicted using mutually inclusive medical records [25]. The application has implemented DNN model to apply multi-label techniques such as problem transformation and adaption type algorithms [25]. Detection of multi resident’s activities is carried out in smart home environment using multi-label classification framework [26]. The next section describes the proposed methodology and the signs and symptoms of AD and also explains the dataset preparation and the MH architectures used.
The following steps are carried out to implement the process: Initially, a publicly available wearable data set named Wireless Sensor Data Mining (WISDM) [27] is prepared according to the normal activity sequence and is synthesized due to the abnormal behavior of ADP. Then, the prepared dataset is pre-processed and segmented using sliding window technique into short time slices. Finally, MH architectures such as MH-CNN-LSTM, MH-1D-CNN and MH-2D-CNN are modelled to identify the activities of daily living and to find out the anomalous behavior. The following section describes the common signs and symptoms of ADP and the synthesis dataset creation.
In this section, the important signs and symptoms of AD found in daily activities of patients are described. Though the symptoms are different from person to person, some symptoms are recognized in most of the patients and are shown in the Tab. 1.

The advancements in sensor technology, Micro Electro Mechanical Systems (MEMS) and communication methods provide facilities to track the activities of daily living from remote location and give accurate and reliable information to evaluate the activities of patients. The inertial sensors such as magnetometer, tri-axis accelerometer and gyroscope embedded in wearables are used to track the patient’s ambulatory activities and body postures. The accelerometer measures the body motion acceleration in x, y, z axis directions. The gyroscope calculates the orientation and angular velocity. The magnetometer estimates the orientation of the body segment.
The proposed method uses a publicly available dataset WISDM [27] which is available in the machine learning repository and its details are given in Tab. 2. The dataset is generated using wearables which are embedded with inertial sensors. Although different sensors are used to detect the human activities, wearable inertial sensors provide valuable information than others. The WISDM dataset is collected at 20 Hz polling rate using accelerometer and gyroscope sensors which are embedded in smartphone and smartwatch.

3.4 Data Synthesis Due to the Abnormal Activities of ADP
Many research works have been implemented for activity recognition using wearables data. The proposed work aims to detect the abnormal activity of the ADP using wearables. So, the basic activities which are usually performed in the daily life are used to form the activity sequence and to detect the abnormality. The remaining unusual activities found in the dataset like folding, typing are not used to form the normal activity sequence. The sensor data is collected at a rate of 20 Hz. The data is generated every 50 milliseconds by the accelerometer. This translates to a sampling rate of 20 samples per second. A normal activity conducted by an elder is estimated to take between 20 and 30 min. As a result, for a specific time period, around 24,000 to 36,000 samples are seen for an activity. The abnormal activities listed in Tab. 1 are identified by collecting a larger number of samples for each activity over a longer period of time. 72,000 samples of brushing, for example, show abnormal activity of repeating. For the research purpose, a sequence of activities is assumed as usually they are done in a particular order and in a particular period. For example, the normal activity sequence (NAS) is formed using a set of activities which are performed at a particular duration in a day as follows,
• Using the WISDM dataset, the NAS is created as “Brushing Teeth-> Drinking from Cup-> Sitting-> Eating Sandwich-> Walking”
The sequence of normal activities is represented using data samples obtained from inertial sensors. For example, a NAS is represented using number of activities and each activity contains the number of data samples as follows,
where, each Bi is a data sample of brushing teeth activity and each Ei is a data sample of eating. Each Di is a data sample of drinking water and each Wi is a data sample of walking activity and each Si is a data sample of sitting. The consecutive data samples of an activity represent the occurrence of one instance of an activity. Some activities have only one instance in the normal daily living and others may have two or three instances. For example, eating has two or three instances in the daily life. Bathing has maximum of two instances. Some activities are mandatory to do in the daily life. For example, eating and drinking are mandatory activities especially for elders. In the proposed method, the data is synthesized according to each abnormal activity and each type of abnormality is generated according to the signs and symptoms given in the Tab. 1. For example, the patient may brush the teeth repeatedly because of memory decline. This abnormality is injected in the activity sequence as follows,
where, brushing teeth Bi is observed more than once. The AAS is generated as given in the Tab. 3.

The raw data collected from the inertial sensors are synthesized and then they are pre-processed to obtain better results. They are reshaped with a proper dimension according to the proposed architecture. The pre-processing techniques applied in this work are given as follows,
Linear Interpolation: The datasets used in this work have been collected using inertial sensors in real time. The wearables fixed in the volunteers have sent the data via wireless communication. Hence, there is a possibility for data-loss during communication. In the datasets, the missing data is represented using Not a Number (NaN) (or) ‘0’. The proposed method uses linear interpolation technique to impute the missing data.
Data Standardization (Centre Scaling): The distribution of values is rescaled using center scaling method. In which, the mean of the observed data will be ‘0’ and the standard deviation will be ‘1’. As the data from wearables have the values in different scales, the proposed work uses the center scaling method. Here, the observed values are fit for a Gaussian distribution with a proper mean and standard deviation (SD).
A sensor sample is standardized as follows,
where mean is estimated as,
And the standard deviation is estimated as,
Data Segmentation: In the dataset, the sensor data have been collected and recorded continuously. The models get the input as a short time series data sequence. The temporal relationship between the data samples is preserved by segmenting the data using sliding window approach. Fig. 1 illustrates the data segmentation method. The segmented data using sliding window approach have ‘N’ matrixes which have size of “T × I”, where, ‘T’ is the length of time-slices and ‘I’ is the input instances.

Figure 1: Data segmentation
3.6 Detection of ADP’s Abnormal Activities
A sequence of activities in elder’s daily life provides vital information to recognize their normal activities. The details of daily activity patterns are the important cues to detect the abnormal activities. Using inertial sensors, human activities can be recognized based on the traces of their movement while activities are performed. In the proposed work, first, the processed sensor data are fed as input to the LSTM models to recognize the ADP’s activities in their regular life. Then, the activities are detected whether it is normal or abnormal using LSTM models based on the signs and symptoms given in Tab. 1. The abnormality is detected using a multi-label prediction method called classifier chains. The overall workflow of the proposed work is illustrated in Fig. 2.

Figure 2: Detection of ADP's abnormal activities
The following describes the different MH-CNN architectures used in the proposed work.
MH CNN LSTM: CNN is very effective in extracting and learning features automatically from time-series data. The proposed method uses three CNN models along with the LSTM backend. In the first step, three CNN models are connected in parallel and each model receives the input sequences individually for processing. The outputs from three models are merged and then provided as an input to the LSTM model for the prediction.
MH 1D CNN: In the proposed work, three 1D-CNN models are connected in parallel and each model reads the input sequence independently. The outputs from the three models are concatenated and then given as an input to the output layer for prediction.
MH 2D CNN: In the proposed method, three 2D-CNN models are connected in parallel and each model reads the input sequence independently. The outputs from the three models are merged and then provided as an input to the output layer for prediction.
A normal activity sequence is generated using the dataset WISDM like “Brushing Teeth-> Drinking from Cup-> Sitting-> Eating Sandwich-> Walking”. Five activities are used from WISDM dataset. Each activity is represented using three input features such as x, y, z. which are acquired from three axis of an inertial sensor. The model will generate the activity labels as the output. To train the model, the pre-processed training instances and their corresponding labels are fed into multi-label architectures as well as conventional methods. The performance of the activity recognition model is the key input for the abnormality detection.
3.9 Abnormality Detection Using Classifier Chain
The multi-label classification technique is applied to detect the abnormal activities. In the proposed method, problem transformation method is used in which multi-label classification is converted into a single label classification. A problem transformation method called classifier chain is used in the proposed work. The input for the abnormality detection is generated using the input attributes of the activity recognition along with the activity label. Hence, the output of the activity recognition is added as an input instance for the implementation. Then the input space for the abnormality detection is received as (x, y, z, label) where ‘x, y, z’ are the actual input features obtained from the inertial sensor and also they are the input space for the first classifier such as activity recognition. ‘Label’ represents the activity label which is the outcome of the first classifier. For the second classifier such as abnormality detection, the ‘Label’ is added as an input feature along with (x, y, z). For the activity recognition, each input has three instances. For the abnormality detection, each input has four instances. The process of classifier chain is illustrated in Fig. 3. The main advantage of the classifier chain is to preserve the correlation between the output labels of the different classifiers. For the abnormality detection, the synthesis datasets are generated as per in the Tab. 3. The abnormality detection is implemented using MH and conventional models. The outcome of the models is to detect the activity whether it is normal or abnormal.

Figure 3: Workflow of classifier chain
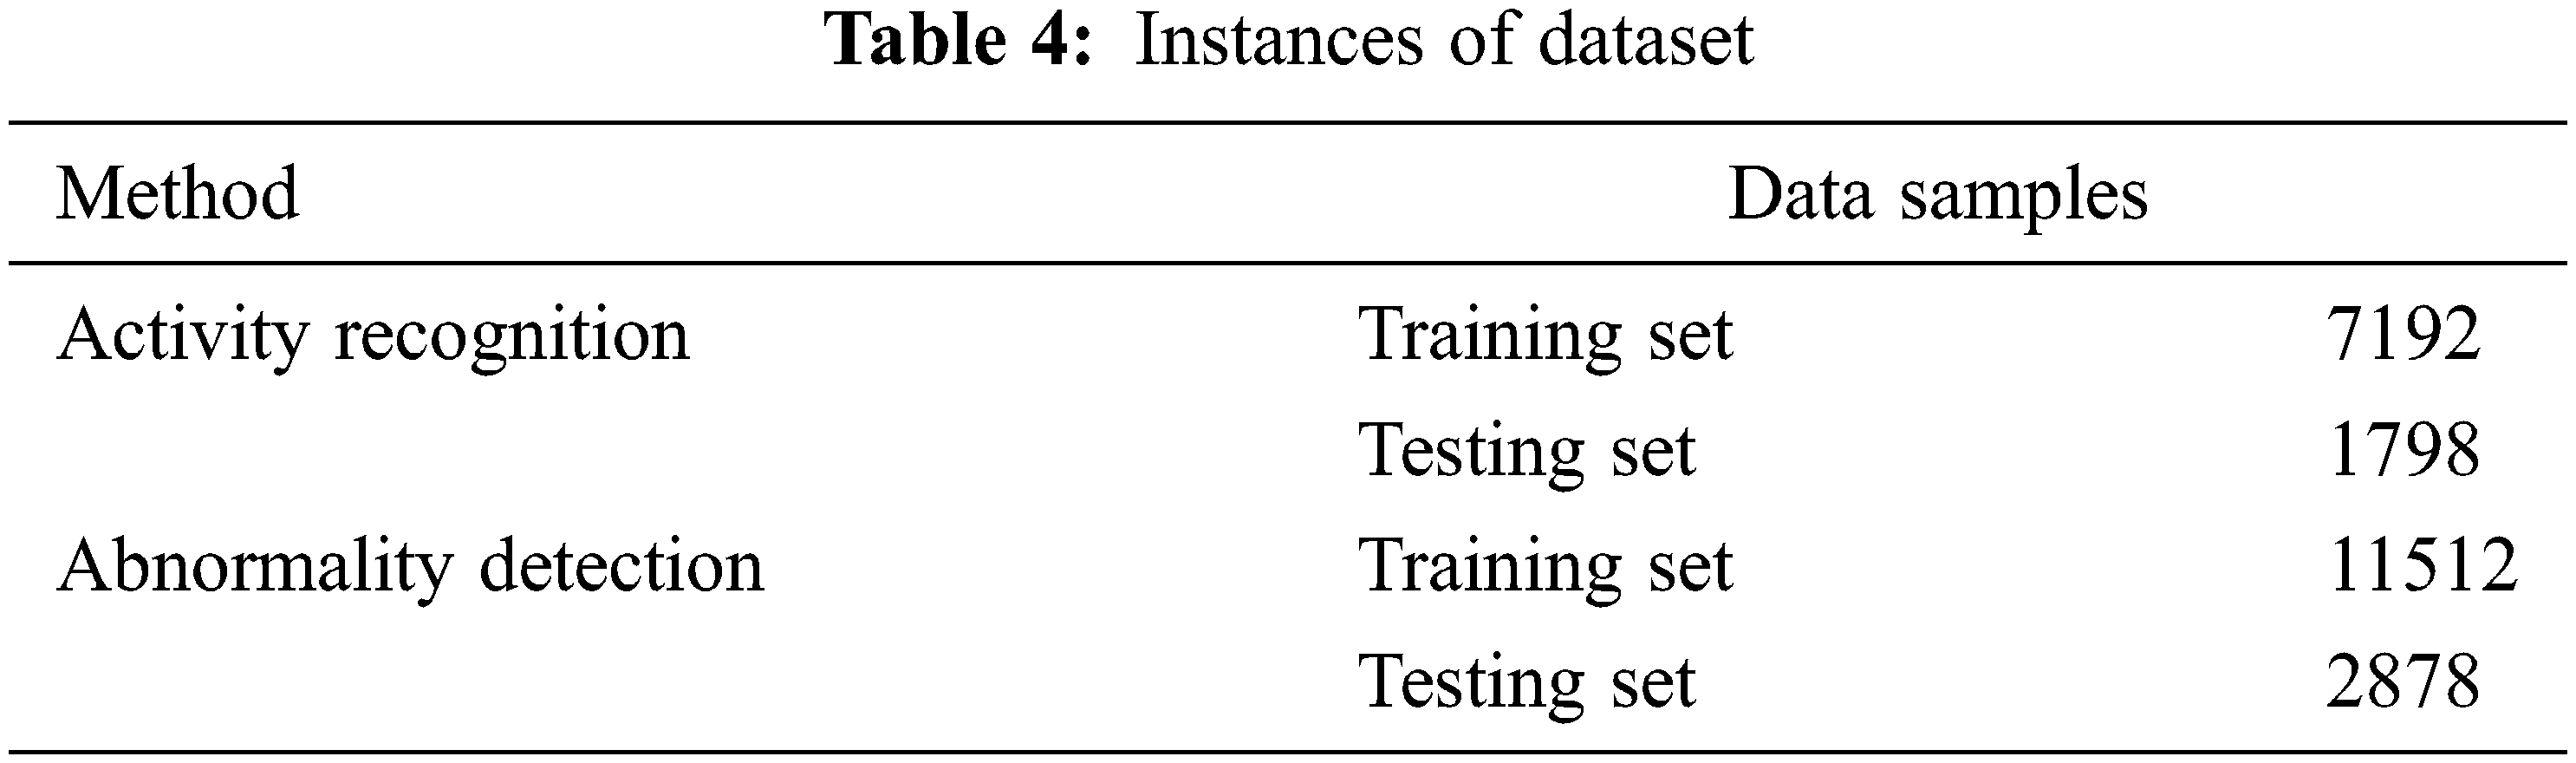
In the proposed method, Keras deep learning libraries are used for implementation of MH architectures such as MH-CNN-LSTM, MH-1D-CNN and MH-2D-CNN. The public dataset WISDM is used to generate the synthesis datasets according to the normal activity sequence and the abnormal activity sequence. From the WISDM dataset, five activities are used. The dataset is split as training and testing data sets and are shown in the Tab. 4. First, the activity recognition based on multi class classification is evaluated using MH models. The performance of the activity recognition model is the key input for the abnormality detection. Then, a multi-label classification method called classifier chains is applied for the abnormality detection. In this method, the MH models for abnormality detection are trained on the dataset which are generated using both input data and the previous classifier output such as activity recognition label.
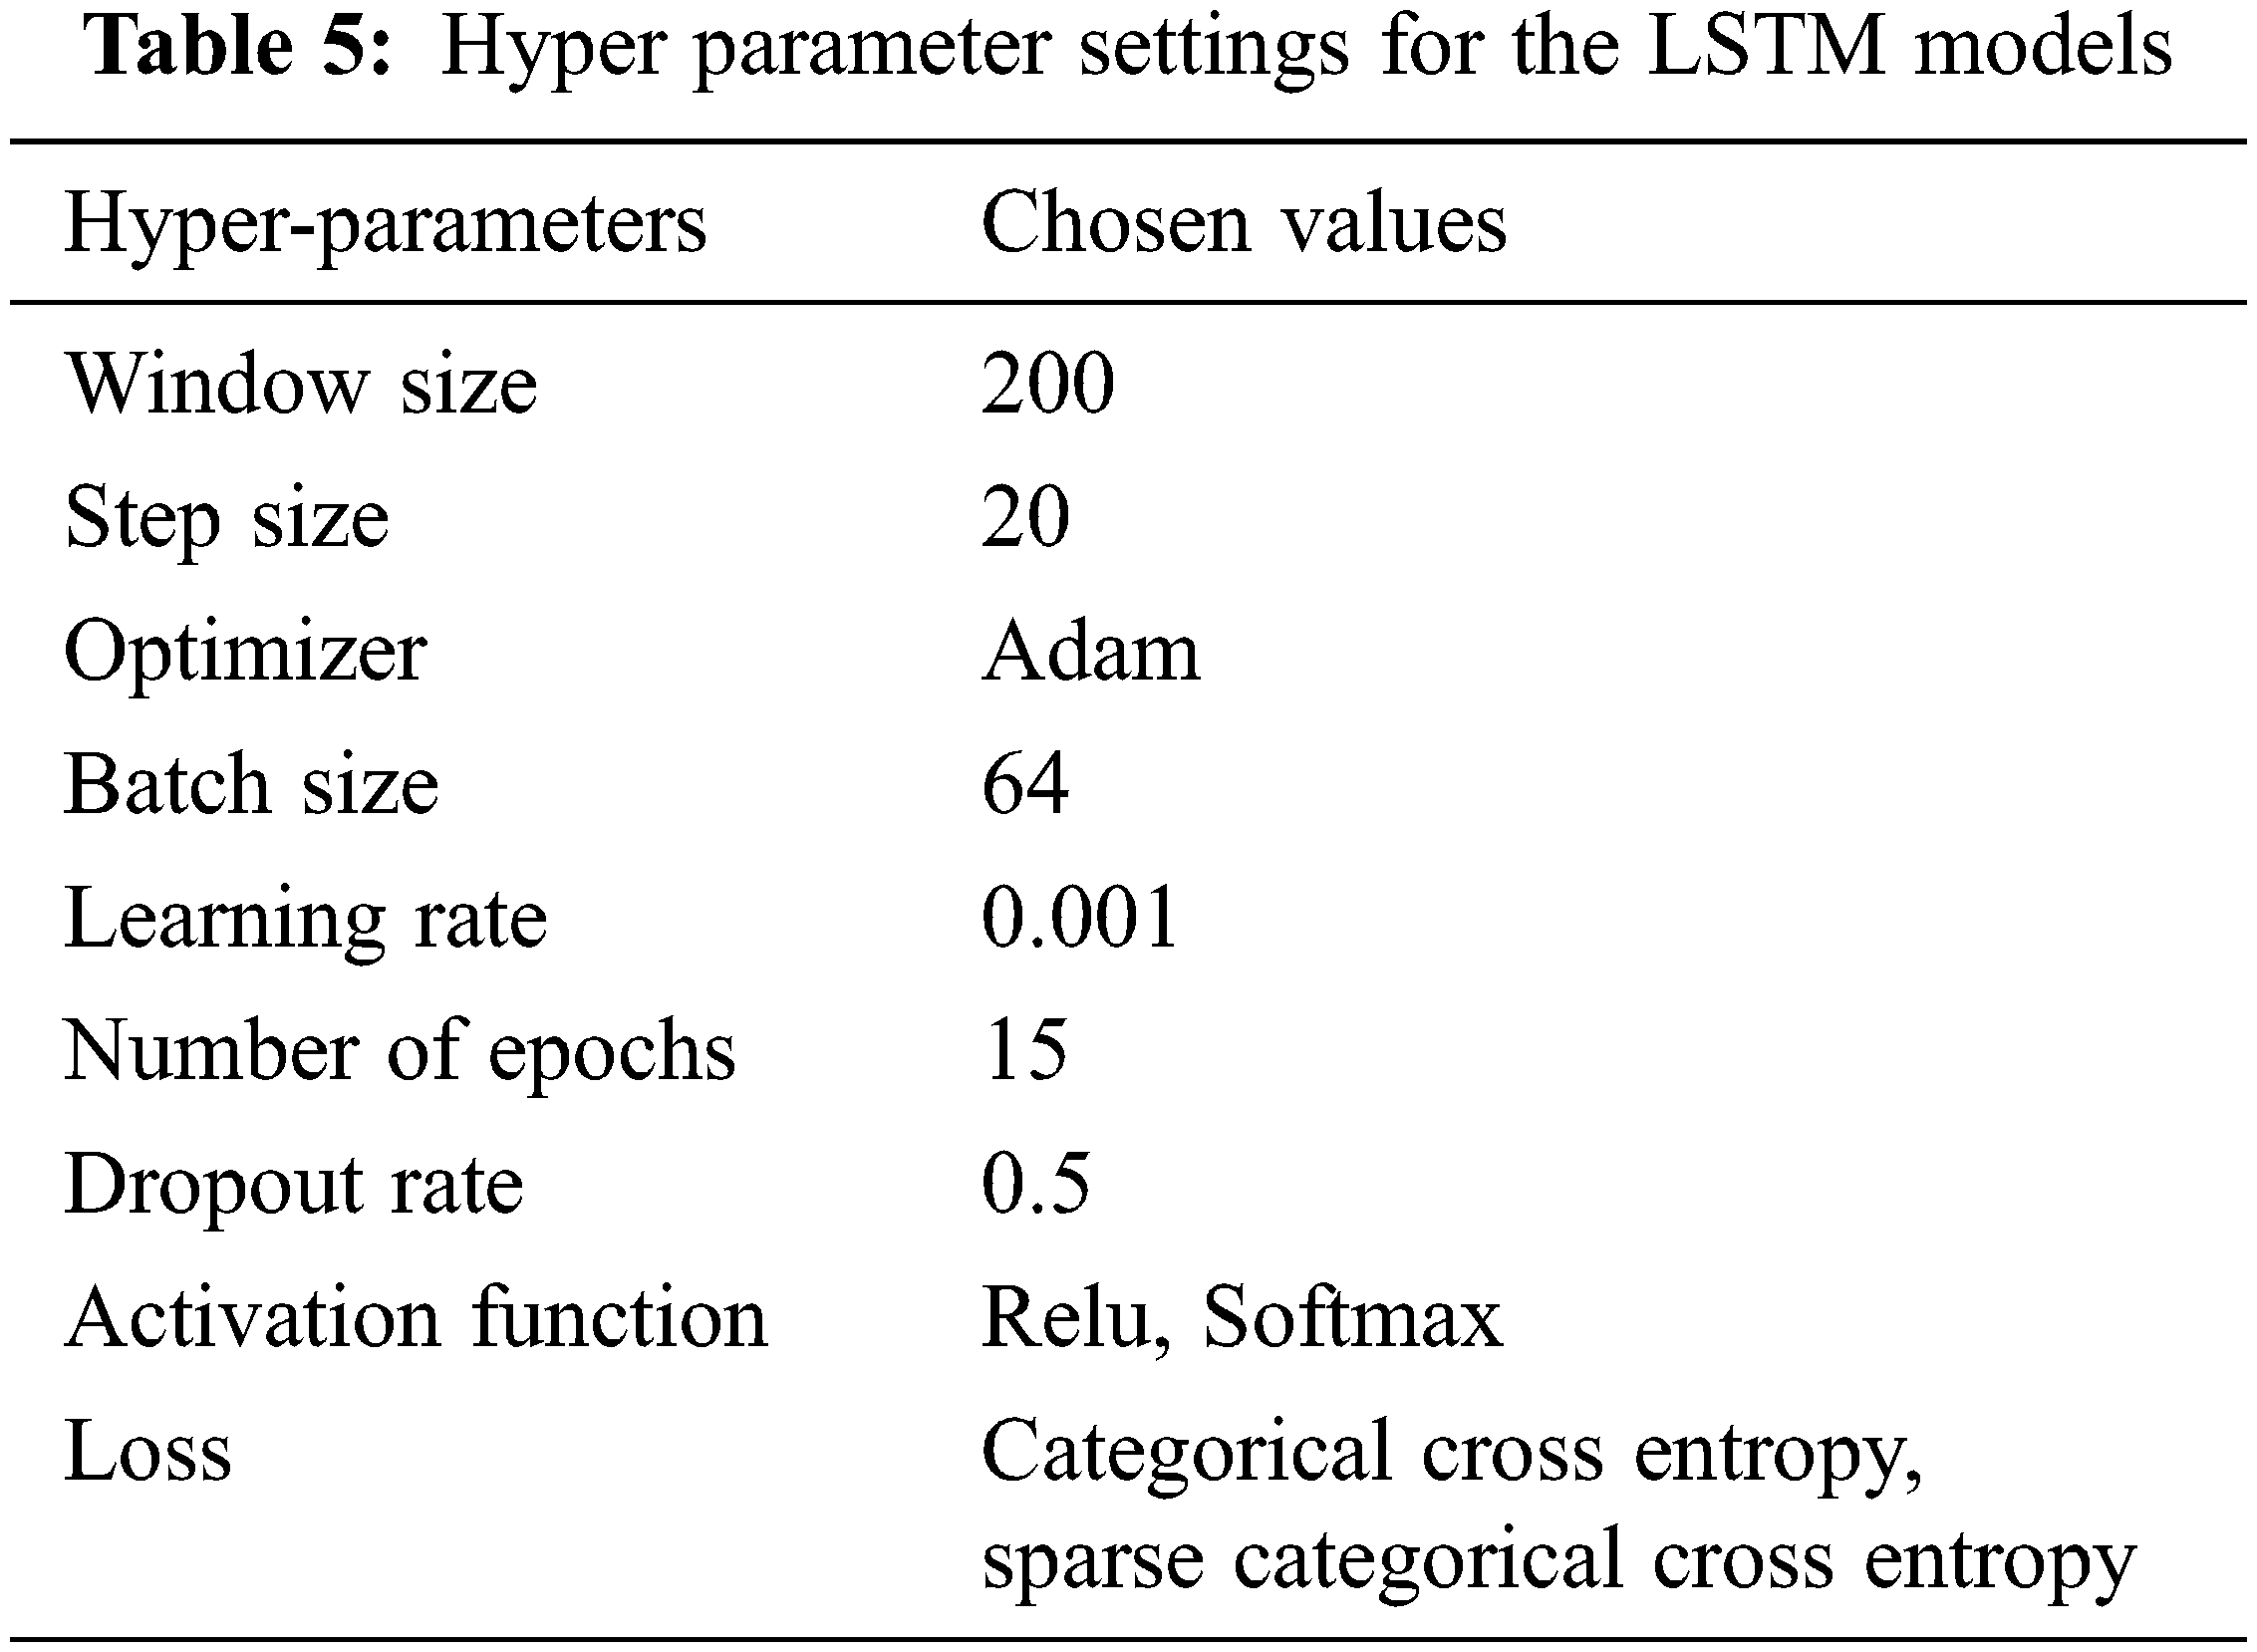
In the proposed work, Keras is used to build the MH architectures. Keras is an efficient API for deep neural network architectures and provides an interface to access Tensor Flow platform. The proposed work is implemented using Google collab which is a free cloud service to access free GPUs and TPUs to run deep neural network. The MH models are implemented as supervised model. This work uses cross entropy loss function which calculates the error between the predicted and the true labels. A gradient based algorithm called Adam is applied for optimization and enables to find out individual learning rate according to the parameter. In this work, the sliding window method is used to segment the sensor readings. The window size is 200 and the step size is 20. The hyper parameters used in the proposed work are given in Tab. 5.
Here, micro-averaging and macro-averaging methods are applied to estimate the performance of the LSTM models for activity detection and abnormality detection using scoring metrics such as precision, recall and f1-score. The macro averaging scores compute the arithmetic mean of score of individual class using recall, precision and f1-score. The micro averaging scores are calculated by considering true positives (TPs), true negatives (TNs), false positives (FPs) and false negatives (FNs) of individual classes.
Micro-average precision is estimated as addition of all true positives of all classes divided by addition of all true positive and false positive of all classes as shown in Eq. (4). Micro-average recall is estimated as addition of all true positives of all the classes divided by addition of all actual positive classes as shown in Eq. (5).
Macro-average precision is calculated as the arithmetic mean of all precision scores of different classes as seen in Eq. (7). Macro average recall is estimated as the arithmetic mean of all the recall scores of different classes as given in Eq. (8).
Accuracy is calculated as sum of all the correct prediction divided by the number of total predictions as follows,
The micro-averaging score is used to weight each prediction equally. The macro averaging score is used to consider all classes equally with respect to most frequent class labels and gives better results for imbalanced classes. Accuracy is a useful metric for balanced datasets. As F1-score is calculated by considering the false positives and false negatives, it is taken as a useful metric for imbalanced datasets.
In this work, two types of implementations are carried out: 1) Recognition of ADP’s activities and 2) Detection of ADP’s anomalous activities. For activity recognition, the model summary obtained using MH CNN-LSTM architecture is shown in Fig. 4.

Figure 4: Model summary of MH-CNN-LSTM for HAR
The confusion matrices acquired for activity recognition using conventional methods are shown in Figs. 5–7. The activities are labelled using numbers from 0 to 4 to represent brushing teeth, drinking from Cup, sitting, eating sandwich and walking.

Figure 5: 1D-CNN

Figure 6: 2D-CNN

Figure 7: CNN-LSTM
The confusion matrices obtained using MH models for HAR are shown in Figs. 8–10.

Figure 8: MH-1D-CNN

Figure 9: MH-2D-CNN

Figure 10: MH-CNN-LSTM
The model performance of CNN-LSTM and MH-CNN-LSTM is plotted in terms of loss and accuracy on the training and validation datasets over training epochs as follows: and Fig. 11 for CNN-LSTM and Fig. 12 for MH-CNN-LSTM.

Figure 11: CNN-LSTM model performance

Figure 12: MH-CNN-LSTM model performance
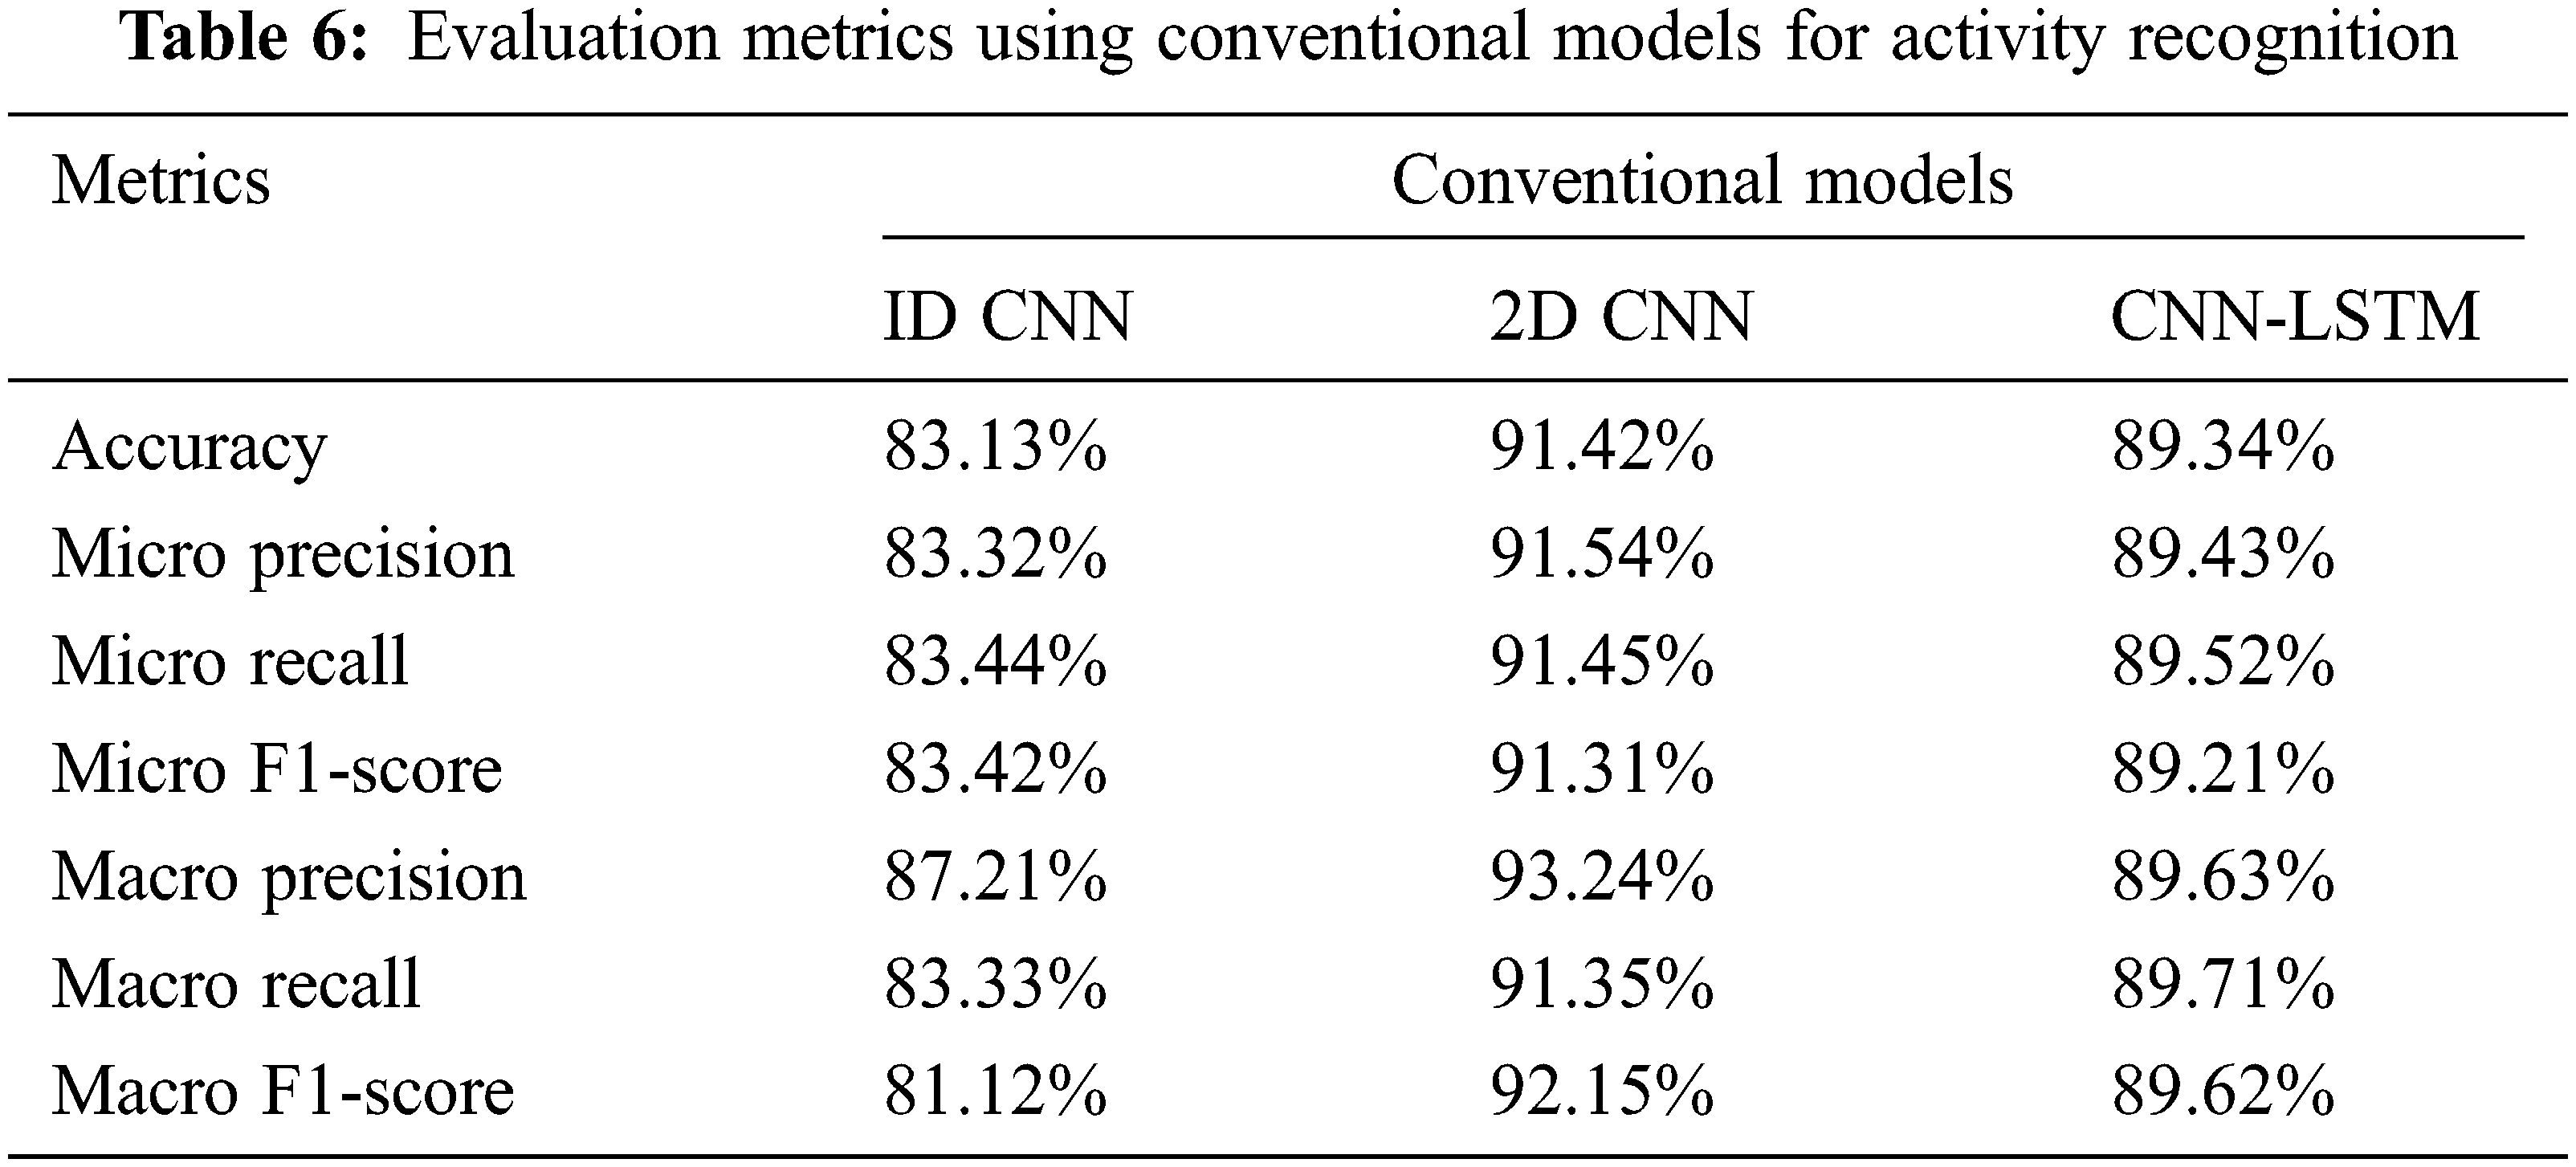
Tab. 6 shows the evaluation metrics obtained using conventional models on WISDM dataset for activity recognition. From Tab. 6, considering the accuracy, 2D-CNN attains high accuracy of 91.42%. Then, CNN-LSTM gives better accuracy of 89.34%. 1D CNN provides the accuracy of 83.23%. F1-score is an important metric to estimate the robustness of the proposed model. It takes both ‘recall’ and ‘precision’ to measure the robustness of the model. 2D-CNN attains 91.31% of Micro and 92.15% of Macro F1-score which are higher than F1-score of 1D-CNN and CNN-LSTM. Overall, in conventional methods, 2D-CNN performs well than other models.
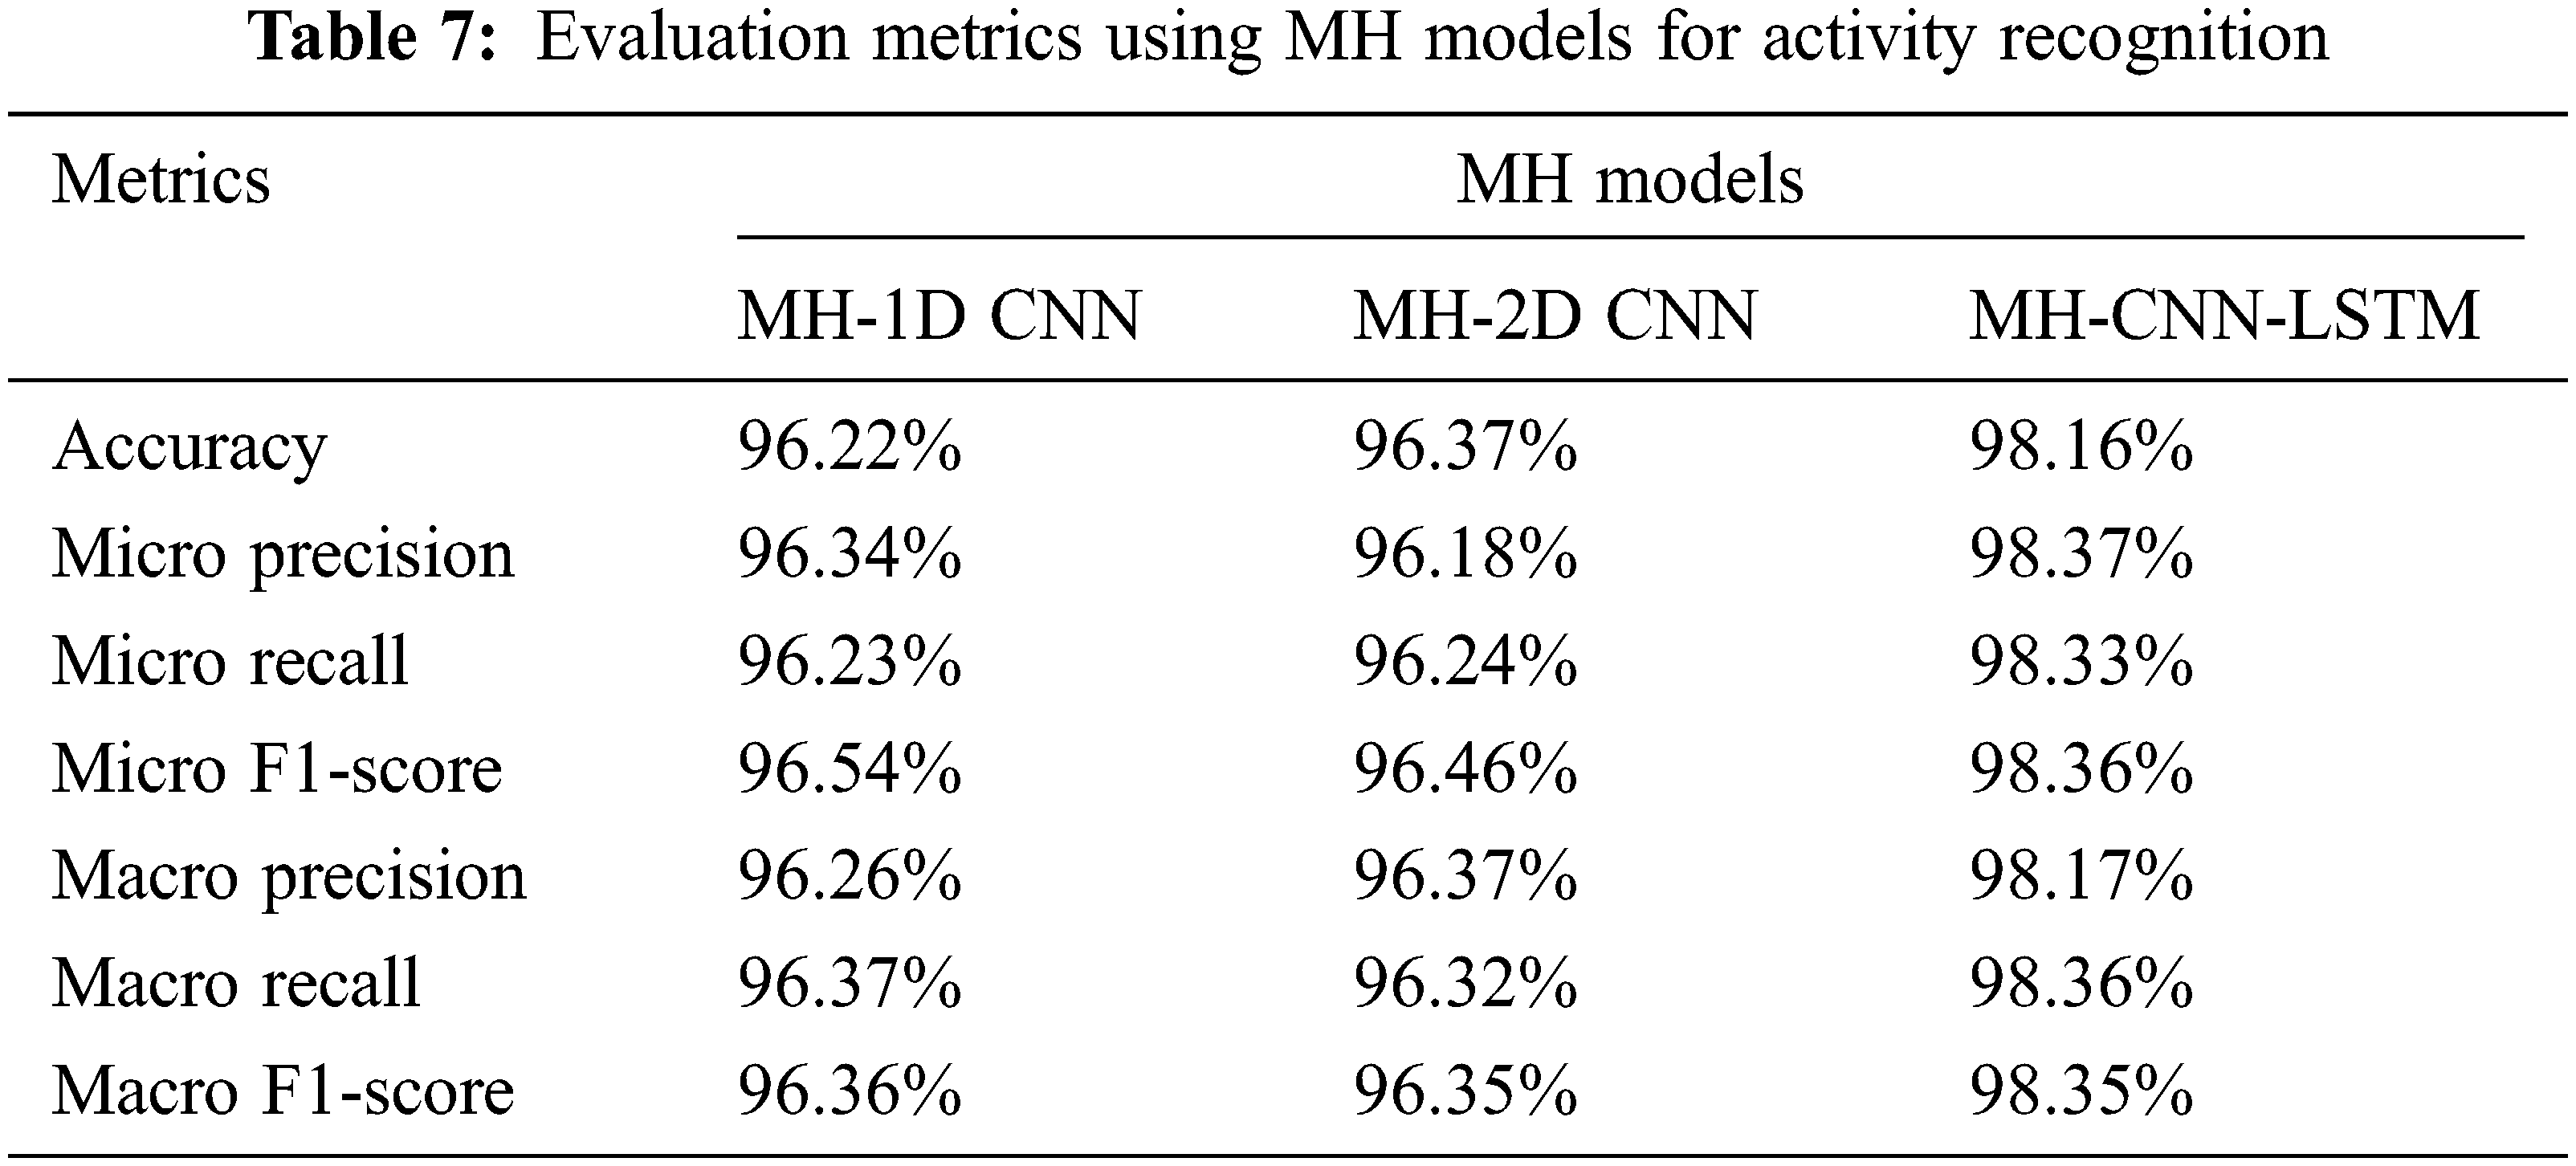
Tab. 7 shows the evaluation metrics obtained using MH models on WISDM dataset for activity recognition. From Tab. 7, considering the accuracy, the MH-CNN-LSTM attains high accuracy of 98.16%. Then, MH-1D-CNN and MH-2D-CNN achieve better accuracy of around 96%. MH-CNN-LSTM achieves 98% of Micro and Macro F1-score than others. In the MH models, MH-CNN-LSTM provides better results than the MH-1D-CNN and MH-2D-CNN.
Figs. 13 and 14 show the comparison of accuracy and F1-score between the conventional models and MH models. When comparing the models, the MH-models perform better than the conventional models for activity recognition.

Figure 13: Accuracy for HAR

Figure 14: F1-score for HAR
The suggested method employs three-headed architectures that employ 1D-CNN, 2D-CNN, and CNN-LSTM to enable the model to read and understand sequence data at three distinct resolutions. Before making a forecast, the interpretations from all three heads are concatenated within the model and interpreted by a fully-connected layer. As a result, the suggested method outperforms traditional methods in activity recognition.
The abnormal activity detection is implemented using classifier chain method. In which, the model gets the input along with the activity recognition label. The output of the first classifier model will be added in the input space of the second classifier. For abnormality detection, the data instances are modified according to the signs and symptoms given in Tab. 1. The synthesized dataset for the second classifier have the imbalanced instances. It is generated according to the abnormality found in ADP’s daily life. For imbalanced instances, macro averaging scores provide better results than micro averaging scores. The model summary obtained for abnormal activity detection using WISDM dataset are shown as follows, Fig. 15 for CNN-LSTM and Fig. 16 for MH-CNN-LSTM.

Figure 15: Model summary of CNN-LSTM for AAR

Figure 16: Model summary of MH-CNN-LSTM for AAR
The confusion matrices acquired for AAR using conventional methods are shown in Figs. 17–19. The normal and abnormal activities are represented using 0 and 1.
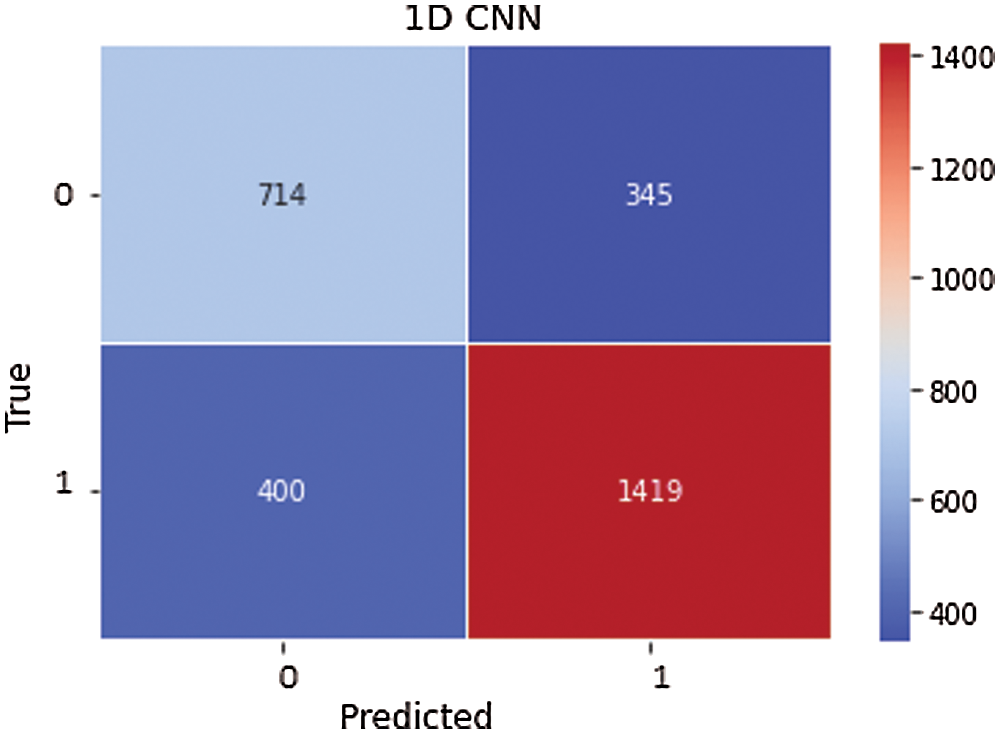
Figure 17: 1D-CNN
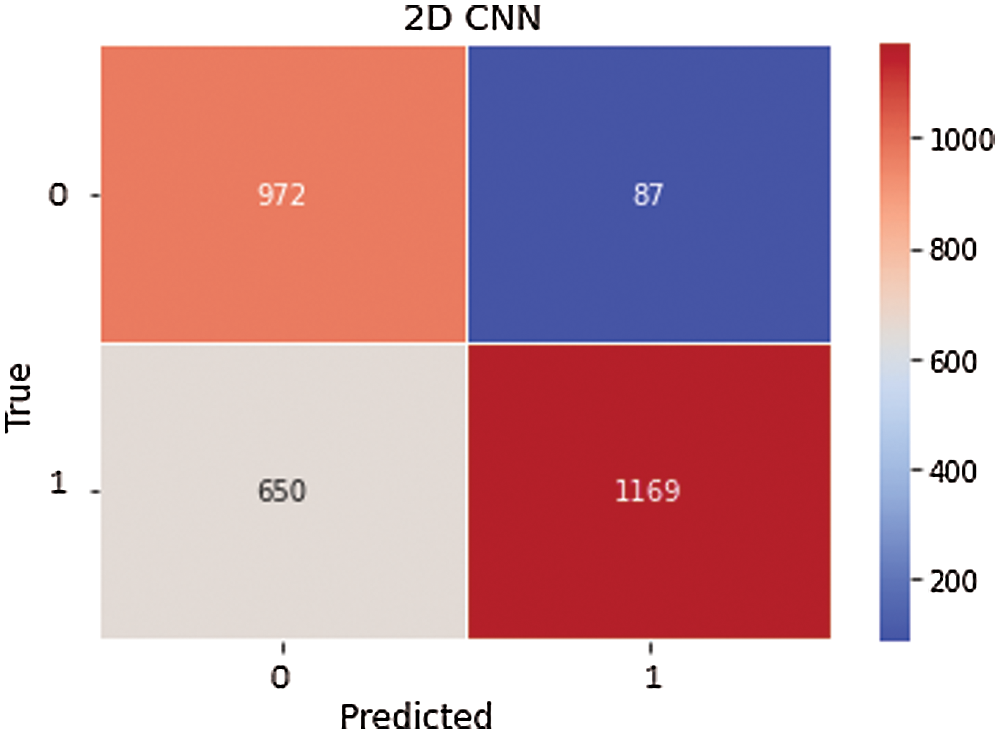
Figure 18: 2D-CNN

Figure 19: CNN-LSTM
The confusion matrices obtained using MH models for AAR are shown in Figs. 20–22.

Figure 20: MH-1D-CNN

Figure 21: MH-2D-CNN

Figure 22: MH-CNN-LSTM
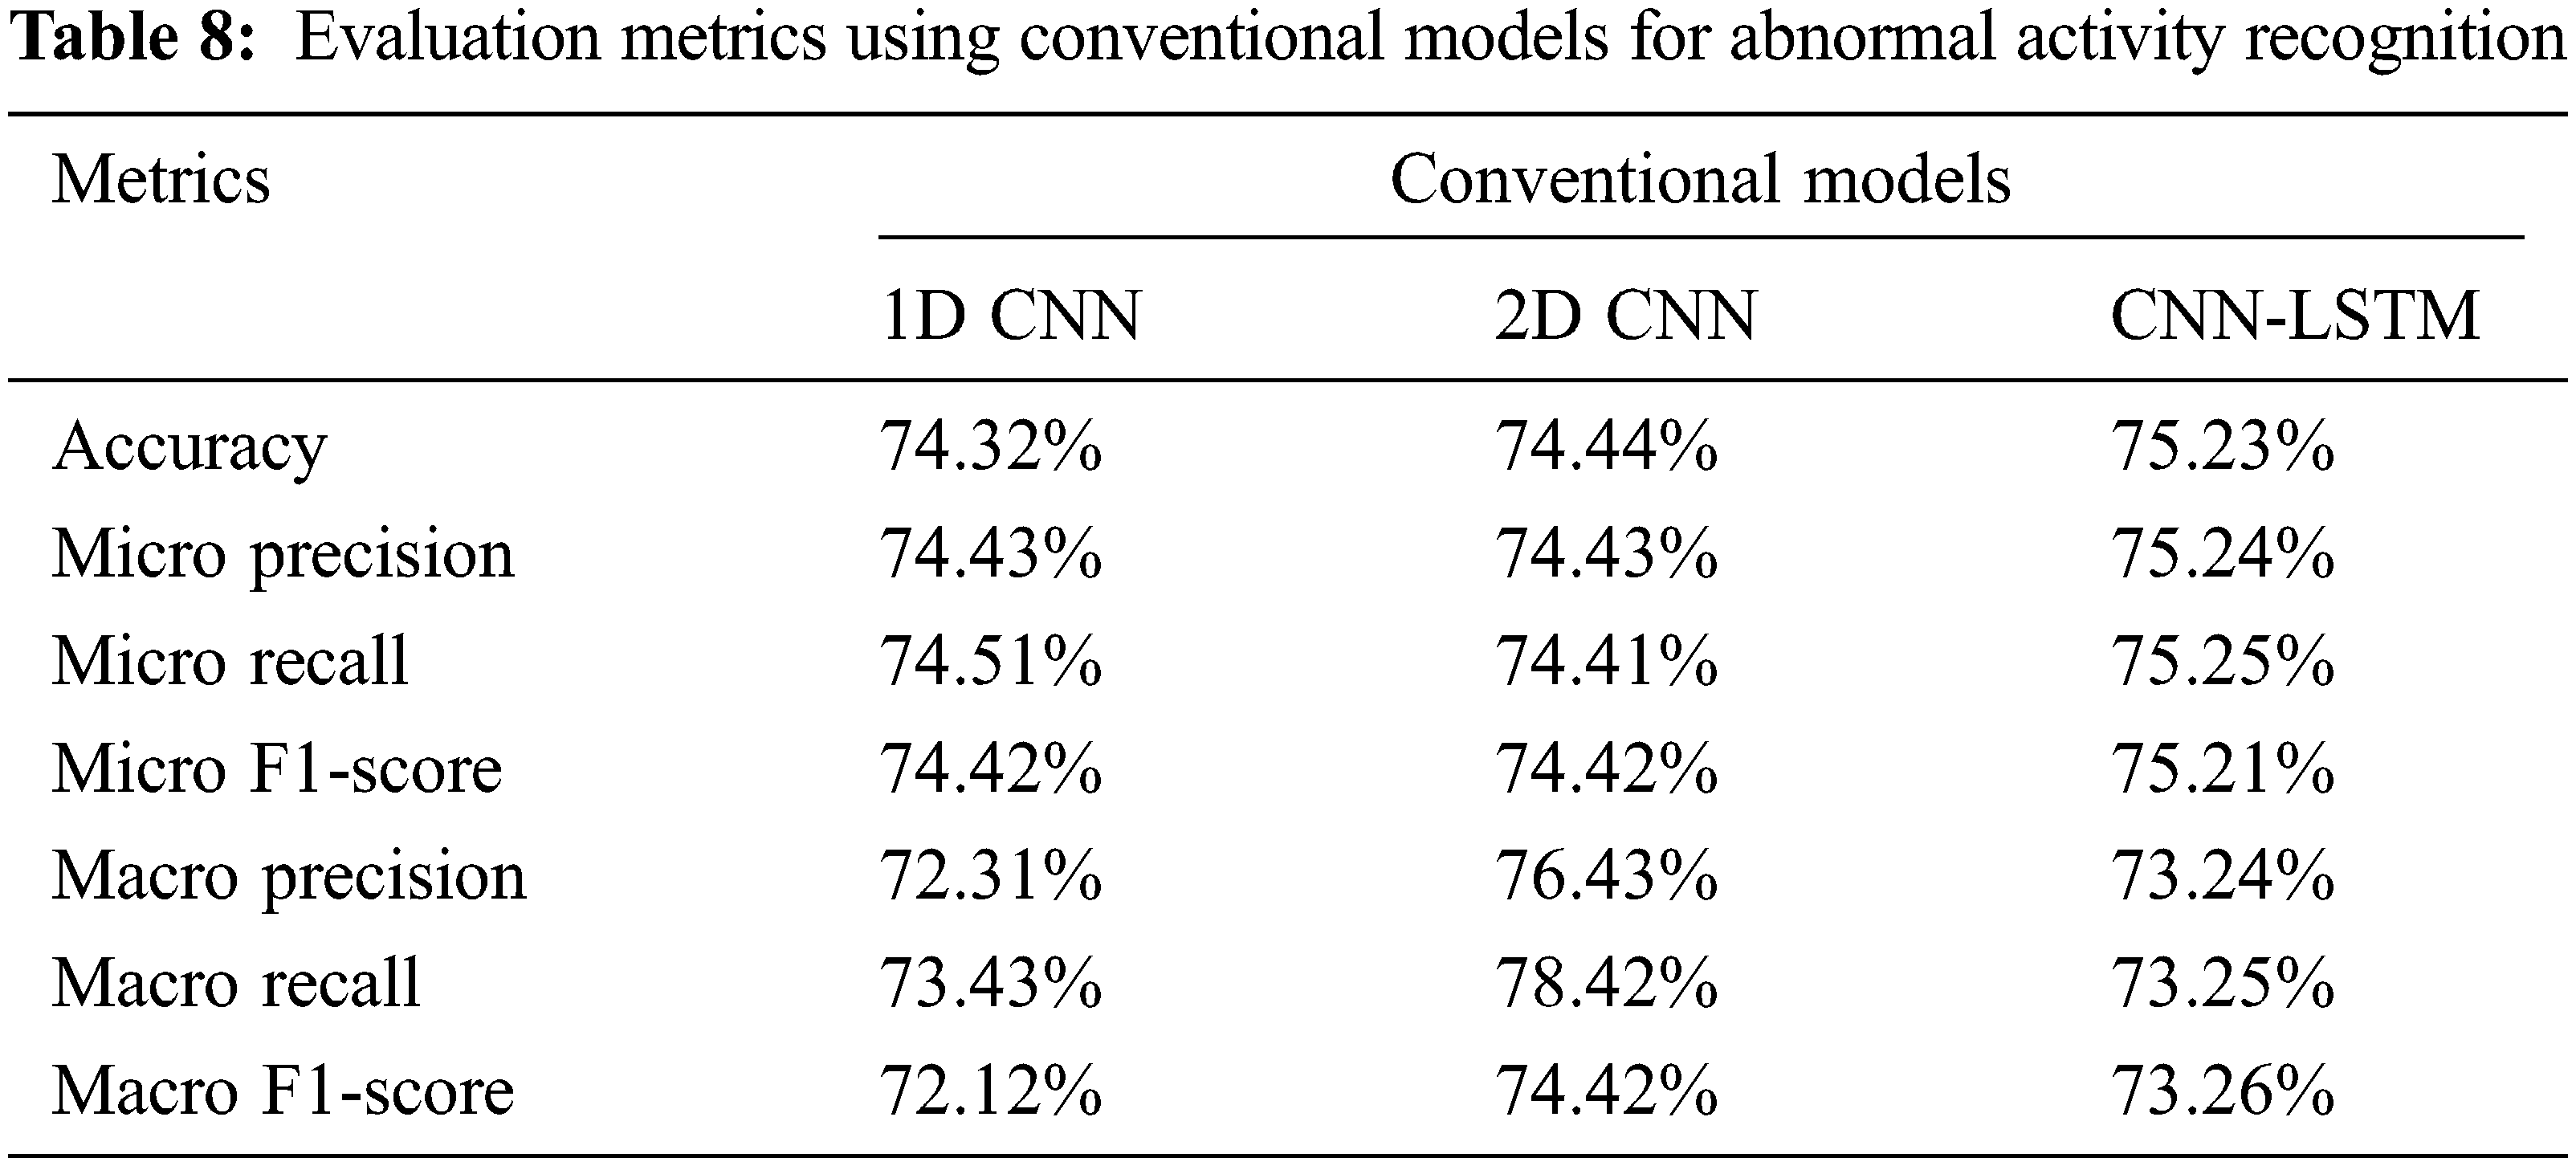
For AAR, the model performance of conventional architectures is plotted in terms of loss and accuracy on the training and validation datasets over training epochs as follows: Fig. 23 for CNN-LSTM and Fig. 24 for MH-CNN-LSTM. Tab. 8 shows the evaluation metrics obtained using conventional models on WISDM dataset for abnormal activity recognition. From Tab. 8, considering the accuracy, CNN-LSTM provides the accuracy of 75.23%. Then, 1D-CNN and 2D-CNN attains the accuracy of around 74%. When considering the F1-score, CNN-LSTM gives 73.26% and 2D CNN provides 74.42%. In which, 2D CNN performs well than the CNN-LSTM. Overall, in conventional methods, CNN-LSTM gets high accuracy and 2D CNN provides better F1-score value.

Figure 23: CNN-LSTM model performance
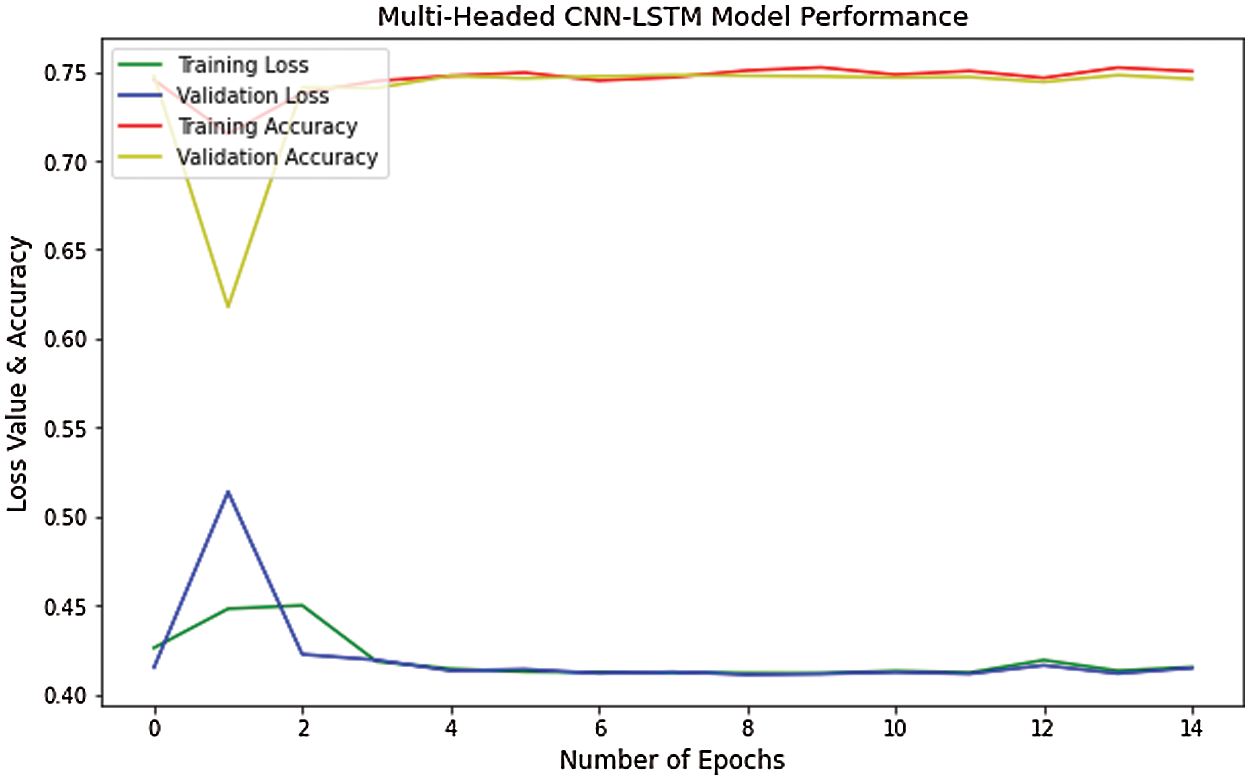
Figure 24: MH-CNN-LSTM model performance
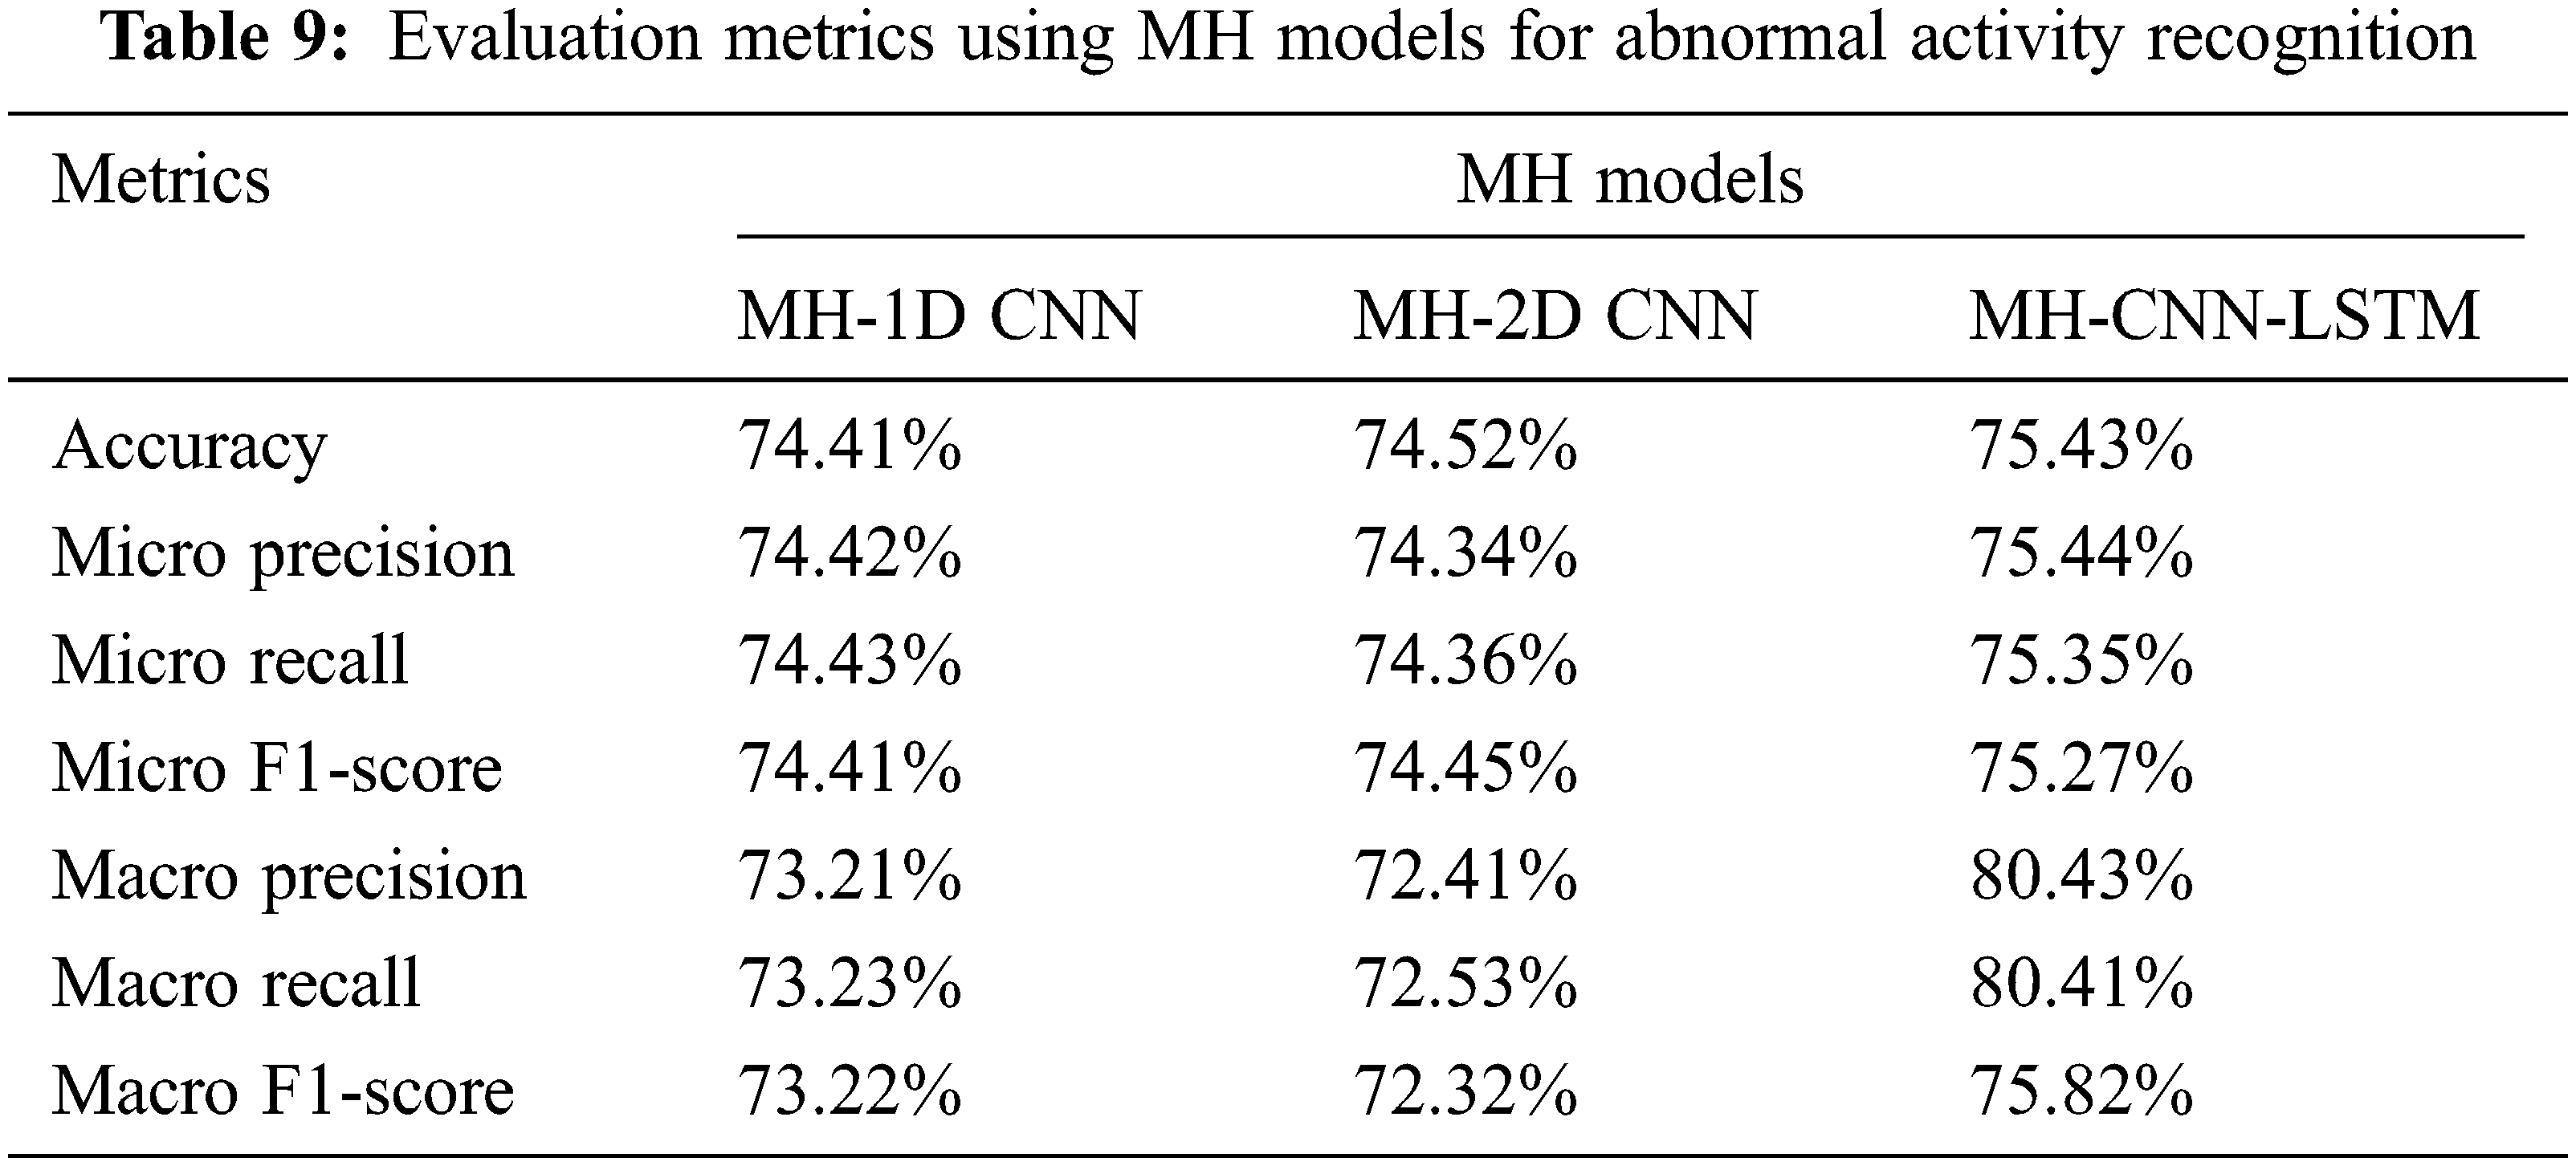
Tab. 9 shows the performance metrics obtained using MH models. From Tab. 9, MH-CNN-LSTM provides better accuracy of 75.43% and F1-score of 75.82% than other models. MH-1D-CNN and MH-2D-CNN provides accuracy of around 74%. For AAR, in MH models, CNN-LSTM performs well than the 1D-CNN and 2D-CNN.
Figs. 25 and 26 show the comparison of accuracy and F1-score between conventional models and MH models for AAR. When comparing the models, the MH-models and conventional models provide the same results for abnormal activity recognition. In both models, CNN-LSTM gives the accuracy and F1-score of around 75%. The main benefit of the classifier chain is that it keeps the correlation between the different classifiers’ output labels. The resulting synthesis dataset has high unbalanced instances for abnormality detection. MH and conventional models are also used to detect abnormalities. To enable the model to read and analyze sequence data at three different resolutions, the suggested method uses three-headed architectures that use 1D-CNN, 2D-CNN, and CNN-LSTM. The interpretations from all three heads are concatenated within the model before being interpreted by a fully-connected layer before providing a forecast. As a result, in terms of abnormality detection, the proposed method surpasses previous methods. The models’ output is a detection of normal or abnormal activity.

Figure 25: Accuracy for AAR

Figure 26: F1-score for AAR
The outcomes from the implementation illustrate that the MH architectures are the best suitable model to recognize the human activities using inertial sensor readings. Moreover, the MH models enable to encode the order of activities according to the proposed application. Hence, a sequence of activities can be generated and an activity introduced in a different order can be detected using MH architectures. When considering the abnormality detection, the classifier chain method is applied. The input instances for the classifier have been generated along with the activity recognition label. The synthesized instances contain high imbalanced classes. The MH architectures for imbalanced instances show poor performance than the balanced data. However, the HAR on WISDM dataset performs well than the AAR. For different datasets, the MH models may provide different results. Hence, MH models have to be tested with different dataset to analyse the results for abnormal activity detection using classifier chain.
This paper has proposed a method to recognize abnormal activities of ADP using time series data of wearable sensor. The different MH models have been applied to recognize the activities and they perform much better using the dataset WISDM. Moreover, abnormal activities are detected using classifier chain method. In which, the output of human activity detection is included as an extra input instance along with actual sensor data. The proposed method has included most of the signs and symptoms of ADP to generate the synthesis data. For abnormality detection, the MH architectures provide lower performance than the activity recognition. This paper has proposed an idea to recognize the progression of disease in advance using abnormal activities. It could assist to a quicker diagnosis and treatment and to prevent the progression of disease to the next stage. In future work, different datasets will be used to get better performance in abnormality detection and also sub-activities will be included in the activity sequence to detect unusual behavior. The abnormal activities of more than one patient in the same environment will be recognized using deep neural networks. In future, the ambient sensor-based abnormal activity detection will be executed by integrating most of the signs and symptoms.
Acknowledgement: The authors express their gratitude to Thiagarajar College of Engineering, Madurai, India, for their extensive support to carry out this work.
Funding Statement: The authors received no specific funding for this study.
Conflicts of Interest: The authors declare that they have no conflicts of interest to report regarding the present study.
1. M. R. Hodges, K. Kirsch, M. W. Newman and M. E. Pollack, “Automatic assessment of cognitive impairment through electronic observation of object usage,” in Int. Conf. on Pervasive Computing, Helsinki, Finland, pp. 192–209, 2010. [Google Scholar]
2. T. G. Stavropoulos, A. Papastergiou, L. Mpaltadoros, S. Nikolopoulos and I. Kompatsiaris, “IoT wearable sensors and devices in elderly care: A literature review,” Sensors, vol. 20, no. 10, pp. 2826, 2020. [Google Scholar]
3. H. Fang and C. Hu, “Recognizing human activity in smart home using deep learning algorithm,” in Proc. of the 33rd Chinese Control Conf., Nanjing, China, pp. 4716–4720, 2014. [Google Scholar]
4. M. M. Hassan, M. Z. Uddin, A. Mohamed and A. S. Almogren, “A robust human activity recognition system using smartphone sensors and deep learning,” Future Generation Computer Systems, vol. 81, pp. 307–313, 2018. [Google Scholar]
5. M. Zeng, L. T. Nguyen, B. Yu, O. J. Mengshoel, J. Zhu et al., “Convolutional neural networks for human activity recognition using mobile sensors,” in 6th Int. Conf. on Mobile Computing, Applications and Services, Austin, TX, USA, pp. 197–205, 2014. [Google Scholar]
6. K. Xia, J. Huang and H. Wang, “LSTM-CNN architecture for human activity recognition,” IEEE Access, vol. 8, pp. 56855–56866, 2020. [Google Scholar]
7. C. Xu, D. Chai, J. He, X. Zhang and S. Duan, “InnoHAR: A deep neural network for complex human activity recognition,” IEEE Access, vol. 7, pp. 9893–9902. 2019. [Google Scholar]
8. P. Agarwal and M. Alam, “A lightweight deep learning model for human activity recognition on edge devices,” Procedia Computer Science, vol. 167, pp. 2364–2373, 2019. [Google Scholar]
9. F. J. Morales and D. Roggen, “Deep convolutional and LSTM recurrent neural networks for multimodal wearable activity recognition,” Sensors (Basel), vol. 16, no. 1, pp. 115, 2016. [Google Scholar]
10. D. Riboni, C. Bettini, G. Civitarese, Z. H. Janjua and R. Helaoui, “Fine-grained recognition of abnormal behaviors for early detection of mild cognitive impairment,” in 2015 IEEE Int. Conf. on Pervasive Computing and Communications, St. Louis, MO, USA, pp. 149–154, 2015. [Google Scholar]
11. Z. A. Khan and W. Sohn, “Abnormal human activity recognition system based on R-transform and kernel discriminant technique for elderly home care,” IEEE Transactions on Consumer Electronics, vol. 57, no. 4, pp. 1843–1850, 2011. [Google Scholar]
12. P. Parvin, F. Paterno and S. Chessa, “Anomaly detection in the elderly daily behavior,” in 2018 14th Int. Conf. on Intelligent Environments (IE), Rome, Italy, pp. 103–106, 2018. [Google Scholar]
13. D. G. Shreyas, S. Raksha and B. G. Prasad, “Implementation of an anomalous human activity recognition system,” SN Computer Science, vol. 1, pp. 168, 2020. [Google Scholar]
14. J. H. Shin, B. Lee and K. S. Park, “Detection of abnormal living patterns for elderly living alone using support vector data description,” IEEE Transactions on Information Technology in Biomedicine, vol. 15, no. 3, pp. 438–448, 2011. [Google Scholar]
15. A. R. Forkan, I. Khalil, Z. Tari, S. Foufou and A. Bouras, “A Context-aware approach for long-term behavioral change detection and abnormality prediction in ambient assisted living,” Pattern Recognition, vol. 48, no. 3, pp. 628–641, 2015. [Google Scholar]
16. J. Lundstrom, E. Jarpe and A. Verikas, “Detecting and exploring deviating behavior of smart home residents,” Expert Systems with Applications, vol. 55, pp. 429–440, 2016. [Google Scholar]
17. K. S. Gayathri, S. Elias and B. Ravindran, “Hierarchical activity recognition for dementia care using markov logic network,” Personal and Ubiquitous Computing, vol. 19, pp. 271–285, 2015. [Google Scholar]
18. R. Varatharajan, G. Manogaran, M. K. Priyan and R. Sundarasekar, “Wearable sensor devices for early detection of Alzheimer disease using dynamic time warping algorithm,” Cluster Computing, vol. 21, pp. 681–690, 2018. [Google Scholar]
19. Y. Hsu, P. C. Chung, W. Wang, M. Pai, C. Wang et al., “Gait and balance analysis for patients with Alzheimer’s disease using an inertial sensor based wearable instrument,” IEEE Journal of Biomedical and Health Informatics, vol. 18, no. 6, pp. 1822–1830, 2014. [Google Scholar]
20. X. Luo, H. Tan, Q. Guan, T. Liu, H. Zhuo et al., “Abnormal activity detection using pyroelectric infrared sensors,” Sensors, vol. 16, no. 6, pp. 822, 2016. [Google Scholar]
21. D. Arifoglu and A. Bouchachia, “Activity recognition and abnormal behavior detection with recurrent neural networks,” Procedia Computer Science, vol. 110, pp. 86–93, 2017. [Google Scholar]
22. D. Arifoglu and A. Bouchachia, “Detection of abnormal behavior for dementia sufferers using convolutional neural networks,” Artificial Intelligence in Medicine, vol. 94, pp. 88–95, 2019. [Google Scholar]
23. D. Arifoglu and A. Bouchachia, “Abnormal behavior detection for dementia sufferers via transfer learning and recursive auto-encoders,” in 2019 IEEE Int. Conf. on Pervasive Computing and Communications Workshops, Kyoto, Japan, pp. 529–534, 2019. [Google Scholar]
24. X. Zhang, H. Zhao, S. Zhang and R. Li, “A novel deep neural network model for multi-label chronic disease prediction,” Frontiers in Genetics, vol. 10, pp. 351, 2019. [Google Scholar]
25. A. Maxwell, R. Li, B. Yang, H. Weng, A. Ou et al., “Deep learning architectures for multi-label classification of intelligent health risk prediction,” BMC Bioinformatics, vol. 18, no. S14, pp. 523, 2017. [Google Scholar]
26. R. Mohamed, T. Perumal, M. N. Sulaiman, N. Mustapha and M. N. Zainudin “Multi label classification on multi resident in smart home using classifier chains,” Advanced Science Letters, vol. 24, pp. 1316–1319, 2018. [Google Scholar]
27. J. R. Kwapisz, G. M. Weiss, and S. A. Moore, “Activity recognition using cell phone accelerometers,” ACM SIGKDD Explorations Newsletter, vol. 12, no. 2, pp. 74–82, 2011. [Google Scholar]
 | This work is licensed under a Creative Commons Attribution 4.0 International License, which permits unrestricted use, distribution, and reproduction in any medium, provided the original work is properly cited. |