DOI:10.32604/csse.2023.025282
| Computer Systems Science & Engineering DOI:10.32604/csse.2023.025282 | |
| Article |
Detection of COVID-19 and Pneumonia Using Deep Convolutional Neural Network
Department of Electrical and Computer Engineering, North South University, Plot 15, Block B, Bashundhara, Dhaka, 1229, Bangladesh
*Corresponding Author: Sifat Momen. Email: sifat.momen@northsouth.edu
Received: 18 November 2021; Accepted: 19 January 2022
Abstract: COVID-19 has created a panic all around the globe. It is a contagious disease caused by Severe Acute Respiratory Syndrome Coronavirus 2 (SARS-CoV-2), originated from Wuhan in December 2019 and spread quickly all over the world. The healthcare sector of the world is facing great challenges tackling COVID cases. One of the problems many have witnessed is the misdiagnosis of COVID-19 cases with that of healthy and pneumonia cases. In this article, we propose a deep Convolutional Neural Network (CNN) based approach to detect COVID+ (i.e., patients with COVID-19), pneumonia and normal cases, from the chest X-ray images. COVID-19 detection from chest X-ray is suitable considering all aspects in comparison to Reverse Transcription Polymerase Chain Reaction (RT-PCR) and Computed Tomography (CT) scan. Several deep CNN models including VGG16, InceptionV3, DenseNet121, DenseNet201 and InceptionResNetV2 have been adopted in this proposed work. They have been trained individually to make particular predictions. Empirical results demonstrate that DenseNet201 provides overall better performance with accuracy, recall, F1-score and precision of 94.75%, 96%, 95% and 95% respectively. After careful comparison with results available in the literature, we have found to develop models with a higher reliability. All the studies were carried out using a publicly available chest X-ray (CXR) image data-set.
Keywords: COVID-19; convolutional neural network; deep learning; DenseNet201; model performance
COVID-19 has thrown peoples’ lives into disarray all around the world. A virus named SARS-CoV-2 is responsible for this contagious disease [1]. The first known case was identified in Wuhan, Hubei province, China in December 2019 [2]. Later it gradually spread to all parts of the world. As of November 15, 2021 the number of affected and death cases are 254,050,589 and 5,115,804 respectively [3]. Symptoms of COVID-19 vary from one patient to another–however fever, cough and shortness of breath have been found to be the most common traits amongst the infected people [4]. Through the respiratory droplets, the virus can spread to others who are within six feet from the infected ones [5]. The world is facing a massive disruption in the global economy. According to the World Bank, it will take 80 years to recover from this global economic meltdown [6].
COVID-19 can be detected using several techniques including RT-PCR test, image analyzing of chest X-ray and CT scans. RT-PCR is an effective way of COVID-19 detection, but it takes time on sample collection [7] and requires special kits that may not be available everywhere [8]. This test can give reliable results but according to laboratory facilities, it may take on average six to eight hours for processing each case [9]. Another way to diagnose COVID-19 is through the analyzing of chest CT scan images [10]. People with overexposure of radiation from CT scans have high risks of cancers [11]. Due to COVID-19, the numbers of CT scans have increased significantly. This increases the overexposure to radiation and consequently the likelihood of developing cancers in radiographers. Alongside it is also expensive, needs clinical expertise to operate and may not be available in the underdeveloped region of a country. However, chest X-ray tests are inexpensive and have a low risk of radiation, compared to CT scan [12]. The World Health Organization (WHO) finds chest X-ray images to be a very effective method in the diagnosis of COVID-19 [13].
In the recent time, patients with pneumonia have been misdiagnosed as COVID patients. In this article, we aim to solve this problem by developing an intelligent system that would be able to classify whether a patient has pneumonia or COVID. Furthermore the system is able to correctly identify the normal cases. A comparison between five different deep CNN models has been presented in this work. Comparing all the model performances on a publicly available CXR image data-set from Kaggle [14], we selected the most accurate one.
After the outbreak of coronavirus doctors are focusing more on COVID-19. In many cases, they begin COVID-19 management finding few similar COVID symptom for a patient [15], which would not have been done prior to this pandemic. As a result it leads to early misdiagnosis as well. Few symptoms of COVID-19 matches with other repository disease (i.e., pneumonia), that is mainly the reason of raising misdiagnose issue. To tackle this issue we employed five renowned deep CNN model to classify COVID+, pneumonia and normal case. Although the models are existing one, we rather focused more to solve three class predicting problem.
Rests of the segments of this article are organized as follows: Section 2 describes Literature Review. Methods and Materials have been provided in Section 3 while Section 4 provides a detailed discussion on results. Finally the article is concluded in Section 5.
Thus far, a lot of research has been done to detect COVID-19 using the CNN approach. In this section we discuss some research that used chest X-ray images to classify COVID-19.
Azemin et al. [16] proposed a Deep Learning (DL) method based on ResNet101 CNN architecture to detect COVID-19 from chest X-ray. ResNet101 has been used for its residual learning framework, due to which the model has lower computational complexity. In this study thousands of chest X-ray images were utilized in the pre-trained phase to distinguish meaningful objects, and thousands more were used in the re-trained stage to detect abnormalities. This method obtained only 71.9% accuracy.
Nishio et al. [17] built a Computer-Aided Diagnosis (CADx) to classify COVID-19 pneumonia, non-COVID-19 pneumonia and healthy lung. They adopted VGG16 to train on a customized data-set. To avoid the noise in the data-set, lateral view and CT images were excluded. Combination of three types of data augmentation methods (conventional method such as flipping, shifting and rotating etc, mixup and Random Image Cropping and Patching-RICAP) were applied to prevent over-fitting in model training. The CAD system provides 83.6% accuracy over the test set containing 125 CXR images.
Rahaman et al. [18] trained 15 different CNN models and after careful comparisons in terms of precision, recall and F-1 score, selected the most suitable one. All the models have been trained on a custom data-set consisting of CXR images of COVID-19, pneumonia and healthy patients. Various data augmentation techniques have been applied on the training sample to improve the model performance.
Khan et al. [19] presented a deep CNN model named CoroNet, which automatically detects COVID-19 infection from chest X-ray images. This proposed model was developed on Xception architecture and trained on a custom ImageNet data-set. The model obtained an overall accuracy of 89.6%.
Erdem et al. [20] offered a comparison between six different DL models that trained over a custom data-set. They applied transfer learning methods on the data-set. Data augmentation technique has been adopted to reduce model over-fitting. The training phase was performed with batch size of 32 and learning rate of 0.0001. Among the six models, InceptionV3 provides the highest accuracy of 90%.
Hasan et al. [21] reported a DL approach to detect pneumonia in COVID+ patients (i.e., patients who have been diagnosed to have COVID-19). They worked on the same data-set that we used to train different CNN models. Keras image data generator technique is used to perform data augmentation. After that the data-set has been split into train and test sets in the ratio of 80% and 20% respectively. The overall accuracy was 91.69% in predicting pneumonia in COVID+ patients. VGG16 provides the highest accuracy after epoch 7, when training and validation loss decreased and accuracy increased.
Abbas et al. [22] proposed a CNN based architecture based on DeTraC model (Decompose, Transfer and Compose) which facilitates the pre-trained CNN models to improve their performance to classify COVID+ cases from the chest X-ray images. By adding a class decomposition layer to the pre-trained models, DeTraC can be accomplished. The class decomposition layer seeks to divide each class in the dataset into numerous sub-classes, assign new labels to the new set, and consider each subset as an independent class before reassembling the subsets to produce final predictions. The mechanism reported the highest accuracy of 93.1%.
Wang et al. [23] tailored a CNN model, named COVID-Net which can predict COVID-19 from CXR images using a human-machine collaborative design strategy. A benchmark data-set is used for training and evaluating the model. The introduced model achieved 93.3% accuracy in three class (COVID+, pneumonia and normal case) prediction.

All the discussed literatures have used CNN technique to classify COVID-19 and other disease (i.e., pneumonia and normal case). Most of them solved three class prediction problem and achieved very good accuracy. But our proposed model is higher in accuracy.
In this article, we investigate, assess and analyze the influence of different CNN architectures using image dataset containing chest X-ray images of patients who are healthy, COVID infected or have Pneumonia.
Before we embark into the training phase, data augmentation techniques have been applied to tackle class imbalance issues. All images were reshaped to 224 × 224 pixels. All the images of the data-set are taken from only one angle. This will be a problem as it is impractical to always take the image from the same angle. The applied data augmentation techniques would tackle this issue as well. The system architecture is provided in Fig. 1.
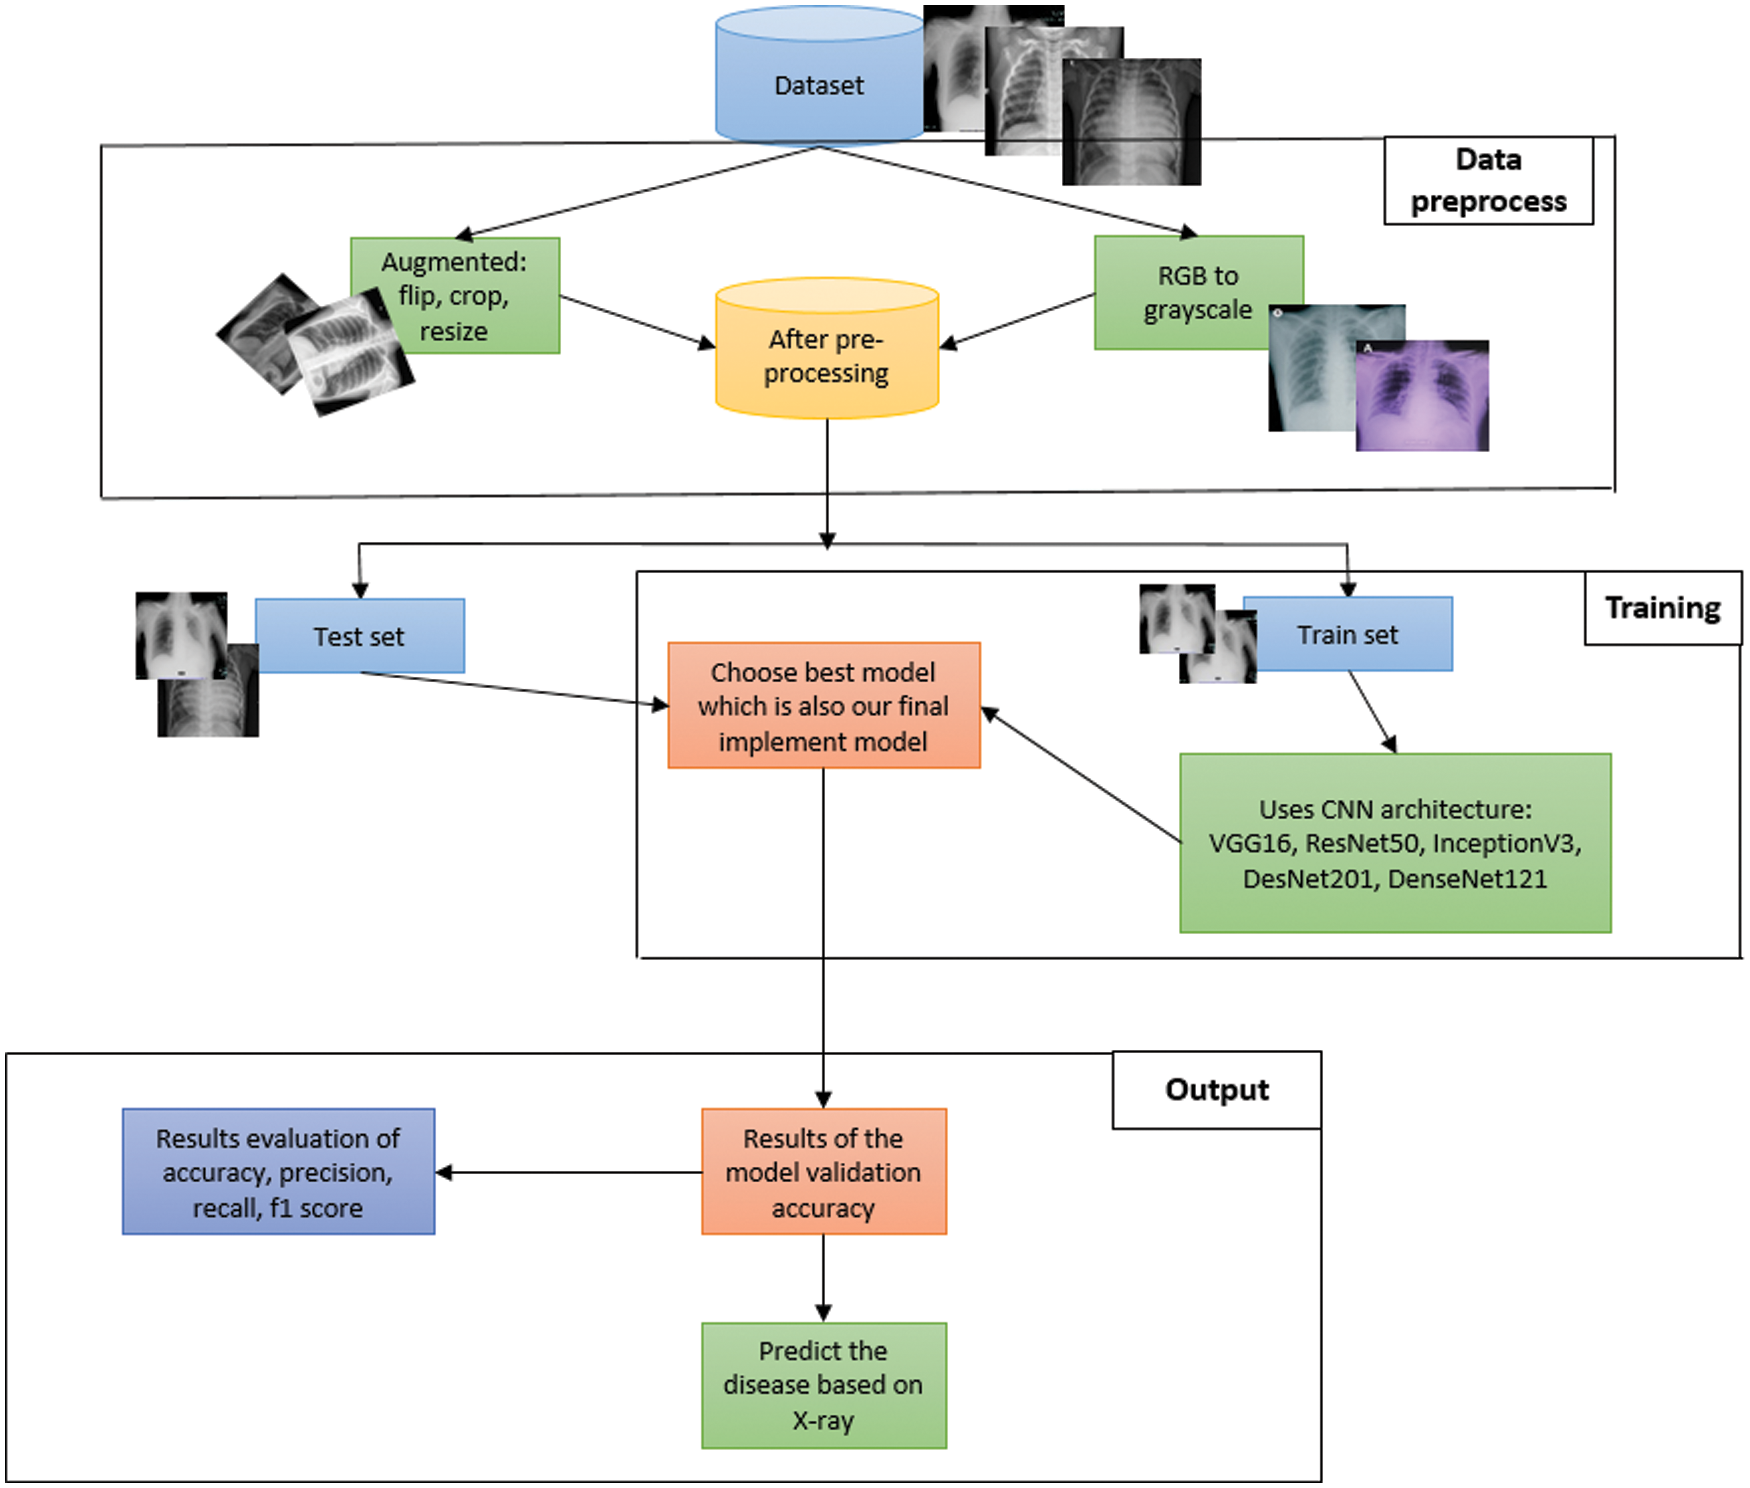
Figure 1: System architecture
3.1 Data Collection & Pre-processing
X-ray images of patients from [14] were used in this work. Fig. 2 shows sample images from this dataset. This dataset has already been divided into a test dataset and a train dataset. 80% of the data is in the train dataset. On the other hand, the test dataset holds 20% of the data.
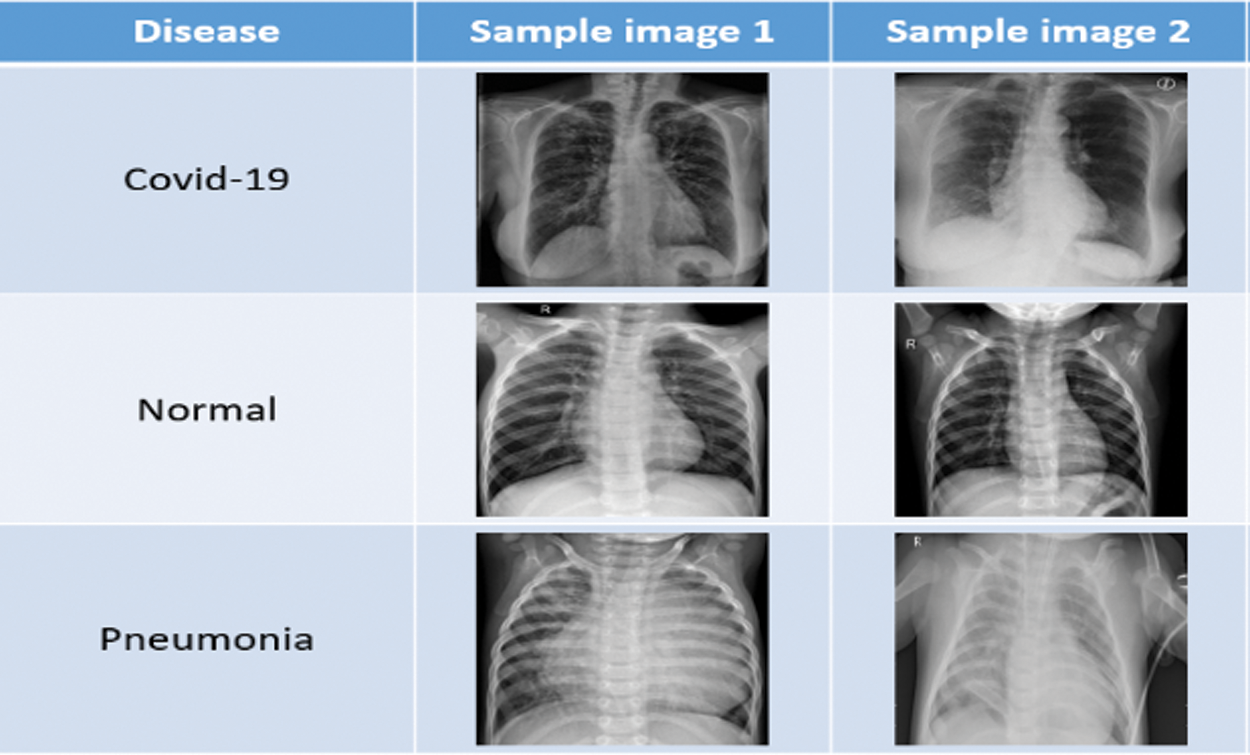
Figure 2: Sample data
After obtaining the dataset [14] from kaggle, we applied some preprocessing task on it. Image data augmentation is a technique, that we have used in our article to artificially increase the size of our training dataset by creating modified versions of images in the dataset. Image data augmentation is used to increase the size of the training dataset in order to improve the performance and capability of the models used in this article. Data augmentation techniques such as padding, cropping, rotating, resizing and flipping are the most common methods that are we used over the images to increase the size of the dataset. In this project we have done data augmentation through some parameters or measurements which is mentioned in Tab. 4. Fig. 3 shows the different data augmentation techniques that we applied on the dataset.
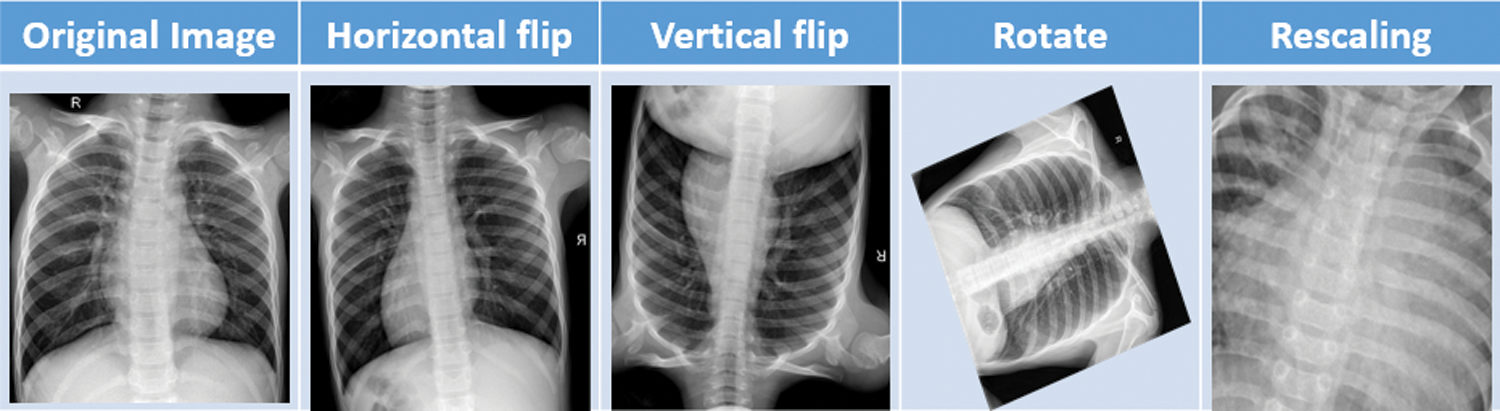
Figure 3: Sample data augmentation
After completing the data pre-processing stage, the data-set is divided into train and test set. The train set is ready to be fed into CNN architecture. In this article, we have used five types of deep CNN architectures: VGG16, InceptionV3, DesNet121, DesNet201 and InceptionResNetV2 have been evaluated. All these architectures are briefly described below.
VGG16 is a 16 convolutional layer architecture [24]. There are four types of layers which are convolution + relu, max pooling, fully nested + relu and softmax. The final output of the max pooling layer, which performed over 2 × 2 pixels [24]. Fig. 4 [24] shows the basic network architecture of VGG16.
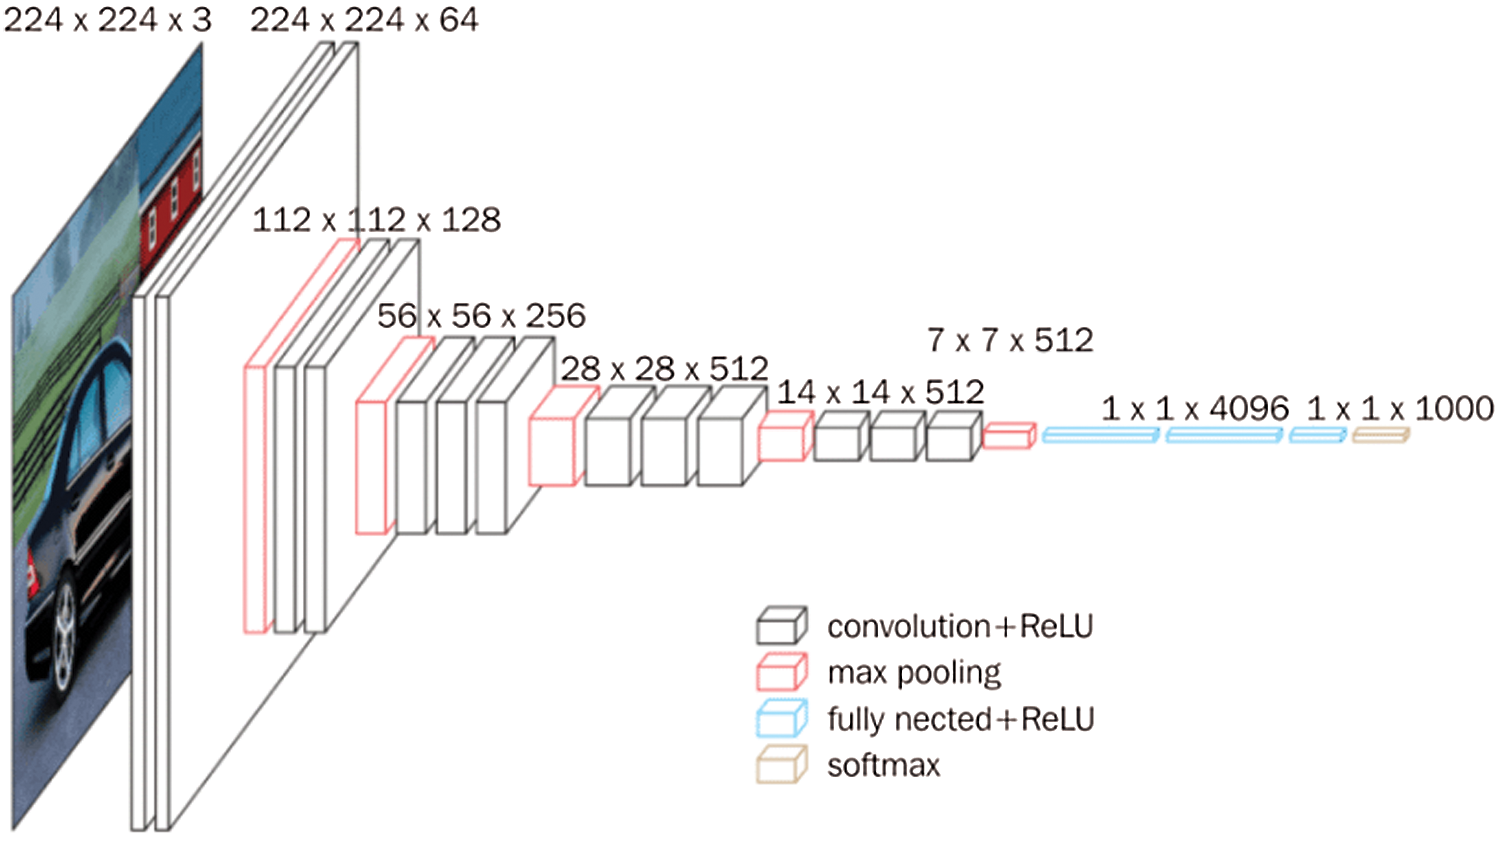
Figure 4: VGG16 architecture
In InceptionV3 model, factorized Convolutions is the initial part of the model. It also keeps a check on the network proficiency [25]. The auxiliary classifier mainly used for connecting each layer to maintain continuous process [25]. Fig. 5 [25] shows the basic network architecture of InceptionV3.
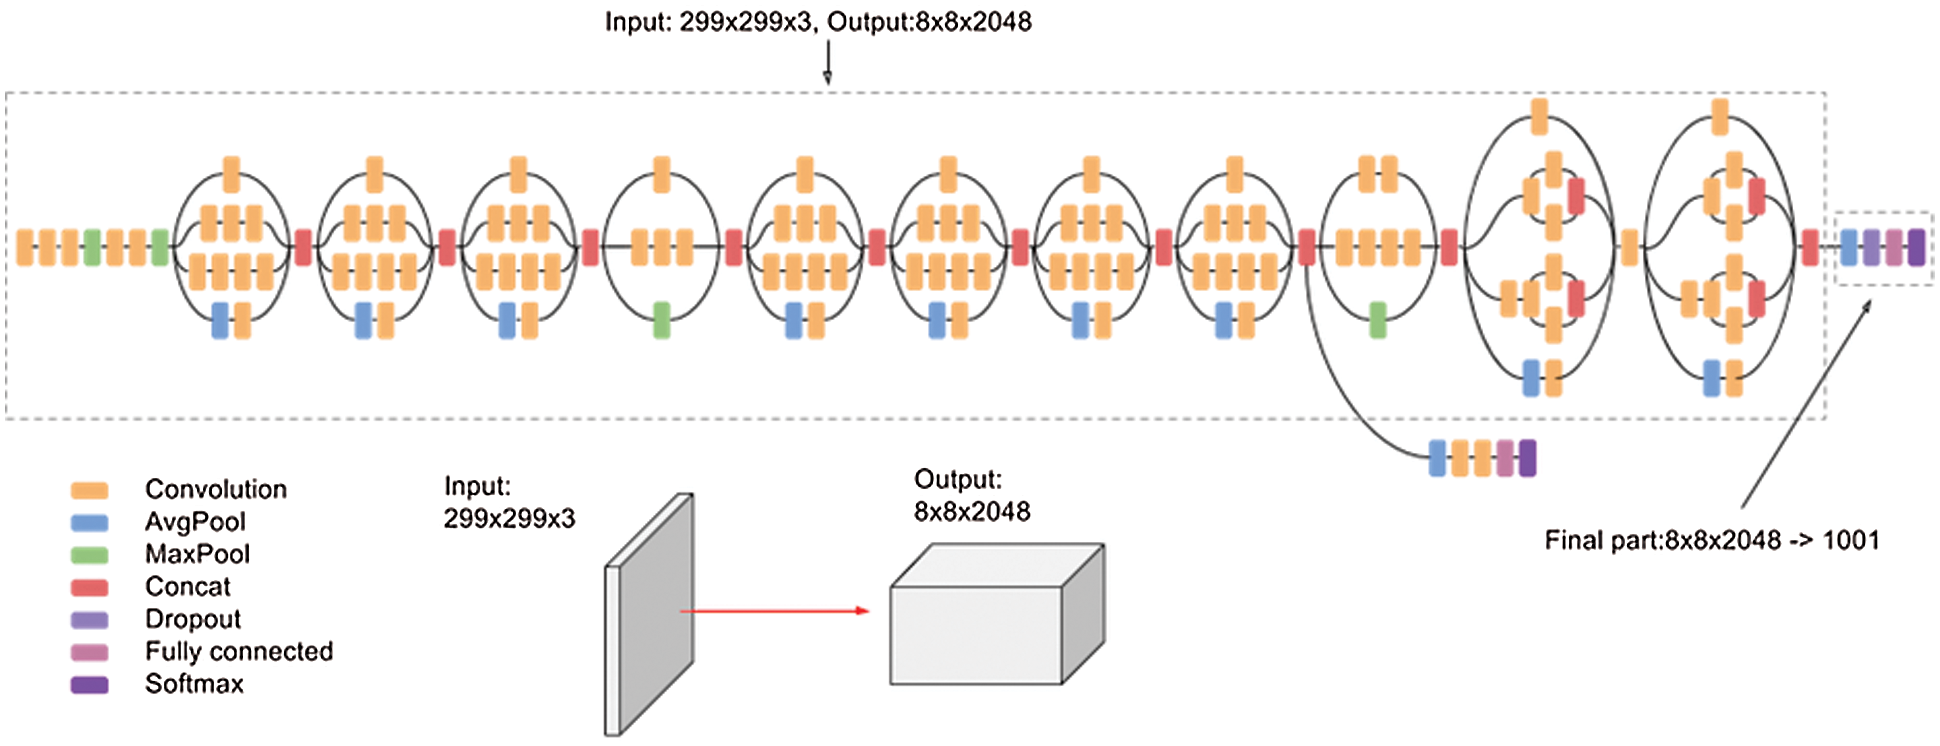
Figure 5: InceptionV3 architecture
We used the DenseNet architecture in our work because it reduces the vanishing-gradient problem, reinforces highlight proliferation, energizes highlight reuse, and considerably diminishes the number of parameters [26]. In our work we have used DenseNet121 and DenseNet201 which are designed by 121 and 201 convolutional layers respectively. Fig. 6 [26] shows the DenseNet architecture.

Figure 6: DenseNet architecture
We have used a renowned CNN model which belongs to Inception family of architectures with collaborative residual connections [27]. InceptionResNetV2 is a CNN model which is designed by 121 deep layers. This architecture results in an image output of 299 × 299 pixels. Fig. 7 shows the basic network architecture of InceptionResNetV2 [27].

Figure 7: InceptionResNetV2 architecture
The most important aspect of an article is whether or not the processes used works properly. To investigate this, some testing must be performed, as illustrated by the flow chart below Fig. 8. The learned model is loaded first, whether it is VGG16, DenseNet, InceptionV3 or InceptionResNetV2 and then a new image (unseen) is provided as input. After we input an image, the model classifies it and displays the results, whether that image is holds COVID infection or not.

Figure 8: Result process
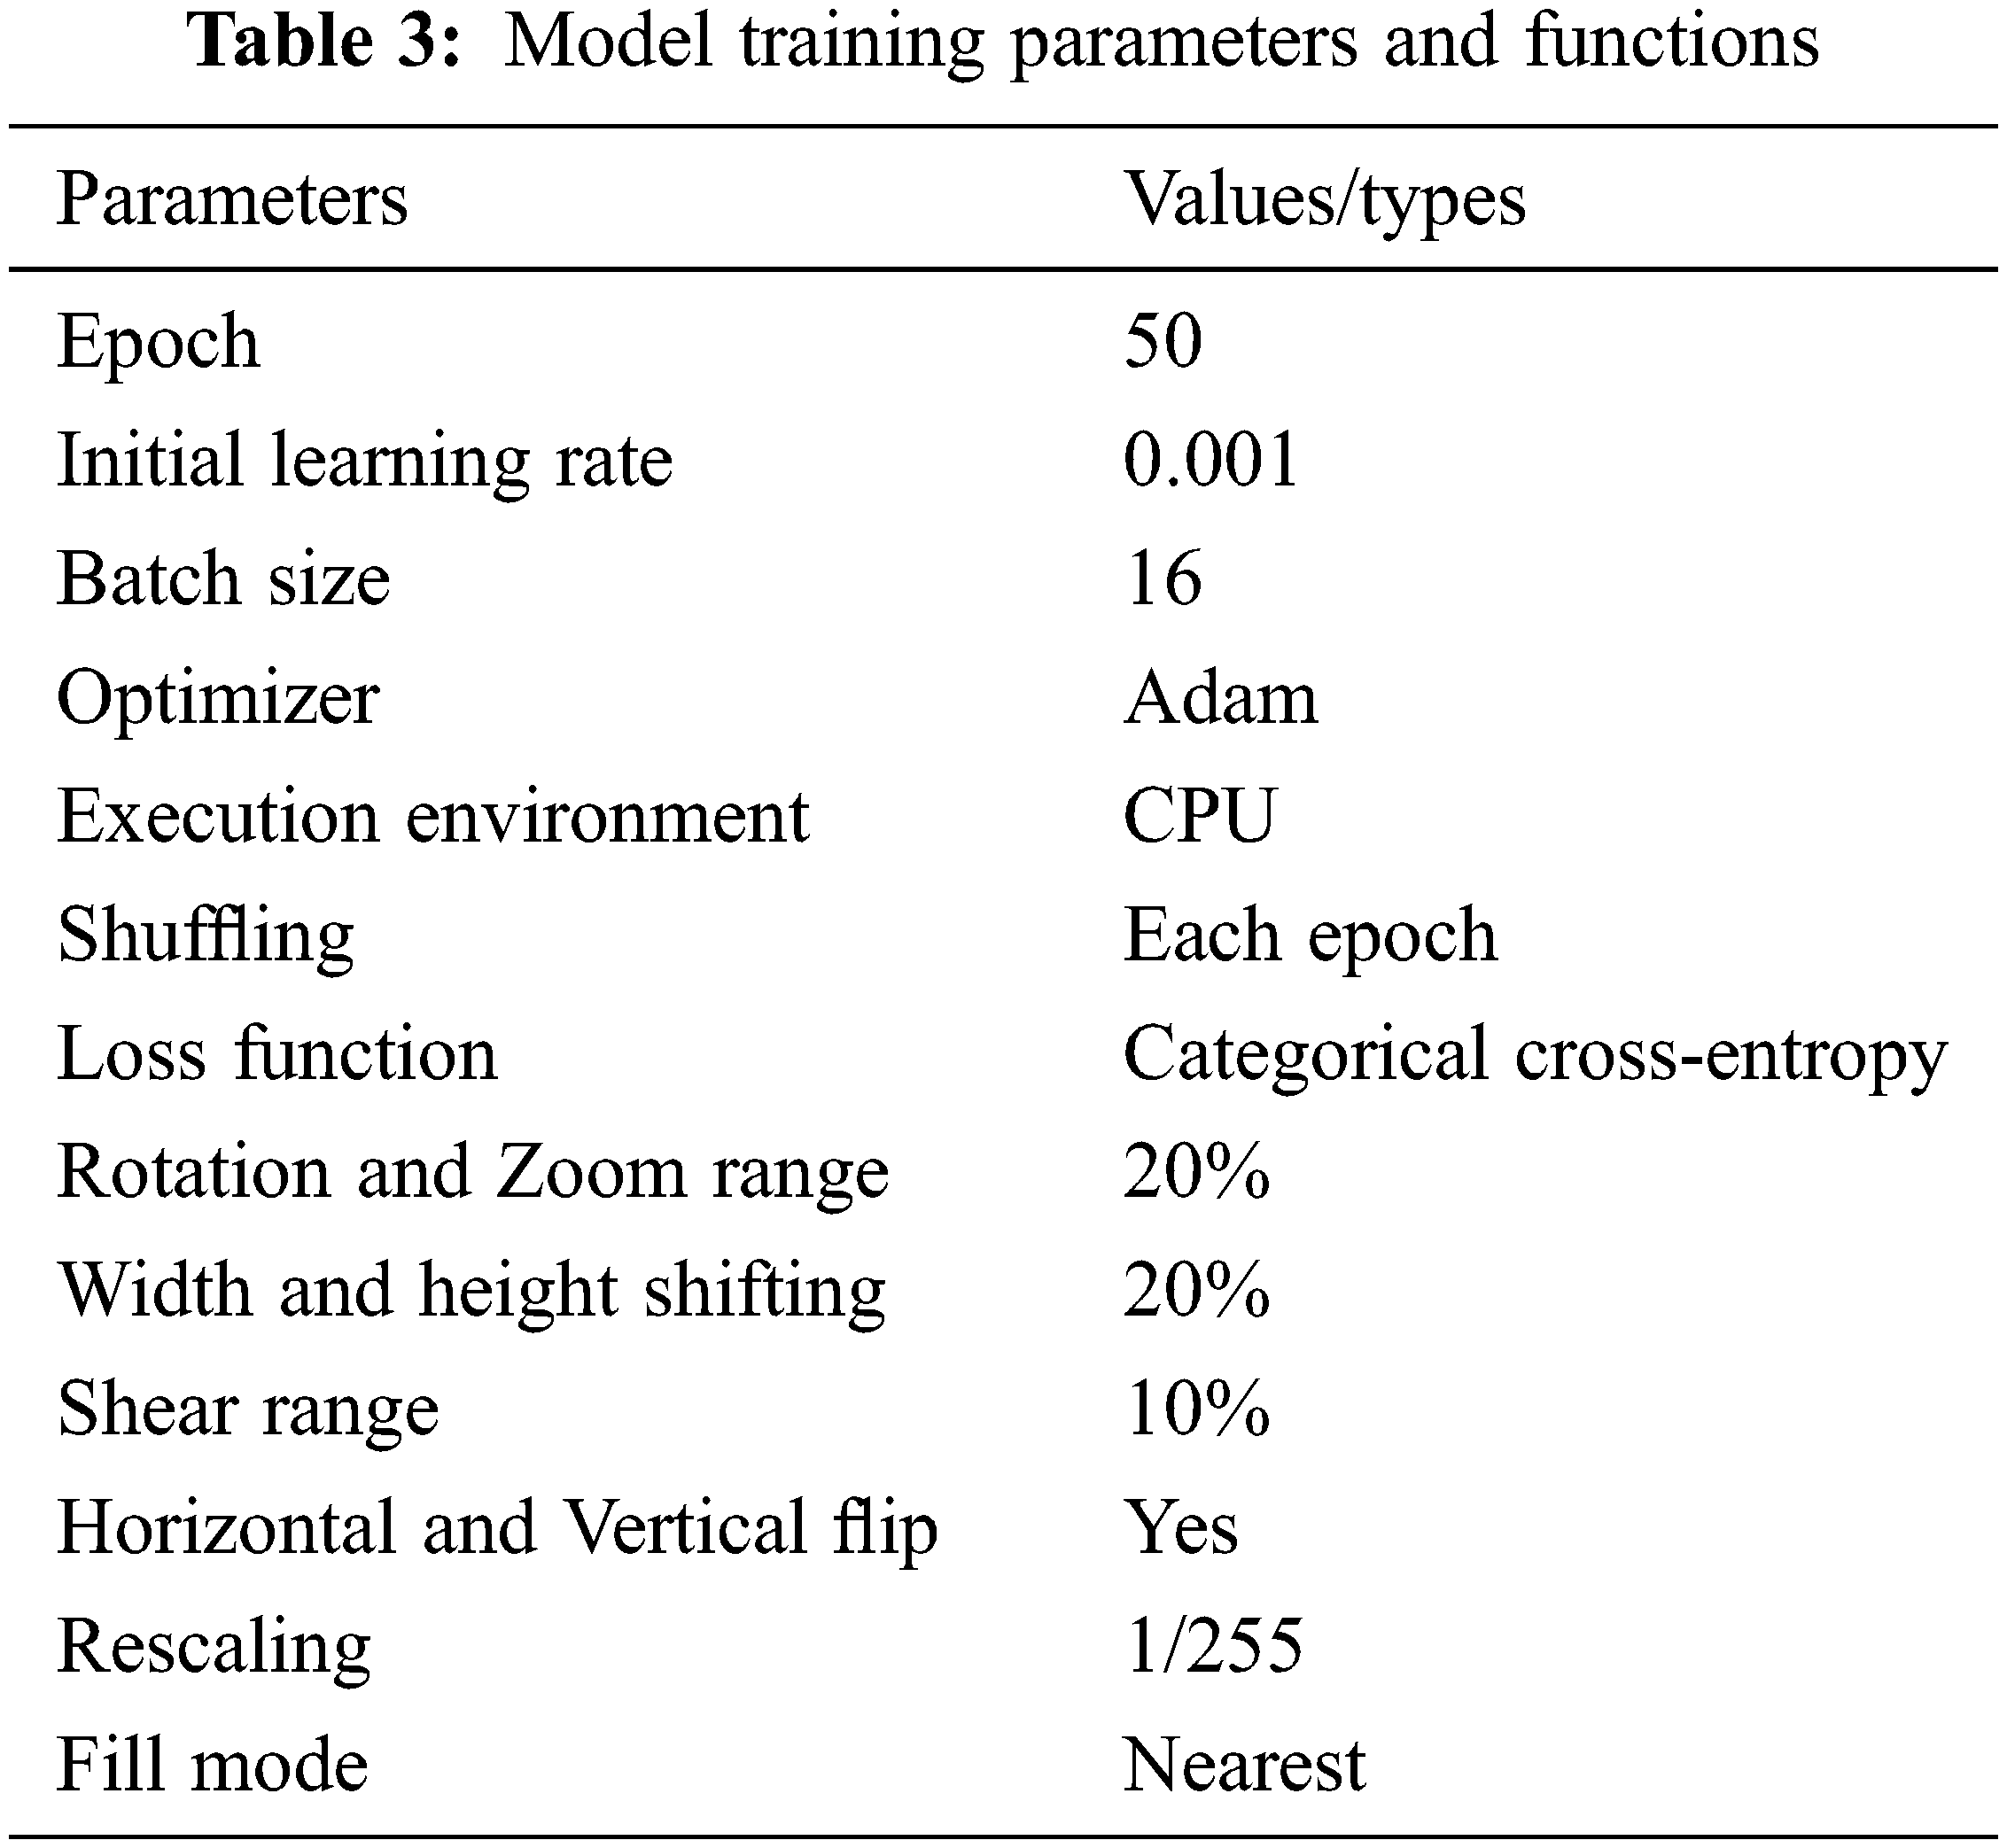
The experiment was run on a 64-bit version of Windows11 using Python 3.6 as the software development language in a Jupyter notebook. To build and train the model, the entire experiment was implemented in the TensorFlow framework using Keras as the back-end. The whole application is implemented on a computer with an Intel® Core-TM i5-8250U Processor (6M Cache, 1.60 GHz to 3.40 GHz) and 8 GB RAM. To begin, the data were divided into two categories: 80% training data and 20% testing data with random state, as shown in Tab. 2. As a validation dataset, we used the test dataset for our model. During training and validation, we will begin investing the learning curves acquired by all backbone models with fine tuning parameter weight. On the images, we used the Keras image data generator technique to provide data augmentation. We used image augmentation techniques to enhance the number of samples in the dataset and improve the classification model’s performance. Our image augmentation parameters were a rotation range of 20, zoom range of 20, width shift range of 0.2, height shift range of 0.2, shear range of 0.10, vertical flipping and horizontal flipping. The number of epochs was set at 50 for consistency of results and due to the size of the dataset. All hyperparameter shown is Tab. 3. As optimization features, a learning rate of 0.001 using the Adam optimizer and a cross-entropy using categorical were used in this experiment. We employed the fine-tuning technique to optimize our total trainable parameter weights. Even when there is enough training data, fine-tuning is preferred because it considerably reduces training time. A pretrained model (base-model) and a new model (head-model) were built in our trained model. Each layer in Keras has a parameter called “trainable” which has been set to be “non-trainable” in the base-model and the head-model to set the total trainable parameters. Tab. 4 shows the total trainable parameters for particular CNN architectures which were trained with our data-set.


For every fine-tuned model, the accuracy and loss results in the training and validation procedure is given in Tab. 5. From Tab. 5 we see the best epoch result in our trained models. We can further conclude that DenseNet201 architecture has provided the best training and validation accuracies.

The training and validation curves for all models are shown in Figs. 9–13. These figures demonstrate how training and validation accuracy increase or decrease with consecutive epochs, as well as training and validation losses. The number of epochs is plotted on the x-axis, while the accuracy/loss is plotted on the y-axis.

Figure 9: Training-validation accuracy loss and loss of VGG16 model
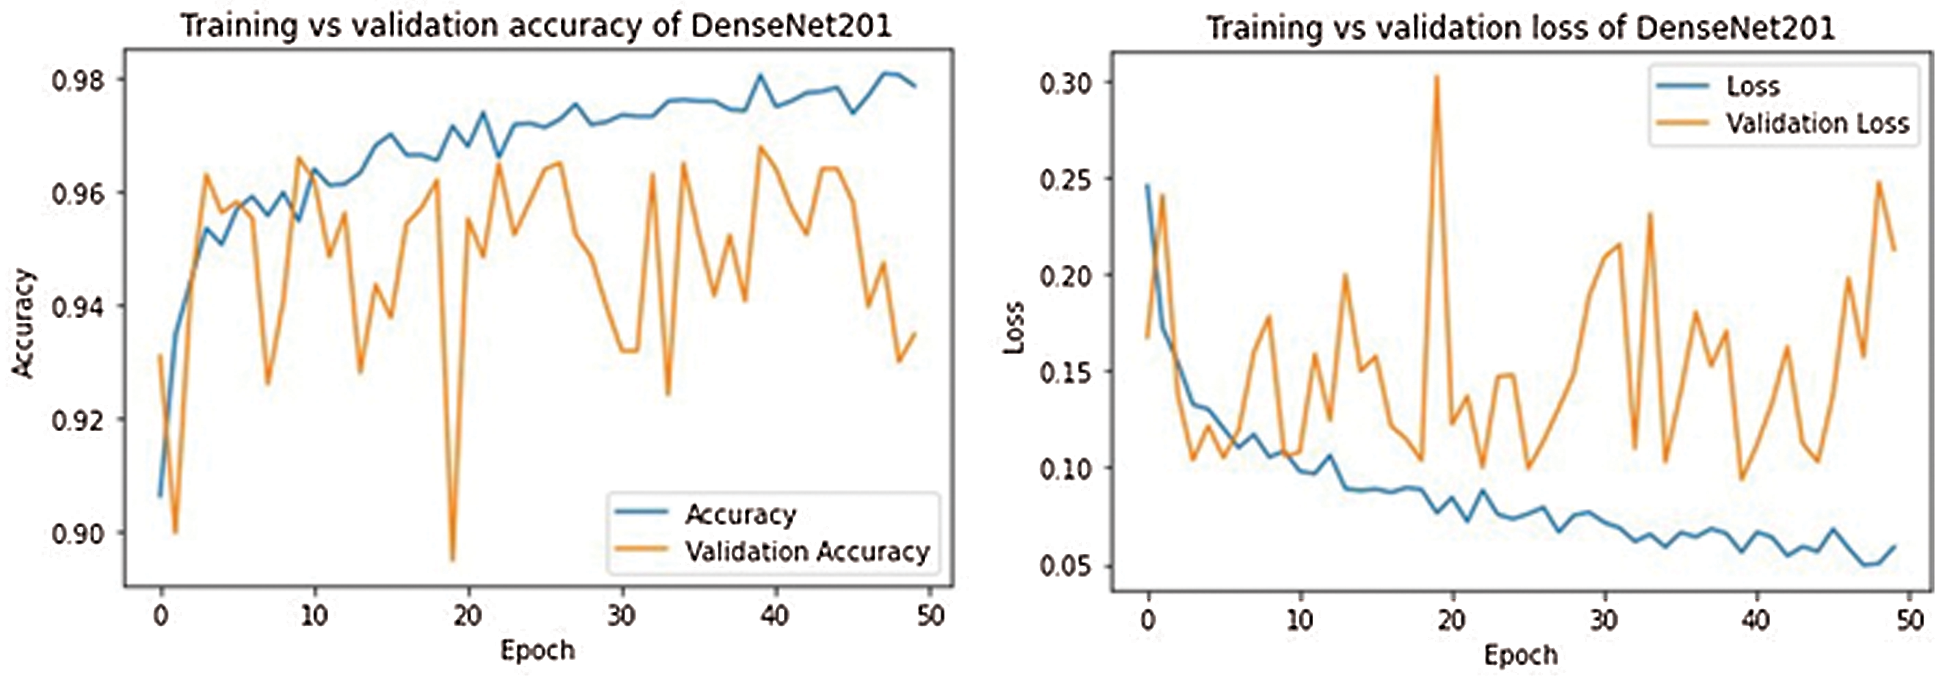
Figure 10: Training-validation accuracy loss and loss of DenseNet201 model
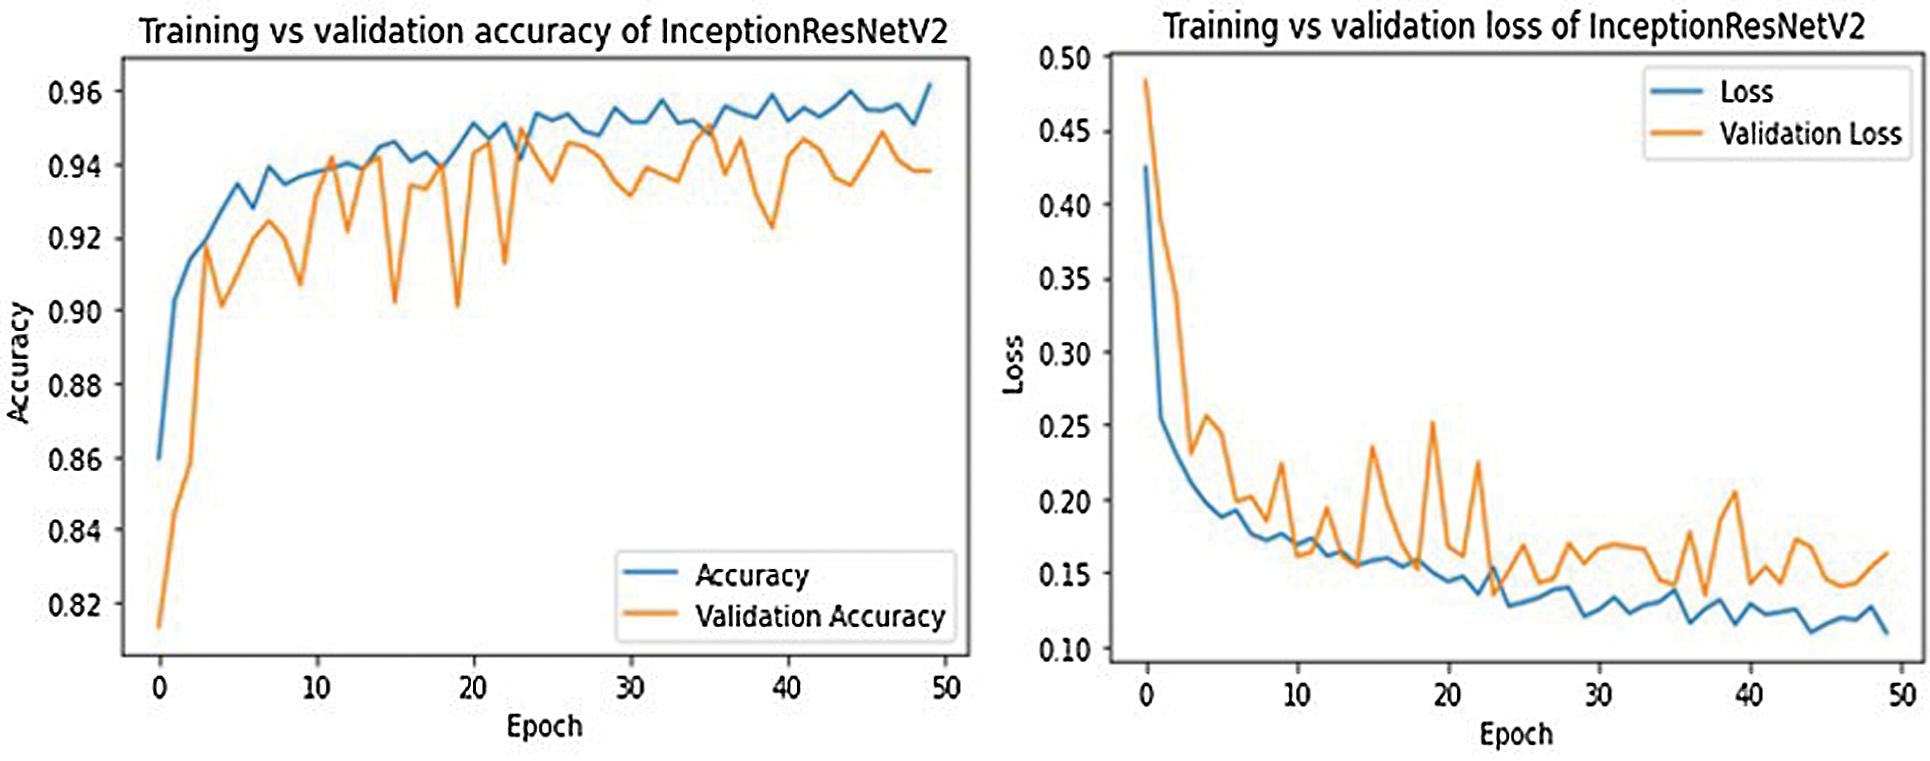
Figure 11: Training-validation accuracy loss and loss of InceptionResNetV2 model
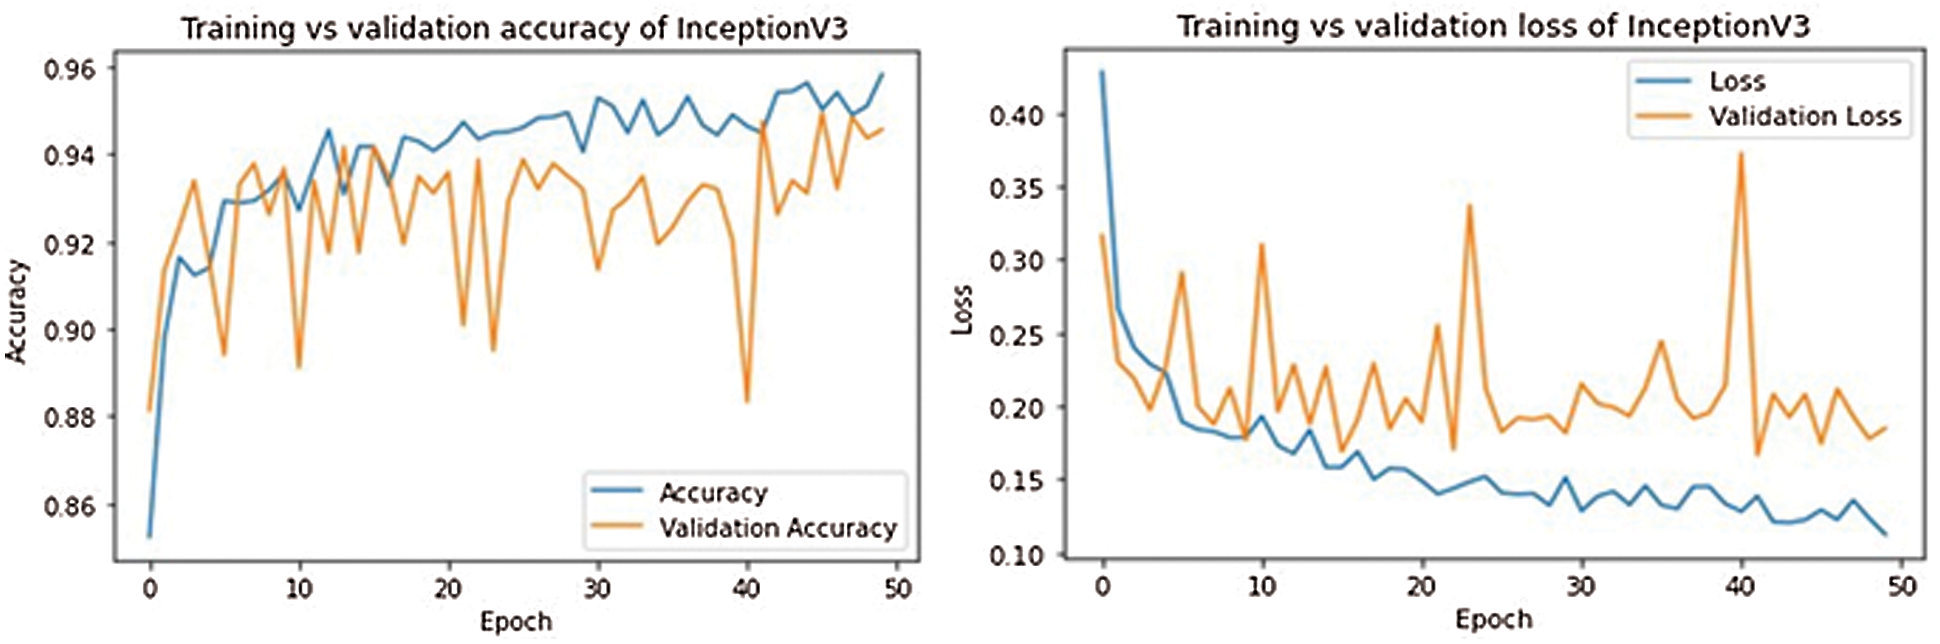
Figure 12: Training-validation accuracy loss and loss of InceptionV3 model

Figure 13: Training-validation accuracy loss and loss of DenseNet121 model
The confusion matrix is used for evaluating different classification metrics (e.g., precision, recall, F1-score and accuracy) which can be used to assess a model’s performance. Fig. 14 shows the confusion matrix for the five different models that have been used.

Figure 14: 3-class classification confusion matrix
Tab. 6 presents the classification performance result for our trained model for the three classes (COVID-19, NORMAL and PNEUMONIA). All the models have a very high performance when it comes to classifying COVID+ and pneumonia images, but to classifying the normal images the performance is slightly lower than COVID+ and pneumonia images. DenseNet121 and DenseNet201 have better precision, recall (sensitivity), and F1-Score when it comes to classifying COVID+ and Pneumonia. Inceptionv3, DenseNet121, and DenseNet201 perform well in terms of precision, recall (sensitivity), and F1-Score in addition to classifying normal cases.

The validation accuracy, macro average (precision, recall, and F1 score) of various pre- trained models were compared in this study, as shown in Tab. 7. The macro-average is used to determine how well the system performs overall across data sets. The macro-average function computes F-1, Precision, and Recall for each label and provides the average without taking the proportion for each label in the data-set. DenseNet121 performed well with a model accuracy of 96.65%, followed by Inception v3 with a model accuracy of 96.40% and DenseNet121 with a classification accuracy of 96.02%. In terms of performance measures, all of the models perform well, but the DenseNet121 model shows consistently better results than other models in performance metrics (Precision 95%, Recall 96% and F1-Score 95%).

Tab. 8 compares our proposed work with notable works available in the literature. We compared the accuracy metric only since most of the work in the literature (as described in Tab. 8) reported the accuracy metric. It is also to be noted that along with accuracy, other performance metrics for our models are high.

In this article, a multi-classification deep CNN model was designed for detecting COVID infected, pneumonia and normal case. As there have been a number of misdiagnosis amongst healthy, COVID infected and pneumonia patients, our work focuses on models that can classify these three cases reliably. We applied different types of deep CNN architecture such as VGG16, InceptionResnetV2, DenseNet121, DenseNet201 and InceptionV3 after careful pre-processing. Using the COVID-19 and pneumonia patients data-set, we demonstrated a mechanism for selecting appropriate models of estimation and prediction of desired parameters. Empirical results demonstrate that DenseNet201 provides overall better performance with accuracy, recall, F1-score and precision of 94.75%, 96%, 95% and 95% respectively. After careful comparison with results available in the literature, we have found that our demonstrated model is much higher in accuracy and more reliable than others. In our future work, we aim to collect more dataset to enrich our model.
Funding Statement: The authors received no specific funding for this study.
Conflicts of Interest: The authors declare that they have no conflicts of interest to report regarding the present study.
1. S. F. Pedersen and Y. Ho, “Sars-cov-2: A storm is raging,” Journal of Clinical Investigation, vol. 130, no. 5, pp. 2202–2205, 2020. [Google Scholar]
2. T. Singhal, “A review of coronavirus disease-2019 (COVID-19),” Indian Journal of Pediatrics, vol. 87, no. 4, pp. 281–286, 2020. [Google Scholar]
3. “COVID-19 coronavirus pandemic,” [Online]. Available: https://www.worldometers.info/coronavirus/. [Google Scholar]
4. Y. R. Nobel, M. Phipps, J. Zucker, T. C. Wang, M. E. Sobieszczyk et al., “Gastrointestinal symptoms and coronavirus disease 2019: A case-control study from the United States,” Gastroenterology, vol. 159, no. 1, pp. 373–375, 2020. [Google Scholar]
5. A. N. Desai and P. Patel, “Stopping the spread of COVID-19,” JAMA Patient Page, vol. 323, no. 15, pp. 1516, 2020. [Google Scholar]
6. The global economy: On track for strong but uneven growth as COVID-19 still weighs, 2021. [Online]. Available: https://www.worldbank.org/en/news/feature/2021/06/08/the-global-economy-on-track-for-strong-but-uneven-growth-as-covid-19-still-weighs. [Google Scholar]
7. R. S. Khan and I. U. Rehman, “Spectroscopy as a tool for detection and monitoring of coronavirus (COVID-19),” Expert Review of Molecular Diagnostics, vol. 20, no. 7, pp. 647–649, 2020. [Google Scholar]
8. J. Akst, “RNA extraction kits for COVID-19 tests are in short supply in US,” 2020. [Online]. Available: https://www.the-scientist.com/news-opinion/rna-extraction-kits-for-covid-19-tests-are-in-short-supply-in-us-67250. [Google Scholar]
9. N. Jawerth, “How is the COVID-19 virus detected using real time RT-PCR,” 2020. [Online] Available: https://www.iaea.org/sites/default/files/6120811.pdf. [Google Scholar]
10. S. Ahuja, B. K. Panigrahi, N. Dey, V. Rajinikanth and T. K. Gandhi, “Deep transfer learning-based automated detection of COVID-19 from lung CT scan slices,” Applied Intelligence, vol. 51, no. 1, pp. 571–585, 2021. [Google Scholar]
11. M. Bajoghli, F. Bajoghli, N. Tayari and R. Rouzbahani, “Children, CT scan and radiation,” International Journal of Preventive Medicine, vol. 1, no. 4, pp. 220–222, 2010. [Google Scholar]
12. “Radiation risk from medical imaging,” 2021. [Online]. Available: https://www.health.harvard.edu/cancer/radiation-risk-from-medical-imaging. [Google Scholar]
13. E. A. Akl, I. Blažić, S. Yaacoub, G. Frija, R. Chou et al., “Use of chest imaging in the diagnosis and management of COVID-19: A WHO rapid advice guide,” Radiology, vol. 298, no. 2, pp. E63–E69, 2021. [Google Scholar]
14. P. Patel, “Chest X-ray (COVID-19 & pneumonia),” 2020. [Online]. Available: https://www.kaggle.com/prashant268/chest-xray-covid19-pneumonia. [Google Scholar]
15. R. Yousefzai and A. Bhimaraj, “Misdiagnosis in the COVID-19 era: When zebras are everywhere, don’t forget the horses,” JACC: Case Reports, vol. 2, no. 10, pp. 1614–1619, 2020. [Google Scholar]
16. M. Z. C. Azemin, R. Hassan, M. I. M. Tamrin and M. A. M. Ali, “COVID-19 deep learning prediction model using publicly available radiologist-adjudicated chest X-ray images as training data: Preliminary findings,” International Journal of Biomedical Imaging, vol. 2020, pp. 1–7, 2020. [Google Scholar]
17. M. Nishio, S. Noguchi, H. Matsuo and T. Murakami, “Automatic classification between COVID-19 pneumonia, non-COVID-19 pneumonia, and the healthy on chest X-ray image: Combination of data augmentation methods,” Scientific Reports, vol. 10, no. 1, pp. 1–6, 2020. [Google Scholar]
18. M. M. Rahaman, C. Li, Y. Yao, F. Kulwa, M. A. Rahman et al., “Identification of COVID-19 samples from chest X-ray images using deep learning: A comparison of transfer learning approaches,” Journal of X-ray Science and Technology, vol. 28, no. 5, pp. 821–839, 2020. [Google Scholar]
19. A. I. Khan, J. L. Shah and M. M. Bhat, “Coronet: A deep neural network for detection and diagnosis of COVID-19 from chest X-ray images,” Computer Methods and Programs in Biomedicine, vol. 196, no. 18, pp. 9, 2020. [Google Scholar]
20. E. Erdem and T. Aydın, “COVID-19 detection in chest X-ray images using deep learning,” Research Square (Preprint), 2020. [Google Scholar]
21. M. D. K. Hasan, S. Ahmed, Z. M. E. Abdullah, M. M. Khan, D. Anand et al., “Deep learning approaches for detecting pneumonia in COVID-19 patients by analyzing chest X-ray images,” Mathematical Problems in Engineering, vol. 2021, no. 1, pp. 8, 2021. [Google Scholar]
22. A. Abbas, M. M. Abdelsamea and M. M. Gaber, “Classification of COVID-19 in chest X-ray images using detrac deep convolutional neural network,” Applied Intelligence, vol. 51, no. 2, pp. 854–864, 2021. [Google Scholar]
23. L. Wang, Z. Q. Lin and A. Wong, “COVID-Net: A tailored deep convolutional neural network design for detection of COVID-19 cases from chest X-ray images,” Scientific Reports, vol. 10, no. 1, pp. 1–12, 2020. [Google Scholar]
24. M. U. Hassan, “VGG16-convolutional network for classification and detection,” 2018. [Online]. Available: https://neurohive.io/en/popular-networks/vgg16/. [Google Scholar]
25. V. Kurama, “A review of popular deep learning architectures: ResNet, InceptionV3, and SqueezeNet,” 2020. [Online]. Available: https://blog.paperspace.com/popular-deep-learning-architectures-resnet-inceptionv3-squeezenet/. [Google Scholar]
26. A. Arora, “DenseNet architecture explained with PyTorch implementation from TorchVision 2020,” [Online]. Available: https://amaarora.github.io/2020/08/02/densenets.html. [Google Scholar]
27. C. Szegedy, S. Ioffe, V. Vanhoucke and A. A. Alemi, “Inception-v4, Inception-ResNet and the impact of residual connections on learning,” in Thirty-first AAAI Conf. on Artificial Intelligence, San Francisco, CA, USA, 2017. [Google Scholar]
 | This work is licensed under a Creative Commons Attribution 4.0 International License, which permits unrestricted use, distribution, and reproduction in any medium, provided the original work is properly cited. |