DOI:10.32604/csse.2023.025336
| Computer Systems Science & Engineering DOI:10.32604/csse.2023.025336 | |
| Article |
Energy Aware Clustering with Medical Data Classification Model in IoT Environment
1Department of Computer Science and Engineering, Cheran College of Engineering, K. Paramathi, Karur, 639111, India
2Department of Information Technology, Kongu Engineering College, Perundurai, Erode, 638060, India
*Corresponding Author: R. Bharathi. Email: bharathiphd2017@gmail.com
Received: 20 November 2021; Accepted: 06 January 2022
Abstract: With the exponential developments of wireless networking and inexpensive Internet of Things (IoT), a wide range of applications has been designed to attain enhanced services. Due to the limited energy capacity of IoT devices, energy-aware clustering techniques can be highly preferable. At the same time, artificial intelligence (AI) techniques can be applied to perform appropriate disease diagnostic processes. With this motivation, this study designs a novel squirrel search algorithm-based energy-aware clustering with a medical data classification (SSAC-MDC) model in an IoT environment. The goal of the SSAC-MDC technique is to attain maximum energy efficiency and disease diagnosis in the IoT environment. The proposed SSAC-MDC technique involves the design of the squirrel search algorithm-based clustering (SSAC) technique to choose the proper set of cluster heads (CHs) and construct clusters. Besides, the medical data classification process involves three different subprocesses namely pre-processing, autoencoder (AE) based classification, and improved beetle antenna search (IBAS) based parameter tuning. The design of the SSAC technique and IBAS based parameter optimization processes show the novelty of the work. For showcasing the improved performance of the SSAC-MDC technique, a series of experiments were performed and the comparative results highlighted the supremacy of the SSAC-MDC technique over the recent methods.
Keywords: Internet of things; healthcare; medical data classification; energy efficiency; clustering; autoencoder
More recent techniques, like smart devices, mobile applications, wearable devices, blockchain-based electronic medical recording systems home virtual assistants, biosensors, are initiating a modern era in health care service [1]. By connecting sensor nodes to mobile devices, several parameters could be interpreted and read properly and transferred to healthcare centres. Now, there are several reports about early launch and on-going development of a number of “smart” healthcare devices for diabetes mellitus (diabetes) such as “smart syringe pen”, “smart pills” and “smart inhaler” [2]. At the same time, biosensor is other essential application of the on-going digital transformation in healthcare. There is a wide-ranging biosensor which transmits healthcare data to web and mobile applications through wireless networks [3]. In this method, medical staffs have the possibility to monitor health status and control patient treatment outside the hospitals. The integration of IoT and Cloud is included in making efficient medical domain to monitor the patients and hospital centres [4]. Cloud IoT upgrades the health care applications by making collaborations among distinct units [5]. Under the use of Cloud IoT in medical industry, it is likely to distribute several applications such as sending the data to Cloud, WSN to collect delicate medical information, and subsequently examine the information for extracting valuable details with data analytics. The key characteristic of Cloud IoT in healthcare is to provide continuous medical services with decreased operation costs [6]. From the ubiquitous nature of medical systems, large number of information was generated by the sensor network that requires efficient management and continue with other data analytics [7].
Furthermore, medical sensor and IoT devices readings could be effectively employed in detecting a severe disease within a certain time period. The syntax is determined to carry out the detection method in the cloud-centric platform. The three sub-systems are developed for carrying out disease diagnosis procedures [8]. First, medical sensor and IoT device-based readings are attained by user subsystems. Next, for component-based, data analysis cloud sub-system is determined for carrying out disease diagnosis procedures. Finally, distinct alert-based signals are transmitted to caregiver and responder to take further actions according to the outcomes computed at the cloud sub-system [9]. In medical industry, IoT employs a wide historical dataset of continuous measurement during a certain period for disease diagnoses. The diagnoses in a health care environment require a collection of measurements for efficient outcomes that is impossible to have a single hospital visit [10].
Verma et al. [11], proposed a cloud-centric IoT based m-health care monitoring disease diagnosis architecture that forecasts the possible disease with its severity level. Main terminologies are determined for generating user-oriented healthcare measurement by examining the concepts of computation science. The architecture model for smart student health care is developed for the application scenarios. In Akhbarifar et al. [12], the patients’ health care status can be described by forecasting critical situations via data mining models to analyze their biological data sensed using smart healthcare IoT devices where a lightweight secured block encryption method is exploited to guarantee the patient sensitive information becomes secured. Lightweight block encryption approaches have a critical effect on these kinds of systems because of the limited resource in IoT platforms. Sattar et al. [13] present a novel energy effective cluster enabled clinical decision support system (EEC-CDSS) for embedded IoT environments. Additionally, the IoT device transmits the information to the cloud environment wherever the real classification process is executed. Ullah et al. [14] propose a clustering method for privacy-aware data dissemination based medical health care-IoT (MH-IoT) system for wireless networks. The presented method is compared to distinct ML methods with average data sets for patient data privacy once physician's review their healthcare reports.
Kumar et al. [15] present an advanced IoT and Cloud based Mobile Healthcare application to diagnose and monitor severe disease. Now, a novel architecture is proposed for the public. In the study, a novel systematic model is employed for the diabetes disease and the relevant healthcare information is created by the UCI Repository data set and the healthcare sensor to predict the individuals who had a serious impact with diabetes. Furthermore, introduce a novel classification method termed Fuzzy Rule based Neural Classifier to diagnose the severity and the disease. Verma et al. [16] developed the remote patient healthcare monitoring system in smart homes by utilizing the concepts of fog computing at the smart gateways. The presented method employs innovative services and techniques, like distributed storage, notification services, and at embedded data mining the edge network. The event triggering-based data communication method is adapted for processing the patient actual information at the fog layer.
This study designs a novel squirrel search algorithm based on energy aware clustering with medical data classification (SSAC-MDC) model in an IoT environment. The proposed SSAC-MDC technique involves the design of the squirrel search algorithm based clustering (SSAC) technique to choose proper set of cluster heads (CHs) and construct clusters. Moreover, the medical data classification process involves three different subprocesses namely pre-processing, autoencoder (AE) based classification, and improved beetle antenna search (IBAS) based parameter tuning. For showcasing the improved performance of the SSAC-MDC technique, a series of experiments were performed and the results are inspected extensively.
The rest of the paper is organized as follows. Section 2 offers the proposed model, Section 3 provides the result analysis, and Section 4 gives the conclusion.
In this study, an effective SSAC-MDC technique has been presented to accomplish energy efficiency and disease diagnosis in the IoT environment. The proposed SSAC-MDC technique operates on three major phases namely data collection, SSAC based cluster construction, and medical data classification. Fig. 1 demonstrates the overall block diagram of SSAC-MDC approach. The roles and responsibilities of every layer are given in the following.
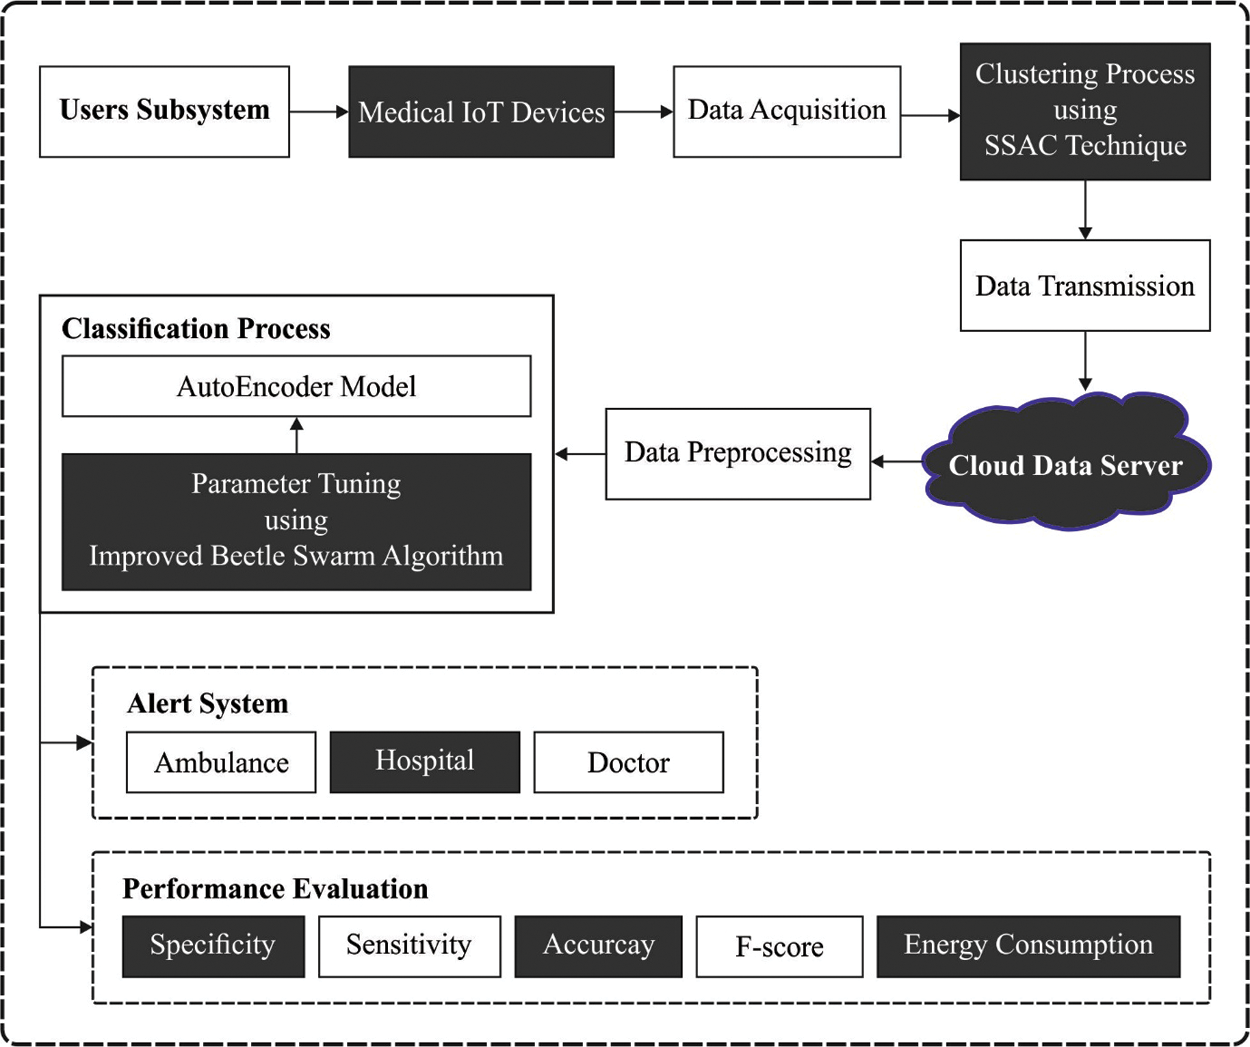
Figure 1: Overall process of SSAC-MDC technique
User healthcare information is collected by a data acquisition method that allows low-power sensors, alternate medical gadgets, and a seamless combination of smart. These sensors are integrated with, and around the human body to monitor the function. In this approach, a user body sensor is comprised of implanted and wearable sensors. All the sensors have been concatenated with bio-sensors such as Blood pressure (BP), and ECG EEG, etc. For maintaining data security during transmission, a network is secured by Secure Socket Layer (SSL) to provide privacy and security. The timestamp synchronization of dissimilar classes of sensor nodes has been implemented.
2.2 Energy Aware Clustering Using SSAC Technique
The typical SSA upgrades the places of individuals based on the present season [17], the kind of individuals, and if the predator performs. Let the amount of population is N, the upper as well as lower bounds of search spaces were FSu and FSL.N represents the individuals are arbitrarily created dependent upon in Eq. (1):
FSi implies the ith individual, (i = 1…N) ;rand refers to the arbitrary number amongst zero and one, D represents the dimension of the problem. The individuals upgrade their places with gliding for hickory or acorn trees. The particular upgrading equations are demonstrated as Eqs. (2) & (3) correspondingly:
r refers to the arbitrary number amongst zero and one. Pdp value of 0.1 defines the predator form probability, once r > Pdp, afterward no predator performs, the squirrels glide under the forest for finding the food, and individuals were safe when r ≤ Pdp, the predators’ act, the squirrels were required for narrowing the scope of performances, an individuals were endangered, and its places were transferred arbitrarily, t stands for the exiting round, Gc signifies the constant with the value of 1.9, Fai (i = 1, 2, …Nfs) has individual arbitrarily chosen in Fa, dg denotes the gliding distance that is computed in Eq. (4):
hg indicates the constant valued 8, ⋅ sf implies the constant value of 18, tan(φ) demonstrates the gliding angle that is computed in Eq. (5):
D refers to the drag force and L stands for the lift force that is computed in Eqs. (6) and (7) correspondingly:
ρ, V, S and CD represents every constant that is equivalent to 1.204 kg m−3, 5.25 ms−1, 154 cm2 and 0.6 correspondingly, CL implies the arbitrary number amongst 0.675 as well as 1.5. Fig. 2 depicts the flowchart of SSA. Initially of all iterations, the classical SSA needs that entire populations are in winter. If every individual was upgraded, because the season alters are judged dependent upon in Eqs. (8) and (9):
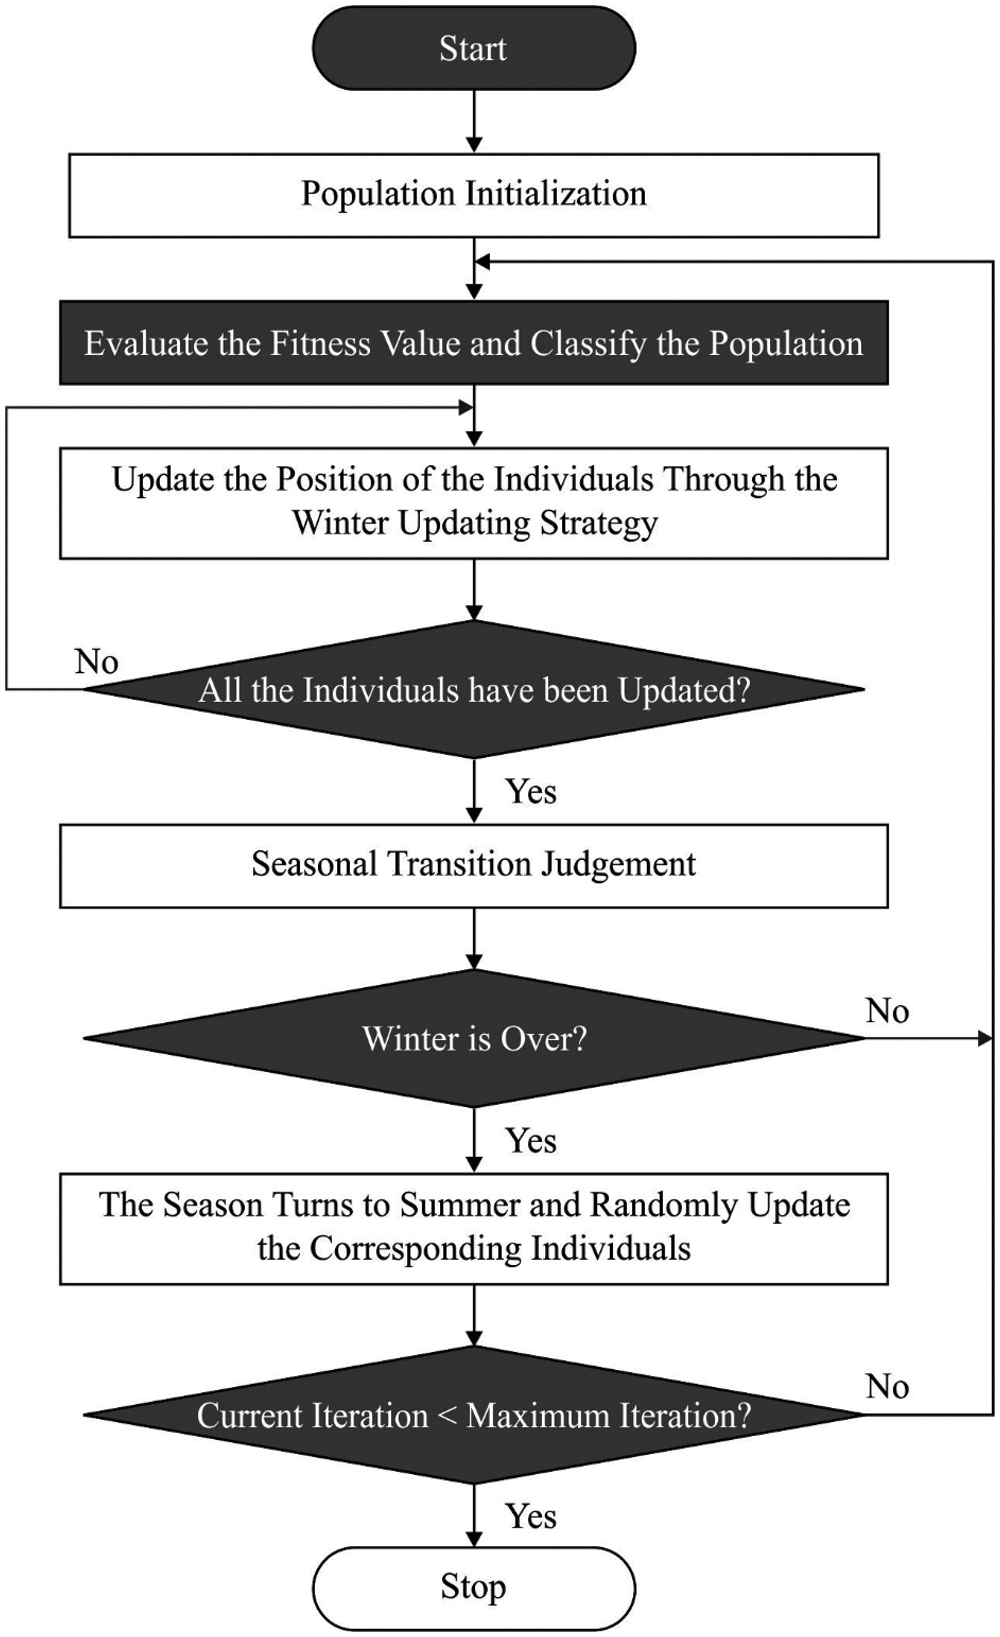
Figure 2: Flowchart of SSA
T refers to the maximal amount of iterations, when
If the season goes to summer, every individual that glide to Fh stay at the upgraded place and every individual that glide to Fa and does not happen with predator transfer its places in Eq. (10):
The Levy is a random walk system that step obey Levy distribution and is computed in Eq. (11):
β signifies the constant valued 1.5, σ has estimated in Eq. (12):
Assume that the IoT system of n sensor is randomly proposed. For CH selection, the developed SSA employs a squirrel population i.e., deployed by making proper cluster and retaining the decreased energy consumption of the network. Consider
Let popt be the suggested percentage of CHs, and rand signifies uniform arbitrary number within [0, 1]. The arbitrarily located sensors are organized as K clusters: C1, C2, …, CK. The CH selection is accountable for minimizing the cost of FF,
Using:
While
2.3 Medical Data Classification Model
At this stage, the collected medical data are examined in different ways to determine the existence of the diseases. The medical data classification module involves data preprocessing, AE based classification, and IBSA based parameter tuning.
Initially, the data value was gathered in the UCI dataset afterward pre-processed that needs noise elimination or exchange of missing data. The noiseless data use for efficiently detecting designs linked with heart disease. The median studentized remaining manner was implemented for removing unwanted or noisy data as it examines the connection amongst data from the dataset. This procedure of noise elimination improves the detection procedure of heart disease. The primary step is for examining the data obtainable from the dataset and computing the median to the missing value [19]. The median value was defined as placing the data as to ascending order, and afterward, the mid-value was computed. The missing and distinct values were changed for helping the median value. The data has standardized from the range zero to one, then eliminating the missing value for reducing the complexity of estimating the designs of heart disease (HD). The remaining studentized manner was utilized as a normalized procedure dependent upon the computation of standard deviation (SD). The normalized method occurs with several data distributions and regression analysis to HD forecast.
2.3.2 Autoencoder Based Classification
During the classification process, the AE model receives the preprocessed data as input and classifies the data into distinct classes. As a foundation of the DL method, DNNs or so-called multilayer perceptron (MLP), are utilized for representing a complicated model relating data outputs
whereas
AE is an unsupervised learning method where the specific architecture of DNN is leveraged to representation learning or dimensionality reduction. Especially, the aim is to optimally copy its input to output with the representation feature by presenting a lower-dimension embedding layer (or named as a code). An AE contains a decoder function hdec(.; θdec): ℝp → ℝd and encoder function henc(.;θenc) : ℝd → ℝp, as follows
Whereas p < d represent the embedding dimension, θenc and θdec indicates the DNN coefficient of encoder and decoder parts, correspondingly, as well as X denotes the output of the AE, a x reconstruction of the original input. Using the latent dimension p much lesser than the input dimension d, the encoder henc is trained for learning the compressed representation of x, represented as the embedding x′ ∈ ℝp, in which the decoder hdec reconstruct the input data via mapping the embedding representation back to the higher-dimension space. Noted that other dimensionality reduction methods, the employment of AE is depending on the manifold hypothesis that assumes that the provided higher-dimension input data lies on a lower-dimension manifold
2.3.3 Parameter Tuning Using IBSA Technique
For improvising the classifier results of the AE model, the parameter tuning process takes place using IBSA technique. In BAS method, uses the succeeding 2 rules stimulated by the behaviors of beetle search with antennae that include detecting and searching behaviors. Note that the beetle searches arbitrarily to examine an unknown environment.
Step 1: consider that the location of the longicorn beetle in n-dimension solution space is = (x1, x2, …, xn), for modelling the searching behavior, as well as proposed an arbitrary direction of beetle searching:
whereas rand (n, 1) represent an n-dimension vector of arbitrary value within [0, 1]
Step 2: proposed the search behavior of left-and right-hand sides, correspondingly, for imitating the activity of the beetle antennae:
whereas xk indicates the present location of longicorn beetles, d denotes the distance from the center of mass to the antennae,
Step 3: location upgrade technique:
Let δk be the existing step size, sign represent a symbolic function, as well as f indicates the function to be improved.
To improve the efficiency of the BSA, the IBSA is derived by the use of oppositional based learning (OBL) concepts. Each nature inspired meta-heuristic algorithm selects the first parameter arbitrarily as the candidate solution. Usually, the random population selection method follows a uniform distribution system. As the learning algorithm follows the black box method and does not need any background data it starts enhancing the candidate solution to attain optimal results until predetermined condition isn't attained. The efficacy of this algorithm is confined to amount of time taken by validating all candidate solutions within the searching region to attain nearby optimum solutions as global optimal. To achieve global optimal all near optimum solutions have to be examined. Therefore, finding of nearby optimum solution as an early guess of parameter which isn't suitable inside the searching region.
Moreover, to increase the exploration ability within the searching region, assume opposite case concurrently with early guesses, next the probability of achieving a nearby optimum solution to global optimal rises [22]. To improve the exploration capacity and evade earlier convergence in local minimal, a novel evolutionary approach is developed, selected as space transformation search (STS). As per the STS process, the current searching space is reallocated to a new region for evaluating candidate solutions at two regions concurrently. STS method includes 4 methods such as oppositional based learning (OBL) is one of them. The OBL method is formulated in the following as X ∈ [P, Q], whereas X represents a real number and P, Q denotes the boundary values of search space.
Whereas,
In this section, a comprehensive results analysis of the SSAC-MDC technique take place on benchmark healthcare data. The results are inspected under different instances and IoT devices. Fig. 3 depicts the SENSy results analysis of the SSAC-MDC technique under distinct instances. The results indicated that the SSAC-MDC technique has provided increased values of SENSy. For instance, with 2000 instances, the SSAC-MDC technique has obtained maximum SENSy of 0.9703 whereas the KNN, NB, SVM, DT, and EEPSOC-ANN techniques have reached to minimum SENSy of 0.9260, 0.8790, 0.8320, 0.9330, and 0.9478 respectively. Tab. 1 offers a brief comparison study of the classification results under varying instance counts.
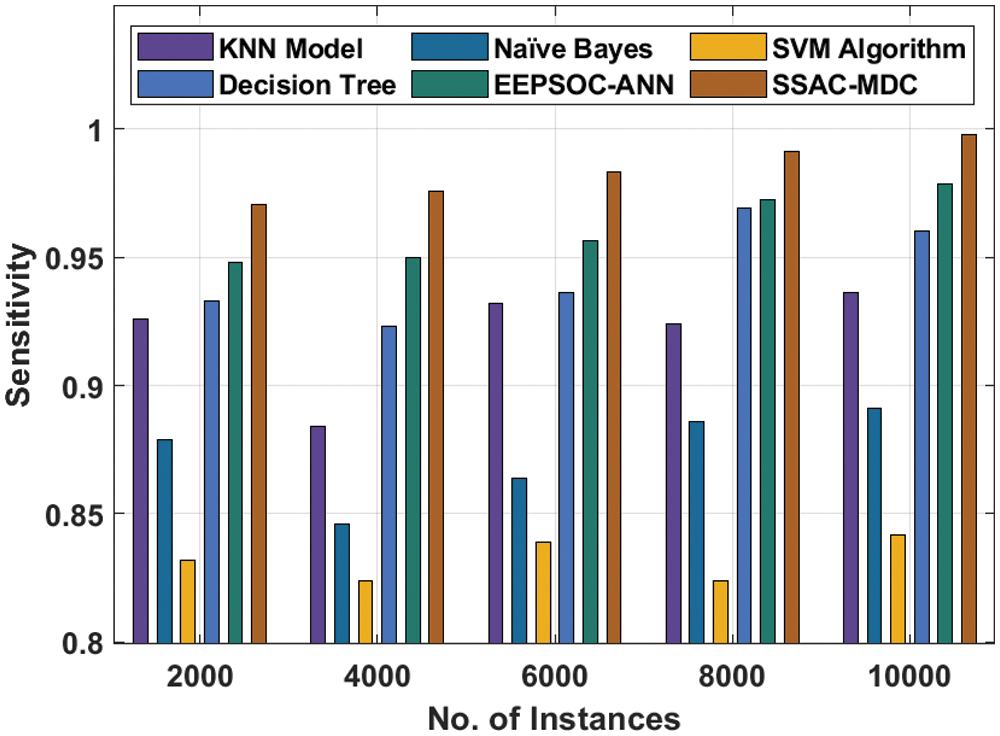
Figure 3: Sensy analysis of SSAC-MDC technique with existing manners
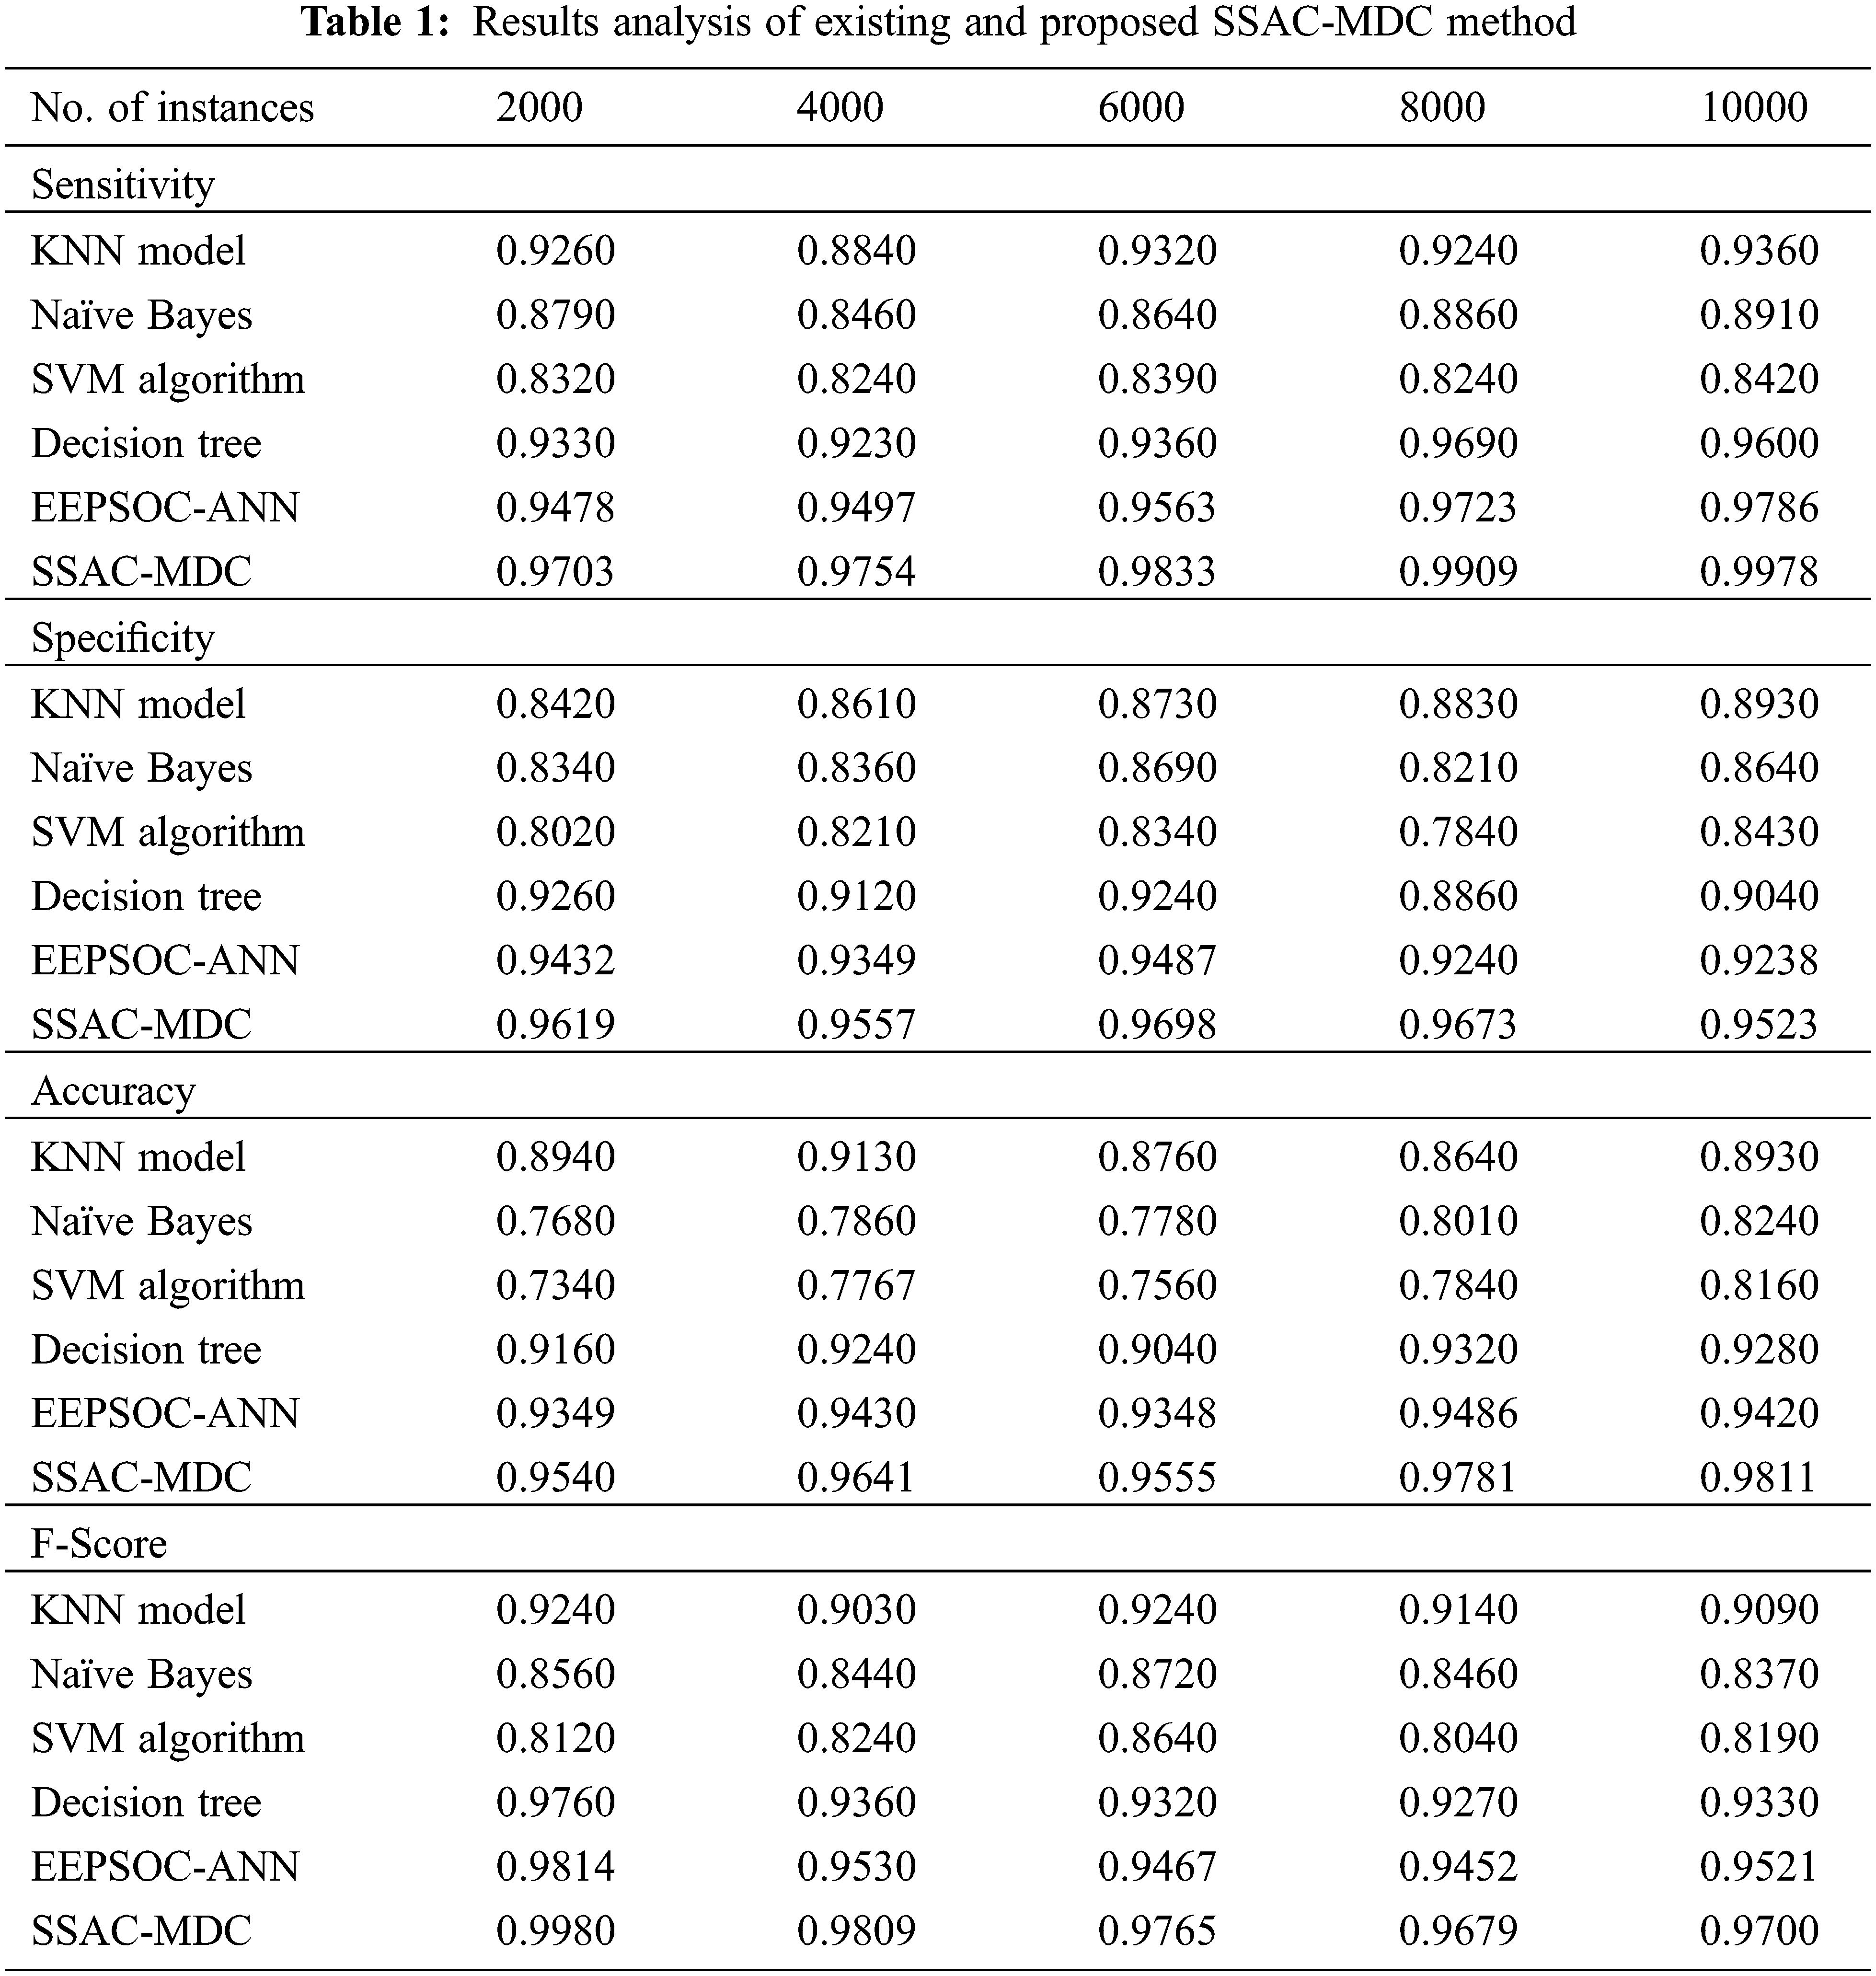
The comparative SPECy analysis of the SSAC-MDC technique under distinct instances is demonstrated in Fig. 4 and the experimental values portrayed that the SSAC-MDC technique has accomplished maximum performance. For instance, with 2000 instances, the SSAC-MDC technique has attained higher SPECy of 0.9619 whereas the KNN, NB, SVM, DT, and EEPSOC-ANN techniques have achieved lower SPECy of 0.8420, 0.8340, 0.8020, 0.9260, and 0.9432 respectively. Moreover, with 5000 instances, the SSAC-MDC technique has accomplished maximum SPECy of 0.9523 whereas the KNN, NB, SVM, DT, and EEPSOC-ANN techniques have reached to reduced SPECy of 0.8930, 0.8640, 0.8430, 0.9040, and 0.9238 respectively.
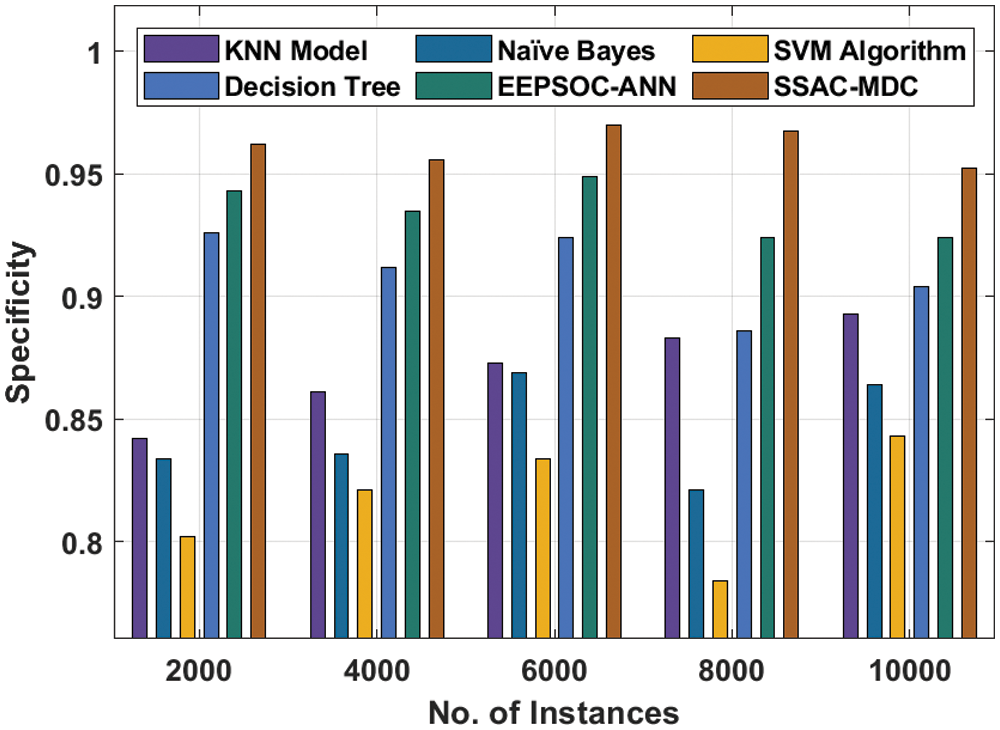
Figure 4: Specy analysis of SSAC-MDC technique with existing manners
Fig. 5 portrays the ACCy results analysis of the SSAC-MDC technique under distinct instances. The results specified that the SSAC-MDC technique has delivered improved values of ACCy. For instance, with 2000 instances, the SSAC-MDC technique has gotten supreme ACCy of 0.9540 whereas the KNN, NB, SVM, DT, and EEPSOC-ANN techniques have got inferior ACCy of 0.8940, 0.7680, 0.7340, 0.9160, and 0.9349 respectively. Furthermore, with 5000 instances, the SSAC-MDC technique has extended raised ACCy of 0.9811 whereas the KNN, NB, SVM, DT, and EEPSOC-ANN techniques have revealed lessened ACCy of 0.8930, 0.8240, 0.8160, 0.9280, and 0.9420 respectively.
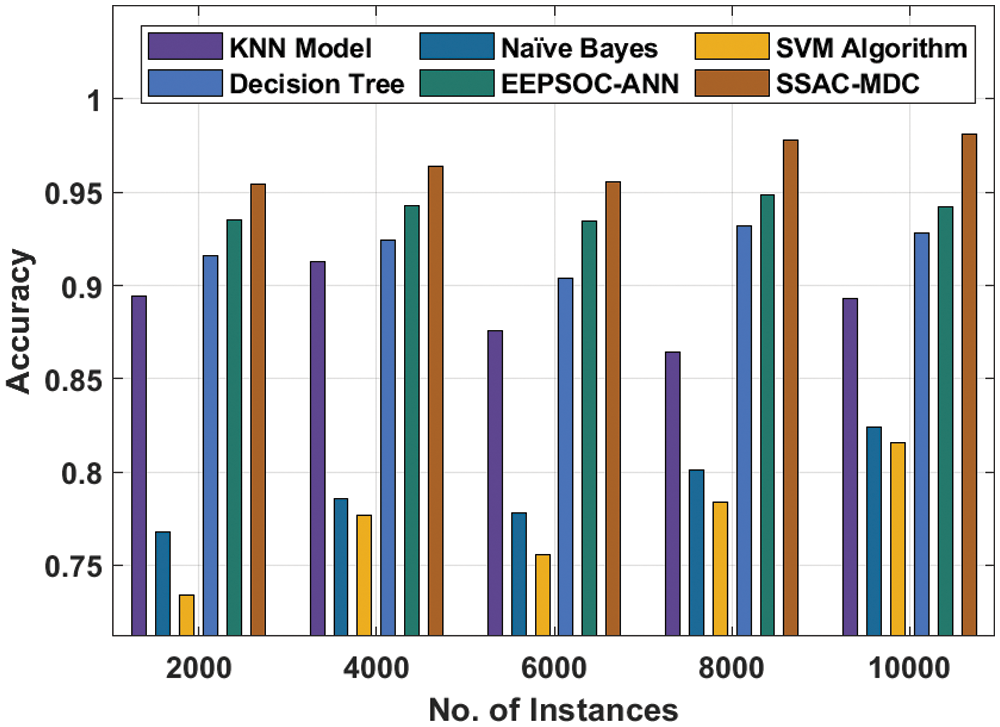
Figure 5: Accy analysis of SSAC-MDC technique with existing manners
Fig. 6 describes the FSCORE analysis of the SSAC-MDC technique under dissimilar instances. The results pointed out that the SSAC-MDC technique has reported maximum values of FSCORE. For instance, with 2000 instances, the SSAC-MDC technique has offered improved FSCORE of 0.9980 whereas the KNN, NB, SVM, DT, and EEPSOC-ANN techniques have reached to minimum FSCORE of 0.9240, 0.8560, 0.8120, 0.9760, and 0.9814 respectively. The accuracy results analysis of the SSAC-MDC technique on the test medical data is portrayed in Fig. 7. The results showcased that the SSAC-MDC technique has resulted in increased training and validation accuracies. It is observable that the SSAC-MDC technique has the ability to attain increased validation accuracy over training accuracy.
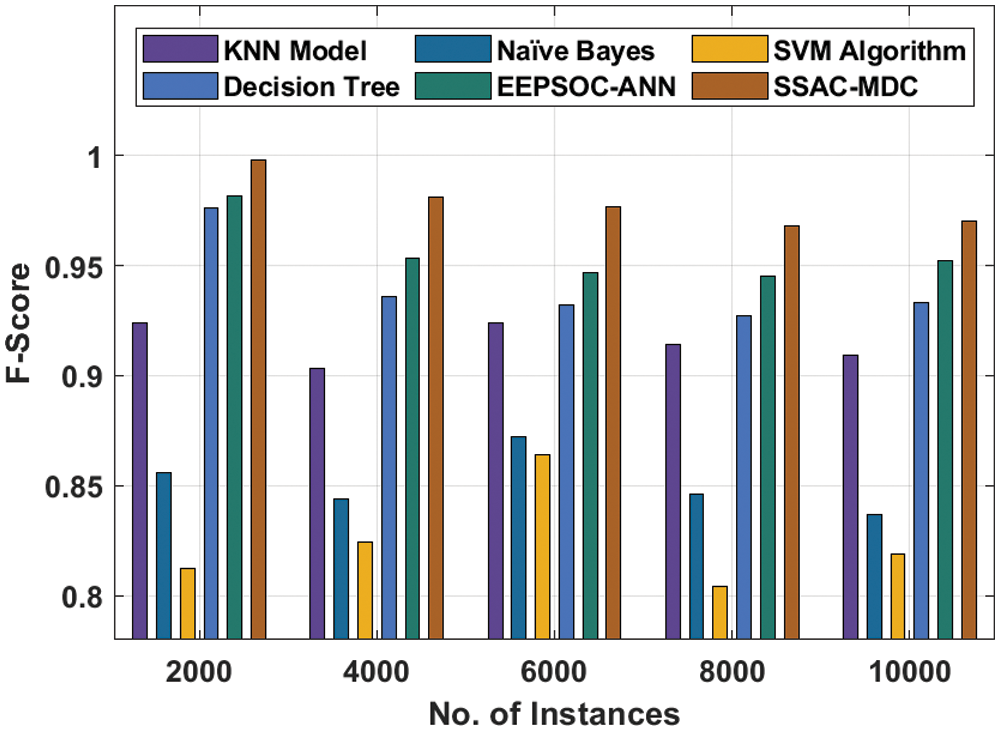
Figure 6: Fscore analysis of SSAC-MDC technique with existing manners
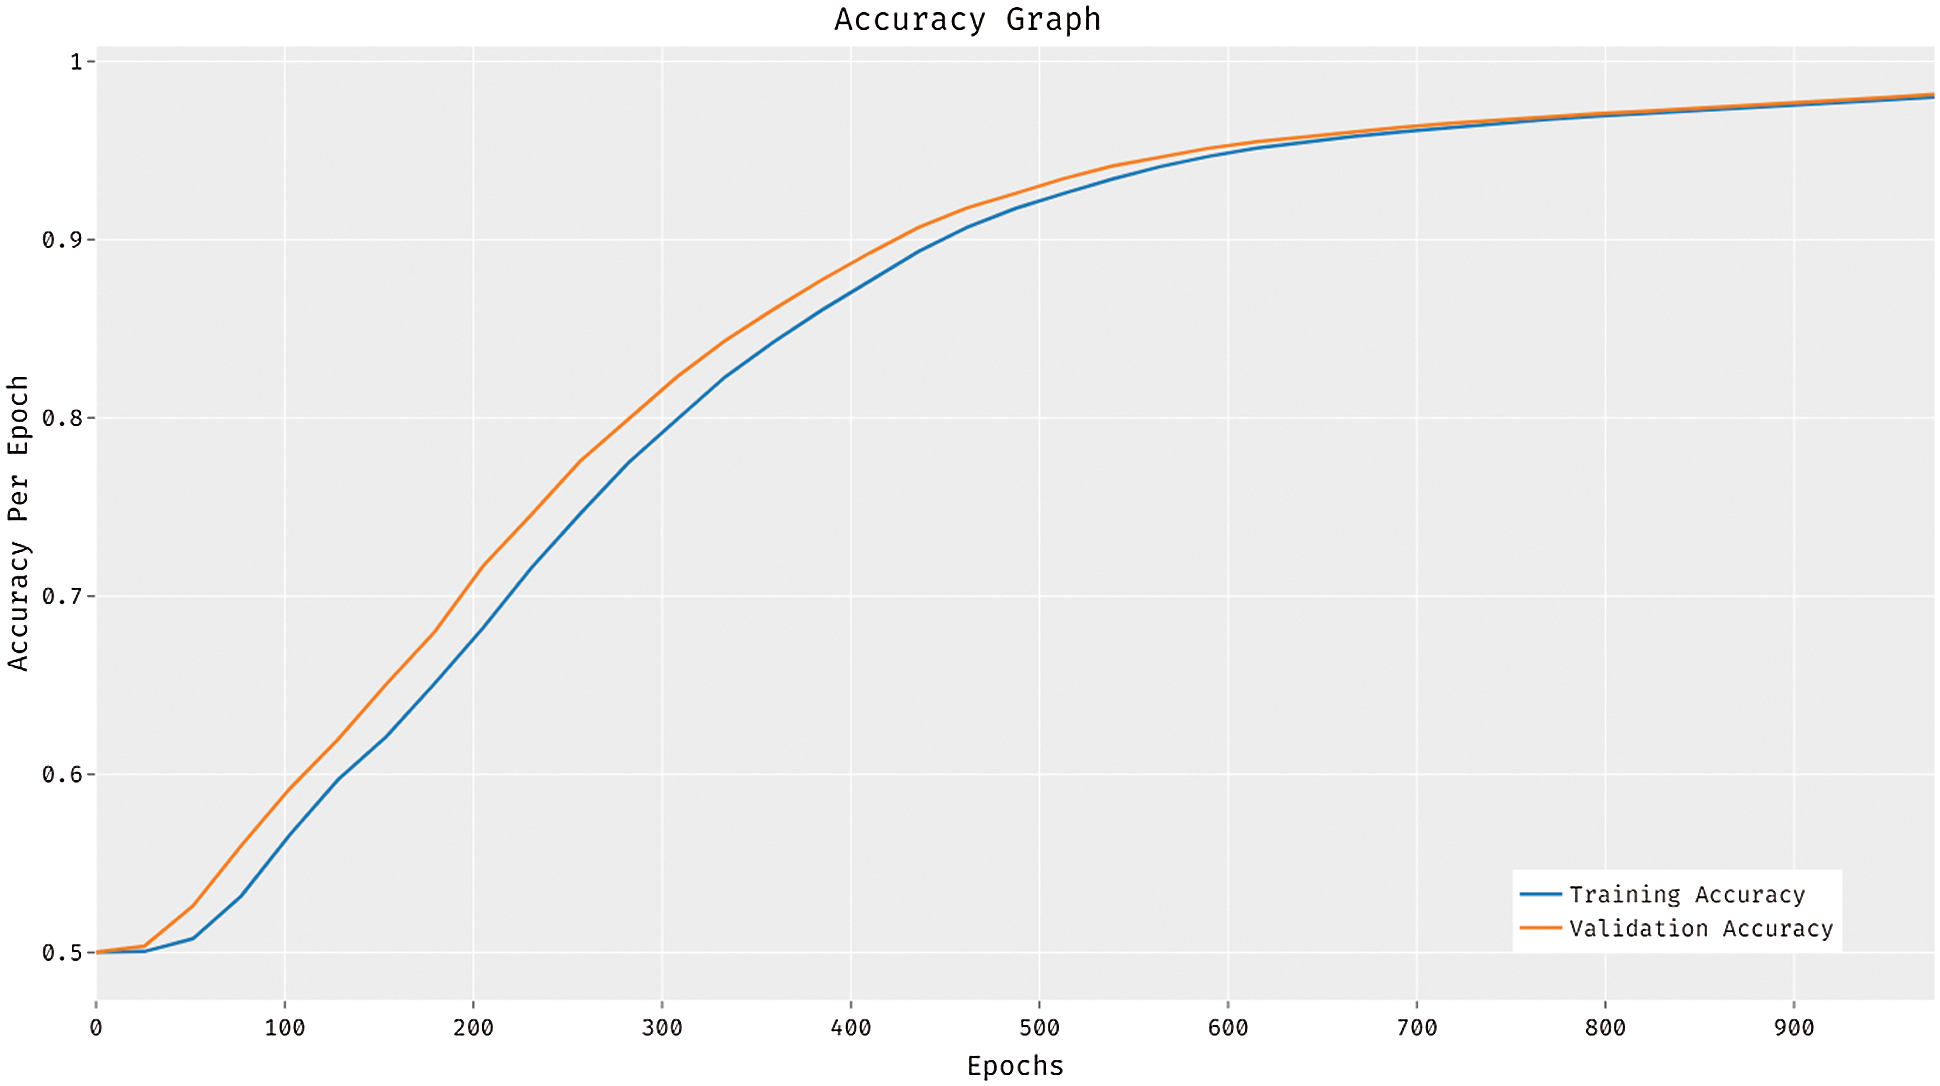
Figure 7: Accuracy graph analysis of SSAC-MDC technique
The loss results analysis of the SSAC-MDC technique on the test medical data is offered in Fig. 8. The figure indicated that the SSAC-MDC technique has gained reduced training and validation losses. It is noticeable that the SSAC-MDC technique has the capability of accomplishing decreased validation loss over training loss.
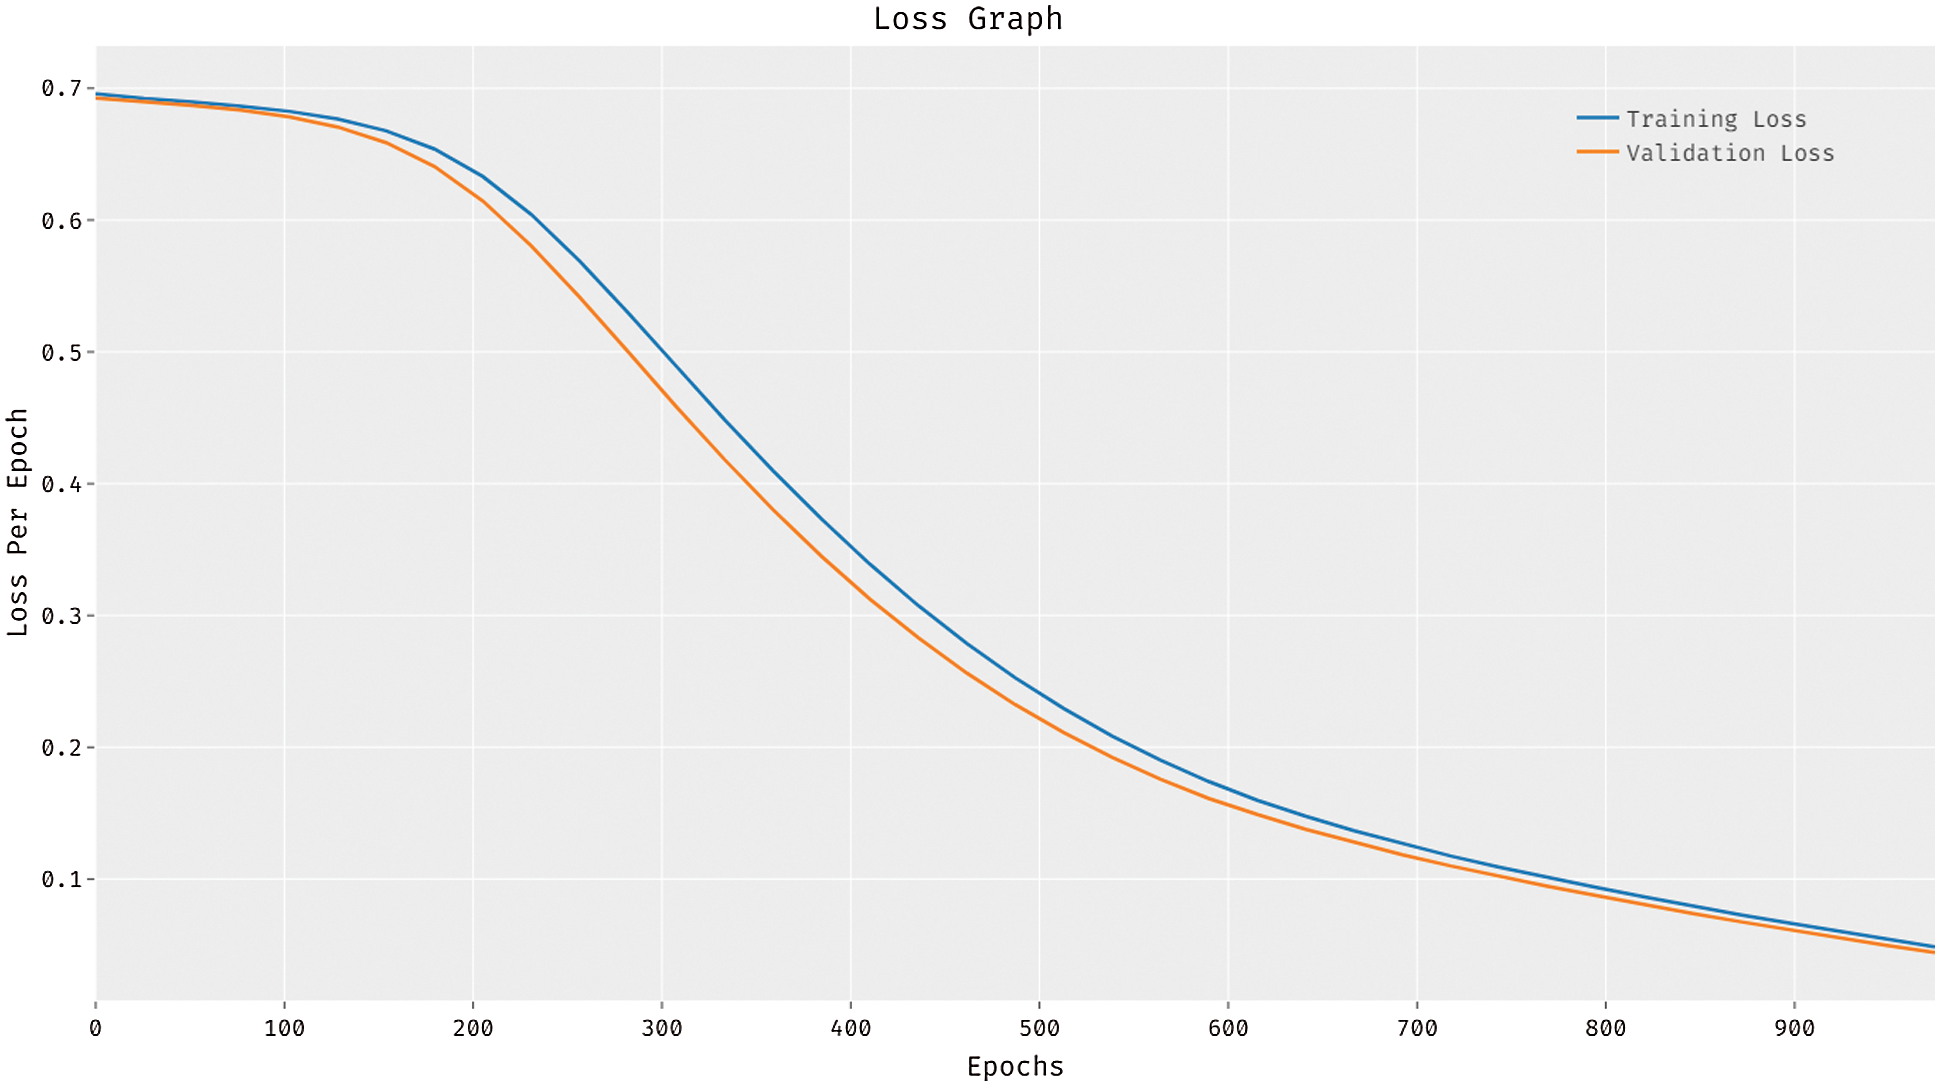
Figure 8: Loss graph analysis of SSAC-MDC approaches
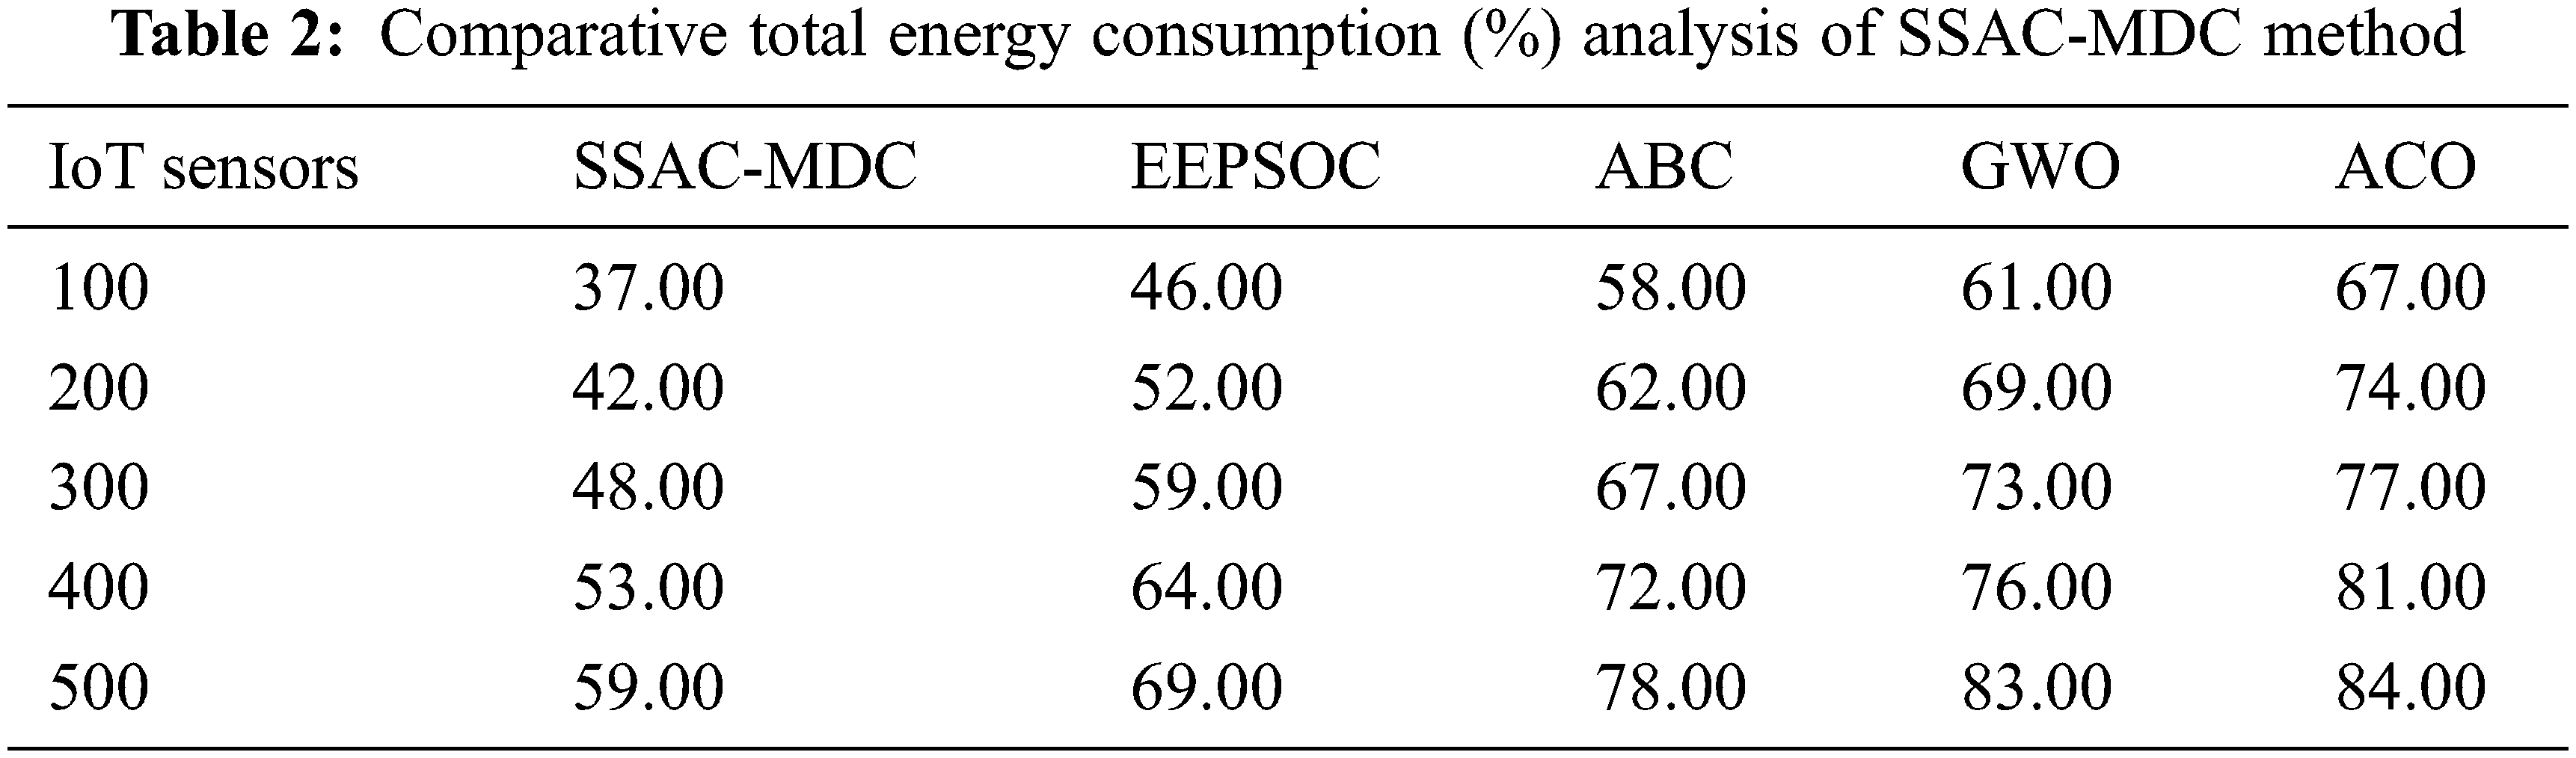
Lastly, a TEC analysis of the SSAC-MDC technique with recent methods is provided in Tab. 2 under the distinct number of IoT sensors. The experimental results stated that the SSAC-MDC technique has gained minimal TEC over the other techniques. For instance, with 100 IoT devices, the SSAC-MDC technique has gained a lower TEC of 37% whereas the EEPSOC, ABC, GWO, and ACO techniques have obtained higher TEC of 46%, 58%, 61%, and 67% respectively. These results analysis portrayed that the SSAC-MDC technique has the ability to attain maximum energy efficiency and medical data classification performance.
In this study, an effective SSAC-MDC technique has been presented to accomplish energy efficiency and disease diagnosis in the IoT environment. The proposed SSAC-MDC technique operates on three major phases namely data collection, SSAC based cluster construction, and medical data classification. During medical data classification process, the collected medical data are examined in different ways to determine the existence of the diseases. The medical data classification module involves data pre-processing, AE based classification, and IBSA based parameter tuning. For improvising the classifier results of the AE model, the parameter tuning process takes place using IBSA technique. For assessing the improved efficiency of the SSAC-MDC technique, a series of experimental analysis were performed and the comparative results highlighted the supremacy of the SSAC-MDC technique over the recent methods. In future, the classification results can be improvised by the design of outlier removal and feature selection approaches.
Funding Statement: The authors received no specific funding for this study.
Conflicts of Interest: The authors declare that they have no conflicts of interest to report regarding the present study.
1. M. A. Basset, G. Manogaran, A. Gamal and V. Chang, “A novel intelligent medical decision support model based on soft computing and IoT,” IEEE Internet Things Journal, vol. 7, no. 5, pp. 4160–4170, 2020. [Google Scholar]
2. A. F. Subahi, “Edge-based IoT medical record system: Requirements, recommendations and conceptual design,” IEEE Access, vol. 7, pp. 94150–94159, 2019. [Google Scholar]
3. P. Asghari, A. M. Rahmani and H. H. S. Javadi, “A medical monitoring scheme and health-medical service composition model in cloud-based IoT platform,” Transactions on Emerging Telecommunications Technologies, vol. 30, no. 6, pp. 1–25, 2019. [Google Scholar]
4. S. A. Alsuhibany, S. Abdel-Khalek, A. Algarni, A. Fayomi, D. Gupta et al., “Ensemble of Deep Learning Based Clinical Decision Support System for Chronic Kidney Disease Diagnosis in Medical Internet of Things Environment,” Computational Intelligence and Neuroscience, vol. 2021, pp. 1–13, 2021. [Google Scholar]
5. R. Ani, S. Krishna, N. Anju, M. S. Aslam and O. S. Deepa, “Iot based patient monitoring and diagnostic prediction tool using ensemble classifier,” in 2017 Int. Conf. on Advances in Computing, Communications and Informatics (ICACCI), Udupi, pp. 1588–1593, 2017. [Google Scholar]
6. A. Chandy, “A review on IoT based medical imaging technology for healthcare applications,” Journal of Innovative Image Processing, vol. 1, no. 1, pp. 51–60, 2019. [Google Scholar]
7. M. Ganesan and N. Sivakumar, “IoT based heart disease prediction and diagnosis model for healthcare using machine learning models,” in 2019 IEEE Int. Conf. on System, Computation, Automation and Networking (ICSCAN), Pondicherry, India, pp. 1–5, 2019. [Google Scholar]
8. G. Xu, Y. Lan, W. Zhou, C. Huang, W. Li et al., “An IoT-based framework of webvr visualization for medical big data in connected health,” IEEE Access, vol. 7, pp. 173866–173874, 2019. [Google Scholar]
9. A. Das, P. Rad, K. K. R. Choo, B. Nouhi, J. Lish et al., “Distributed machine learning cloud teleophthalmology IoT for predicting AMD disease progression,” Future Generation Computer Systems, vol. 93, pp. 486–498, 2019. [Google Scholar]
10. N. A. A. Abdellah and N. Thangadurai, “Real time application of iot for the agriculture in the field along with machine learning algorithm,” in 2020 Int. Conf. on Computer, Control, Electrical, and Electronics Engineering (ICCCEEE), Khartoum, Sudan, pp. 1–p, 2021. [Google Scholar]
11. P. Verma and S. K. Sood, “Cloud-centric IoT based disease diagnosis healthcare framework,” Journal of Parallel and Distributed Computing, vol. 116, pp. 27–38, 2018. [Google Scholar]
12. S. Akhbarifar, H. H. S. Javadi, A. M. Rahmani and M. Hosseinzadeh, “A secure remote health monitoring model for early disease diagnosis in cloud-based IoT environment,” Personal and Ubiquitous Computing, pp. 1–17. 2020. https://doi.org/10.1007/s00779-020-01475-3. [Google Scholar]
13. H. Sattar, I. S. Bajwa and U. F. Shafi, “An IoT assisted clinical decision support system for wound healthcare monitoring,” Computational Intelligence, 2021. https://doi.org/10.1111/coin.12482. [Google Scholar]
14. F. Ullah, I. Ullah, A. Khan, M. I. Uddin, H. Alyami et al., “Enabling clustering for privacy-aware data dissemination based on medical healthcare-IoTs (MH-IoTs) for wireless body area network,” Journal of Healthcare Engineering, vol. 2020, pp. 1–10, 2020. [Google Scholar]
15. P. M. Kumar, S. Lokesh, R. Varatharajan, G. C. Babu and P. Parthasarathy, “Cloud and IoT based disease prediction and diagnosis system for healthcare using fuzzy neural classifier,” Future Generation Computer Systems, vol. 86, pp. 527–534, 2018. [Google Scholar]
16. P. Verma and S. K. Sood, “Fog assisted-IoT enabled patient health monitoring in smart homes,” IEEE Internet Things Journal, vol. 5, no. 3, pp. 1789–1796, 2018. [Google Scholar]
17. M. Jain, V. Singh and A. Rani, “A novel nature-inspired algorithm for optimization: Squirrel search algorithm,” Swarm and Evolutionary Computation, vol. 44, pp. 148–175, 2019. [Google Scholar]
18. Y. Wang and T. Du, “An improved squirrel search algorithm for global function optimization,” Algorithms, vol. 12, no. 4, pp. 80, 2019. [Google Scholar]
19. M. A. Khan and F. Algarni, “A healthcare monitoring system for the diagnosis of heart disease in the IoMT cloud environment using MSSO-ANFIS,” IEEE Access, vol. 8, pp. 122259–122269, 2020. [Google Scholar]
20. A. Lucas, M. Iliadis, R. Molina and A. K. Katsaggelos, “Using deep neural networks for inverse problems in imaging: Beyond analytical methods,” IEEE Signal Processing Magazine, vol. 35, no. 1, pp. 20–36, 2018. [Google Scholar]
21. A. T. Khan, X. Cao, S. Li, B. Hu and V. N. Katsikis, “Quantum beetle antennae search: A novel technique for the constrained portfolio optimization problem,” Science China Information Science, vol. 64, no. 5, pp. 152204, 2021. [Google Scholar]
22. N. Panda and S. K. Majhi, “Oppositional salp swarm algorithm with mutation operator for global optimization and application in training higher order neural networks,” Multimedia Tools and Applications, 2021. http://doi.org/10.1007/s11042-020-10304-x. [Google Scholar]
 | This work is licensed under a Creative Commons Attribution 4.0 International License, which permits unrestricted use, distribution, and reproduction in any medium, provided the original work is properly cited. |