DOI:10.32604/csse.2023.025611
| Computer Systems Science & Engineering DOI:10.32604/csse.2023.025611 | |
| Article |
Breast Calcifications and Histopathological Analysis on Tumour Detection by CNN
1Department of Computer Science and Engineering, Paavai Engineering College, Pachal, Namakkal, 637018, Tamil Nadu, India
2Al-Nahrain University, Al-Nahrain Nanorenewable Energy Research Center, Baghdad, Iraq
3COMBA R&D Laboratory, Faculty of Engineering, Universidad Santiago de Cali, 76001, Cali, Colombia
4Department of Computer Science and Engineering, Kongu Engineering College, Perundurai, 638060, Tamil Nadu, India
5Department of Mathematics, Jaypee University of Engineering and Technology, Guna, 473226, Madhya Pradesh, India
*Corresponding Author: D. Banumathy. Email: baanumathyd@gmail.com
Received: 30 November 2021; Accepted: 30 December 2021
Abstract: The most salient argument that needs to be addressed universally is Early Breast Cancer Detection (EBCD), which helps people live longer lives. The Computer-Aided Detection (CADs)/Computer-Aided Diagnosis (CADx) system is indeed a software automation tool developed to assist the health professions in Breast Cancer Detection and Diagnosis (BCDD) and minimise mortality by the use of medical histopathological image classification in much less time. This paper purposes of examining the accuracy of the Convolutional Neural Network (CNN), which can be used to perceive breast malignancies for initial breast cancer detection to determine which strategy is efficient for the early identification of breast cell malignancies formation of masses and Breast microcalcifications on the mammogram. When we have insufficient data for a new domain that is desired to be handled by a pre-trained Convolutional Neural Network of Residual Network (ResNet50) for Breast Cancer Detection and Diagnosis, to obtain the Discriminative Localization, Convolutional Neural Network with Class Activation Map (CAM) has also been used to perform breast microcalcifications detection to find a specific class in the Histopathological image. The test results indicate that this method performed almost 225.15% better at determining the exact location of disease (Discriminative Localization) through breast microcalcifications images. ResNet50 seems to have the highest level of accuracy for images of Benign Tumour (BT)/Malignant Tumour (MT) cases at 97.11%. ResNet50’s average accuracy for pre-trained Convolutional Neural Network is 94.17%.
Keywords: Computer-Aided Detection; breast cancer detection; convolutional neural network; class activation map; computer-aided diagnosis
Breast cancer is universally described as one of the primary causes of women’s death. As a result, EBCD surges the likelihood of recovery while decreasing the rate of mortality. Breast cancer is the most often diagnosed disease worldwide [1–5]. As per World Health Organization (WHO) report, 626,700 women die as a result of cancer-related sickness, and an average of 10 million in 2000 to 19.3 million in 2020 is recorded. The estimated number of people diagnosed with cancer would rise much more in the following years, hitting roughly 50% in 2040 than 2020 [5–9]. Using early-stage diagnostic treatment methods, many tragedies can be averted. Clustered microcalcifications and the solid mass in the breast are different types of malignant pathologies considered on mammograms. Clustered microcalcifications can alternatively be characterized as tiny calcium formations found around malignant tissue. Though radiologists can identify these tumours with great precision, they can utilize a CADs/CADx system as a second opinion in fields where they already have suspicions and want to be cautious [10–14]. Based on image processing systems employ a variety of algorithms to process images in a systematic method. For instance, a basic image processing algorithm pre-processes the image, designates the interest zones, derivatives attributes from the reference image, and discards the retrieved properties. Conventional methods have the following limitations: (a) it is very often necessary to have specialist understanding, and (b) dependencies and interconnections between them are frequently ambiguous [15–19].
Abnormal development of these epithelial cells, especially in lobules and ducts, causes breast cancer; this expansion tends to result in lesions that may be observed and identified via mammography. Without mammography, the possibilities of early identification are only about 5%. Mammography is the most frequently used breast screening methodology in the world. In mammography diagnostics, accurate abnormality diagnosis is critical. EBCD can make a significant difference in a patient’s long-term survival rate [20,21].
Furthermore, mammography is generally recognized as the basic BCDD test that can be completed rapidly, which remains the only testing technique aimed at spotting microcalcification; it would go down in history as one of the most significant early breast cancer findings. Microcalcification is tiny and has poor contrast with the mammography background because of its small size and low contrast, and It is sometimes challenging and time-consuming, which requires the radiologist to do a thorough assessment of microcalcifications [22,23]. Applications of Artificial Intelligence (AI) had a wide success in recent years. Amidst the booming zones of AI includes Machine Learning (ML) and Deep Learning (DL). CNN fetched stunning success of DL is able to extract characteristics from images and categorising them with a reasonable degree of accuracy. It is a better technique to find patterns in data and automatically analyse images using several Computer Vision (CV) technologies.
The fully connected output layer and ResNet50 are used by CNN to conduct classification, which can automatically extract features from raw images after observing them in layers. Furthermore, by various models, networks are pre-trained to conduct grouping and Transfer Learning (TL). It also focuses on how we use pre-trained DL models to classify breast cancer from histopathology images in binary and multiclass classification. The goal is to enhance CNN’s Discriminative Localization capacity to detect hazardous microcalcification zones in mammograms by applying Class Activation Mapping (CAM).
The article is organized as follows, and Section 1 contains a complete introduction about breast cancer and various reports, present status of disease by WHO are introduced and Section 2 consists of related works of various traditional methodologies for testing BCDD. The proposed methodology for histopathological analysis using a deep CNN to identify malignant tumour is introduced in Section 3 along with CAM. Weight factor and CAM is measured and demonstrated for visualization are discussed in this section. Where pre-trained DCNN based ResNet50 is used for training tumour data set and performance are also measured here using various evaluation metrics. Results and discussion are made in Section 4. This produces various outcomes for BMC. In Section 5, the final outcome and cause of this proposed methodology are discussed with various references in Section 6.
In a breast cancer surgical medical image accumulation, the suggested cascade relegation technique was tested. The coalesced representation features through LBP description, Gray Level Co-occurrence Matrix, and Curvelet Transform takes utilization of the positive characteristics of several extractors of characterization; the cumulated feature is demonstrated to be efficacious in the biopsy picture relegation challenge [24]. The cascade is a two-stage ensemble relegation technique that achieved an excellent relegation precision of 99.25% while additionally ascertaining high relegation dependability of 97.65% thanks to a low repudiation rate of 1.94%. In addition, cascade design provides an expedient for maintaining both relegation precision and abnegation rate stability. Modifying the abnegation threshold in each ensemble cluster in accordance with the designation of particular applications can withal avail to ameliorate the system’s relegation precision and reliability. Medical diagnostic functions, for example, demand a high caliber of precision and dependability; as a result, the repudiation thresholds at each step would be set to a high caliber to ascertain that the diagnosis is proper [25].
Screening tests were performed prior to the onset of any symptoms to discover quick signs of breast cancer. Mammograms, which use minimal-dose X-rays of the breast, are an initial/typical screening procedure commonly utilised for BCDD. This footage shows ebony backgrounds with thick white patches, possibly calcifications/masses [26,27]. When questionable spots are discovered, mammography with breast ultrasonography is used to analyse these tumours. Magnetic Resonance Imaging (MRI) is used to portray detailed pictures of the breast, which are often used to learn more about the size and location of MT. Biopsies should be undertaken to confirm the screening results if any of the screens mentioned earlier raise concerns or indicate the existence of BCDD. Biopsies include removing cells or a tiny amount of breast tissue and sending it to a lab for pathologists to analyse in order to acquire conclusive results [28–30].
Unsupervised learning, on the other hand, uses unlabelled data in which the input ‘x’ features are available while the ‘y’ class labels are not. This indicates that the approach may optimise its hyperparameters, which correspond to the configurations defined prior to training, by minimising a loss function. Instead, in order to categorise the dataset, the algorithm must automatically generate clusters in it. Clustering and anomaly detection are examples of unsupervised learning, visualization of data, and dimensionality reduction, making it irrelevant to BCDD. There are two additional types of Machine Learning (ML) algorithms that correlate. However, semi-supervised learning and Reinforcement Learning (RL) are irrelevant to the purpose of BCDD.
In digital mammograms, the author proposed automated mass detection and segmentation. The proposed approach is based on segmenting mammography pictures into two groups: (a) mass pixels and their bypassing background pixels, and (b) image contrast was improved by image enhancement. To discover and segregate the area of interest in breast mass, regional magnification based on local statistical texture analysis is frequently utilised. The method was evaluated on 322 mammography pictures from the MIAS database, yielding 94.59% sensitivity and 3.90% false positives per image data set. For digital mammograms, the author presented a Breast Mass Contour Segmentation (BMCS) approach. The proposed approach is predicated on traditional kernel region magnification. Furthermore, the technique was tested 260 mammogram masses accumulated from the Dokuz Eylul Mammography Set (DEMS), and it attained 95.06% [31].
3.1 Deep Convolutional Neural Network
Deep Convolution Neural Network (DCNN) is a Neural Network (NN) that is frequently used to evaluate, identify, or relegate pictures for better study by simplifying images. This network is benign since it requires less human labour and pre-processing [32]. Backpropagation is additionally utilized in the cognition process to ameliorate network precision. Its design is homogeneous to that of a Multi-Layer Perceptron (MLP), with numerous hidden and output layers. Every neuron in one layer connects with every neuron in the subsequent layer. Because of this, feature extraction may be acclimated to amend and facilely identify malignancy in breast masses, and the CNN architecture has been utilized in BCDD and relegation (Fig. 1). As a result, early detection of breast cancer can be obtained by authorizing it to be treated at an inferior stage before it further spreads [33,34].

Figure 1: DCNN system for BCDD
Class Activation Mapping (CAM) is a method for identifying visual areas for use with a CNN category class. CNN can recognize picture regions that belong to a categorical class and then reuse the classifiers for Discriminative Localization. It designates the incorporation of CNN’s detection capacity. If CNN assigns a more preponderant level of precision to the input image, the classifier will have learnt to filter for the class. They will denote the position of the class in that image by returning to the location where the flitter weights are active.
Let
where,
Let
The obtained CAM is further demonstrated for visualization and verification purposes. By projecting weights back onto convolutional feature maps, CNN might learn about the effects of the locations. The trained NN was evaluated on 200 mammograms with CAM and used image patches from the Curated Breast Imaging Subset of the Digital Database for Screening Mammography (CBIS-DDSM). They abstracted the final two inception modules from ResNet50 and immediately linked the CAM convolutional layer to the Ecumenical Average Pooling layer (GAP layer) (Fig. 2).

Figure 2: GAP layer applied CAM for each image class
GAP layers were acclimated to abbreviate the spatial dimensions of a 3D tensor (Fig. 3). GAP layers, on the other hand, conduct a more extreme remotely dimensionality abbreviation in which a matrix of values h × w × d is truncated to have scopes 1 × 1 × d. Arithmetic mean of h, w values, the GAP layers truncate. The h × w feature maps to a single integer.

Figure 3: CAM for reducing the spatial dimensions
To amend the quality of each image amassment, we utilized a variety of pre-processing techniques. The section that follows goes into the comprehensive pre-processing implementation. Following pre-processing, we divided the image dataset into the training image data set is 70%, and the testing image data set is 30%. As a result of the training image dataset, we only employ data augmentation. Image processing techniques such as resizing, rotation, and reflection were used during augmentation. It relegates test data sets and CV performance assessment criteria such as relegation precision and discombobulation matrices once the network simulation parameters have been learned. In the next part, we give the results predicated on several assessment indicators.
In this research inquiry, we employed the Cancer Hospital, and Research Centre Database predicated on testing image-level, which contains BT/MT, and there are four sub-classes, with a different magnification factor, as described before {40x; 100x; 200x; 400x}. The structure of Binary and Multiclass Relegation (BMC) is depicted in Fig. 4.

Figure 4: Organization for BMC framework
The image test dataset is performed to evaluate system performance after the training set. To retain the data ratio of each class, additional normal tissue and background of a group of pixels in an image (image patches) are added to the training data. Tab. 1 depicts the number of training datasets after data augmentation is summarized.

3.4 Pre-Trained Deep Neural Networks Based ResNet
The prosperous medical imaging method is DCNN. We used three pre-trained researchers in this dissertation, DCNN classifiers as ResNet50. DNNs are capable of learning vigorous and practical features from photos automatically. ResNet50 is an acronym for Residual Neural Network (RNN), a CNN capable of relegating photos into thousands of object classes and over a million photos from the ImageNet collection were used to train the algorithm. ImageNet is predicated on the hierarchical structure of WordNet and, when consummated, expects to be included in the range of 50 million photos. ResNet50 is 98 MB in size, contains 50 deep layers, and fortifies 224 × 224 × 3 input images. The Directed Acyclic Graph (DAG) is a simple system that can train a DNN from scratch or utilize a pre-trained NN such as ResNet50 (Fig. 5), which RNN stands for relegated neural network, which has been trained on over a million photos from the ImageNet database and can relegate images into thousands of object classes. ImageNet is based on the hierarchical substructure of WordNet, and its objective is to have 50 million images by the end of the year.

Figure 5: The architecture of the proposed ResNet50
3.5 Evaluation Metrics of Confusion Matrix
The Confusion Matrix (CM) is an exemplary implementation for evaluating BMC performance. Tabs. 2 and 3 outline the matrices Confusion for BMC, and the performance assessment matrices is tried out.
• True Positive (TP): The visual inspection is positive and is expected to be positive
• False Negative (FN): The visual examination is positive, yet the projected outcome is negative
• True Negative (TN): The optical perception is negative and will be negative.
• False Positive (FP): Optical Discrimination is negative yet predictable to be positive


Experiment results with three pre-trained TL-DNN systems used to classify Histopathological images of breast cancer were utilized. The trained system is evaluated utilizing data images from the publicly accessible Cancer Hospital & Research Centre dataset, which comprises 16,426 authentic testers (images dataset) from 500 patients, dissevered into two groups of 6,374 BT samples and 10,052 MT samples. It describes the results for BMC and compares them to previous related research work. The Intersection over Union (IoU) evaluates Discriminative Localization. The ratio of the intersection of two bounding boxes over the coalescence, one from the classifier and the other from the ground veracity, is computed utilizing this metric. When the value is proximate to one, the classifier is more exact |.|, Eq. (4)
where |∙| denotes the area bounded by the box
The average Intersection over Union (IoU) value for both the leading reference network and the modified network is inadequate, as shown in Tab. 4, with the modified network outperforming the leading reference network. Fig. 6 shows an amassment of approximately held Region Of Interest (ROI) masks. As you can visually perceive, some of the masks are colossal enough to cover the complete breast, while others are only enormously immensely colossal enough to cover the outside a moiety of the breast.
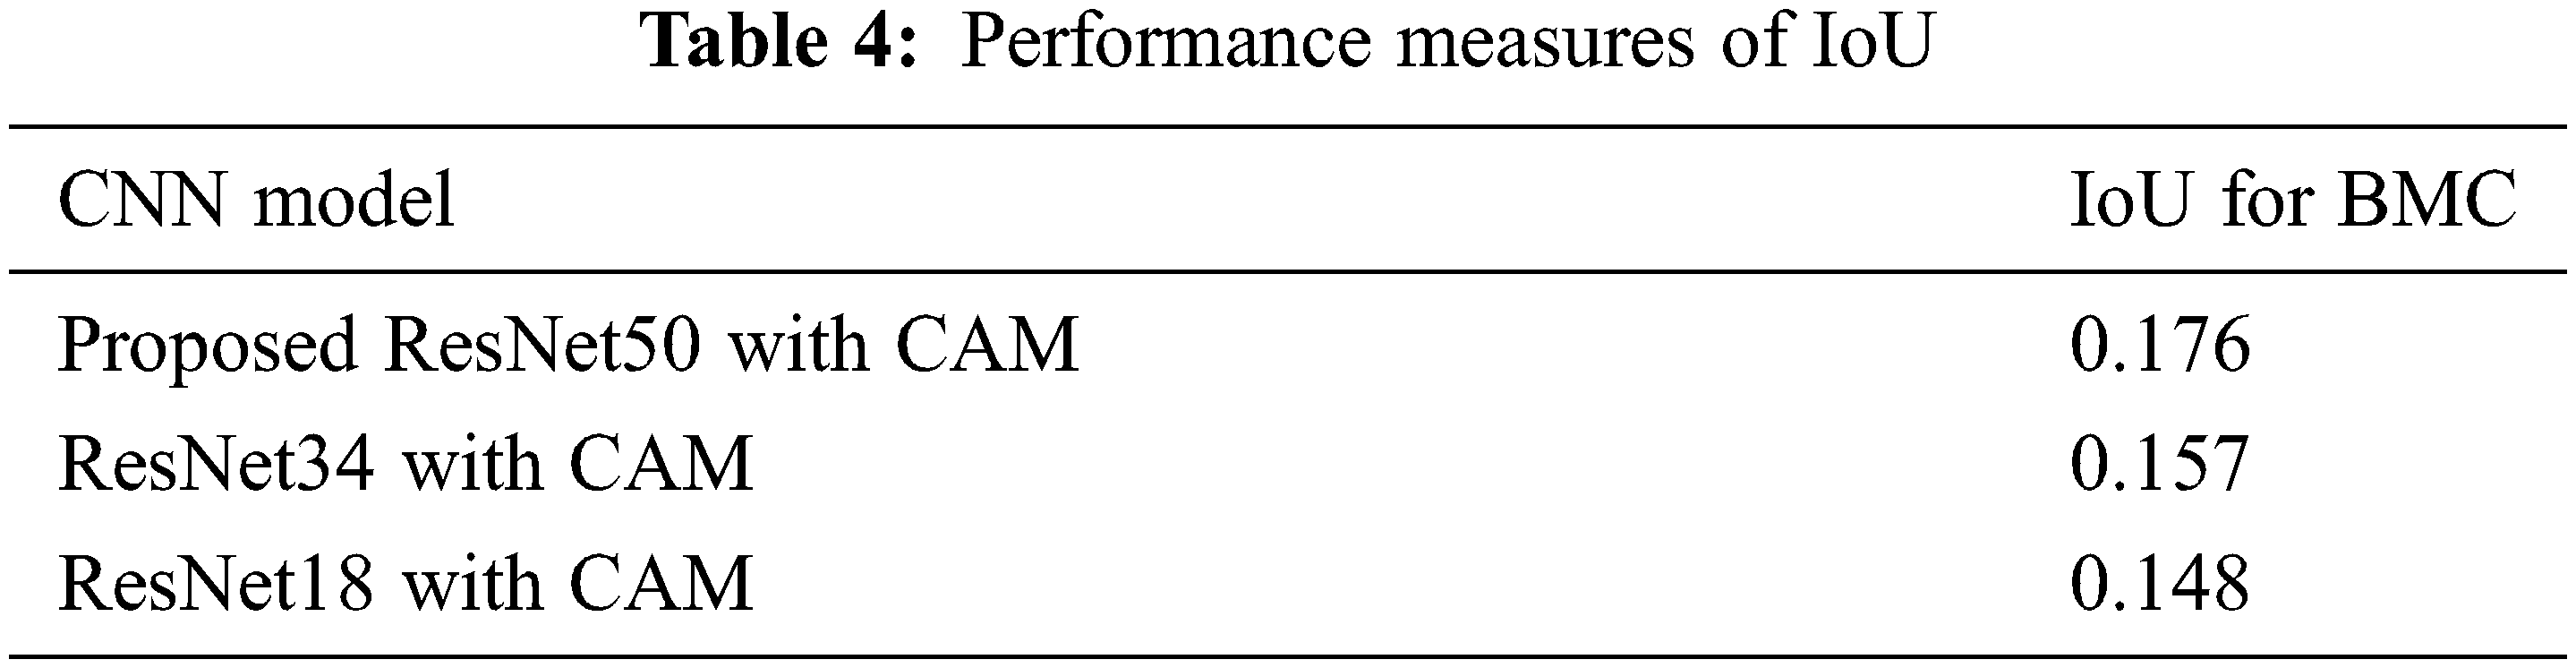

Figure 6: Experimented mammograms with ROI
The outcomes of microcalcification Discriminative Localization applying references and updated models are shown in Fig. 7. The first segment shows the original CBIS-DDSM mammograms resized to 3000 × 4800 image pixel size. The second segment contains images of the reference model’s Discriminative Localization results converted into heatmap images, and the third segment contains images of the modified model’s Discriminative Localization results converted into Images of heatmaps. The heatmap colour is blue, and the fewer weights are engaged; however the heatmap colour is red, the more weights are active. As a consequence, the red area betokens the position of the designated class object. The last column, in turn, comprises the ROI mask pictures from CBIS-DDSM, one for each image in the first segment. The reference model identifies a colossal number of FP regions, as can be visually perceived visually. The proposed model’s engendering heatmap, on the other hand, conducts a more intricate Discriminative Localization and intersects with the ground veracity region with far fewer FP alerts.

Figure 7: Mammogram for microcalcification, discriminative localization with reference, discriminative localization with proposed model and ROI
4.1 Binary and Multi Classification
We compare the performance of ResNet50-DNN classifiers tested on images from Cancer Hospital & Research Centre at altered magnification factors of {40x; 100x; 200x; 400x}. In 40 magnification of images, we compared the performance of the DNNs in Tab. 5 and Fig. 8. ResNet50 achieves the best performance across all performance metrics. Following that, we compared the DNN performance in the images with of {40x; 100x; 200x; 400x}. ResNet50 outperformed all other networks in terms of Precision and Specificity, Sensitivity, and F1-score.
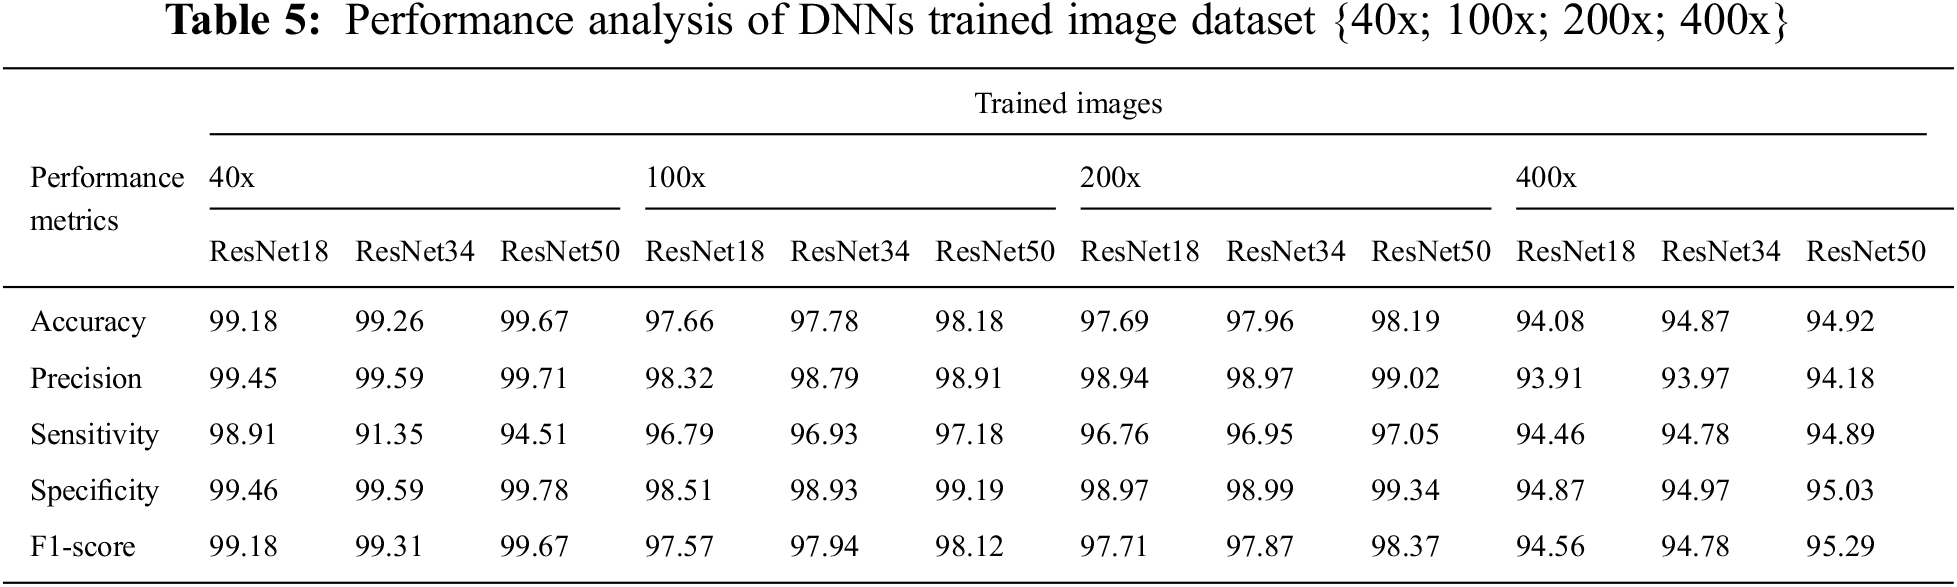

Figure 8: Performance analysis of BMC trained image datasets {40x; 100x; 200x; 400x}
Fig. 9 show the confusion matrices for ResNet50 DNNs with varying magnifying factors {40x; 100x; 200x; 400x}

Figure 9: Confusion matrices for ResNet50 for multiple magnifications {40x; 100x; 200x; 400x}
4.3 Classification Performance on Testing Data
For example, testing medical images (Fig. 10) with expected labels and prognosticated probability for the three DNNs for numerous magnifying factors {40x; 100x; 200x; 400x}.

Figure 10: ResNet50 predictions on trained image datasets {40x; 100x; 200x; 400x}
4.4 Outcomes for Binary and Multiclass Classification
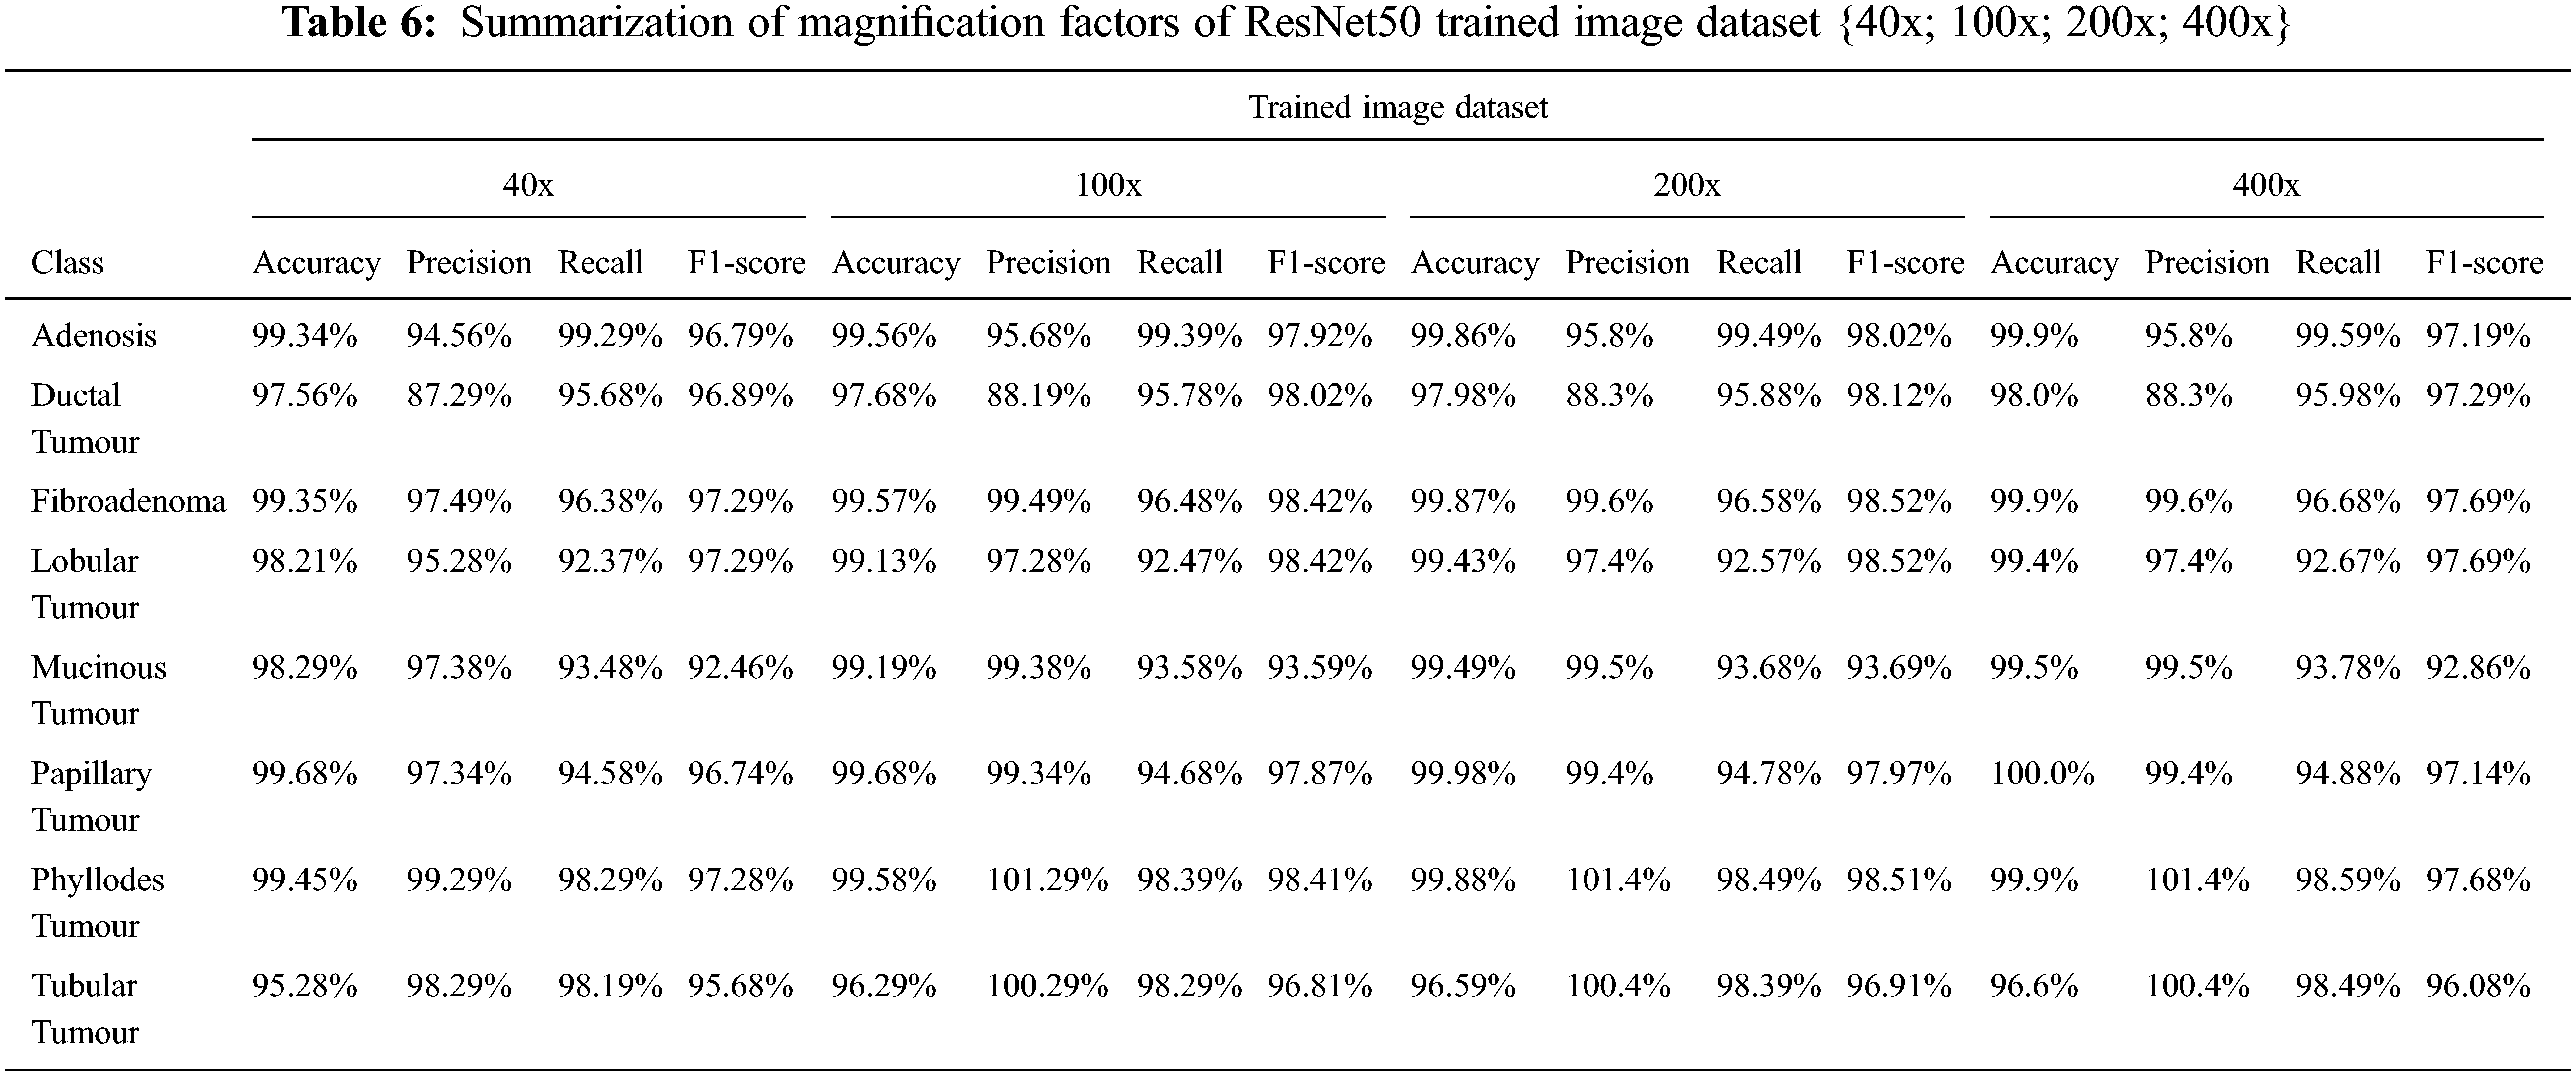
In the BMC function, images magnified by four distinct factors, the researcher examine the performance of three pre-trained DCNN-ResNet50 models: {40x; 100x; 200x; 400x}. The results of the three pre-trained DNNs’ multiclass classification are described in Fig. 11 below. Adenosis, Ductal, Fibroadenoma, Lobular, Mucinous, Papillary, Phyllodes, and Tubular Tumours are the classes described in Tab. 6. The results projected that ResNet50 had the best degree of accuracy of magnification factors images {40x; 100x; 200x; 400x} in the trained image dataset.

Figure 11: Performance analysis of ResNet50 trained images datasets {40x; 100x; 200x; 400x}
Following, assessment metrics are used to evaluate ResNet50’s BMC performance in images with various magnification factors: Reliability, Precision, Recall, Sensitivity, and F1-score.
The current medical research investigations focus on the classification of BCDD using CNN architecture. This research demonstrates that data pre-processing and parameter tuning can improve the performance of CNN models. CNN outperforms other traditional methods in BCDD cancer cells. CADe has been utilized to avail radiologists in mammography diagnosis. CNN, amalgamated with CAM, reveals that Discriminative Localization of BMC may be achieved with a considerable abbreviation in human effort. Examining visual pictures and several numerical designators (IoU) revealed, however, that the updated model outperforms the subsisting CAM in Discriminative Localization for BMC. The suggested ResNet50 model outperformed the proposed model in Discriminative Localization by about 225.15% for an average IoU value of 7.4%. We used several performance assessment criteria for each magnification factor, including precision, precision, sensitivity (recall), specificity, and F1-score. We employed TL with different magnification factors in the pre-trained DCNN-ResNet50{40x; 100x; 200x; 400x} for BMC (BT/MT). For each pre-trained NN, the ResNet50 earned the highest overall average precision of 97.11% for BMC. Our ResNet50 engendered good overall average precision when compared to state-of-the-art BMC findings. ResNet50’s average accuracy for pre-trained CNN is 94.17%.
Funding Statement: This research has been funded by the Research General Direction at Universidad Santiago de Cali under call No. 01-2021.
Conflicts of Interest: The authors declare that they have no conflicts of interest to report regarding the present study.
1. T. Berber, A. Alpkocak, P. Balci, A. A. P. B. Dicle, O. Berber et al., “Breast mass contour segmentation algorithm in digital mammograms,” Computer Methods and Programs in Biomedicine, vol. 110, no. 2, pp. 150–159, 2013. [Google Scholar] [PubMed]
2. H. Asri, H. Mousannif, H. A. Moatassime and T. Noel, “Using machine learning algorithms for breast cancer risk prediction and diagnosis,” Procedia Computer Science, vol. 83, pp. 1064–1069, 2016. [Google Scholar]
3. M. Montazeri and A. Beigzadeh, “Machine learning models in breast cancer survival prediction,” Technology and Health Care, vol. 24, no. 1, pp. 31–42, 2016. [Google Scholar] [PubMed]
4. G. R. Jothilakshmi and A. Raaza, “Effective detection of mass abnormalities and its classification using multi-SVM classifier with digital mammogram images,” in Int. Conf. on Computer, Communication and Signal Processing (ICCCSP), Chennai, India, pp. 1–6, 2017. [Google Scholar]
5. X. Y. Liu, J. Wu and Z. H. Zhou, “Exploratory undersampling for class-imbalance learning,” IEEE Transactions on Systems, Man, and Cybernetics, Part B: Cybernetics, vol. 39, no. 2, pp. 539–555, 2009. [Google Scholar]
6. B. V. Ginneken, B. M. T. H. Romeny and M. A. Viergever, “Computer-aided diagnosis in chest radiography: A survey,” IEEE Transactions on Medical Imaging, vol. 20, no. 12, pp. 1228–1241, 2001. [Google Scholar] [PubMed]
7. A. Dubrovina, P. Kisilev, B. Ginsburg, S. Hashoul and R. Kimmel, “Computational mammography using deep neural networks,” Computer Methods in Biomechanics and Biomedical Engineering: Imaging & Visualization, vol. 6, no. 3, pp. 243–247, 2018. [Google Scholar]
8. L. Bottou, F. E. Curtis and J. Nocedal, “Optimization methods for large-scale machine learning,” Siam Review, vol. 60, no. 2, pp. 223–311, 2018. [Google Scholar]
9. B. Batut, S. Hiltemann, A. Bagnacani, D. Baker, V. Bhardwaj et al., “Community-driven data analysis training for biology,” Cell Systems, vol. 6, no. 6, pp. 752–758, 2018. [Google Scholar] [PubMed]
10. J. Cheng and J. C. Rajapakse, “Segmentation of clustered nuclei with shape markers and marking function,” IEEE Transactions on Biomedical Engineering, vol. 56, no. 3, pp. 741–748, 2009. [Google Scholar] [PubMed]
11. S. B. Edge and C. C. Compton, “The American joint committee on cancer: The 7th edition of the AJCC cancer staging manual and the future of TNM,” Annals of Surgical Oncology, vol. 17, no. 6, pp. 1471–1474, 2010. [Google Scholar] [PubMed]
12. M. Tektonidis and K. Rohr, “Diffeomorphic multi-frame non-rigid registration of cell nuclei in 2D and 3D live cell images,” IEEE Transactions on Image Processing, vol. 26, no. 3, pp. 1405–1417, 2017. [Google Scholar] [PubMed]
13. S. Punitha, A. Amuthan and K. S. Joseph, “Benign and malignant breast cancer segmentation using optimized region growing technique,” Future Computing and Informatics Journal, vol. 3, no. 2, pp. 348–358, 2018. [Google Scholar]
14. S. T. Phillips, D. Jenkinson, C. Stinton, M. G. Wallis, J. Dunn et al., “Double reading in breast cancer screening: Cohort evaluation in the CO-OPS trial,” Radiology, vol. 287, no. 3, pp. 749–757, 2018. [Google Scholar]
15. M. Zanotel, I. Bednarova, V. Londero, A. Linda, M. Lorenzon et al., “Automated breast ultrasound: Basic principles and emerging clinical applications,” La Radiologia Medica, vol. 123, no. 1, pp. 1–12, 2018. [Google Scholar] [PubMed]
16. J. James and S. Tennant, “Contrast-enhanced spectral mammography (CESM),” Clinical Radiology, vol. 73, no. 8, pp. 715–723, 2018. [Google Scholar] [PubMed]
17. H. B. Pan, K. F. Wong, A. Yao, G. C. Hsu, C. P. Chou et al., “Breast cancer screening with digital breast tomosynthesis 4-year experience and comparison with national data,” Journal of the Chinese Medical Association, vol. 81, no. 1, pp. 70–80, 2018. [Google Scholar] [PubMed]
18. M. A. S. A. Husaini, M. H. Habaebi, S. A. Hameed, M. R. Islam and T. S. Gunawan, “A systematic review of breast cancer detection using thermography and neural networks,” IEEE Access, vol. 8, pp. 208922–208937, 2020. [Google Scholar]
19. G. Jiang, J. Wei, Y. Xu, Z. He, H. Zeng et al., “Synthesis of mammogram from digital breast tomosynthesis using deep convolutional neural network with gradient guided cGANs,” IEEE Transactions on Medical Imaging, vol. 40, no. 8, pp. 2080–2091, 2021. [Google Scholar] [PubMed]
20. V. Madhavi and C. B. Thomas, “Multi-view breast thermogram analysis by fusing texture features,” Quantitative InfraRed Thermography Journal, vol. 16, no. 1, pp. 111–128, 2019. [Google Scholar]
21. D. Stalin David, S. Arun Mozhi Selvi, S. Sivaprakash, P. Vishnu Raja, D. K. Sharma et al., “Enhanced detection of glaucoma on ensemble convolutional neural network for clinical informatics,” Computers, Materials & Continua, vol. 70, no. 2, pp. 2563–2579, 2022. [Google Scholar]
22. J. F. C. García, J. H. Ortiz, O. I. Khalaf, A. D. V. Hernández and L. C. R. Timaná, “Noninvasive prototype for Type 2 diabetes detection,” Journal of Healthcare Engineering, vol. 2021, no. 8077665, pp. 1–12, 2021. [Google Scholar]
23. O. I. Khalaf, G. M. Abdulsahib, H. D. Kasmaei and K. A. Ogudo, “A new algorithm on application of blockchain technology in live stream video transmissions and telecommunications,” International Journal of e-Collaboration (IJeC), vol. 16, no. 1, pp. 16–32, 2020. [Google Scholar]
24. R. Rout, P. Parida, Y. Alotaibi, S. Alghamdi and O. I. Khalaf, “Skin lesion extraction using multiscale morphological local variance reconstruction-based watershed transform and fast fuzzy C-means clustering,” Symmetry, vol. 13, no. 2085, pp. 1–19, 2021. [Google Scholar]
25. R. Surendran, O. I. Khalaf and C. Andres, “Deep learning-based intelligent industrial fault diagnosis model,” Computers, Materials & Continua, vol. 70, no. 3, pp. 6323–6338, 2022. [Google Scholar]
26. N. A. Khan, O. I. Khalaf, C. A. T. Romero, M. Sulaiman and M. A. Bakar, “Application of Euler neural networks with soft computing paradigm to solve nonlinear problems arising in heat transfer,” Entropy, vol. 23, no. 1053, pp. 1–44, 2021. [Google Scholar]
27. O. I. Khalaf, C. A. T. Romero, A. A. J. Pazhani and G. Vinuja, “VLSI implementation of a high-performance nonlinear image scaling algorithm,” Journal of Healthcare Engineering, vol. 2021, no. 6297856, pp. 1–10, 2021. [Google Scholar]
28. O. I. Khalaf, “Preface: Smart solutions in mathematical engineering and sciences theory,” Mathematics in Engineering, Science and Aerospace, vol. 12, no. 1, pp. 1–4, 2021. [Google Scholar]
29. G. Suryanarayana, K. Chandran, O. I. Khalaf, Y. Alotaibi, A. Alsufyani et al., “Accurate magnetic resonance image super-resolution using deep networks and Gaussian filtering in the stationary wavelet domain,” IEEE Access, vol. 9, pp. 71406–71417, 2021. [Google Scholar]
30. G. Li, F. Liu, A. Sharma, O. I. Khalaf, Y. Alotaibi et al., “Research on the natural language recognition method based on cluster analysis using neural network,” Mathematical Problems in Engineering, vol. 2021, no. 9982305, pp. 1–13, 2021. [Google Scholar]
31. S. Sudhakar, O. I. Khalaf, P. Vidya Sagar, D. K. Sharma, L. Arokia Jesu Prabhu et al., “Secured and privacy-based IDS for healthcare systems on e-medical data using machine learning approach,” International Journal of Reliable and Quality E-Healthcare (IJRQEH), vol. 11, no. 3, pp. 1–11, 2022. [Google Scholar]
32. S. Sudhakar, O. I. Khalaf, S. Priyadarsini, D. K. Sharma, K. Amarendra et al., “Smart healthcare security device on medical IoT using Raspberry Pi,” International Journal of Reliable and Quality E-Healthcare (IJRQEH), vol. 11, no. 3, pp. 1–11, 2022. [Google Scholar]
33. S. Sudhakar, G. R. K. Rao, O. I. Khalaf and M. Rajesh Babu, “Markov mathematical analysis for comprehensive real-time data-driven in healthcare,” Mathematics in Engineering Science and Aerospace (MESA), vol. 12, no. 1, pp. 77–94, 2021. [Google Scholar]
34. S. Sudhakar, P. Vidya Sagar, R. Ramesh, O. I. Khalaf and R. Dhanapal, “The optimization of reconfigured real-time datasets for improving classification performance of machine learning algorithms,” Mathematics in Engineering Science and Aerospace (MESA), vol. 12, no. 1, pp. 43–54, 2021. [Google Scholar]
 | This work is licensed under a Creative Commons Attribution 4.0 International License, which permits unrestricted use, distribution, and reproduction in any medium, provided the original work is properly cited. |