DOI:10.32604/csse.2023.024612
| Computer Systems Science & Engineering DOI:10.32604/csse.2023.024612 | |
| Article |
Intelligent Deep Learning Enabled Human Activity Recognition for Improved Medical Services
1Department of Electronics and Communication Engineering, Mohamed Sathak A.J. College of Engineering, Chennai, 603103, India
2Department of Information Technology, Sri Sairam Engineering College, Chennai, 602109, India
3Department of Robotics Engineering, Karunya Institute of Technology and Sciences, Coimbatore, 641114, India
4Department of Mechatronics Engineering, Sri Krishna College of Engineering and Technology, Coimbatore, 641008, India
5Deparmtent of Applied Data Science, Noroff University College, Kristiansand, Norway
6Department of Information and Communication Engineering, Soonchunhyang University, Asan, Korea
7Department of Computer Science and Engineering, Soonchunhyang University, Asan, Korea
*Corresponding Author: Yunyoung Nam. Email: ynam@sch.ac.kr
Received: 24 October 2021; Accepted: 03 January 2022
Abstract: Human Activity Recognition (HAR) has been made simple in recent years, thanks to recent advancements made in Artificial Intelligence (AI) techniques. These techniques are applied in several areas like security, surveillance, healthcare, human-robot interaction, and entertainment. Since wearable sensor-based HAR system includes in-built sensors, human activities can be categorized based on sensor values. Further, it can also be employed in other applications such as gait diagnosis, observation of children/adult’s cognitive nature, stroke-patient hospital direction, Epilepsy and Parkinson’s disease examination, etc. Recently-developed Artificial Intelligence (AI) techniques, especially Deep Learning (DL) models can be deployed to accomplish effective outcomes on HAR process. With this motivation, the current research paper focuses on designing Intelligent Hyperparameter Tuned Deep Learning-based HAR (IHPTDL-HAR) technique in healthcare environment. The proposed IHPTDL-HAR technique aims at recognizing the human actions in healthcare environment and helps the patients in managing their healthcare service. In addition, the presented model makes use of Hierarchical Clustering (HC)-based outlier detection technique to remove the outliers. IHPTDL-HAR technique incorporates DL-based Deep Belief Network (DBN) model to recognize the activities of users. Moreover, Harris Hawks Optimization (HHO) algorithm is used for hyperparameter tuning of DBN model. Finally, a comprehensive experimental analysis was conducted upon benchmark dataset and the results were examined under different aspects. The experimental results demonstrate that the proposed IHPTDL-HAR technique is a superior performer compared to other recent techniques under different measures.
Keywords: Artificial intelligence; human activity recognition; deep learning; deep belief network; hyperparameter tuning; healthcare
The past decade experienced a dynamic evolution of Human Activity Recognition (HAR) systems owing to increasing deployment of smart devices like IoT devices, smartphones, etc. HAR model can be categorized under sensor- and vision-based models based on the type of data under treatment. The current study targets wearable sensor HAR models in healthcare that are the most commonly used sensor-based HAR systems [1]. To be specific, wearable sensor HAR system does not encounter serious privacy problems as in vision-based HAR system which makes the former an appropriate choice for healthcare application. In wearable sensor HAR scheme, the users wear portable mobile devices with built-in sensors [2]. The activities of the users are then categorized based on characterization and measurement of sensor signals, when the user performs their day-to-day activities.
HAR for healthcare systems has several possible applications that involve (1) Paradigm shift for gait diagnoses from costly motion lab to communities [3]. Gait analyses could be employed in several medical applications like gait modification (to avoid failing), stroke detection and also in the detection of specific earlier disease. (2) Intervention for children and cognitive behavior monitoring & adult with Attention Deficit or Hyperactivity Disorder (ADHD). Sensors can be leveraged for such people to explore fidgeting negatively/positively that affects their attention. (3) Stroke patient hospital directions. In this, a person must be directed to a hospital so that this case can be treated. UCSF is proposed as a device on the basis of accelerometer sensors to make crucial decisions. (4) Epilepsy and Parkinson’s diseases analysis. Physicians have gathered a huge database of information on episodic and electrophysiology memory in human patients and rodents. The analyses results of this sensing information could be employed in several treatment processes and disease diagnosis [4]. (5) Vision RT, a costly device, can be employed to ensure the safe delivery of radiation therapy to cancer patient, due to their movements. It is worth to exploit the sensors in the diagnosis of patients’ motion, when considering radiation therapy for lesser affluent community.
A number of research works, conducted in the recent years, has focused on HAR systems. These works can be categorized under two major classes namely wearable- and ambient sensor-based models [5]. Usually, ambient sensor-based models deploy temperature, camera, sound, surveillance, and indoor sensor nodes to capture environment-based context signals to identify a person’s day-to-day activities in a fixed space (for example, recovery center, smart home etc.). This sort of fixed-enviornment-requirement make it unsuitable for analyzing standard outdoor activity. Simultaneously, wearable sensor-based approaches make use of smartphones/wearable devices to obtain and monitor on-body physiological signals through gyroscope, accelerometer, and magnetometer sensors. In the study conducted earlier [6], the researchers evaluated angular velocity and acceleration sensor data using low-cost wearable device to find out user’s location data and recognize their physical behaviors such as standing, walking, and sitting. In literature [7], the authors applied Principal Component Analyses (PCA) and independent component analyses to recognize an individual person’s walking posture, according to their acceleration data, gathered from buttocks. The study result shows that HAR technique-based wearable sensors might perform well for low level vision. However, it fails in higher level recognition task management for complex activity recognition [8].
Deep Learning (DL) model has been widely employed in HAR application. The usage of CNN, with time series classifications, has two major benefits over previously employed methods such as scale invariance and local dependency. Here, Recurrent Neural Networks (RNN) can utilize time-order relationships among sensor readings [9]. Unfortunately, DL methods are energy intensive in nature. The key objective of this study is to recommend an efficient and compact HAR-DL method for healthcare application.
The current study proposes an Intelligent Hyperparameter Tuned Deep Learning-based HAR (IHPTDL-HAR) technique for healthcare environment. The proposed IHPTDL-HAR exploits Hierarchical Clustering (HC) for outlier detection process. In addition, the proposed IHPTDL-HAR technique includes a DL-based Deep Belief Network (DBN) model to recognize the activities of user. Furthermore, hyperparameter tuning of DBN model is accomplished using Harris Hawks Optimization (HHO) algorithm. Lastly, a wide-range of experimental analysis was conducted upon benchmark dataset and the results were inspected under dissimilar aspects.
Jeong and Oh [10] developed a HAR system as DL classification method that distinguishes several human activities. The action is performed solely based on the signals from wristband accelerometer, worn by a person and based on user's convenience. In this method, 3-axis sequential acceleration signal data is collected within a predetermined time window slice. Then, the data is employed as input to the classification model. Particularly, the authors were interested in developing a DL method that can outperform the traditional ML methods in terms of classification accuracy. In this study, a total of 13 activities, based on laboratory experiment data, was employed to compare the performance. The researchers validated the classification performance using CNN-integrated with AE feature reduction and parameter tuning.
Li et al. [11] proposed tri-PSDRNN and PSDRNN systems to exploit the explicit feature extraction process before DRNN. Especially, the researchers considered PSD feature that could capture the frequency features while at the same time, it can also preserve consecutive time features of data collected from PSD feature vector and smartphone accelerometer, correspondingly. The extracts from triaxle acceleration and linear acceleration were employed as inputs in succeeding DRNN classification method. Zhu et al. [12] presented a semi-supervised DL technique with temporal ensembling of deep LSTM. This method is intended to identify HAR system using smartphone inertial sensor nodes. Using DNN processing, the features are extracted for local dependency in recurrent frameworks. In addition, ensemble method was used based on unlabeled and labeled data so that one can integrate unsupervised and supervised losses to leverage the unlabelled data when supervised learning model could not leverage the same.
Agarwal et al. [13] proposed a Lightweight DL method for HAR that requires less computation power. This characteristic makes it appropriate for its placement on edge device. The performance of the presented method was validated on the participant’s data for 6 day-to-day activities. The experimental result showed that the presented method outperformed most of the existing DL and ML methods. Mukherjee et al. [14] proposed an ensemble of three classification methods such as CNN-LSTM, CNN-Net, and Encoded-Net and named it as EnsemConvNet. All these classification models are based on 1D CNN, though it differs based on the number of dense layers. Further, the framework also has another kernel size employed in this model. Every method accepts time series data as two dimensional matrix by considering a window of data at a time to infer data that eventually predict the types of HAR system.
Gumaei et al. [15] proposed an efficient multi sensor-based architecture for HAR systems with a hybrid DL method that integrates SRU and GRU of NNs. The researchers employed deep SRU to process the sequence of multimodal input data through a capacity of its internal memory state. Furthermore, the study also employed deep GRU to learn and store the information on the number of historical data that gets passed on to upcoming state to resolve instability/fluctuations in accuracy and vanishing gradient problems. Luo et al. [16] demonstrated a new method in the name of HQADeepHelper to assist in practicing and learning deep methods for HQA. In this method, users can upload self-gathered HQA datasets and knowledge graphs and perform simple configuration through knowledge graphs, electing datasets, evaluation metrics, and neural network models.
Abdel-Basset et al. [17] presented supervised dual-channel models which consist of LSTM model and an attention model for temporal fusion of inertial sensor data that co-exists with a convolution residual network for spatial fusion of sensor data. Further, the researchers presented an adoptive channel squeezing process to fine tune the CNN feature extraction ability with multichannel dependencies. Janarthanan et al. [18] proposed a UDR-RC that enhances the data from on-nodule wearable sensor during preprocessing to obtain less computational time i.e., 11.25 ns for test set size. Further, the model is also intended to improve detection accuracy in feature extraction and selection inside the NNs for HAR system. In this study, coder structure is merged with Z-layer system for developing the DL model to reduce reconstruction error and improve accuracy.
Hassan et al. [19] introduced a smartphone inertial sensor-based method for HAR systems. At first, effective features are extracted from raw information such as autoregressive coefficient, mean, median, and so on. The feature is then processed using LDA and KPCA to make it powerful. Finally, the feature is trained by DBN model for effective HAR system. Gudur et al. [20] developed an ActiveHARNet, a resource-effective deep ensemble method that supports on-device incremental learning and inference. This model has the ability to characterize the model’s uncertainty via approximation in Bayesian NN with dropout. This can be integrated with appropriate acquisition function for active learning.
In this study, an efficient IHPTDL-HAR technique is developed to determine human activities under healthcare environment. The presented IHPTDL-HAR technique is comprised of three major processes namely, HC-based outlier detection, DBN-based classification, and HHO-based hyperparameter optimization. Fig. 1 illustrates the overall block diagram of the proposed IHPTDL-HAR model. These modules are discussed briefly in following sections.
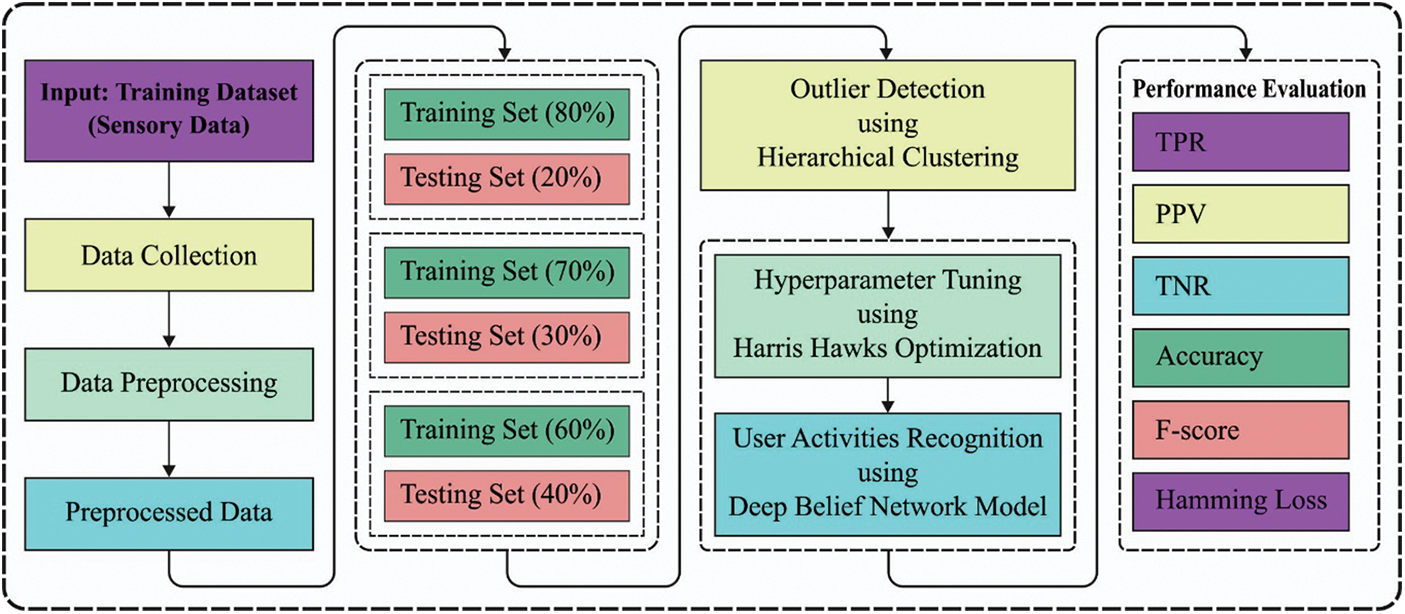
Figure 1: Overall process of IHPTDL-HAR model
3.1 Design of Hierarchical Clustering Based Outlier Detection Technique
Primarily, Hierarchical Clustering (HC) technique is used to remove the existence of outliers present in input healthcare data. When the information is preprocessed, HC-based outlier detection techniques are executed to get rid of the outliers that exist in information. The presented method works in a bottom-up manner. Now, the clusters are merged until a single cluster gets achieved. The overall process is iterated to define an optimum number of clusters that fits the data [21]. It starts with the deliberation of all instances as an individual cluster which subsequently undergoes
Then, the modification is evaluated on quadratic mutual information after incorporating the pairs of clusters and the optimum cluster is found. The pairs are elected and the quadratic mutual data gets enhanced. The cluster which use minimal distortion is found after which it is employed in enhancing a distortion rate function. Assume the clusters
whereas
On the contrary to agglomerative clustering, ‘split and merge’ clustering technique is employed in the recognition of clusters in a hierarchy for removal procedure. The clusters are made up of poor impacts on quadratic mutual information which refers to the scenario that once the cluster is removed, mutual data can be improved. Consider the cluster
Poor cluster instances are assigned to remaining clusters of the clustered space based on minimal Euclidean distance. While, the nearest sample is assigned in the beginning. This process is followed till one residual cluster is reached. Then, based on the drastic extension in quadratic mutual information from several hierarchies
3.2 Design of DBN-Based Activity Recognition Technique
DBN model is applied for the detection of human activities based on human recognition from the data collected through sensors. DBN technique is designed by superimposing multiple RBMs. In order to supervise the training process, a layer of BPNN is further reached to final layer. This DBN technique procedure is mostly comprised of two phases such as pre-training procedure and fine-tuning procedure. Initially, the unsupervised learning procedure is assumed to be a way for pre-training the RBM network. Next, pre-trained layers are performed while the BPNN is implemented in the final layer of DBN technique for fine-tuning. RBM model is composed of two layers of neurons in which one is a visible layer with features and is implemented to have the input information. Another one is the hidden layer implemented to recreate the features. In order to design the RBM, the nodes of all the layers are not linked whereas the nodes amongst all layers are linked to one another. So, every neuron procedure forms a bipartite graph.
RBM method is an energy-based probability technique. The trained procedure is used to treat all the trained samples as state vectors so as to maximize the probabilities of occurrence [22]. To provide a state
With Eq. (3), the probability distribution of joint is attained as follows.
In Eq. (4),
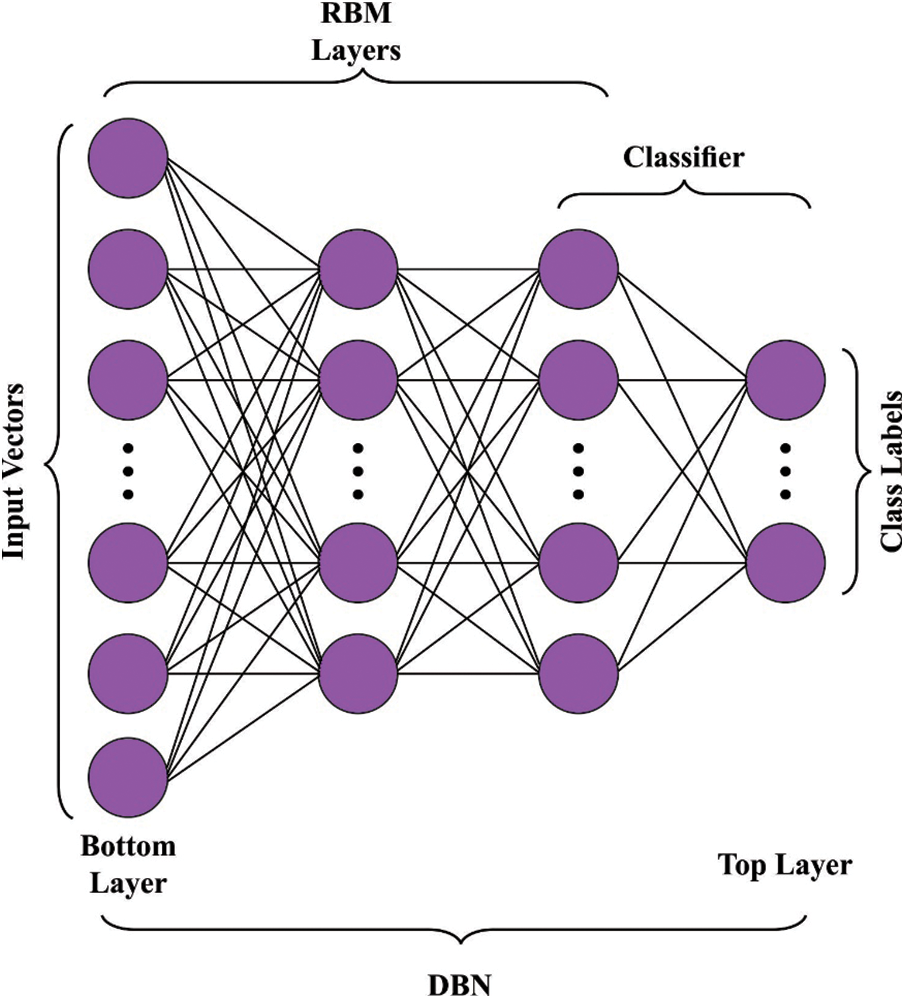
Figure 2: DBN structure
The probability of single hidden layer unit existence stimulated in RBM is as follows.
The probability of single visible layer unit presence stimulated in RBM is as follows.
BPNN has been utilized in several domains, due to its strong adaptive capability, non-linear mapping capability, and generalization capability. It can also alter the error with BP. The BP of BPNN proceeds an error signal based on original forward propagation direction. It can update the weight and threshold of all neurons from all hidden layers while the error signal can often be minimized with the error function.
The error function is as follows.
In Eq. (8),
3.3 Design of HHO Based Hyperparameter Tuning Technique
In final stage, the hyperparameters involved in DBN model are optimally adjusted by HHO algorithm. This is a novel metaheuristic method, proposed to resolve the global optimization problem. As a general rule, HHO simulates the behavior of hawks in nature at the time of catching and searching their prey. Like other MH models, HHO too performs the search procedure in two phases (viz., exploitation and exploration) depending on distinct approaches. This stage is described in detail herewith.
In exploration phase, HHO method upgrades the location of present hawk
whereas
Generally, the key objective of this phase is to widely spread the hawks over search space. The next subsection discusses how hawk changes its status from exploration to exploitation.
When changing from exploration to exploitation phase, the hawk moves to exploitation phase, according to their energy,
whereas
In exploitation phase, HHO is created by different approaches and some arbitrary parameters are employed to switch among these methods [23]. This method is formulated as following: (1) hard besiege, (2) soft besiege, (3) hard besiege with progressive rapid dives, and (4) soft besiege with progressive rapid dives.
Soft besiege: At this stage, the hawk moves around an optimal one and is expressed as follows.
Hard besiege: At this stage, the hawk upgrades their location according to the distance between them and optimal hawks and is formulated below.
Soft besiege with progressive rapid dives: In this phase, it is assumed that the hawk has the capacity to choose a subsequent action. is taken from the succeeding formula.
Levy flight (LF) is employed to calculate rapid dives during this phase.
whereas
whereas
whereas
For clarity, the preceding method is implemented based on hawk energy
The experimental validation of the presented technique was performed upon Localization Data for Person Activity (LDPA) dataset retrieved from UCI database. It comprises of seven classes namely, FLD (Falling, lying down), LDSD (Lying down, sitting down), LOAF (Lying, on all fours), LS (Lying, sitting), SUFLSUFS (Standing up from lying, standing up from sitting), SUFSSUFSOG (Standing up from sitting, standing up from sitting on the ground) and FSD (Falling, sitting down).
The results of the analysis accomplished by the proposed IHPTDL-HAR technique on classification of different classes before and after outlier detection process are given in Tab. 1. The figure reports that IHPTDL-HAR technique classified 640 instances under FLD class before outlier detection and 610 instances after outlier detection. In line with this, a total of 4357 instances was classified by IHPTDL-HAR technique before outlier detection and 4264 instances after outlier detection. Lastly, IHPTDL-HAR technique classified 322 and 284 instances under FSD before and after outlier detection processes respectively.
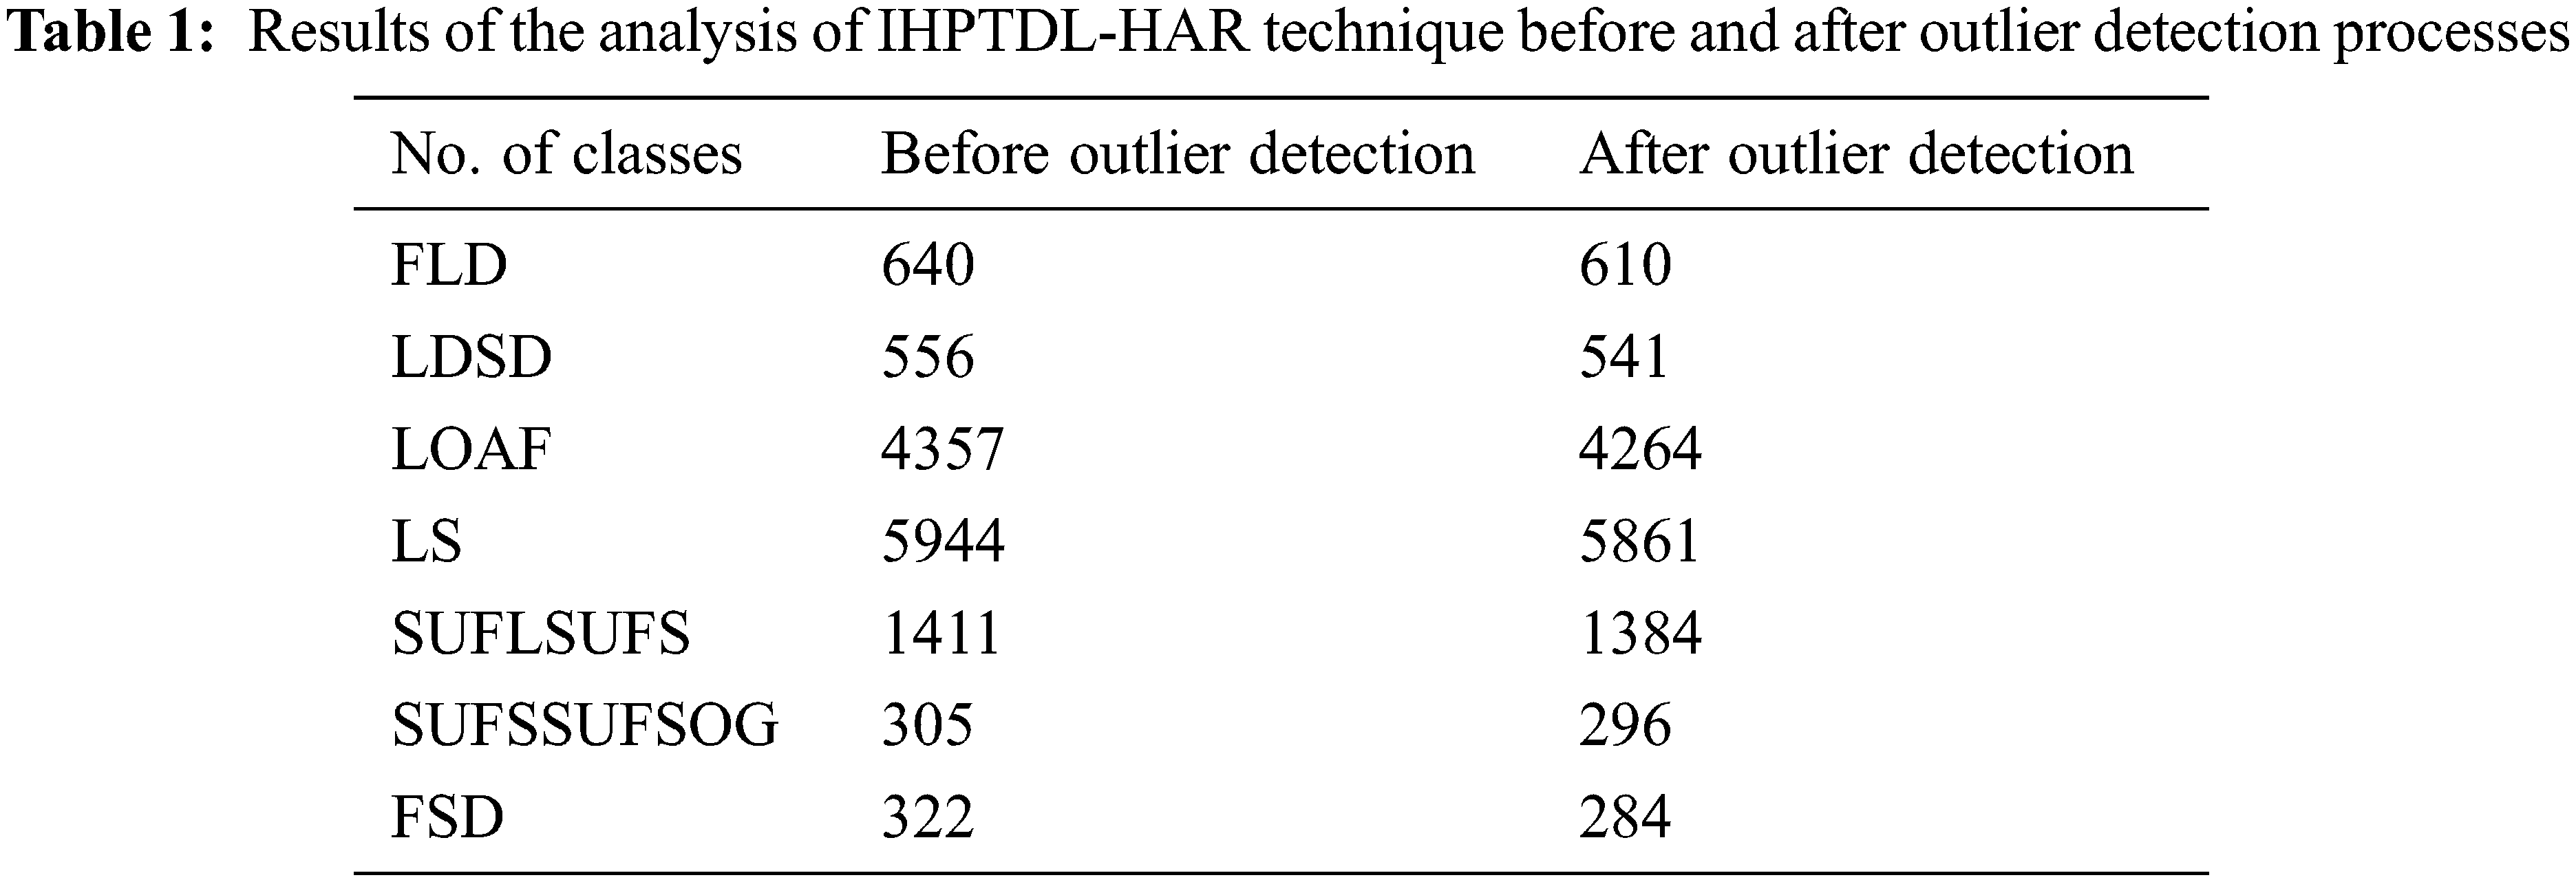
Fig. 3 portrays the confusion matrix generated by IHPTDL-HAR technique on the classification of different classes under training/testing data in the ratio of 80:20. The figure portrays that the proposed IHPTDL-HAR technique categorized 117 instances under FLD, 100 instances under LDSD, 833 instances under LOAF, 1087 instances under LS, 266 instances under SUFLSUFS, 55 instances under SUFSSUFSOG, and 54 instances under FSD.
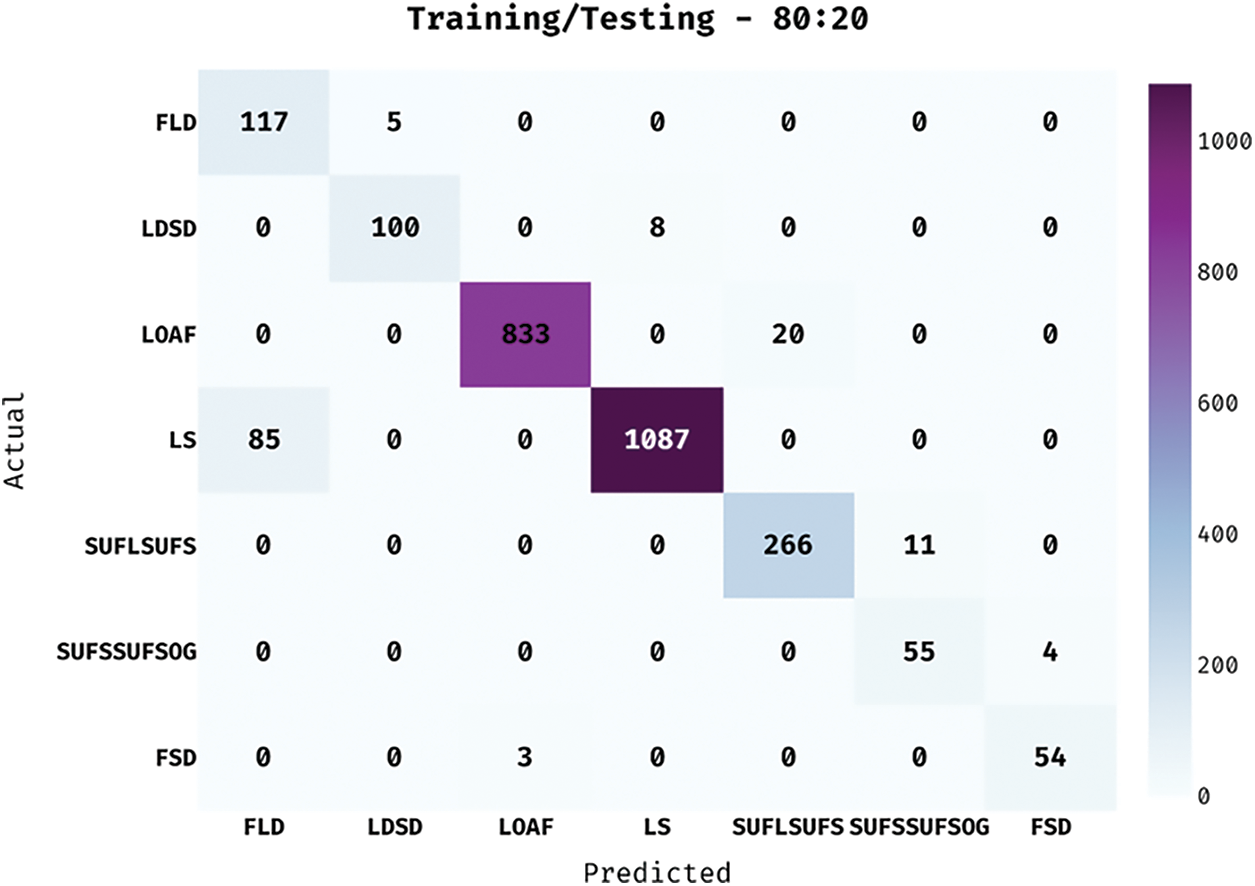
Figure 3: Confusion matrix of IHPTDL-HAR model on training/testing dataset (80:20)
ROC analysis was conducted and the results accomplished by IHPTDL-HAR technique under 80:20 training/testing data set are demonstrated in Fig. 4. The figure depicts that the proposed IHPTDL-HAR technique achieved a proficient performance with high ROC of 99.7749%.
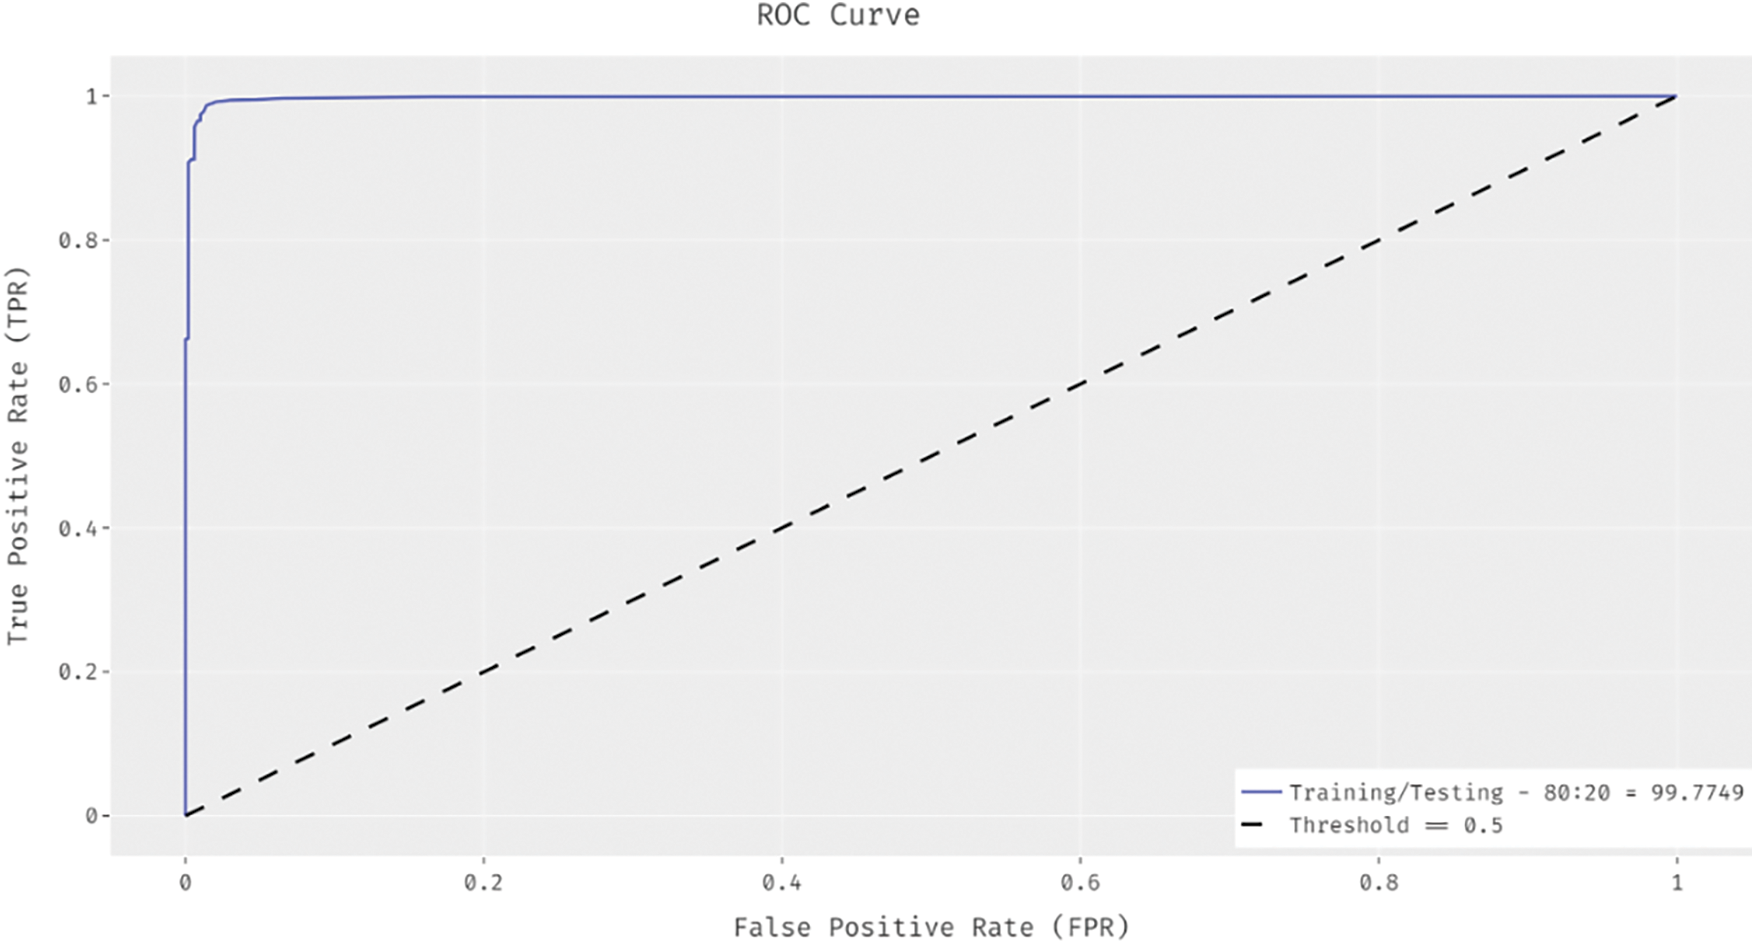
Figure 4: ROC Analysis Results of IHPTDL-HAR model on training/testing dataset (80:20)
Fig. 5 showcases the confusion matrix generated by IHPTDL-HAR method on the classification of different classes under 70:30 training/testing data. The figure states that IHPTDL-HAR method categorized 172 instances under FLD, 149 instances under LDSD, 1102 instances under LOAF, 1608 instances under LS, 355 instances under SUFLSUFS, 75 instances under SUFSSUFSOG, and 72 instances under FSD.
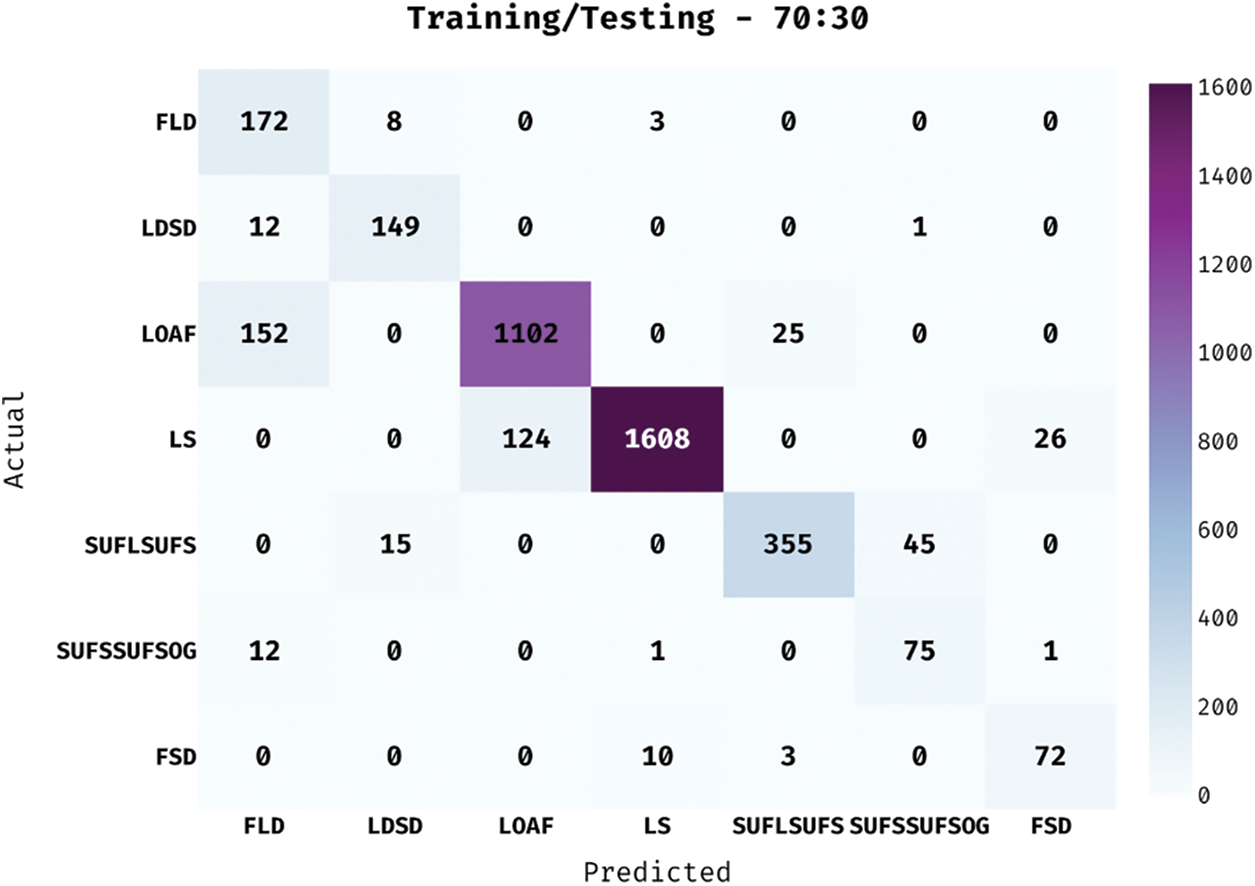
Figure 5: Confusion matrix of IHPTDL-HAR model on training/testing dataset (70:30)
ROC analysis was conducted and the results accomplished by IHPTDL-HAR method under 70:30 training/testing data are shown in Fig. 6. The figure represents that IHPTDL-HAR methodology resulted in a proficient performance with an increased ROC of 99.0359%.
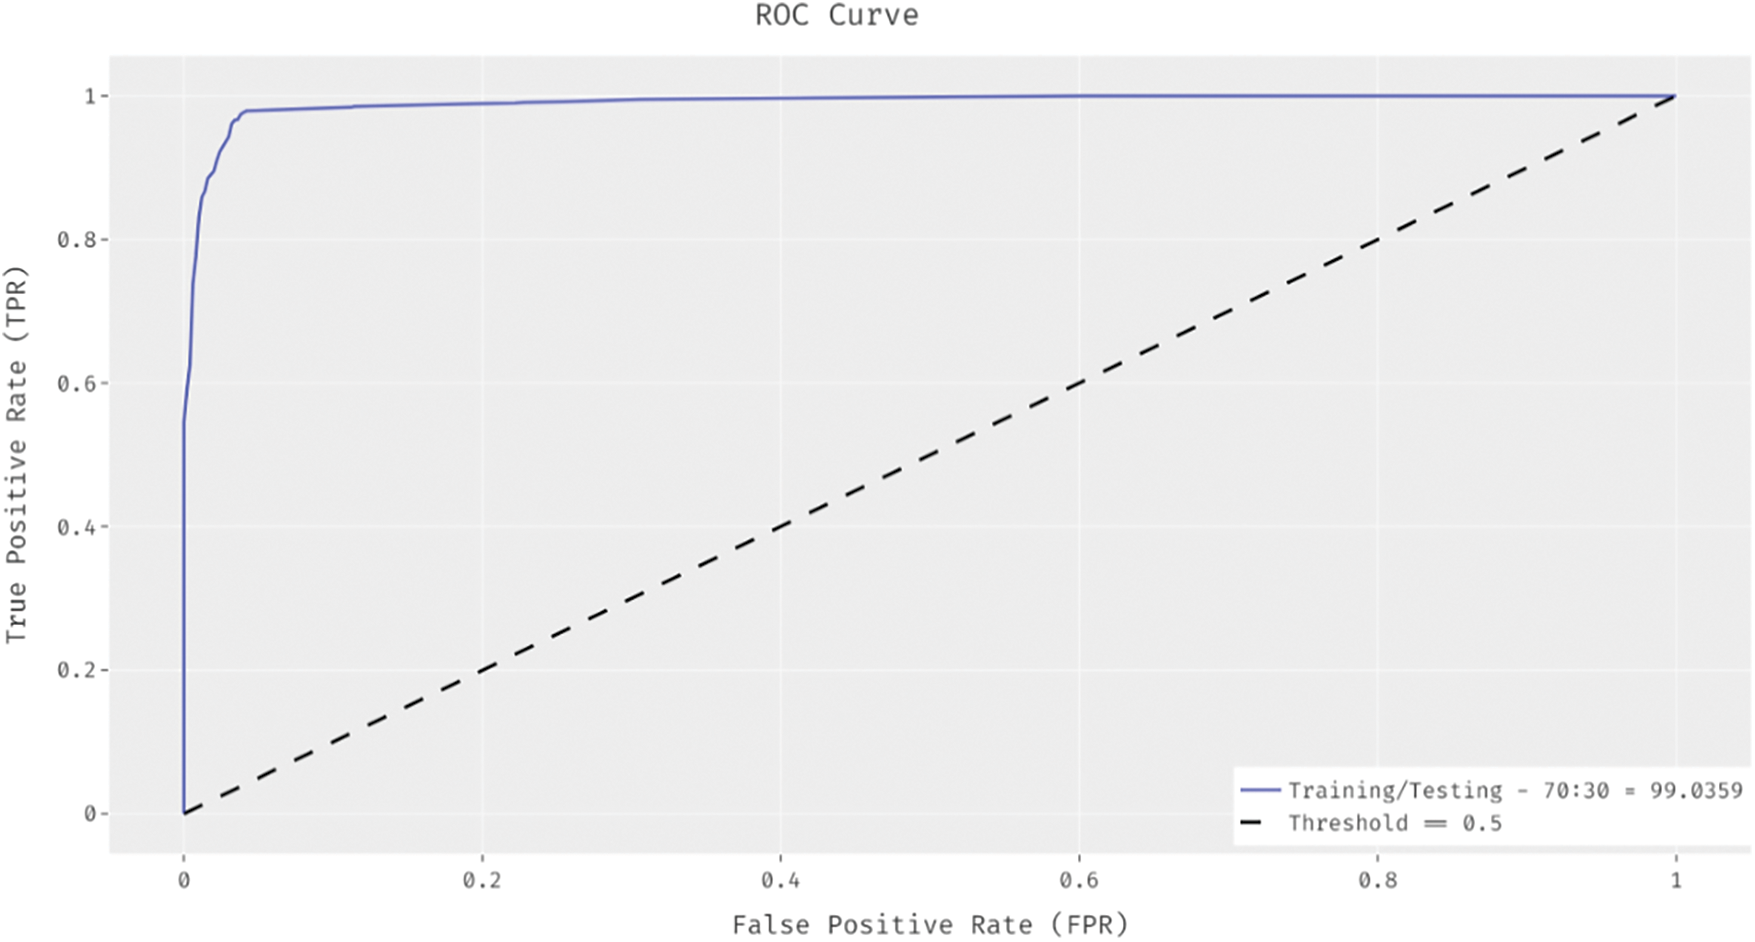
Figure 6: ROC analysis of IHPTDL-HAR model on training/testing dataset (70:30)
Fig. 7 illustrates the confusion matrix generated by IHPTDL-HAR method on classification of distinct classes under 60:40 training/testing data. The figure describes that the proposed IHPTDL-HAR methodology categorized 214 instances under FLD, 193 instances under LDSD, 1439 instances under LOAF, 1998 instances under LS, 480 instances under SUFLSUFS, 99 instances under SUFSSUFSOG, and 94 instances under FSD.
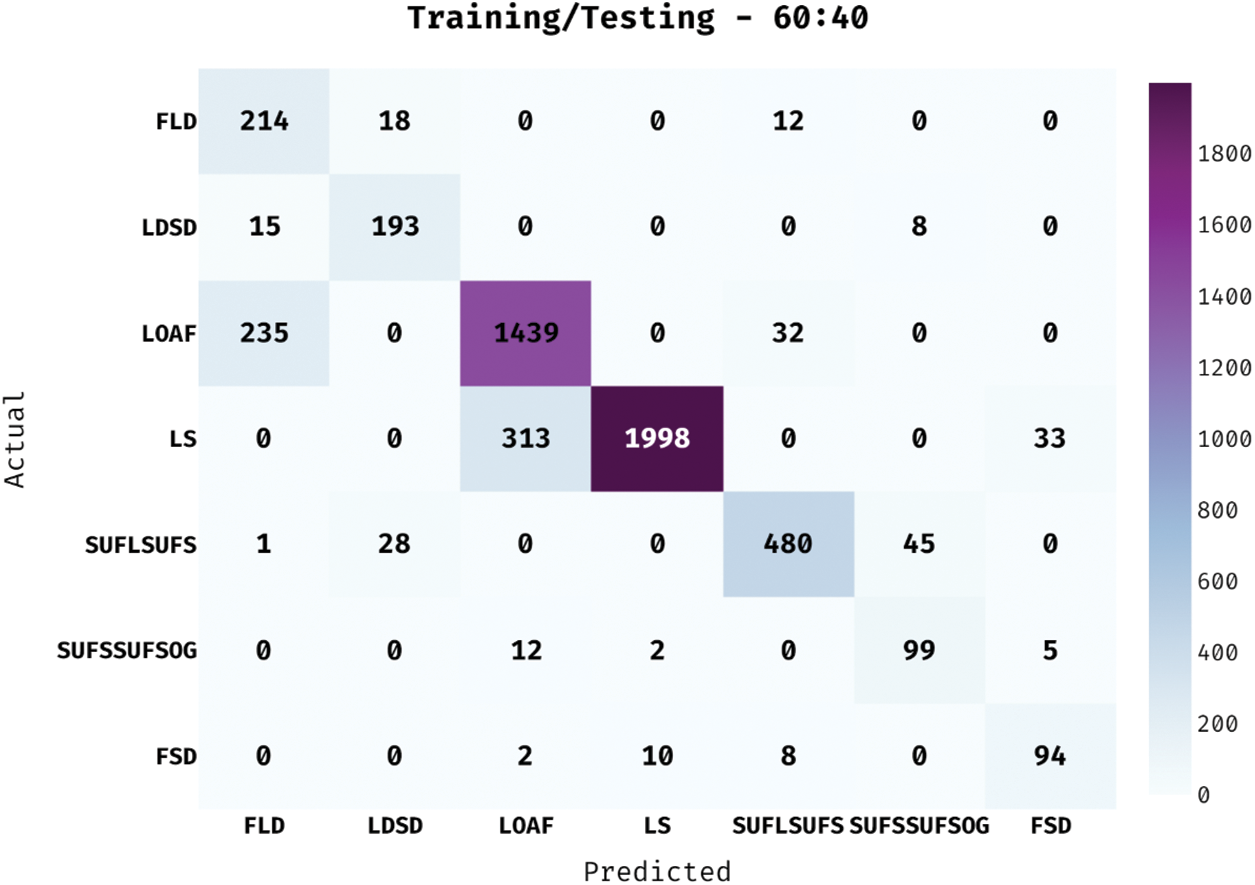
Figure 7: Confusion matrix of IHPTDL-HAR model on training/testing dataset (60:40)
Fig. 8 showcases that IHPTDL-HAR approach accomplished a proficient performance with a maximum ROC of 98.4930%.
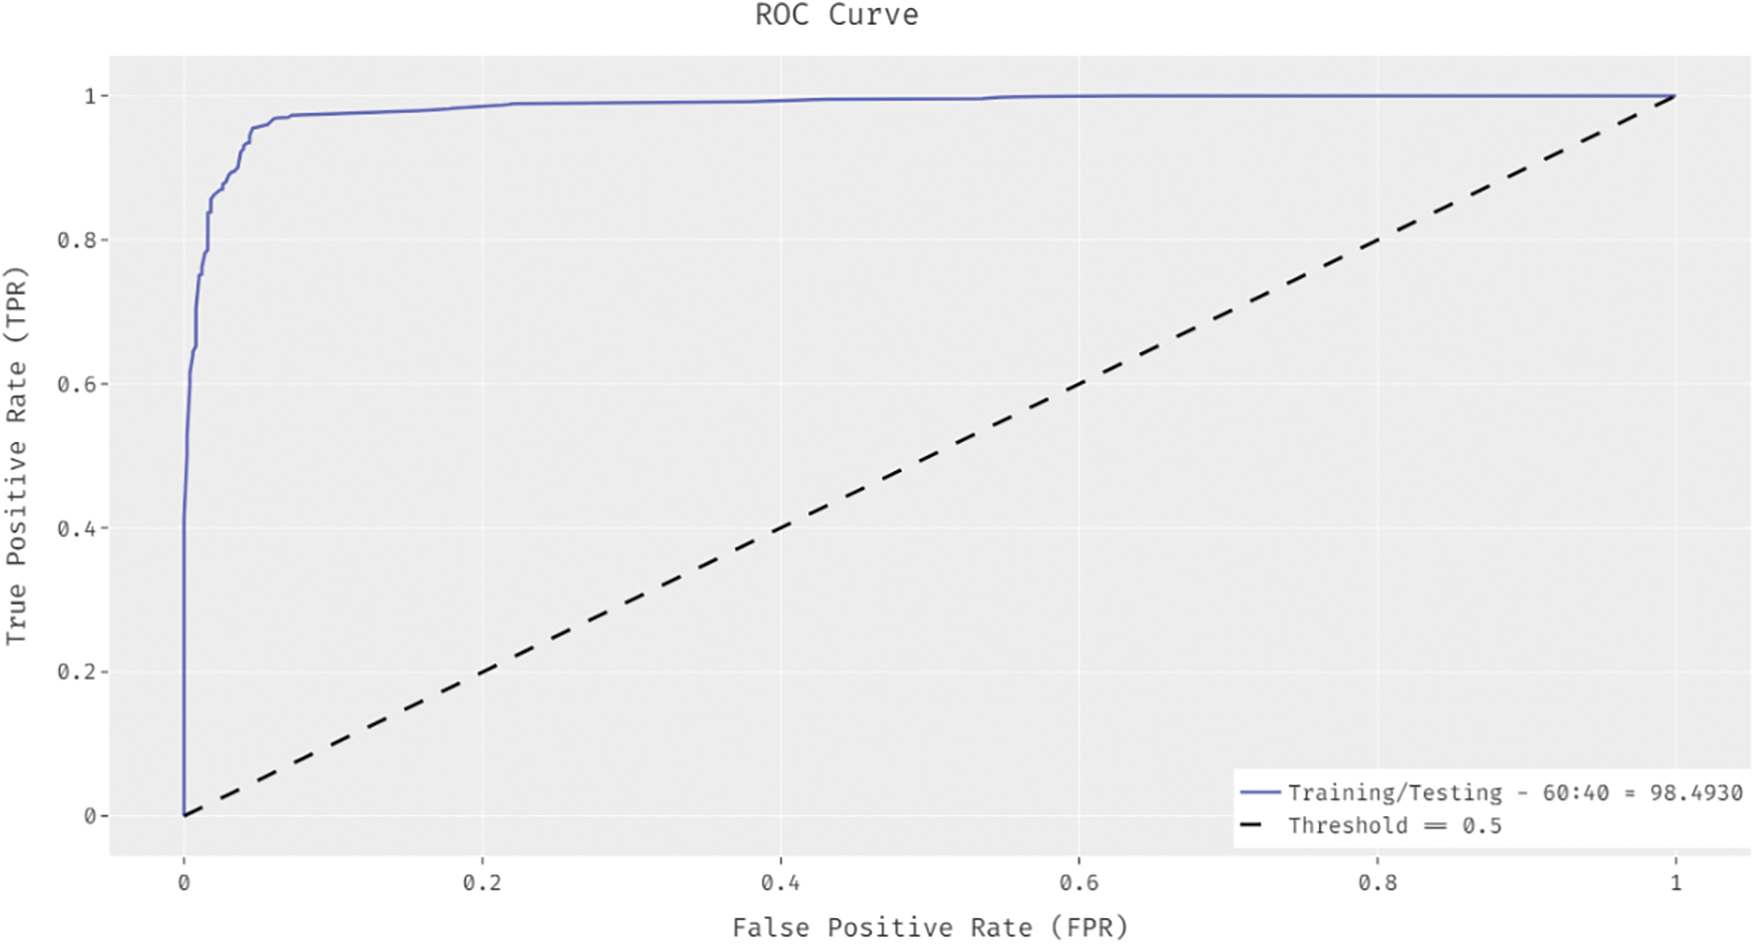
Figure 8: ROC analysis of IHPTDL-HAR model on training/testing dataset (60:40)
Tab. 2 provides the results of a comprehensive classification analysis attained by IHPTDL-HAR technique under varying training/testing data. The results demonstrate that IHPTDL-HAR technique classified all the samples under proper class labels in case of varying training/testing data. For instance, with 80L20 training/testing data, IHPTDL-HAR technique classified the instances at an average PPV of 0.8879, TPR of 0.9470, TNR of 0.9919, accuracy of 0.9853, F-score of 0.9101, and a Hamming loss of 0.0514. Likewise, with 70:30 training/testing data, the proposed IHPTDL-HAR approach classified the instances with an average PPV of 0.7893, TPR of 0.8830, TNR of 0.9812, accuracy of 0.9685, F-score of 0.8226, and a Hamming loss of 0.1103. Similarly, with 60:40 training/testing data, the IHPTDL-HAR methodology classified the instances at an average PPV of 0.7632, TPR of 0.8566, TNR of 0.9739, accuracy of 0.9580, F-score of 0.7972, and Hamming loss of 0.1471.
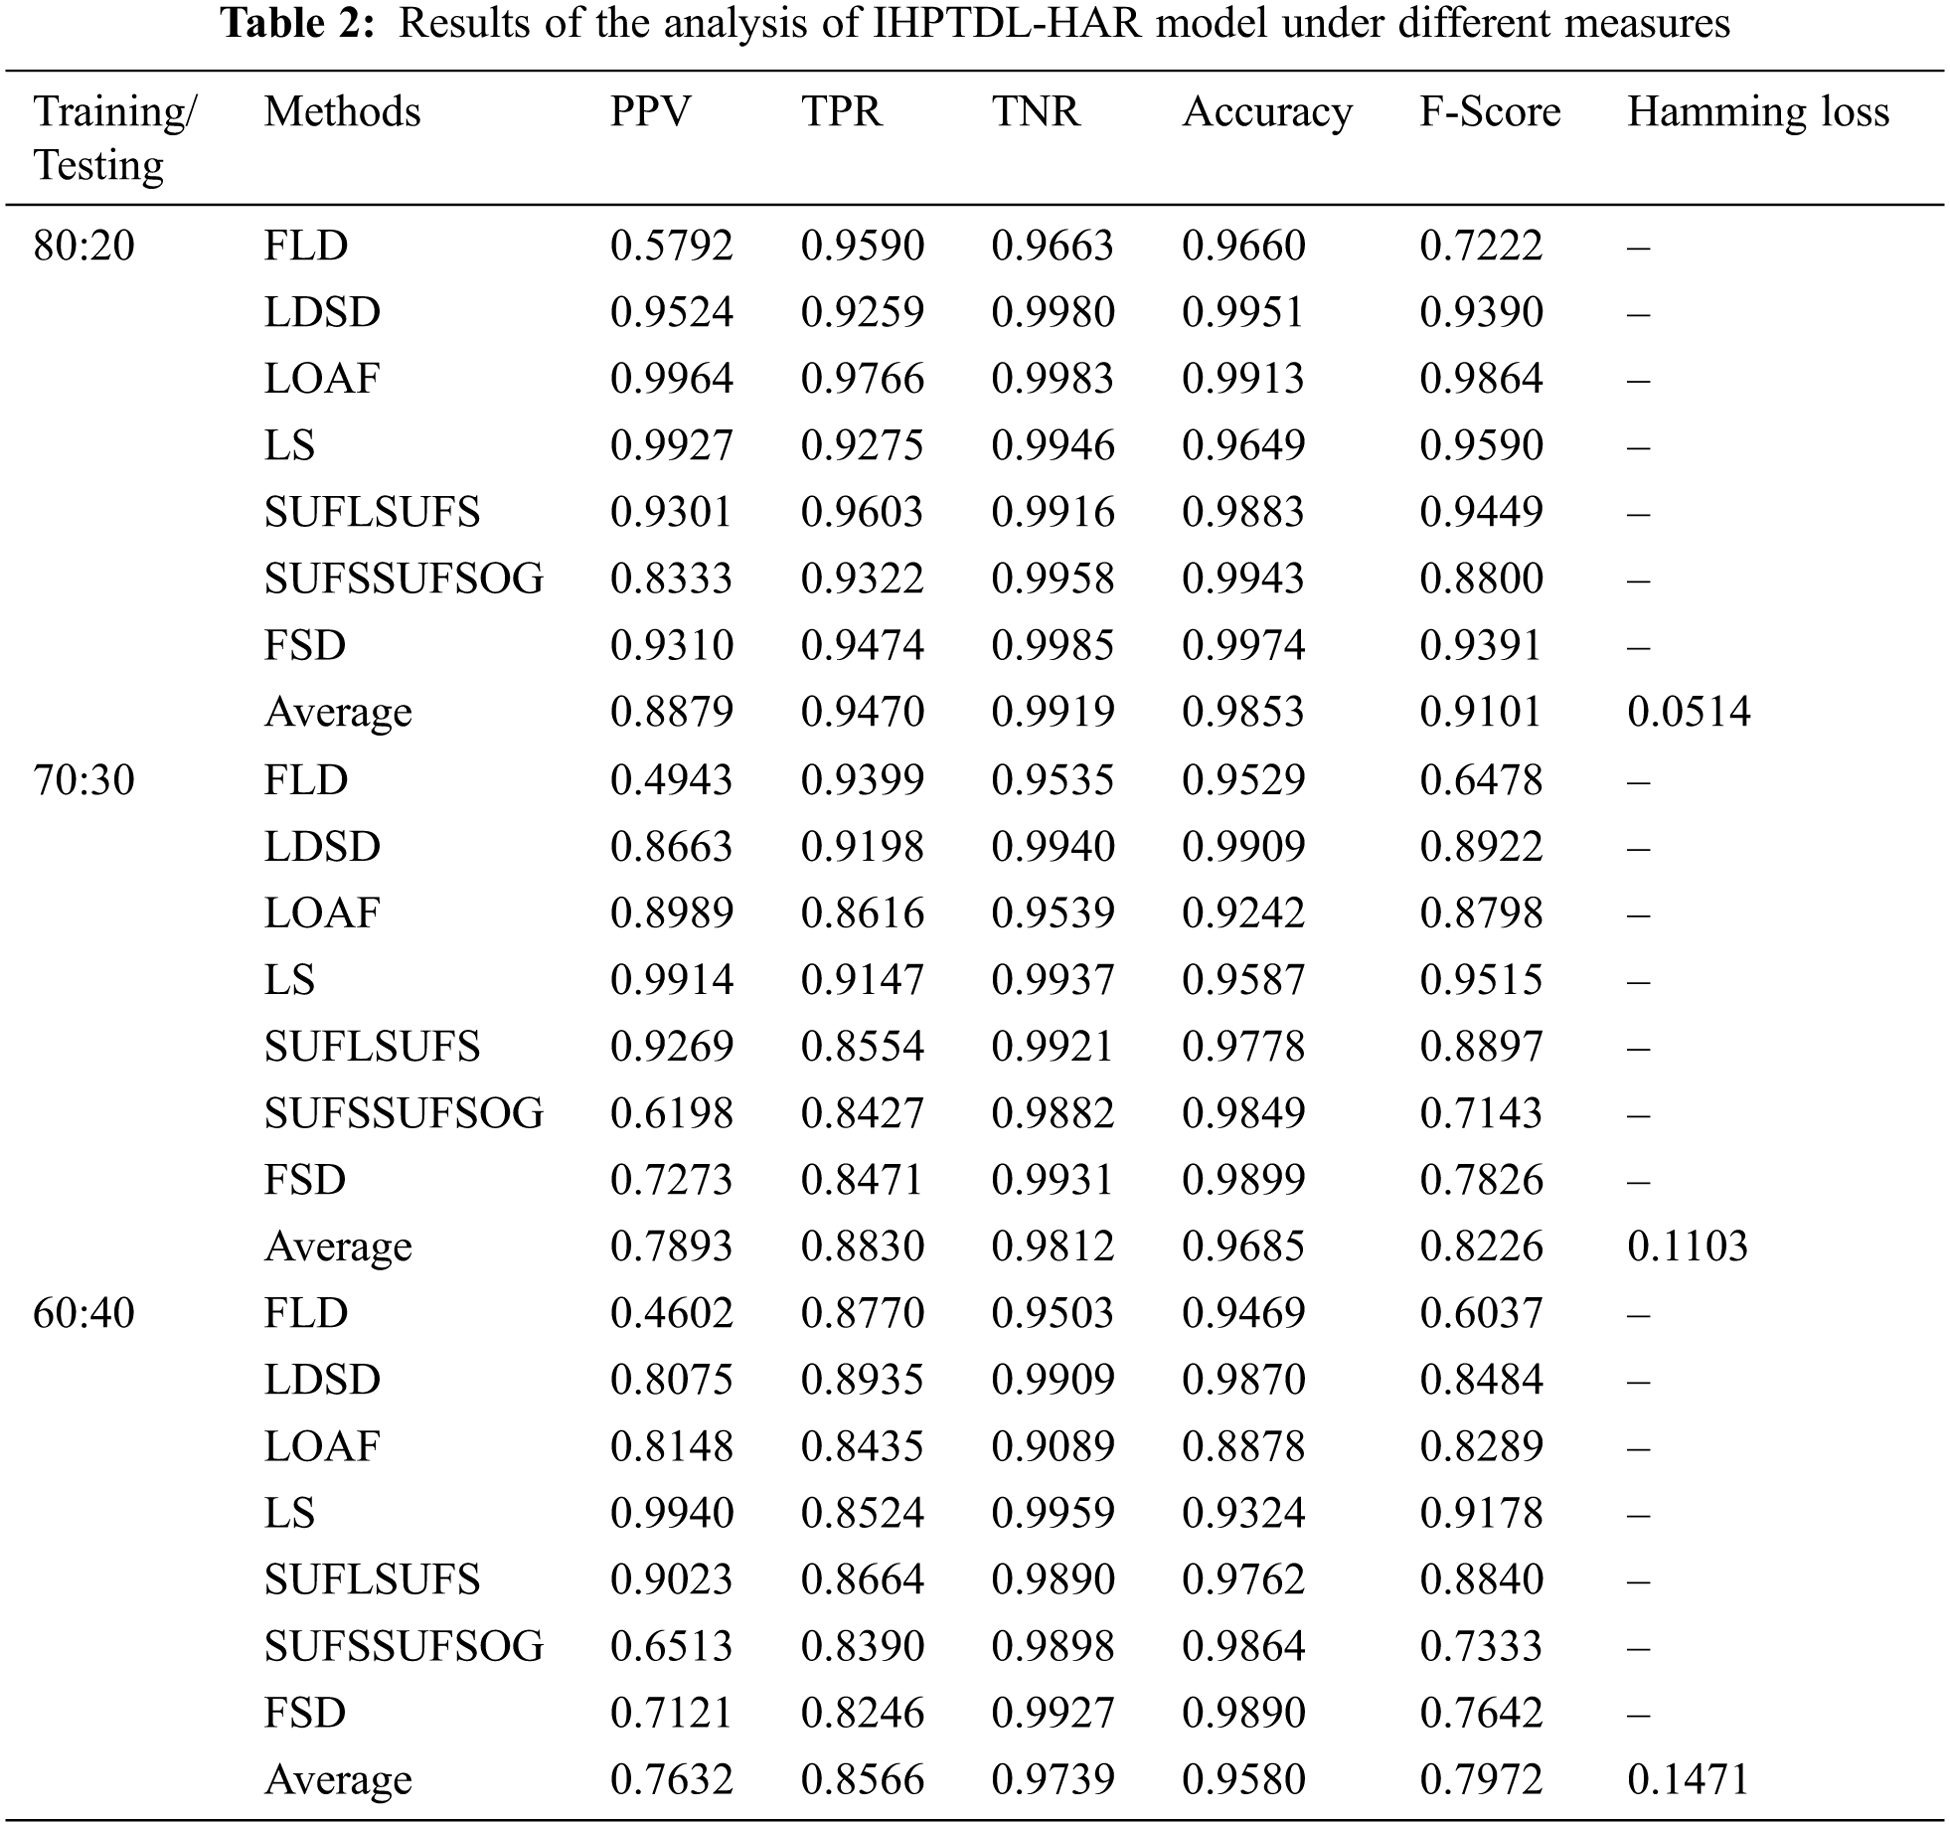
Fig. 9 shows the results achieved by IHPTDL-HAR method from training and validation accuracy analysis. The outcomes describe that the accuracy value got increased at maximum epoch count. Besides, the validation accuracy was considerably superior to training accuracy.
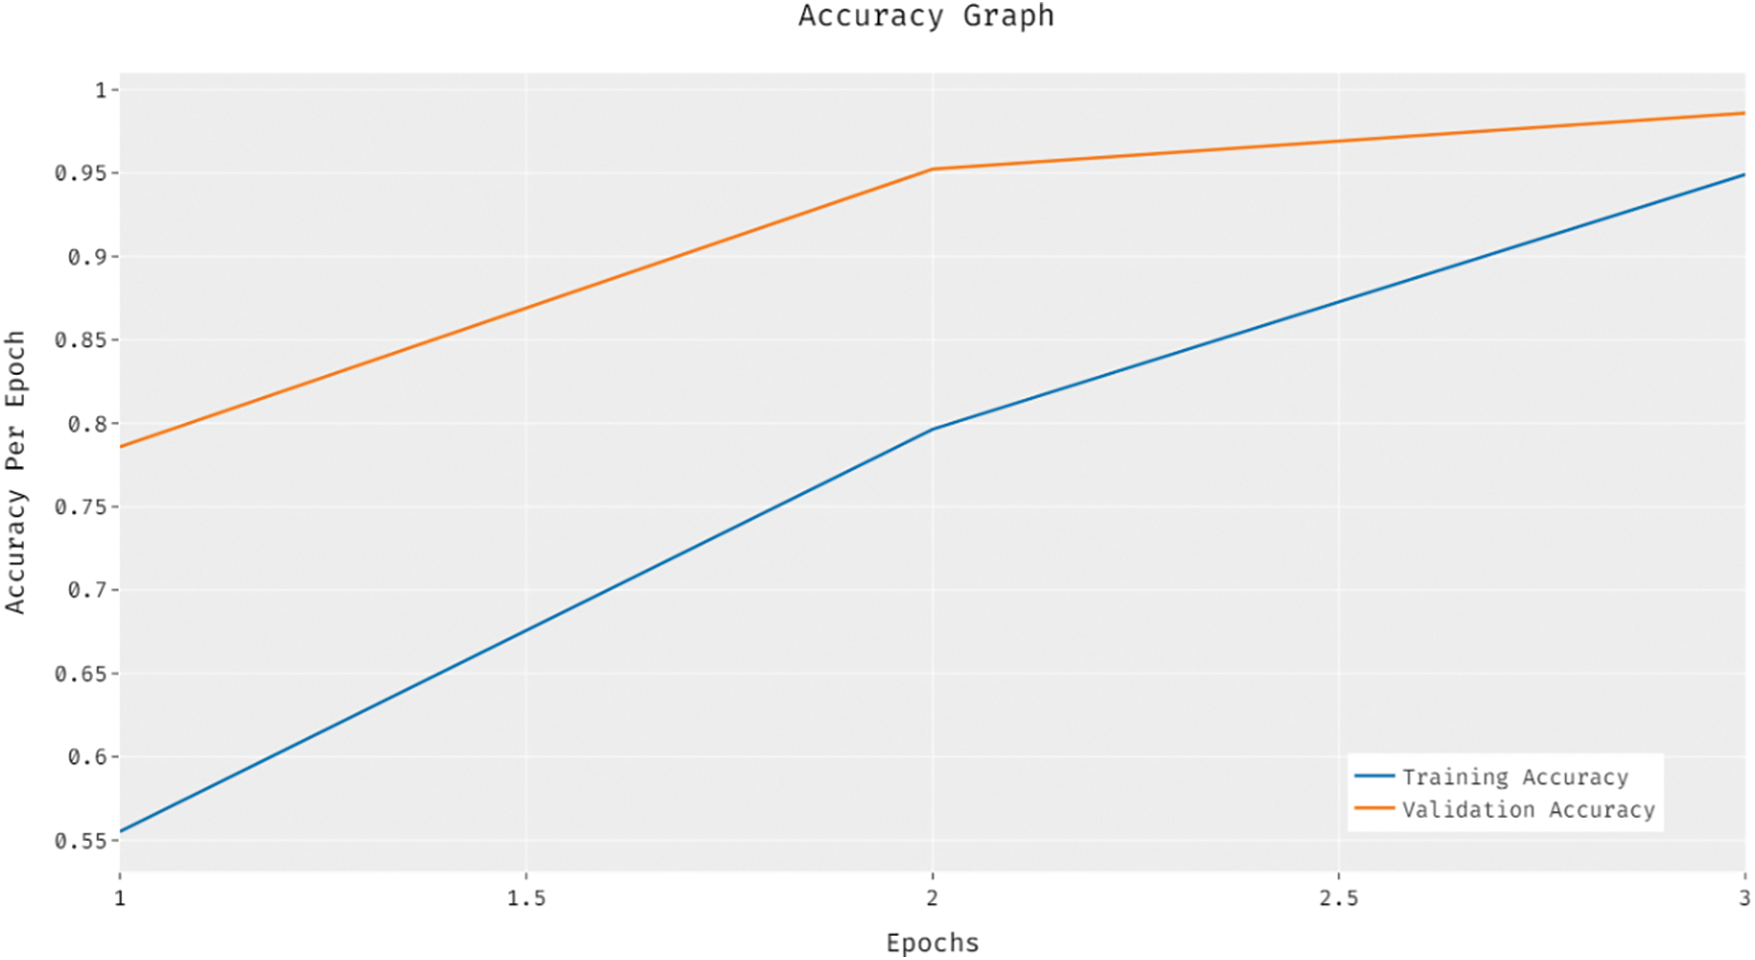
Figure 9: Accuracy analysis of IHPTDL-HAR model
Fig. 10 depicts the results of training and validation loss analysis accomplished by IHPTDL-HAR manner. The outcomes showcase that the loss value got reduced with an increase in the amount of epochs. In addition, the validation loss was significantly minimum related to training loss.
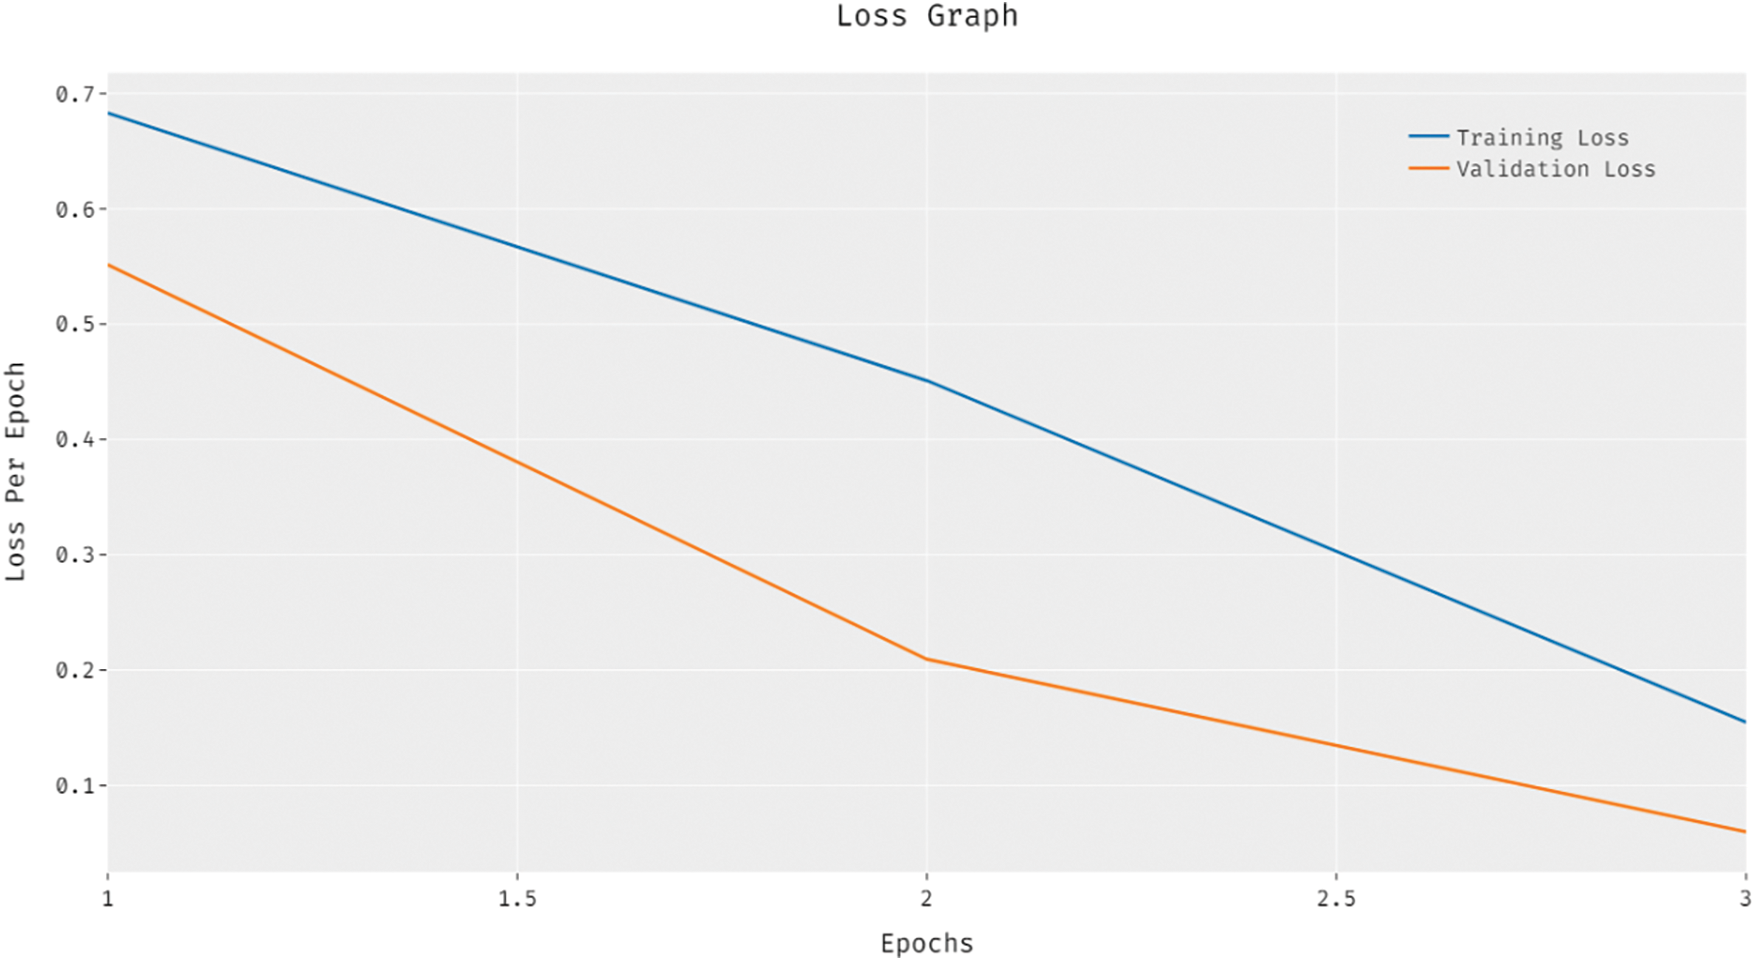
Figure 10: Loss analysis of IHPTDL-HAR model
Tab. 3 demonstrates the comparative analysis results of IHPTDL-HAR model against existing techniques in terms of accuracy, PPV, and hamming loss.
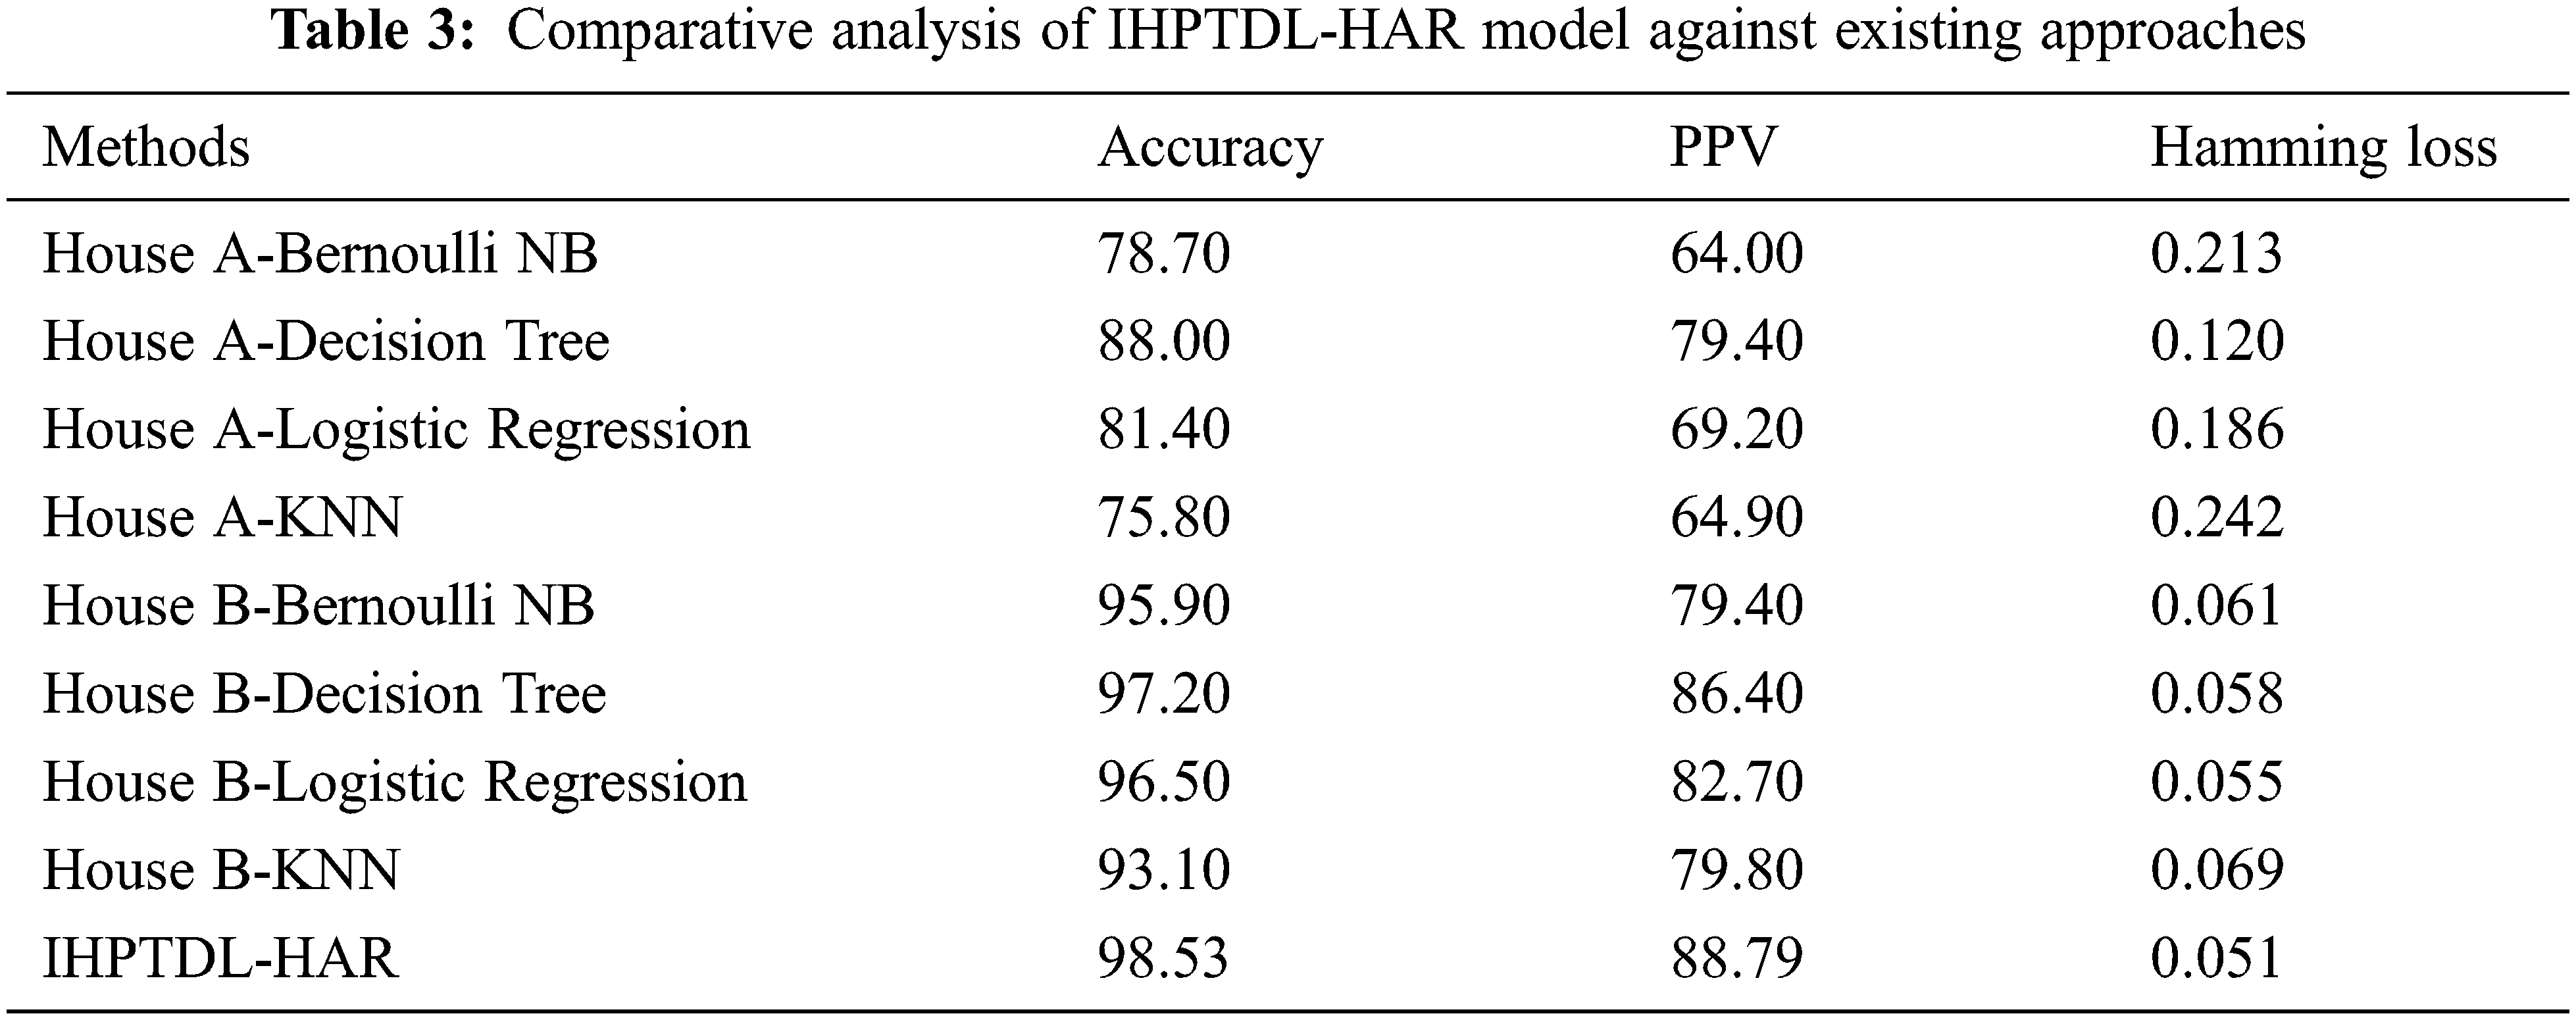
Fig. 11 demonstrates the accuracy analysis results achieved by IHPTDL-HAR technique against recent approaches on test dataset. The figure reports that House A-KNN and House A-Bernoulli NB techniques attained the least accuracy values such as 75.8% and 78.7% respectively. In line with this, both House A-LR and House-A DT techniques obtained slightly improved accuracy values such as 81.4% and 88% respectively. Followed by, House B-KNN, House B-Bernoullin NB, House B-LR, and House B-DT techniques reached moderately closer accuracy values such as 93.10%, 95.9%, 96.5%, and 97.2% respectively. However, IHPTDL-HAR technique outperformed the previous methods and achieved a maximum accuracy of 98.53%.
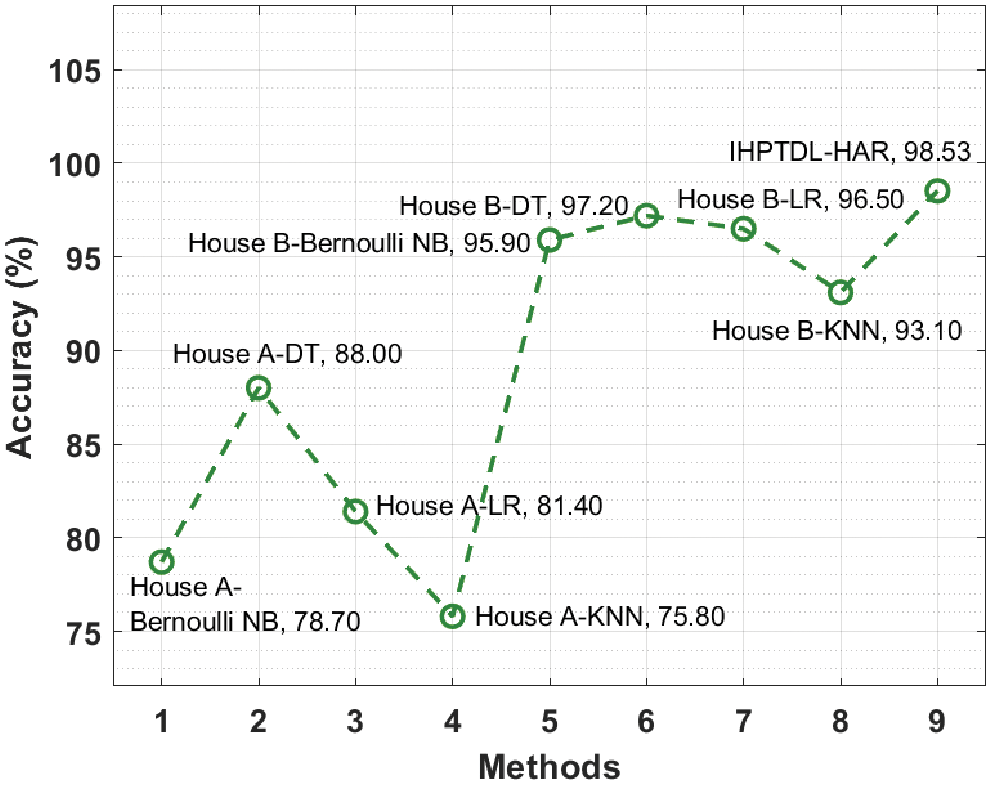
Figure 11: Accuracy analysis of various methods with proposed model
Tab. 3 showcases the PPV analysis results achieved by IHPTDL-HAR method against recent approaches on test dataset. The figure describes that House A-Bernoulli NB and House A-KNN methods reached minimum PPV values such as 64% and 64.90% correspondingly. Also, House A-LR and House-A DT methodologies gained somewhat higher PPV values like 69.20% and 79.40% correspondingly. At the same time, House B-Bernoullin NB, House B-KNN, House B-LR, and House B-DT methods achieved moderately closer PPV values namely, 79.40%, 79.80%, 82.70%, and 86.40% correspondingly. Finally, IHPTDL-HAR method outperformed previous methods through a maximal PPV of 88.79%.
Tab. 3 shows the superior performance of IHPTDL-HAR algorithm against existing techniques on test dataset in hamming loss analysis. The table shows that House A-KNN and House A-Bernoulli NB methods obtained the maximum hamming losses such as 0.242 and 0.213 correspondingly. Similarly, House A-LR and House-A DT methods gained slightly maximum hamming loss values like 0.186 and 0.120 respectively. Similarly, House B-KNN, House B-Bernoullin NB, House B-DT, and House B-LR algorithms attained moderately closer hamming loss values namely, 0.069, 0.061, 0.058, and 0.055. Eventually, IHPTDL-HAR method outperformed all other existing algorithms and achieved the least hamming loss of 0.051. Based on the detailed observations made from results, it is obvious that the proposed IHPTDL-HAR technique is a proficient tool to recognize human actions in healthcare environment.
In this study, an efficient IHPTDL-HAR technique is derived to determine human activities under healthcare environment. IHPTDL-HAR technique is comprised of three major processes namely, HC-based outlier detection, DBN-based classification, and HHO-based hyperparameter optimization. The application of outlier detection process and hyperparameter tuning process helps in considerable increase in recognition performance. In order to showcase the superiority of the proposed IHPTDL-HAR technique in terms of performance, extensive sets of simulations were conducted and the outcomes were inspected under diverse aspects. The experimental outcomes established the superior performance of IHPTDL-HAR technique over recent techniques under different performance measures. In future, IHPTDL-HAR technique can be deployed in real-time smart hospitals and smart homes to assist patients and elderly people.
Funding Statement: This research was supported by Korea Institute for Advancement of Technology (KIAT) grant funded by the Korea Government (MOTIE) (P0012724, The Competency Development Program for Industry Specialist) and the Soonchunhyang University Research Fund.
Conflicts of Interest: The authors declare that they have no conflicts of interest to report regarding the present study.
1. R. Liu, A. A. Ramli, H. Zhang, E. Datta, E. Henricson et al., “An overview of human activity recognition using wearable sensors: Healthcare and artificial intelligence,” arXiv preprint arXiv: 2103.15990, 2021. [Google Scholar]
2. L. M. Dang, K. Min, H. Wang, M. J. Piran, C. H. Lee et al., “Sensor-based and vision-based human activity recognition: A comprehensive survey,” Pattern Recognition, vol. 108, pp. 107561, 2020. [Google Scholar]
3. M. H. M. Noor, Z. Salcic and K. I. K. Wang, “Adaptive sliding window segmentation for physical activity recognition using a single tri-axial accelerometer,” Pervasive and Mobile Computing, vol. 38, no. 5, pp. 41–59, 2017. [Google Scholar]
4. J. Wang, Y. Chen, S. Hao, X. Peng and L. Hu, “Deep learning for sensor-based activity recognition: A survey,” Pattern Recognition Letters, vol. 119, no. 4, pp. 3–11, 2019. [Google Scholar]
5. X. Zhou, W. Liang, K. I. K. Wang, H. Wang, L. T. Yang et al., “Deep-learning-enhanced human activity recognition for internet of healthcare things,” IEEE Internet Things Journal, vol. 7, no. 7, pp. 6429–6438, 2020. [Google Scholar]
6. S. W. Lee and K. Mase, “Activity and location recognition using wearable sensors,” IEEE Pervasive Computing, vol. 1, no. 3, pp. 24–32, 2002. [Google Scholar]
7. J. Mantyjarvi, J. Himberg and T. Seppanen, “Recognizing human motion with multiple acceleration sensors,” in 2001 IEEE Int. Conf. on Systems, Man and Cybernetics. e-Systems and e-Man for Cybernetics in Cyberspace (Cat.No.01CH37236), Tucson, AZ, USA, vol.2, pp. 747–752, 2001. [Google Scholar]
8. C. Chen, R. Jafari and N. Kehtarnavaz, “A survey of depth and inertial sensor fusion for human action recognition,” Multimedia Tools and Applications, vol. 76, no. 3, pp. 4405–4425, 2017. [Google Scholar]
9. B. Nguyen, Y. Coelho, T. Bastos and S. Krishnan, “Trends in human activity recognition with focus on machine learning and power requirements,” Machine Learning with Applications, vol. 5, no. 10, pp. 100072, 2021. [Google Scholar]
10. S. Jeong and D. Oh, “Development of a hybrid deep-learning model for the human activity recognition based on the wristband accelerometer signals,” Journal of Internet Computing and Services, vol. 22, no. 3, pp. 9–16, 2021. [Google Scholar]
11. X. Li, Y. Wang, B. Zhang and J. Ma, “PSDRNN: An efficient and effective HAR scheme based on feature extraction and deep learning,” IEEE Transactions on Industrial Informatics, vol. 16, no. 10, pp. 6703–6713, 2020. [Google Scholar]
12. Q. Zhu, Z. Chen and Y. C. Soh, “A novel semisupervised deep learning method for human activity recognition,” IEEE Transactions on Industrial Informatics, vol. 15, no. 7, pp. 3821–3830, 2019. [Google Scholar]
13. P. Agarwal and M. Alam, “A lightweight deep learning model for human activity recognition on edge devices,” Procedia Computer Science, vol. 167, no. 2, pp. 2364–2373, 2020. [Google Scholar]
14. D. Mukherjee, R. Mondal, P. K. Singh, R. Sarkar and D. Bhattacharjee, “EnsemConvNet: A deep learning approach for human activity recognition using smartphone sensors for healthcare applications,” Multimedia Tools and Applications, vol. 79, no. 41–42, pp. 31663–31690, 2020. [Google Scholar]
15. A. Gumaei, M. M. Hassan, A. Alelaiwi and H. Alsalman, “A hybrid deep learning model for human activity recognition using multimodal body sensing data,” IEEE Access, vol. 7, pp. 99152–99160, 2019. [Google Scholar]
16. F. Luo, X. Wang, Q. Wu, J. Liang, X. Qiu et al., “HQADeepHelper: A deep learning system for healthcare question answering,” in Companion Proceedings of the Web Conf. 2020, Taipei Taiwan, pp. 194–197, 2020. [Google Scholar]
17. M. A. Basset, H. Hawash, R. K. Chakrabortty, M. Ryan, M. Elhoseny et al., “ST-DeepHAR: Deep learning model for human activity recognition in IoHT applications,” IEEE Internet of Things Journal, vol. 8, no. 6, pp. 4969–4979, 2021. [Google Scholar]
18. R. Janarthanan, S. Doss and S. Baskar, “Optimized unsupervised deep learning assisted reconstructed coder in the on-nodule wearable sensor for human activity recognition,” Measurement, vol. 164, no. 3, pp. 108050, 2020. [Google Scholar]
19. M. M. Hassan, M. Z. Uddin, A. Mohamed and A. Almogren, “A robust human activity recognition system using smartphone sensors and deep learning,” Future Generation Computer Systems, vol. 81, no. 2, pp. 307–313, 2018. [Google Scholar]
20. G. K. Gudur, P. Sundaramoorthy and V. Umaashankar, “ActiveHARNet: Towards on-device deep bayesian active learning for human activity recognition,” in The 3rd International Workshop on Deep Learning for Mobile Systems and Applications - EMDL ’19. Seoul, Republic of Korea, 7–12, 2019. [Google Scholar]
21. M. Aghagolzadeh, H. S. Zadeh and B. N. Araabi, “Information theoretic hierarchical clustering,” Entropy, vol. 13, no. 2, pp. 450–465, 2011. [Google Scholar]
22. Y. Ma, J. Li and R. Guo, “Application of data fusion based on deep belief network in air quality monitoring,” Procedia Computer Science, vol. 183, no. 1, pp. 254–260, 2021. [Google Scholar]
23. I. Attiya, M. A. Elaziz and S. Xiong, “Job scheduling in cloud computing using a modified harris hawks optimization and simulated annealing algorithm,” Computational Intelligence and Neuroscience, vol. 2020, no. 16, pp. 1–17, 2020. [Google Scholar]
 | This work is licensed under a Creative Commons Attribution 4.0 International License, which permits unrestricted use, distribution, and reproduction in any medium, provided the original work is properly cited. |