DOI:10.32604/csse.2023.024674
| Computer Systems Science & Engineering DOI:10.32604/csse.2023.024674 | |
| Article |
Brain Tumor Diagnosis Using Sparrow Search Algorithm Based Deep Learning Model
1Department of Computer Science and Business Systems, Sri Krishna College of Engineering and Technology, Coimbatore, 641008, India
2Department of Information Technology, Sri Krishna College of Technology, Coimbatore, 641008, India
3Department of Electronics and Communication Engineering, Kings Engineering College, Chennai, 602117, India
4Department of Electronics and Communication Engineering, R.M.K. Engineering College, Chennai, 601206, India
5Deparmtent of Applied Data Science, Noroff University College, Kristiansand, Norway
6Medical Convergence Research Center, Wonkwang University, Iksan, Korea
7Department of Computer Science and Engineering, Soonchunhyang University, Asan, Korea
*Corresponding Author: Yunyoung Nam. Email: ynam@sch.ac.kr
Received: 27 October 2021; Accepted: 31 December 2021
Abstract: Recently, Internet of Medical Things (IoMT) has gained considerable attention to provide improved healthcare services to patients. Since earlier diagnosis of brain tumor (BT) using medical imaging becomes an essential task, automated IoMT and cloud enabled BT diagnosis model can be devised using recent deep learning models. With this motivation, this paper introduces a novel IoMT and cloud enabled BT diagnosis model, named IoMTC-HDBT. The IoMTC-HDBT model comprises the data acquisition process by the use of IoMT devices which captures the magnetic resonance imaging (MRI) brain images and transmit them to the cloud server. Besides, adaptive window filtering (AWF) based image preprocessing is used to remove noise. In addition, the cloud server executes the disease diagnosis model which includes the sparrow search algorithm (SSA) with GoogleNet (SSA-GN) model. The IoMTC-HDBT model applies functional link neural network (FLNN), which has the ability to detect and classify the MRI brain images as normal or abnormal. It finds useful to generate the reports instantly for patients located in remote areas. The validation of the IoMTC-HDBT model takes place against BRATS2015 Challenge dataset and the experimental analysis is carried out interms of sensitivity, accuracy, and specificity. The experimentation outcome pointed out the betterment of the proposed model with the accuracy of 0.984.
Keywords: Internet of medical things; healthcare; brain tumor; disease classification; deep learning; metaheuristics
With the extensive use of equipment in the limited security provisioning, medical sector, and lower power computing device, several security intimidations might occur. The more dangerous security threats in the healthcare sector are confronted by brain tumors since the survival rate is around 34.9% [1]. With the management of Internet of things (IoT) devices [2], especially Internet of medical things (IoMT), patients’ information could be stolen by the attackers using botnet [3]. Thus, the privacy of IoMT device is indispensable [4,5]. The brain is considered as the primary organ, take the responsibility for emotions, memory, motor skills, vision, respiration, reactions, and many other regulating functions of the human body. This function is seriously damaged if any tumor begins to grow inside the brain. This tumor has most important brain tumor that begins to grow inside the brain, i.e., a metastasis brain tumor/the growth of brain tissues itself, that grows in other parts of body as well as spread to brain. The irregular growth of cells in a brain is called a brain tumor that results in secondary (malignant)/primary (benign) tumor. The secondary tumor is cancerous and might extend to another part of the brain and body whereas, Primary tumor is non-cancerous and doesn’t spread from one portion of a brain to another. While the development of a malignant/benign, the skull is enforced to expand and, consequently, damage the brain, i.e., very dangerous. Therefore, the accurate prediction of brain tumors at an earlier stage is highly significant for the treatment, diagnosis, and prognosis, i.e., only feasible by employing secured methods or algorithms on IoMT device. Conventional approaches used to detect brain tumor is biopsy and investigation of computed tomography (CT) scans images by persons.
With the growth of medical imaging techniques (CT scan, magnetic resonance imaging (MRI), and so on.) as well as the advances in digital image processing, computer-aided diagnosis (CAD) of tumors and tissues has improved [6]. During the previous decades, various methods have been projected for CAD systems for brain tumors, like Support Vector Machine (SVM) [7], fused vectors, deep networks, and transfer learning. With the current trends in deep networks, Convolutional Neural Network (CNN) method was extensively employed for distinct CAD schemes [8]. CNN is a sequence of multiple layers in which all the layers extract features and transform a complicated input to an activation format, by means of partial differential function. CNN framework consists of fully connected, convolution, and pooling layers. While the convolutional layers gradually extract features, pooling layer down sample with the spatial domain, and the fully connected layer categorizes [9]. A vanishing gradient problem might increase while smaller number appears when computing gradients. The CNN layer consists of output, input, dropout, and network in network layers [10].
This paper introduces a novel IoMT and cloud enabled BT diagnosis model, named IoMTC-HDBT. The IoMTC-HDBT model comprises the data acquisition process by the use of IoMT devices which captures the MRI brain images and transmit them to the cloud server. Besides, adaptive window filtering (AWF) based image preprocessing is used to remove noise. In addition, the cloud server executes the disease diagnosis model based on sparrow search algorithm (SSA) with GoogleNet (SSA-GN). The IoMTC-HDBT model applies functional link neural network (FLNN). The performance evaluation of the IoMTC-HDBT model is carried out using the BRATS2015 Challenge dataset and the results are inspected under varying measures.
Reference [11] includes the application of a deep convolutional neural network (DCNN) to diagnose brain tumors from magnetic resonance (MR) images. The datasets contain 253 brain MR images of which 155 images are stated to have tumors. This method could distinguish the MR images using tumors with 96% of total accuracy. In [12], a CNN based complex network (CNNBCN) using an adapted activation function for the MRI classification of brain tumors has been proposed. The network framework isn’t designed and optimized automatically; however, it is created by arbitrarily created graph algorithm. This randomly generated graph is mapped to a computable neural network (NN) through a network generator.
Reference [13] presented a novel technique for forecasting the probability of being malignant brain tumors based on human physical symptoms with IoT. Another advanced technique to detect the malignant brain tumor based MRI image uses X-ray light for detecting malignant tumors, i.e., harmful for health and more expensive. Alternatively, the presented method is developed in a portable manner for monitoring the real-world blood pressure, body temperature, heart rate as well as best suited to predict the probability of being malignant tumors than present technologies. In [14], a Rectangular Microstrip Patch Antenna was developed for Microwave Imaging (MI) using a frequency range of 1.5 to 3 GHz at a resonant frequency of 2.3 GHz (5G-Band) in the CST Studio Suite Software for identifying brain tumors. Reference [15] present a methodology of multilevel features extraction and concatenation for earlier diagnoses of brain tumors. The 2 pretrained deep learning (DL) methods that are DensNet201 and Inception-v3 make this method effective. By using this method, 2 distinct scenarios of brain tumor diagnosis and its classification have been estimated. Initially, the feature from distinct Inception models have been extracted from pretrained Inception-v3 module and concatenated this feature for brain tumor classification. Next, this feature is passed onto softmax classifiers for classifying the brain tumor. Then, pretrained DensNet201 has been employed for extracting features from different DensNet blocks. Subsequently, this feature was concatenated and passed onto softmax classifier for classifying the brain tumor.
Reference [16] introduce a Hybrid Two-Track U-Net (HTTU-Net) framework for brain tumor segmentation. This framework leverages the usage of Leaky Rectified linear unit (Relu) activation method. It comprises 2 tracks; all have a distinct amount of layers and use a dissimilar kernel size. Next, combine these 2 tracks for generating the last segmentation. They utilize the generalized Dice (GDL), loss functions, and focal loss, for addressing the problems of class imbalance. In [17], a DL method-based CNN is presented for classifying various brain tumor kinds with 2 open-source databases. The previous one categorizes tumors into (pituitary, meningioma, glioma, and tumor). Reference [18] adapt deep separable convolution layer for replacing the standard framework in the U-Net for distinguishing the appearance and spatial correlations of the mapped convolution network. They present residual skip connection to the ACU-Net for heightening the propagation capacity of the feature and accelerating the convergence speed of networks for realizing the capture of deep abnormal regions.
In this study, a novel IoMTC-HDBT technique has been presented to detect and classify the BT using medical images. The proposed IoMTC-HDBT technique encompasses AWF based image filtering, GoogleNet based feature extraction, SSA based hyperparameter tuning, and FLNN based classification. The IoMTC-HDBT technique has the ability to detect and classify the MRI brain images as normal or abnormal.
For gathering the medical data of the patients, smart IoMT devices are utilized. The medicinal IoMT devices capture the images and transmit them to the cloud server. Then, the cloud server receives the medical images and executes the disease diagnosis model, involving different subprocesses as discussed in the following.
At this stage, the AWF technique is applied to remove the noise that exists in the medical images. In order to study, an AWF technique was implemented for filtering the impulse noise [19]. Based on the radio of pixels are affected as the impulse noise from distinct regions, alters the dimensional of filter window.
Assume the primary dimensional of filter window is
The adaptive MF has separated as to part a and part
Where,
1. As adaptive window filter functions for changing the dimensional of filter window based on the influence extents of impulse noise, not only this it can resolve the entire failure of MF technique, i.e., it is elected the adaptive filter window for getting optimum filter outcome.
2. An only noise signal is filtered, and maintain the helpful signals that aren’t influenced as the impulse noise. During the course of filter, only non-noise pixels do the filter function, and the noise pixels have been foreclosed. Afterward, it is lesser the outcome of impulse noise for the filtering resultant.
3. Only impulse noise pixel filters, thus related to standard MF technique, the speed is significantly higher, and it can improve the feasibility of the techniques.
3.3 SSA with GoogleNet Based Feature Extraction
During feature extraction, the preprocessed images are fed into the GoogleNet model to derive feature vectors. The CNN can extract accurate feature vectors due to their strong feature-learning capability. But, it could not implement time-series network packet recognition. So, the CNN-long short term memory (LSTM) technique is particularly planned for effectual intrusion recognition, where the CNN has primarily utilized for obtaining the feature vector which is then utilized to time-series recognition by LSTM network. Convention CNN isn’t efficient at feature extraction if utilized with industrial control information which is a huge amount of features and displays difficult variation. Therefore, in the presented manner, GoogLeNet has been utilized rather than convention CNN for obtaining further accurate feature vectors. The GoogLeNet has been kind of CNN with different frameworks named as inception modules [20]. It implements computations utilizing distinct kinds of kernels from single layer; however, convention CNN is only one variety of kernels.
The generally utilized kernel from GoogLeNet are 1 × 1, 3 × 3, 5 × 5, and 7 × 7, and the computation outcomes in this kernel are joined as to last output. The feature is an optimum signified to calculate the distinct scales. The several inception components are stacked for performing computations from various layers. The width as well as depth of network is superior to individuals of convention CNN. Thus the outcome, the GoogLeNet is to remove richer features in industrial control information. Also, the GoogLeNet is carry out functions for handling the huge amount of parameters rising in utilize of numerous kinds of kernels and various layers from the networks. The 1 × n convolutional kernel and n × 1 convolutional kernel are utilized for replacing n × n convolutional kernel to maximum dimension feature modeling. So the GoogLeNet has been appropriate to utilize as lightweight feature extraction networks from the presented technique.
To optimally modify the hyperparameters involved in the GoogleNet model, the SSA is utilized [21]. The SSA has a novel kind of swarm intelligence (SI) optimized technique simulated as detecting the foraging as well as anti-predation performance of sparrow. Its bionic rules are as follows:
Two behavior approaches from the foraging procedure of sparrows, one is the finder and another is joiner. The finder has been leader of populations, mostly finding the foraging region and particular way to the whole sparrow populations, and the joiner commonly follows the lead of the finder for obtaining food. Simultaneously, for increasing its rate of predation, any joiners are monitoring the finder for competing with them to food/forage in their surroundings. If the whole sparrow population is threatened as predator/recognizes the danger, it is conducting anti-predation performance.
In SSA, the finder offers importance to food and takes a higher foraging range than the finder. The finder usually accounts for [10%–20%] of populations, and the place upgrade equation is as follows at all iterations:
where:
But the finder, the residual sparrows have every joiner as well as upgrade its places based on the subsequent equation:
where
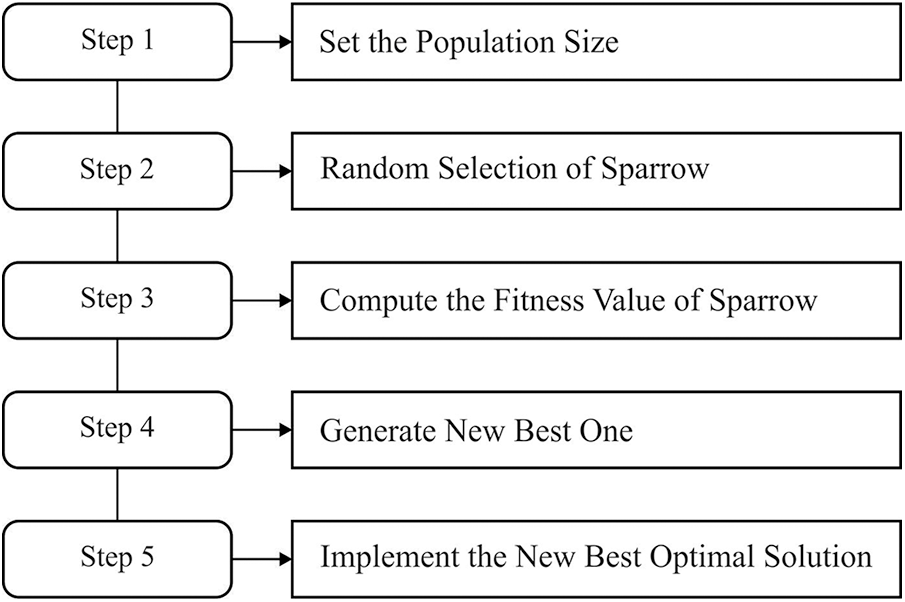
Figure 1: Flowchart of SSA
If the danger has been initiated, the sparrow set is conduct anti-predation performance and their place was upgraded as:
During the equation:
At the final stage, the FLNN model receives the feature vectors and assigns class labels to the input test images. Usually, the functional link-based NN techniques are single-layer artificial neural network (ANN) framework modelling maximum rate of convergence and minimum computational loads than individuals of multi layer perceptron (MLP) framework. The performance and mapping capability of ANN and their function to channel equalization have been described. The mathematical process and computational are estimated as per MLP. Patra initially presented functional link ANN (FLNN), and it can be new single-layer ANN framework able of creating randomly difficult decision regions with creating non-linear decision boundaries [22]. Fig. 2 illustrates the framework of FLNN model. In FLNN, the hidden layer is eliminated. In addition, the FLNN design offers minimum computational difficulty and superior convergence speed than individuals of MLP due to their single-layer framework. At this point, the functional development block creates utilize of functional method containing a subset of orthogonal sin and cos fundamental function and the novel design together with their outer product. The BP technique that is utilized for training the network, develops very easily due to absence of some hidden layer.
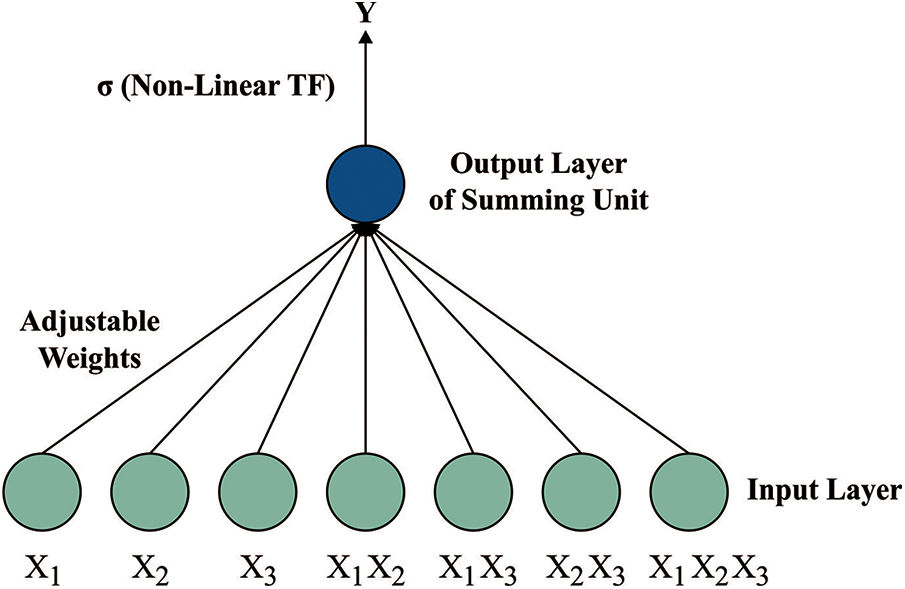
Figure 2: Structure of FLNN
This section investigates the BT classification performance of the IoMTC-HDBT technique against benchmark BT dataset from Kaggle repository [23]. The dataset comprises 98 images under Normal class and 155 images under Abnormal class. The dataset includes images with the size of 192 * 192 to 630 * 630. Fig. 3 illustrates a few sample images.
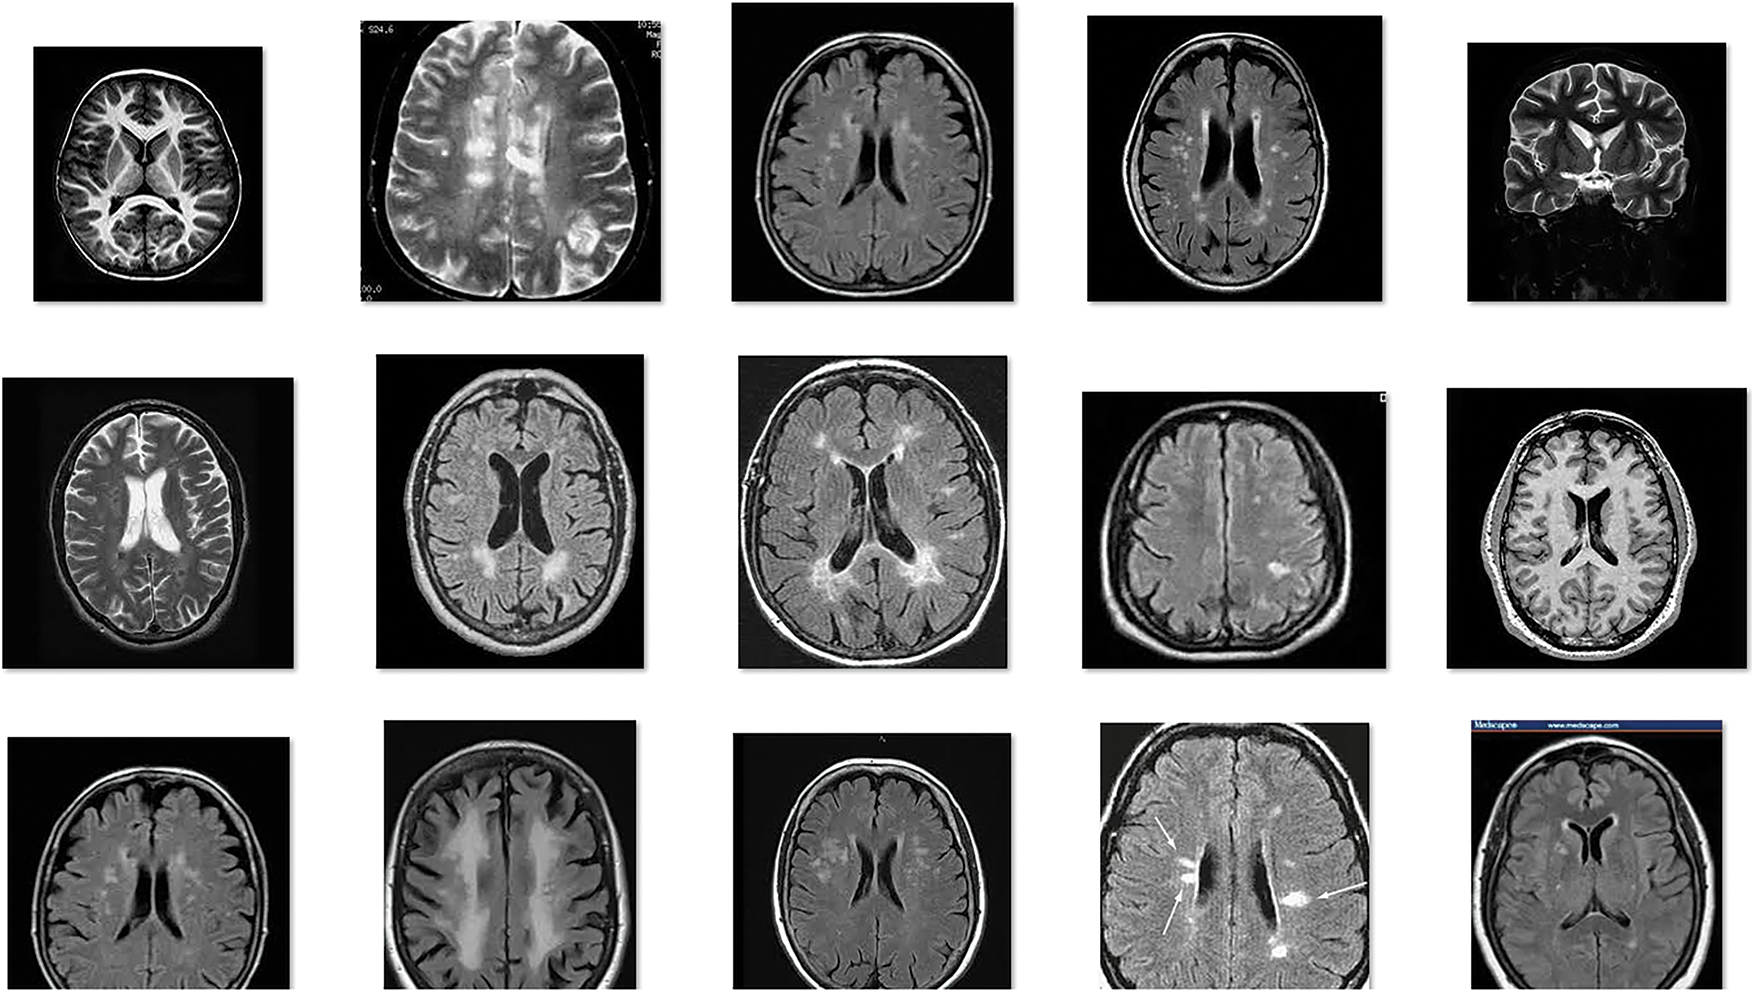
Figure 3: Sample images
The set of confusion matrices generated by the IoMTC-HDBT technique on the test dataset is given in Fig. 4. The figures show that the IoMTC-HDBT technique has effectually identified the images into Normal and Abnormal classes. For instance, with run-1, the IoMTC-HDBT technique has identified 96 images into Normal and 152 images into Abnormal class. Likewise, with run-4, the IoMTC-HDBT approach has identified 85 images into Normal and 153 images into Abnormal class. Also, with run-6, the IoMTC-HDBT manner has identified 98 images into Normal and 154 images into Abnormal class. In addition, with run-8, the IoMTC-HDBT method has identified 95 images into Normal and 153 images into Abnormal class. Lastly, with run-10, the IoMTC-HDBT algorithm has identified 98 images into Normal and 152 images into Abnormal class.

Figure 4: Confusion matrix of IoMTC-HDBT model
Tab. 1 and Fig. 5 offer a brief classification results analysis of the IoMTC-HDBT technique under ten distinct runs. The experimental results highlighted that the IoMTC-HDBT technique has proficiently classified the images under various runs. For instance, with run-1, the IoMTC-HDBT technique has attained
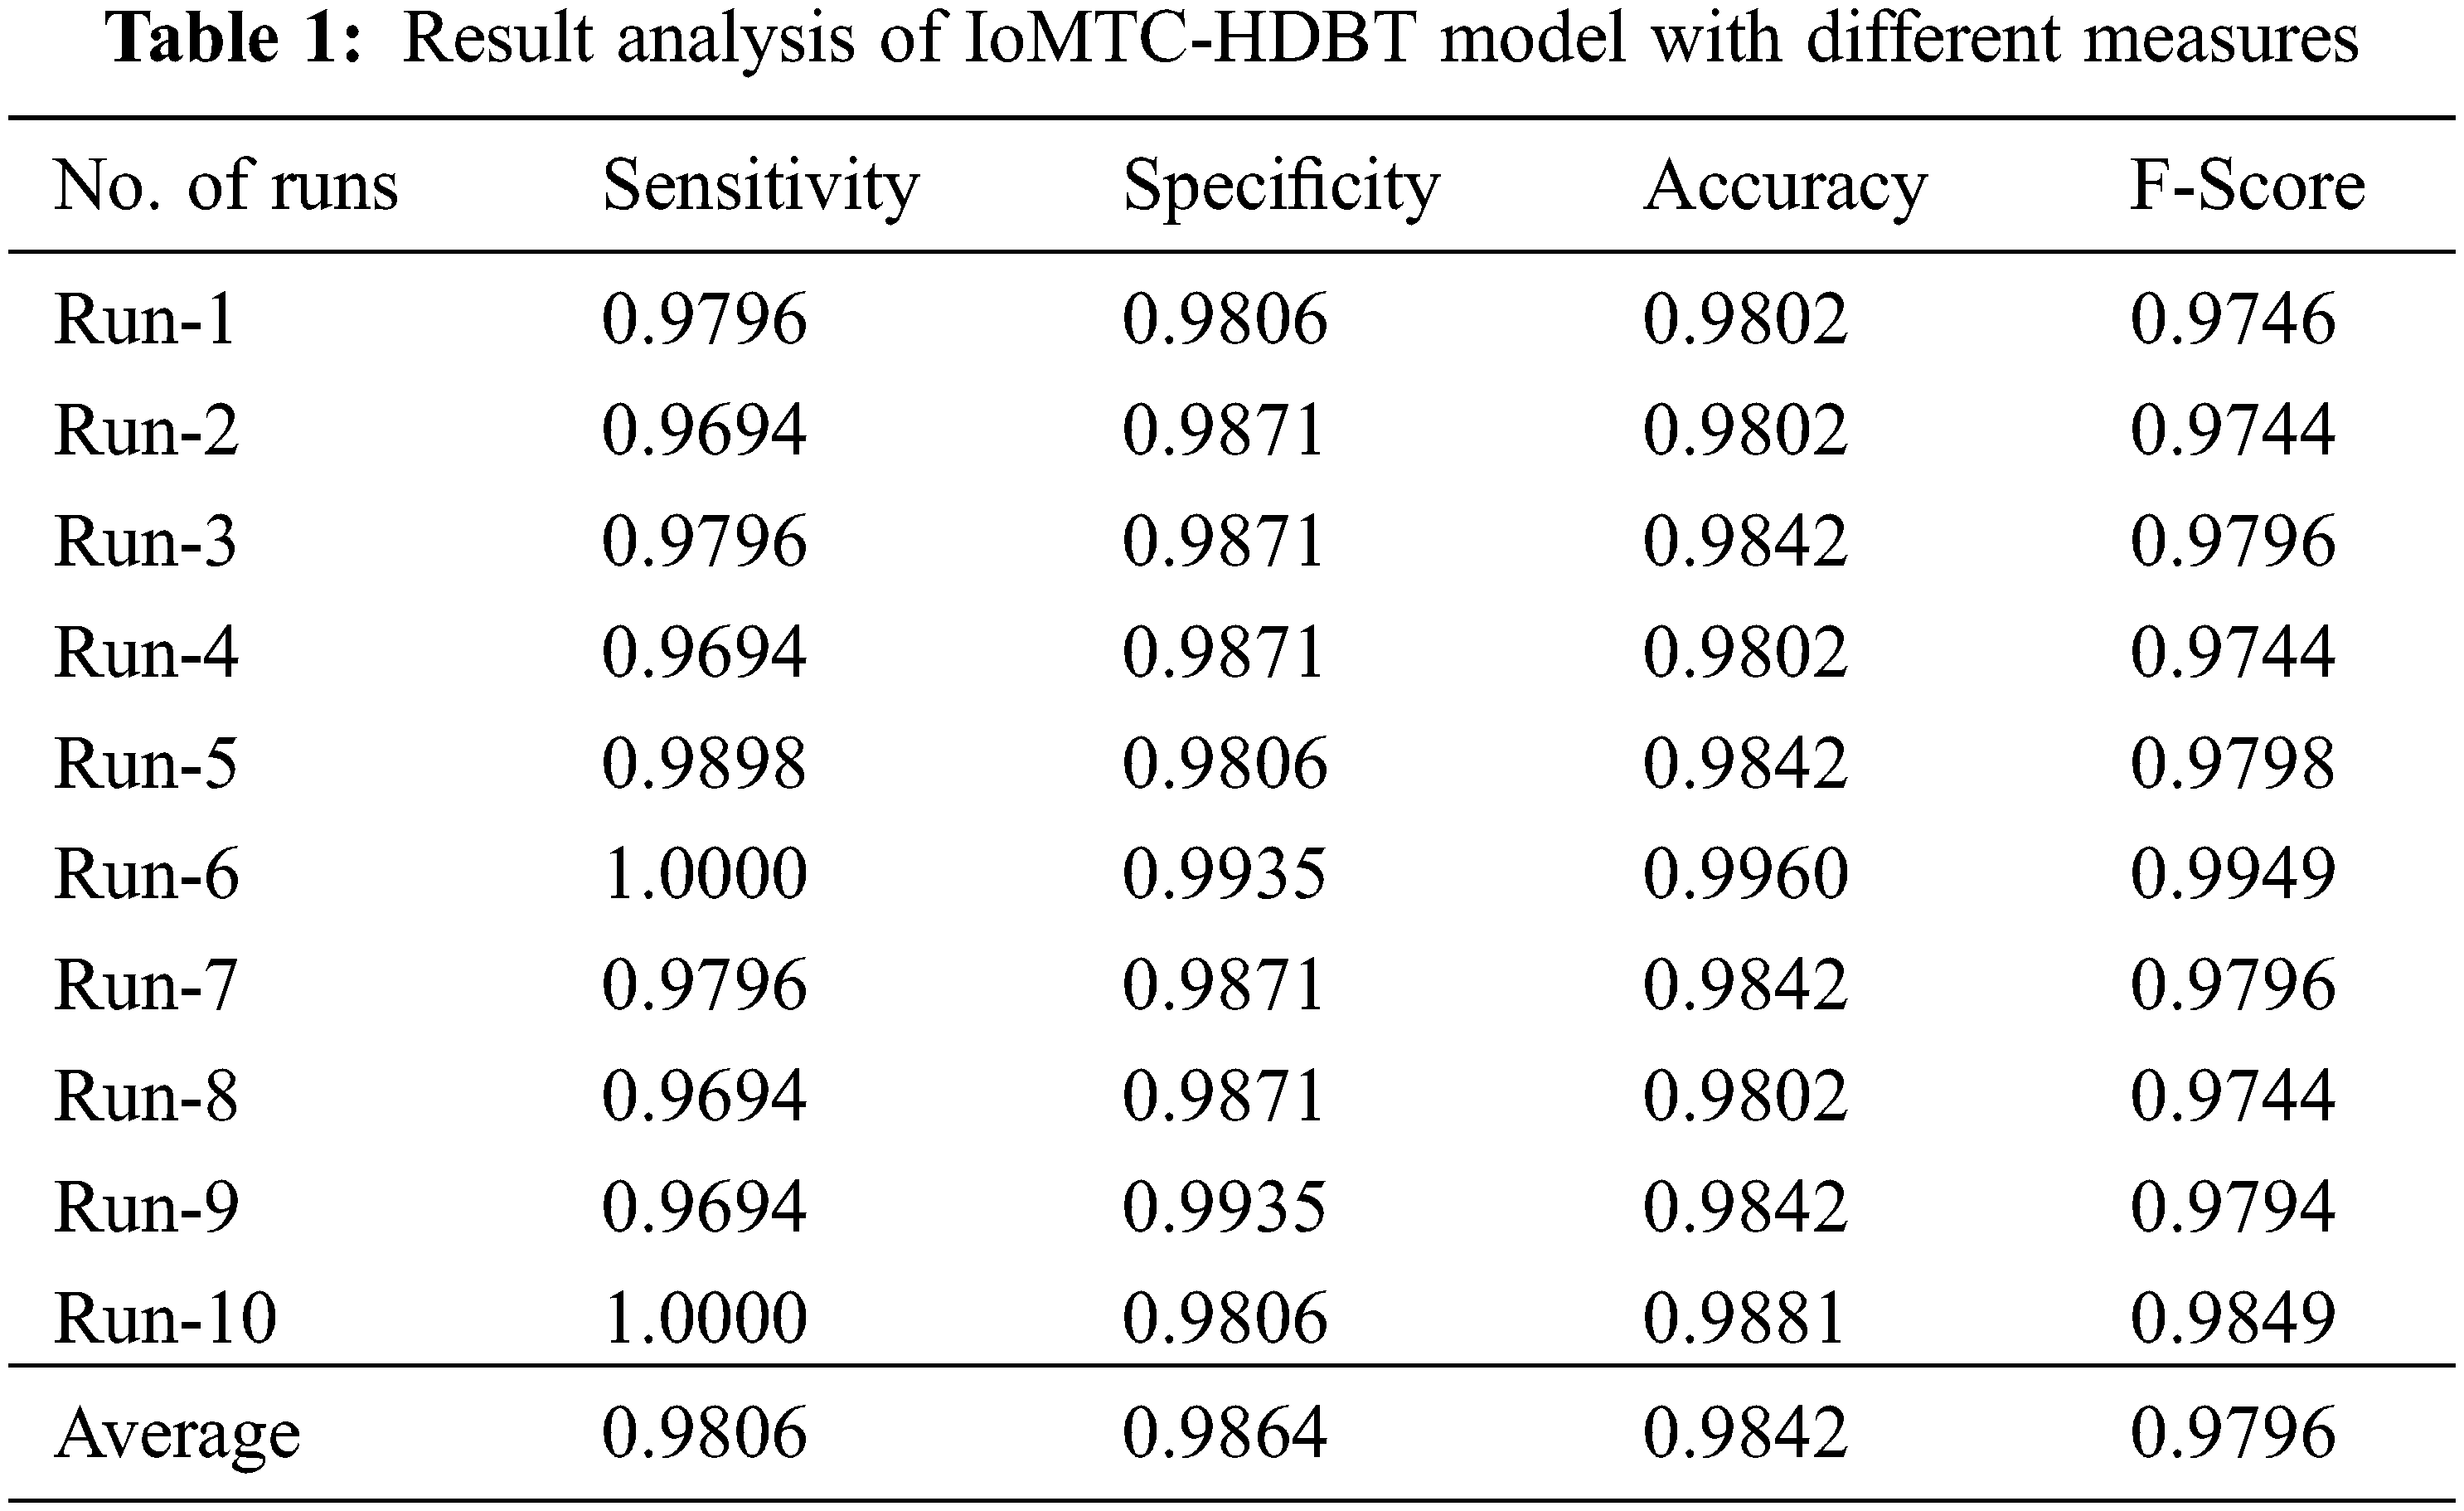

Figure 5: Result analysis of IoMTC-HDBT model with varying measures
Fig. 6 illustrates the set of receiver operating characteristic (ROC) analyses of the IoMTC-HDBT technique under ten distinct runs. These figures demonstrated that the IoMTC-HDBT technique has resulted in maximum ROC values under every test run.
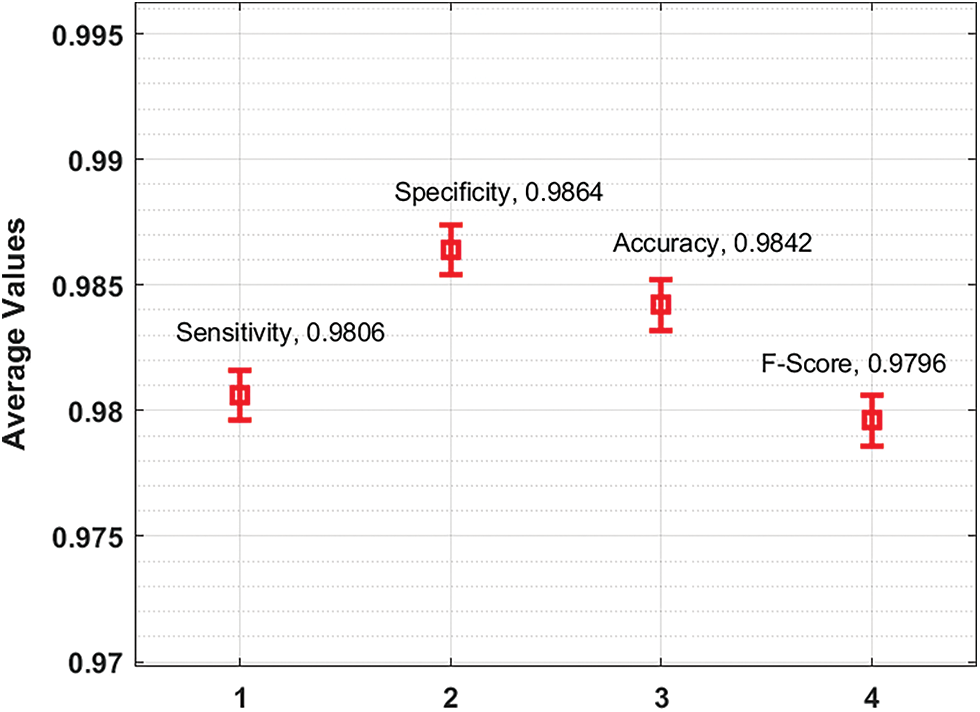
Figure 6: Average analysis of IoMTC-HDBT model
Fig. 7 demonstrates the overall average classification results analysis of the IoMTC-HDBT technique on the test images applied. The figure shows that the IoMTC-HDBT technique has reached to maximum average
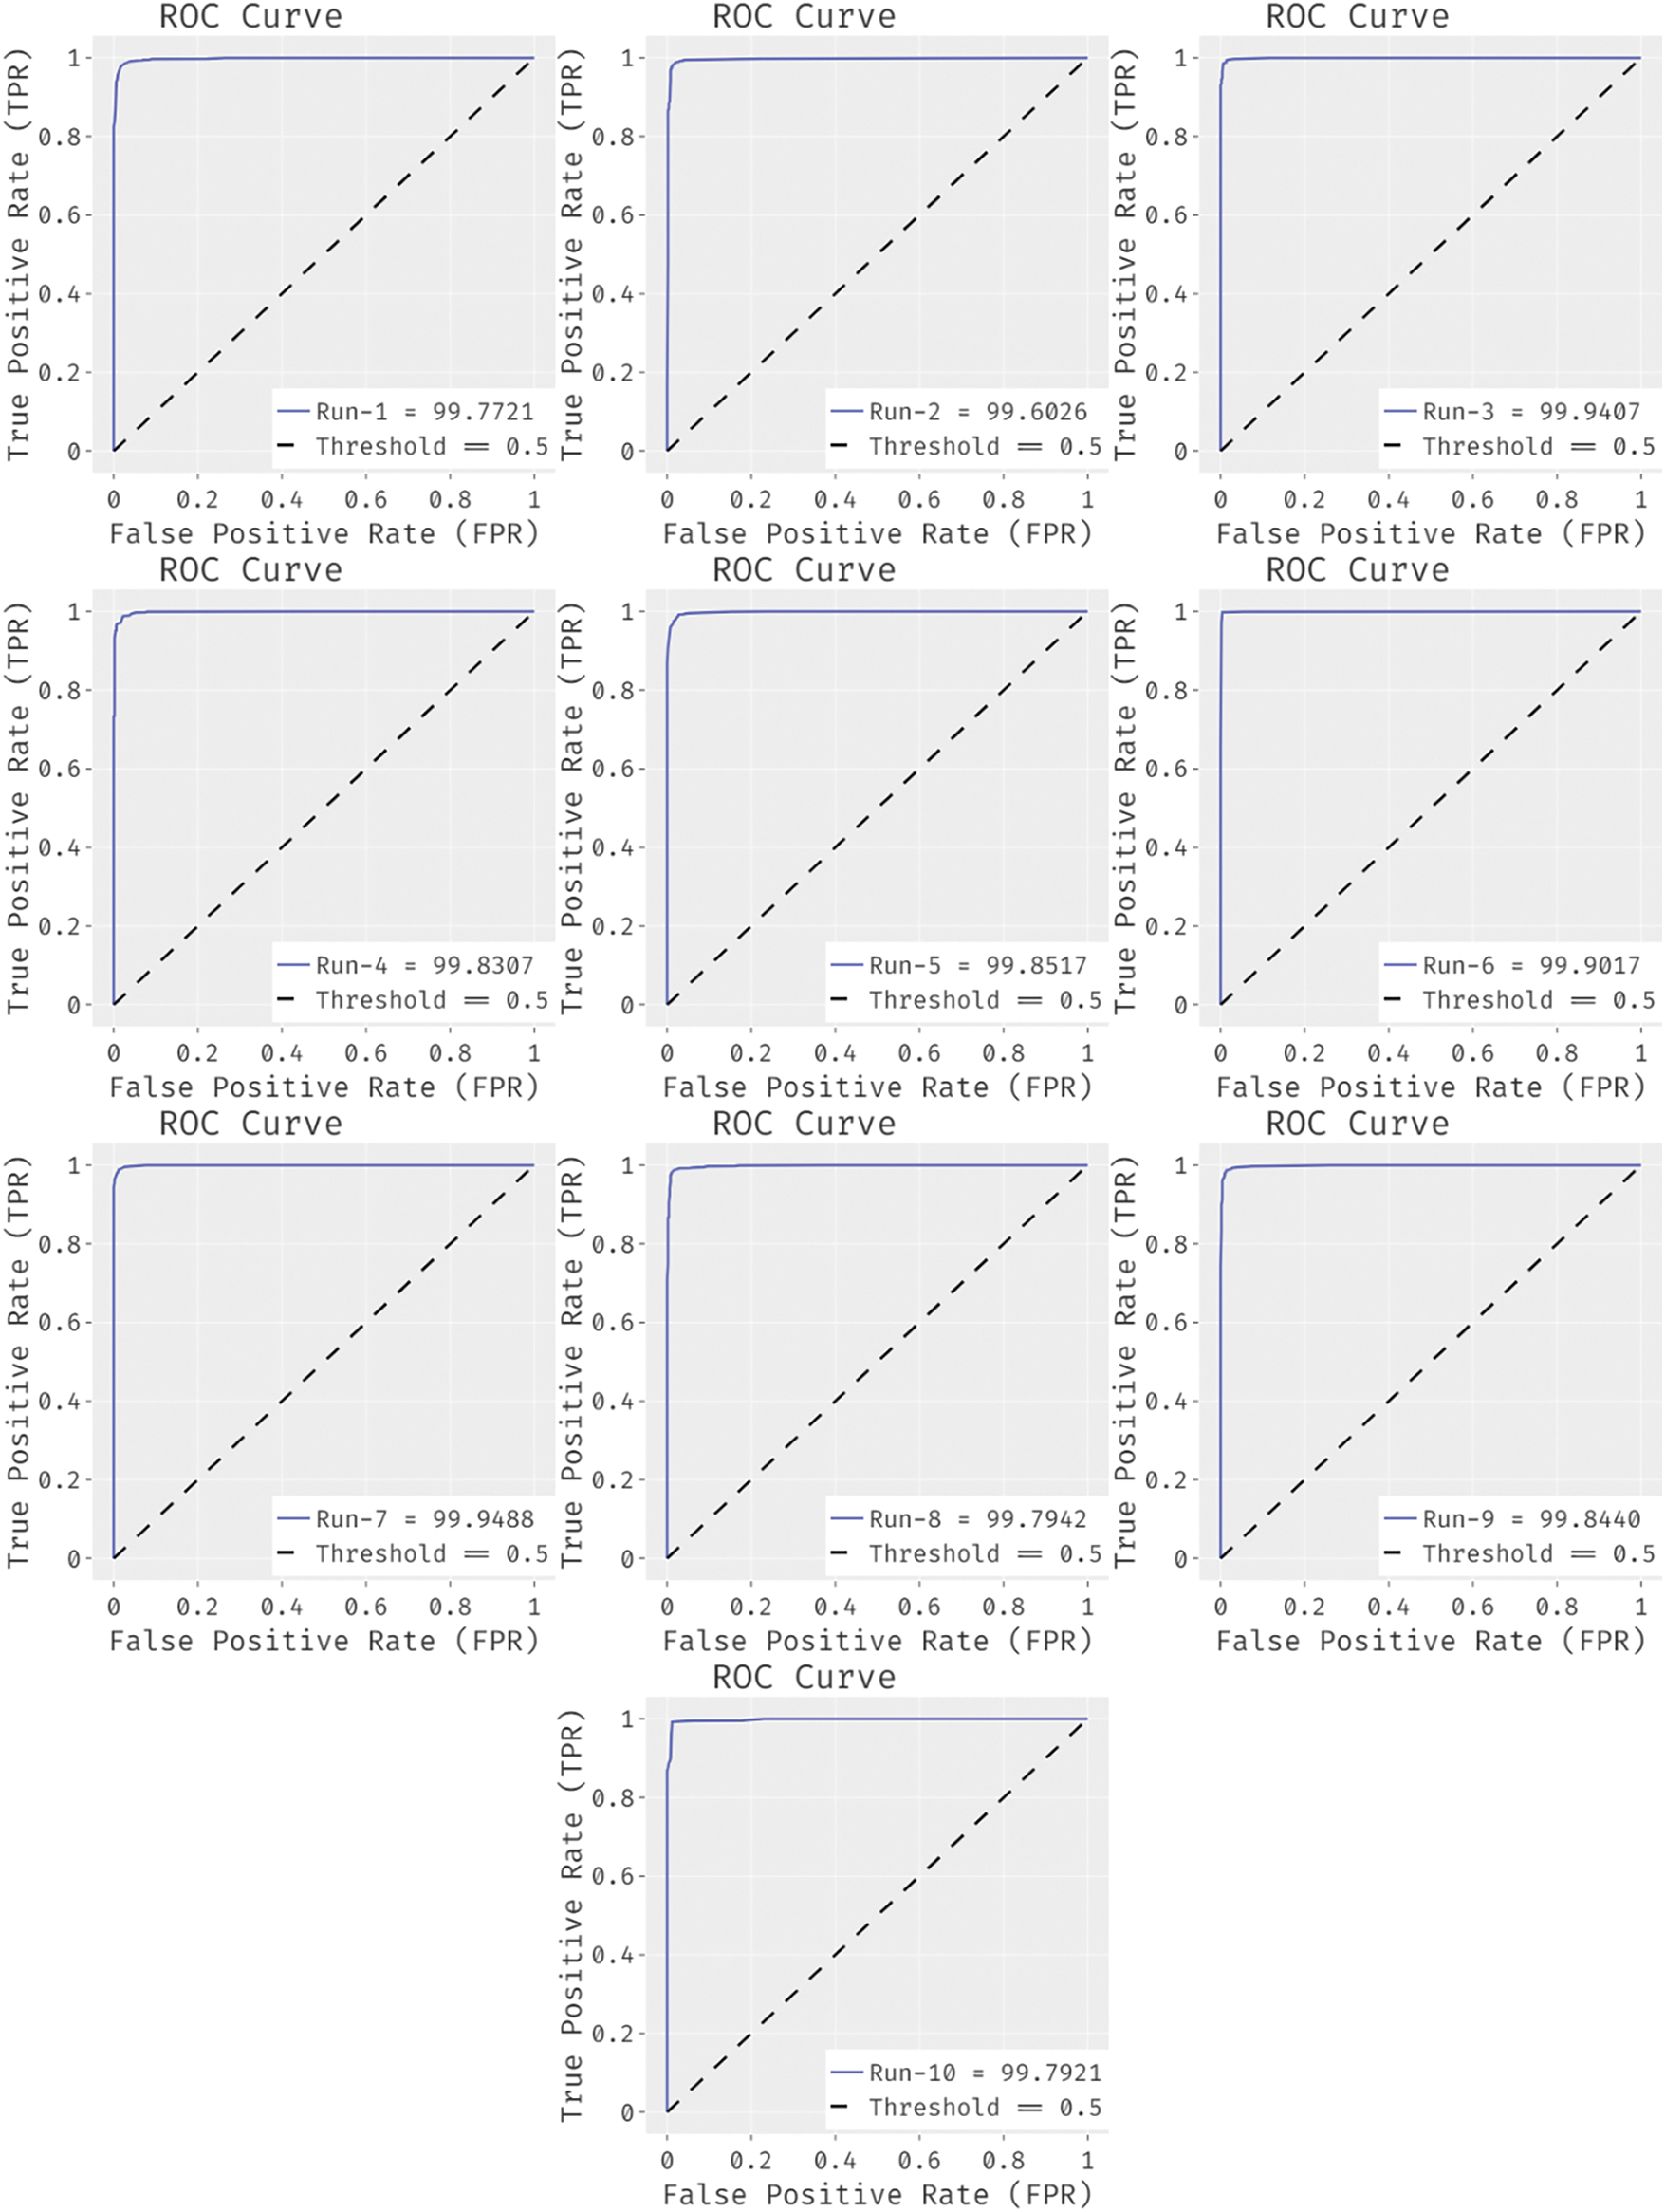
Figure 7: ROC analysis of IoMTC-HDBT model under 10 runs
In order to showcase the outstanding performance of the IoMTC-HDBT technique, a comparative results analysis is made in Tab. 2. Fig. 8 showcases the
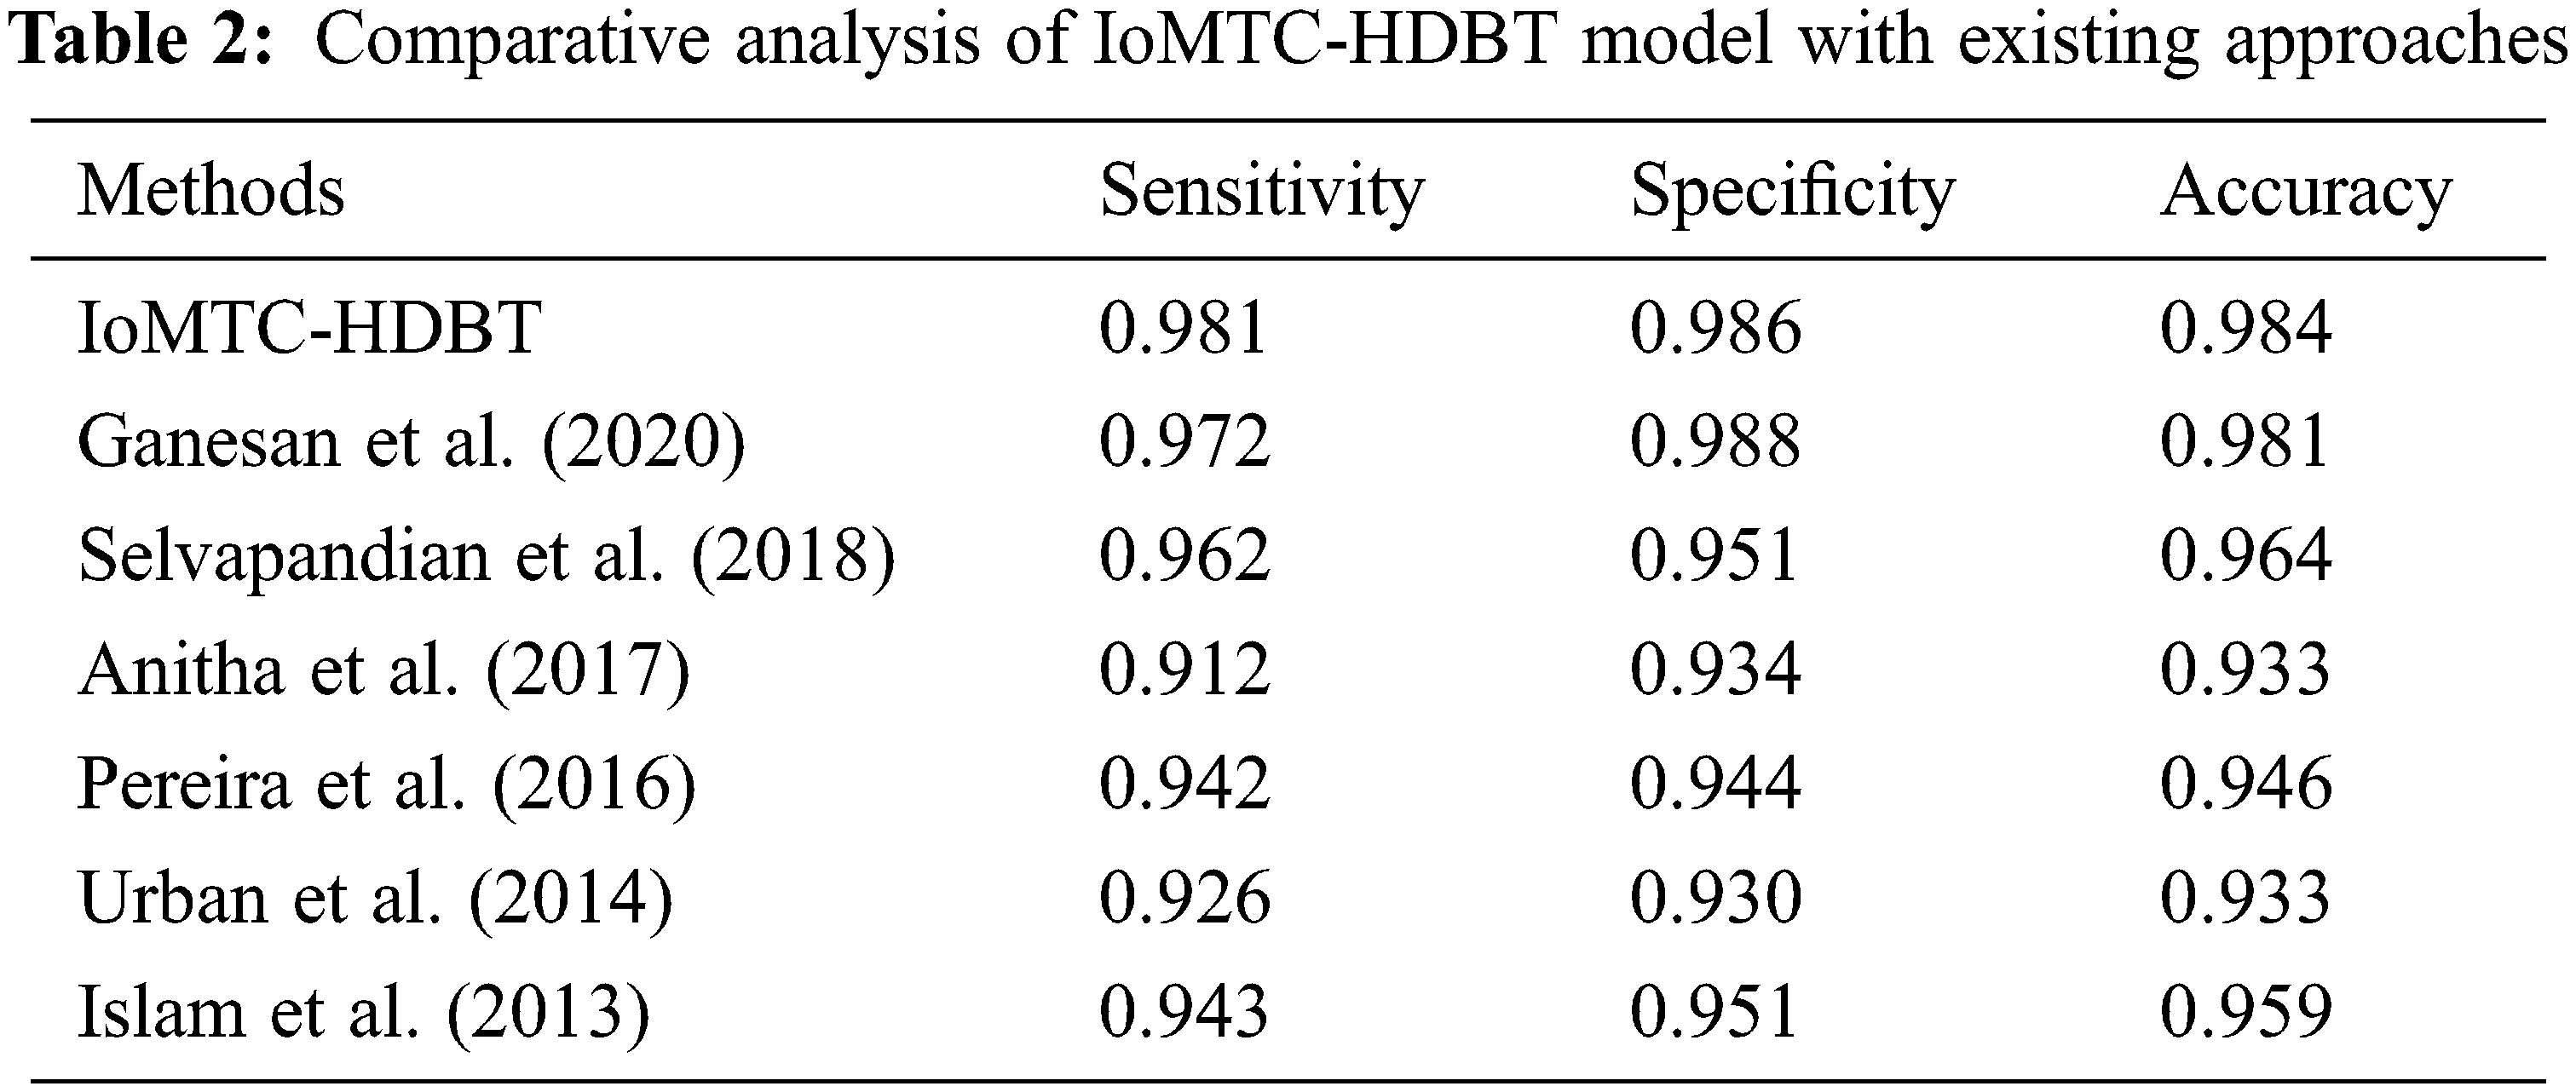
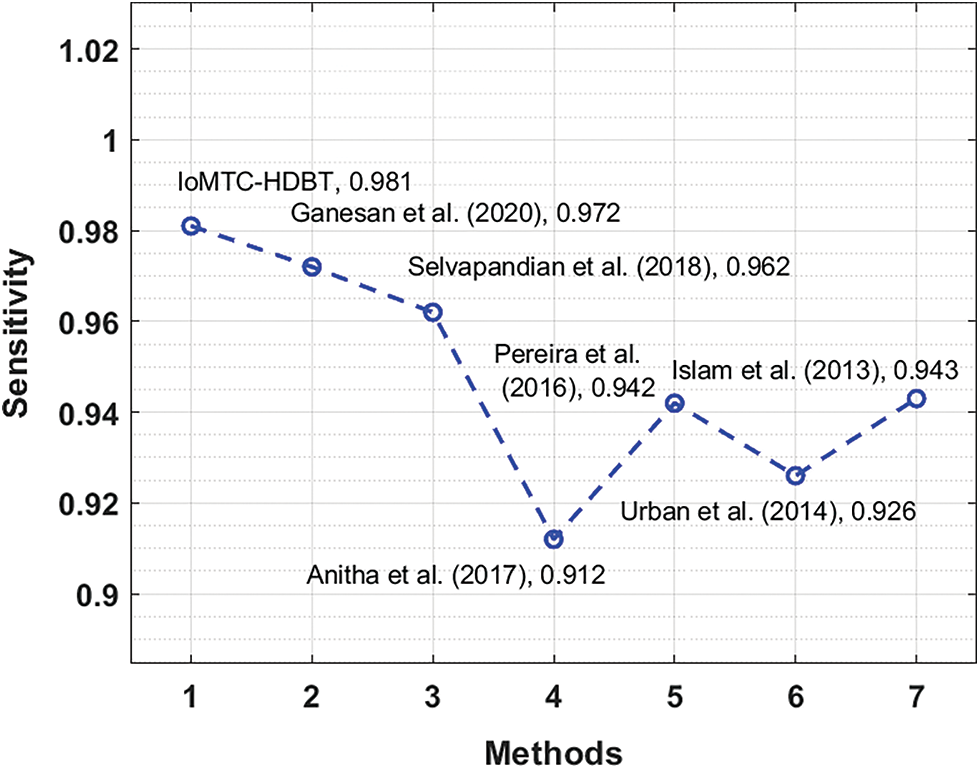
Figure 8: Sensitivity analysis of IoMTC-HDBT technique
Fig. 9 illustrates the
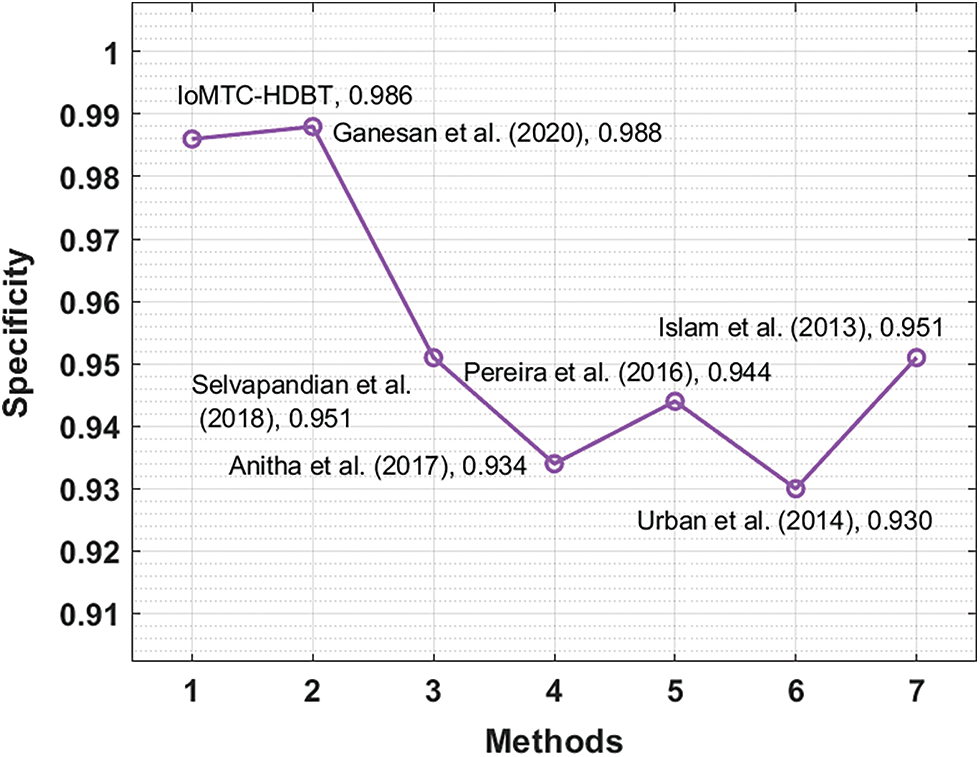
Figure 9: Specificity analysis of IoMTC-HDBT technique
Fig. 10 depicts the
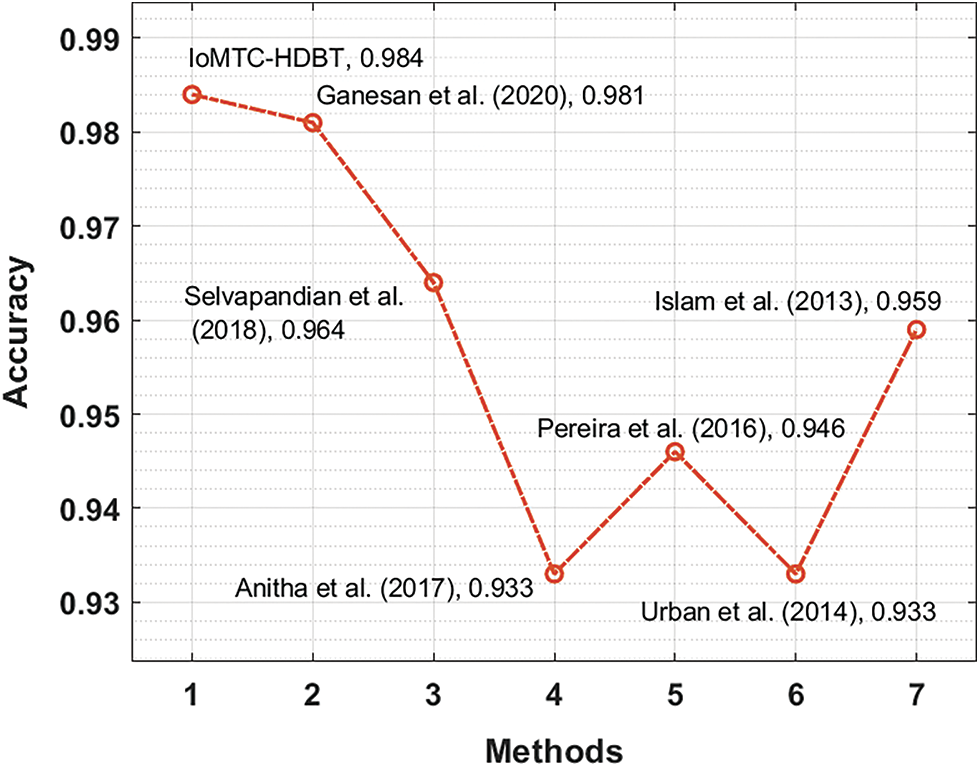
Figure 10: Accuracy analysis of IoMTC-HDBT technique
By looking into these results analysis, it is apparent that the IoMTC-HDBT technique can be used as an effectual tool for BT diagnosis in the IoMT environment.
In this study, a novel IoMTC-HDBT technique has been presented to detect and classify the BT using medical images. The proposed IoMTC-HDBT technique encompasses AWF based image filtering, GoogleNet based feature extraction, SSA based hyperparameter tuning, and FLNN based classification. The IoMTC-HDBT technique has the ability to detect and classify the MRI brain images as normal or abnormal. It is also found useful to generate the reports instantly for patients located in remote areas. The validation of the IoMTC-HDBT model takes place against BRATS2015 Challenge dataset and the experimental analysis is carried out interms of sensitivity, accuracy, and specificity. The experimentation outcome pointed out the betterment of the proposed model on all the applied test images. In future, the IoMTC-HDBT technique can be extended to diagnose lung cancer, heart disease, etc.
Funding Statement: This study was supported by the grants of the Korea Health Technology R&D Project through the Korea Health Industry Development Institute (KHIDI), funded by the Ministry of Health & Welfare (HI18C1216), the grant of the National Research Foundation of Korea (NRF-2020R1I1A1A01074256) and the Soonchunhyang University Research Fund.
Conflicts of Interest: The authors declare that they have no conflicts of interest to report regarding the present study.
1. M. Hashem, S. Vellappally, H. Fouad, M. Luqman and A. E. Youssef, “Predicting neurological disorders linked to oral cavity manifestations using an iomt-based optimized neural networks,” IEEE Access, vol. 8, pp. 190722–190733, 2020. [Google Scholar]
2. A. Ghubaish, T. Salman, M. Zolanvari, D. Unal, A. A. Ali et al., “Recent advances in the internet-of-medical-things (iomt) systems security,” IEEE Internet of Things Journal, vol. 8, no. 11, pp. 8707–8718, 2021. [Google Scholar]
3. A. Almogren, I. Mohiuddin, I. U. Din, H. Almajed and N. Guizani, “FTM-IoMT: Fuzzy-based trust management for preventing sybil attacks in internet of medical things,” IEEE Internet of Things Journal, vol. 8, no. 6, pp. 4485–4497, 2021. [Google Scholar]
4. Z. Yuldashev, A. Sergeev and N. Nastueva, “IoMT technology as the basis of wearable online monitors for space distributed monitoring systems for pregnant women,” in 2021 Wave Electronics and its Application in Information and Telecommunication Systems (WECONF), St. Petersburg, Russia, pp. 1–4, 2021. [Google Scholar]
5. S. Vishnu, S. R. J. Ramson and R. Jegan, “Internet of medical things (IoMT)-An overview,” in 2020 5th Int. Conf. on Devices, Circuits and Systems (ICDCS), Coimbatore, India, pp. 101–104, 2020. [Google Scholar]
6. S. Bauer, C. May, D. Dionysiou, G. Stamatakos, P. Buchler et al., “Multiscale modeling for image analysis of brain tumor studies,” IEEE Transactions on Biomedical Engineering, vol. 59, no. 1, pp. 25–29, 2012. [Google Scholar]
7. G. Mohan and M. M. Subashini, “MRI based medical image analysis: Survey on brain tumor grade classification,” Biomedical Signal Processing and Control, vol. 39, pp. 139–161, 2018. [Google Scholar]
8. J. Ker, Y. Bai, H. Y. Lee, J. Rao and L. Wang, “Automated brain histology classification using machine learning,” Journal of Clinical Neuroscience, vol. 66, no. 1, pp. 239–245, 2019. [Google Scholar]
9. J. Ker, L. Wang, J. Rao and T. Lim, “Deep learning applications in medical image analysis,” IEEE Access, vol. 6, pp. 9375–9389, 2018. [Google Scholar]
10. S. Pal, Y. Dong, B. Thapa, N. V. Chawla, A. Swami et al., “Deep learning for network analysis: Problems, approaches and challenges,” in MILCOM, 2016-2016 IEEE Military Communications Conf., Baltimore, MD, USA, pp. 588–593, 2016. [Google Scholar]
11. M. A. B. Siddique, S. Sakib, M. M. R. Khan, A. K. Tanzeem, M. Chowdhury et al., “Deep convolutional neural networks model-based brain tumor detection in brain MRI images,” in 2020 Fourth Int. Conf. on I-SMAC (IoT in Social, Mobile, Analytics and Cloud) (I-SMAC), Palladam, India, pp. 909–914, 2020. [Google Scholar]
12. Z. Huang, X. Du, L. Chen, Y. Li, M. Liu et al., “Convolutional neural network based on complex networks for brain tumor image classification with a modified activation function,” IEEE Access, vol. 8, pp. 89281–89290, 2020. [Google Scholar]
13. M. L. Rahman, S. H. Shehab, Z. H. Chowdhury and A. K. Datta, “Predicting the possibility of being malignant tumor based on physical symptoms using IoT,” in 2020 IEEE Region 10 Sym. (TENSYMP), Dhaka, Bangladesh, pp. 26–30, 2020. [Google Scholar]
14. S. A. K. A. Nahiun, F. Mahbub, R. Islam, S. B. Akash, R. R. Hasan et al., “Performance analysis of microstrip patch antenna for the diagnosis of brain cancer & tumor using the fifth-generation frequency band,” in 2021 IEEE Int. IOT, Electronics and Mechatronics Conf. (IEMTRONICS), Toronto, ON, Canada, pp. 1–6, 2021. [Google Scholar]
15. N. Noreen, S. Palaniappan, A. Qayyum, I. Ahmad, M. Imran et al., “A deep learning model based on concatenation approach for the diagnosis of brain tumor,” IEEE Access, vol. 8, pp. 55135–55144, 2020. [Google Scholar]
16. N. M. Aboelenein, P. Songhao, A. Koubaa, A. Noor and A. Afifi, “HTTU-Net: Hybrid two track u-net for automatic brain tumor segmentation,” IEEE Access, vol. 8, pp. 101406–101415, 2020. [Google Scholar]
17. H. H. Sultan, N. M. Salem and W. Al-Atabany, “Multi-classification of brain tumor images using deep neural network,” IEEE Access, vol. 7, pp. 69215–69225, 2019. [Google Scholar]
18. L. Tan, W. Ma, J. Xia and S. Sarker, “Multimodal magnetic resonance image brain tumor segmentation based on ACU-Net network,” IEEE Access, vol. 9, pp. 14608–14618, 2021. [Google Scholar]
19. Y. Ding, Q. Zhu, Z. Xing and L. Li, “An adaptive-fuzzy filter algorithm for vision preprocessing,” in 2006 IEEE Int. Conf. on Robotics and Biomimetics, Kunming, China, pp. 578–582, 2006. [Google Scholar]
20. A. Chu, Y. Lai and J. Liu, “Industrial control intrusion detection approach based on multiclassification GoogLeNet-LSTM model,” Security and Communication Networks, vol. 2019, no. 2, pp. 1–11, 2019. [Google Scholar]
21. J. Xue and B. Shen, “A novel swarm intelligence optimization approach: Sparrow search algorithm,” Systems Science & Control Engineering, vol. 8, no. 1, pp. 22–34, 2020. [Google Scholar]
22. S. K. Nanda and D. P. Tripathy, “Application of functional link artificial neural network for prediction of machinery noise in opencast mines,” Advances in Fuzzy Systems, vol. 2011, no. 6, pp. 1–11, 2011. [Google Scholar]
23. https://www.kaggle.com/navoneel/brain-mri-images-for-brain-tumor-detection. [Google Scholar]
 | This work is licensed under a Creative Commons Attribution 4.0 International License, which permits unrestricted use, distribution, and reproduction in any medium, provided the original work is properly cited. |