DOI:10.32604/csse.2023.025452
| Computer Systems Science & Engineering DOI:10.32604/csse.2023.025452 | |
| Article |
Rice Bacterial Infection Detection Using Ensemble Technique on Unmanned Aerial Vehicles Images
Department of Computer and Information Science, Faculty of Applied Science, King Mongkut’s University of Technology North Bangkok, 1518 Pracharat 1 Rd., Wongsawang, Bangsue, Bangkok, 10800, Thailand
*Corresponding Author: Sathit Prasomphan. Email: sathit.p@sci.kmutnb.ac.th
Received: 24 November 2021; Accepted: 19 January 2022
Abstract: Establishing a system for measuring plant health and bacterial infection is critical in agriculture. Previously, the farmers themselves, who observed them with their eyes and relied on their experience in analysis, which could have been incorrect. Plant inspection can determine which plants reflect the quantity of green light and near-infrared using infrared light, both visible and eye using a drone. The goal of this study was to create algorithms for assessing bacterial infections in rice using images from unmanned aerial vehicles (UAVs) with an ensemble classification technique. Convolution neural networks in unmanned aerial vehicles image were used. To convey this interest, the rice’s health and bacterial infection inside the photo were detected. The project entailed using pictures to identify bacterial illnesses in rice. The shape and distinct characteristics of each infection were observed. Rice symptoms were defined using machine learning and image processing techniques. Two steps of a convolution neural network based on an image from a UAV were used in this study to determine whether this area will be affected by bacteria. The proposed algorithms can be utilized to classify the types of rice deceases with an accuracy rate of 89.84 percent.
Keywords: Bacterial infection detection; adaptive deep learning; unmanned aerial vehicles; image retrieval
The target industry in Thailand are ten industries that have the potential to be the country’s economic growth engine and boost competitiveness. These ten industries can be classified into two groups. The first category includes automobiles, smart electronics, tourism, agriculture, biotechnology, and future food. The second group which is an expansion of the previous five industries, includes industrial robots, aviation and logistics, biochemical industry, digital industry, and comprehensive medical industry (medical hub), all of which are new areas in which Thailand has competitive potential and where investors are interested.
Agriculture and biotechnology are two other target industries that have an impact on the national GDP. Drones are another intriguing concept for agricultural usage. It is a highly accurate agricultural tool that is gaining popularity in the era of Thailand 4.0 and Agriculture 4.0, which focuses on technology and innovation to help increase agricultural product efficiency, reduce production costs, save time, and save human labor in the face of a declining agricultural labor situation. Drones for agriculture are another technology that can be used to regulate agricultural product production quality precisely. Farmers will be able to minimize production costs if they use agricultural technology such as drones for agriculture. Furthermore, if the government supports the use of technology in agriculture, such as drones, and the capital group has consistently transferred technological knowledge, including trends in technology products that are more prevalent and less expensive, the Thai agriculture sector will be able to advance to the next level of development. Changing into a new era, such as the knowledge-based and digital economy eras has become increasingly significant and popular, as research and development employing technology and innovation in numerous business sectors has been invented. Unmanned aerial vehicles (UAVs), also known as drones, are another technology that is becoming more prevalent in numerous industries. Drones are used in agriculture to boost production efficiency, reduce expenses, and save time and labor by spraying medications, fertilizers, and other chemicals. Furthermore, the output quality can be properly regulated. Drones for agriculture are becoming popular in agricultural period 4.0 as an exciting alternative to modern agriculture that farmers and entrepreneurs could adapt to evolve into professional farmers (smart farmers).
Drones are unmanned aircraft that may be used for a variety of tasks, including gas pipeline exploration, meteorological data gathering, traffic conditions, transportation, taking photographs or events from a high angle, assessing agricultural and irrigation areas. Multirotor UAVs, fixed-wing drones, and hybrid drone operations are the three categories of drone operation. The most prevalent type of UAV is the multirotor. It travels rapidly and aggressively because it has four, six, or eight propellers and does not require a runway to fly. However, it has a disadvantage in that it has a lower flying speed than other types of drone. Fixed-wing drones behave similar to airplanes, which require a runway to fly longer and faster, making them appropriate for use in a wide area of research. They can also carry large objects over long distances while using minimal energy. Without using the runway, the hybrid model can fly faster, further, and more efficiently than the second model. However, this type of drone is uncommon in the global market.
Drones can be used to investigate broad agricultural areas, including soil analysis, seed planting, and harvest time prediction with the ability to develop three-dimensional maps, and entrepreneurs can better examine and plan their planting. Agricultural drones are becoming more important in precision farming, such as irrigation, hormones, and foliar fertilization, to overcome the limitations of tall plants, which prevents farmers from watering thoroughly and fertilizing at the same time. As a result, drones save more time than manual work. Furthermore, if a plant is not too tall, such as rice, farmers do not have to step on the rice until it is damaged, which is an advantage. Plant disease imaging, analysis, and diagnosis allow farmers to directly treat plant diseases. Furthermore, using drones for agriculture helps decrease the spread of pesticides, which farmers may be exposed to and inhaled during spraying. Thailand is capable of producing agricultural drones. Both private sector output and educational institutions collaborate with private sector enterprises in research and development. Drones are used to sow fertilizers, seeds, and medicines in rice, cassava, corn, sugarcane, and pineapple, among other crops. Drones are used by large private corporations in agriculture to sow seeds, fertilizers, and spray drugs as analysis agents.
Establishing a system for measuring plant health and bacterial infection is critical in agriculture. Previously, the farmers themselves, who observed them with their eyes and relied on their experience in analysis, which could have been incorrect, inspected it. Plant inspection can determine which plants reflect the quantity of green light and NIR using infrared light, both visible and eye (NIR: near-infrared) using a drone equipped with this equipment. On the other hand, these data can be used to create multispectral photographs. Changes in these crops, including health, can be recorded across the entire plantation in a timely manner. Farmers can also use the information they have to inspect and deliver correct and timely cures when diseases are identified in plants. In the event of crop loss, these two options improve the ability to overcome plant illnesses. Farmers can save money on insurance claims more efficiently by saving losses. As a result, researchers are aware of the issue and are interested in combining infrared images captured by the eye with near-infrared (NIR) cameras mounted on the drone to solve it. Image processing tools can be used to analyze plant diseases. This study and the creation of knowledge are based on specific datasets from Thailand as well as a worldwide dataset.
The remainder of this section is organized as follows. The theory of CNNs is introduced in Section 2. The proposed method is described in detail in Section 3. The experimental setup is described in Section 4. The results and discussion are explained in Section 5. Finally, we conclude the study in Section 6.
Bacterial leaf streak disease is found mainly in rain and irrigation fields in the central, northeastern and southern regions. The causative agent is Xanthomonas oryzae pv. oryzicola (Fang et al.) Swings et al. [1]. The symptoms of this disease range from the rice tilling stage to rooting. The symptoms initially appeared on the leaves. At first, it appears as a long bruise along the leaf veins, and then gradually turns yellow or orange. When a wound grows together, it forms a large wound, allowing light to penetrate it. The bacteria were observed in the form of yellow droplets, similar to the round turpentine. Small pinheads were observed on the wounds. The length of the wound depended on the resistance of the rice variety. Severity of infection in the susceptible varieties. The lesions extend until the leaves burn the leaf sheaths. The appearance of the lesions was similar to that on the leaves of the resistant varieties. The number of lesions was small, and they did not extend along the length of the leaves. The lesions were brown-black. They are often attacked by mealworms, leaf curl worms and black thorn insects. Repeated destruction in conditions of rain and strong winds will help spread the disease quickly and if the environment is not suitable. New broken rice leaves may not exhibit symptoms of the disease. An example of bacterial leaf streak disease is shown in Fig. 1.

Figure 1: Bacterial leaf streak disease
Brown spot disease, caused by Bipolaris oryzae (Helminthosporium oryzae Breda de Haan), is found mainly in rainwater and irrigation in the central, northern, western, northeastern, and southern regions [1]. Lesions on rice leaves, most commonly in the tillering stage, look like brown spots, round or oval, the outermost edge of the lesion is yellow, 0.5–1 mm with a diameter. Fully developed lesions were approximately 1–2 × 4–10 mm in size. Sometimes, the lesions are not circular or oval, but will be stain-like rust scattered everywhere on the leaves of rice. Ulcers can also occur in paddy grains. The lesions are small. Some lesions may be large, covering paddy grains. This causes paddy kernels to become dirty and deteriorate. When milled, the rice is easily broken. Infestation is caused by fungal spores that fly in the wind and attach to the seed. An example of a brown spot disease is shown in Fig. 2.

Figure 2: Brown spot disease. (a) fungal cause (b) symptoms of brown leaf spot on leaves (c) symptoms of brown leaf spot on leaves
Bacterial leaf Blight Disease found in rainwater, irrigated fields, in the North, the Northeast and the South caused by Xanthomonas oryzae pv. oryzae [1]. Symptoms of this disease can range from the seedling stage to tillering and rooting. Seedlings before planting will have small spots and bruises on the edge of the lower leaves, approximately 7–10 days later. This bruise expands into a long-yellow color on the leaves of rice. Diseased leaves dry out quickly, and the green color fades to gray. Symptoms in the black streak appear after a month to a month and a half after black embroidery. Leaf margin-diseased leaves had bruises. Later, it turns yellow at the wound with cream-colored water droplets, such as round pine resin, as small as the head of the pin. Later, it becomes colored sugar and falls into water or rain, which allows the disease to spread further. The lesions extend along the length of the leaf and sometimes inward along the width of the leaf. The edge of the wound resembled a jagged edge. Over time, this fruit turns gray, diseased leaves dry, leaf margins dry, and curl in length will cause the water pipes, and food pipes to become clogged rice will wither Cao, dry up, and die quickly. The pathogen can spread through water in a high-humidity environment, and conditions of rain and strong winds will help spread the disease widely. An example of bacterial leaf light disease is shown in Fig. 3.

Figure 3: Bacterial leaf blight disease. (a) characteristics of leaf lesions (b) the severity of the tillering period
2.2 Convolution Neural Network
Developing machines that can learn, anticipate, or create knowledge is an important issue in artificial intelligence development. Deep learning, artificial neural networks, support vector machines, and other techniques can be used to teach machines how to learn and build information. The artificial neural network concept is based on the neural network system of the human nervous system. The input layer, output layer, and hidden layer are the three layers that make up the architecture of an artificial neural network. ANNs have the ability to make decisions on difficult problems that humans are unable to solve. Currently, deep learning is one of the most widely used techniques [2,3]. Deep learning is a more advanced form of artificial neural network used in machine learning. Deep learning and artificial neuron networks have various hidden layers, as shown in Fig. 4 [2,3], with deep learning having more hidden layers than artificial neuron networks. Deep learning can be used to address the challenges in facial recognition. A large dataset can be learned from diverse faces in the dataset using this technique. It can be used to recognize individual faces, tag photos on Facebook, or extract non-human objects. This approach can also be utilized as a part of an unmanned vehicle system [2]. In this study, CNNs, also known as deep learning, are related theories. Deep learning [2,4,5] is a sort of machine learning that mimics the neural system of the human brain. As a result, it is possible that future abilities will be supernatural. It can increase the processing power, allowing an artificial neural network to simulate nerves and neurons. Deep learning is a subfield of machine-learning research that attempts to obtain machine learning closer to one of its original goals. Deep learning is a type of artificial neural network with a large number of hidden layers. The ability to process a greater amount of data than usual However, this is challenging because there are many hidden layers. The architecture of deep learning is depicted in Fig. 5 [2,4,5].

Figure 4: Convolution neural network

Figure 5: Deep learning neural network [2–5]
2.3 Content Based Image Retrieval and Image Classification
Image indexing is the process of entering image properties into a database, such as the color histogram, in order to create and store a unique vector within each image. The features of each image will be expressed as numeric values, n numbers (depending on the method’s requirements), or an n-dimensional vector, which is the image’s specific vector. These one-of-a-kind vectors will serve as an image index, with points in n-dimensional space serving as their representation.
Feature extraction is the foundation of content-based picture retrieval [4,5]. In a general sense, textual and visual traits are both examples of features (color, texture, shape, faces). Because there is already a considerable literature on text-based feature extraction in the DBMS and information retrieval research sectors, we shall limit ourselves to visual feature extraction techniques. Within the visual feature scope, the features can be further separated into general features and domain features. [6–9]
Nagano et al. [10] discussed how a convolutional neural network can learn skin features. They used pictures taken with a microscope as input data and visual evaluation scores as training data. Saragih et al. [11] proposed utilizing machine learning to classify the freshness of Ambarella fruit based on its color. For intangible cultural assets, Liu [12] presented a CNN and wireless network-based image recognition approach. Belhi et al. [13] described a system that automates annotation and metadata fulfillment by employing novel deep learning classification and annotation methods. It also addresses challenges with physically damaged heritage relics by employing a new picture reconstruction approach based on supervised and unsupervised learning to solve these problems.
Zhang et al. [14], In general, traditional image classification algorithms research assumes that training and testing data come from the same domain and have the same distribution. Unfortunately, this assumption is rarely realized in real-world applications. In order to address the issue, this research proposes a domain adaption picture classification approach based on multi-sparse representation. Between the source and target domains, the existence of intermediate domains is suggested. Each intermediate subspace is modeled using an online dictionary with goal data updates. On the one hand, the target data reconstruction error is assured; on the other hand, the transition from the source to the target domain is as smooth as feasible. For cross-domain recognition, an augmented feature representation formed by invariant sparse codes across the source, intermediate, and target domain dictionaries is used. The proposed algorithm’s usefulness is confirmed by experimental data.
Zhang et al. [15] presented research that images data of research plots with 67 rice cultivars and elite lines was captured using a marketed quadrotor unmanned aerial vehicle (UAV) equipped with digital and multispectral cameras. The collected imagery data was then processed and analyzed in order to identify the progression of ShB in the field and quantify distinct degrees of the disease. It was discovered that the color transformation may qualitatively detect the infected areas of ShB in the field plots using color features extraction and color space transformation of photos. Ground realities of disease severity and GreenSeeker measured NDVI (Normalized Difference Vegetation Index) were collected, and five vegetation indices were computed from the multispectral photos. The findings of relationship analysis show that ground-measured NDVIs and image-extracted NDVIs have a good association.
Abdulridha et al. [16] using hyperspectral sensing in two situations, nondestructive methods were developed to detect illnesses that harm tomato crops, such as bacterial spot, target spot, and tomato yellow leaf curl, for two tomato kinds. The radial basis function and stepwise discriminant analysis (STDA) were used to categorize diseased plants and distinguish them from noninfected or healthy plants. To differentiate and categorize the sick plants, multiple vegetation indices and the M statistic approach were used. The classification findings in the field indicated high values as well. The findings are encouraging and suggest that remote sensing could be used to detect certain disorders.
Gao et al. [17] are attempting to create an agricultural framework that will provide deep insights into the unique relationship between the occurrence of pests/diseases and weather variables. To begin, because most farms are located in remote areas far from infrastructure, making it difficult to deploy agricultural IoT devices due to a lack of energy, a sun tracker device is designed to automatically adjust the angle between the solar panel and the sunlight to improve the energy-harvesting rate. Second, to address the issue of a UAV’s short flight time, a flying mode is designed to maximize the use of wind force and extend the battle time. Finally, using spectrum analysis technology, the photos collected by the UAV are sent to a cloud data center where they are analyzed for the extent of pest and disease damage. Finally, the agriculture framework is tested in China’s Yangtze River Zone, and the results show that wheat is susceptible to disease when the temperature is between 14 and 16 degrees Celsius, and that high rainfall reduces wheat powdery mildew spread.
Pineda et al. [18] introduced reseach which machine learning was used to detect sick leaves from the numerical data provided by these imaging techniques. When it came to identifying infiltrated areas as simulated vs. bacteria-infiltrated, mathematical methods based on data from infiltrated areas were 96.5 to 99.1 percent accurate. These algorithms also performed well when it came to classifying complete leaves, with accuracy levels of up to 96 percent. As a result, disease detection on full leaves using a model trained on infiltrated areas looks to be a reliable method that might be scaled up for application in plant breeding or precision agriculture.
Wang et al. [19] introduced reseach which based on feature fusion and fuzzy c-means, this research offers a novel change detection method for bitemporal remote sensing images (FCM). The suggested method studies the fusion of numerous image features for the job, as opposed to state-of-the-art methods that primarily use a single image feature for difference image generation. The difference image classification challenge is the next problem, and a modified fuzzy c-means strategy is proposed to evaluate the difference image. On genuine bitemporal remote sensing data sets, the proposed approach has been validated. The proposed method’s efficiency was proven by experimental data.
Image retrieval techniques formerly depended on obtaining image file names or utilizing words that describe images (image caption), which is a non-real aspect of the image. As a result, it is incompatible with the large database that already exists. Because each user’s description of a photo differs and may not always correspond, defining each image based on a few words becomes more difficult as the database develops. Furthermore, certain image databases, such as a geographic image database, may contain a significant number of image data from the same group, such as many ground shots, varied tree images, and so on. When working with vast databases, it must also rely on humans to classify the image, which takes a lengthy time. Image characteristics are the characteristics of an image processing algorithm. The image’s three basic elements are color, shape, and texture. [20–23]
Object detection using the You Only Look Once (YOLO) method can swiftly forecast the type of rice disease. However, due to the possibility of an output fault, it is unable to determine which disease kind of rice is present in a single procedure. The model has been divided into two parts: the first recognizes the rice in the image, and the second predicts the type of rice disease based on the model’s highest probability. The YOLOv3 small will be utilized in this project because it has the fastest processing time. The Yolo v3 small structure in the Keras perspective was depicted in Fig. 6.

Figure 6: Yolo v3 tiny structure in the Keras view
Structure: The structure of CNN composed of 13 convolutional layers which composed of 1 stride, 1 padding, 6 max pooling layers which 2 stride, 2 route & 1 up sample layers, 2 output layers. The learning rate is 0.001. Number of batches is 64 batches. Activation function is ReLU.
3.2 Rice’s Disease Classification
When users upload an image to the model, it is routed to model 1 for processing. The outputs are images with multiple bounding boxes of projected rice and a probability score that varies according to the image. Model 1 outputs are not returned to the user; instead, they are transferred to model 2 for processing in order to determine the type of rice disease in each bounding box.
Users can upload photographs of any size or resolution and the application resizes them to 416 × 416 pixels (YOLO format). Object detection and picture classification were the two models used in our approach, the specifications of which are as follows: Model 1 was designed to detect the objects. Rice was discovered during this stage. The clipped photographs were then submitted to Model 2 with a bounding box size. Model 2 was used to classify the images. Using the highest likelihood score, one of the rice disease types was identified. The user was then given all the outputs (predicted photos, rice disease type). Figs. 7 and 8 depict the workflow detection. The annotation format pattern was <object-class> <x> <y> <width> <height>.

Figure 7: Illustration of plant’s health and bacterial infection on plants by image from unmanned aerial vehicles workflow

Figure 8: Image detection flowchart
We have also used image augmentation methods to reduce the model’s overfitting, using the following steps: First, we collect the sample image, as shown in Fig. 9. Next, Gaussian noise is added to the sample images. Next, contrast-enhanced adaptive histogram equalization was performed. Subsequently, a black box was added to the image. Finally, each image from the previous step is mixed. We also flipped the images to provide additional dataset.

Figure 9: The decease type of rice from the dataset
4.1 Dataset Collection and Description
Datasets were obtained in this study from a paddy in Amol, Mazandaran Province, Iran, with geographical coordinates of length 52.453171, width 36.601498 and height 12-meters [24]. The requirements are as follows: The rice field visible-thermal database contains 100 pairs of photos with a size of 595 × 385 pixels (100 visible images and 100 thermal (near-infrared) images). A mask picture and a ground truth image were included in each image. To identify each plant in both photos, a number was issued as a tag for each plant. The rice field visible-thermal database contains 100 pairs of photos with size of 595 × 385 pixels (100 visible images and 100 thermal (near-infrared) images). A mask picture and a ground truth image are included in each image. In order to identify each plant in both photos, a number was issued as a tag to each plant. Natural light was used to get the images. At the time of imaging, the wind speed was 10 km/h (northwest to southeast). Imaging was performed in the third week after the rice seedlings were planted on the farm.
4.2 Unmanned Aerial Vehicles Detail and Configuration
Thermal imaging was performed using the T8 thermal imaging camera, which produced images with a resolution of 385 × 594 pixels. For visible imaging, the Sony IMX234 Exmor RS sensor with a 12.6-inch detector surface area was used. The developed imaging system takes both visible and thermal images from the farm surface virtually simultaneously. All photographs were captured from a height of 120 cm relative to the water level on the ground and at a 135-degree angle, with the center of the two cameras in the imaging system positioned at a distance of 5 cm from each other and on a screen. Example of the thermal images (IRT) dataset is shown in Fig. 10.

Figure 10: Dataset collection [24]
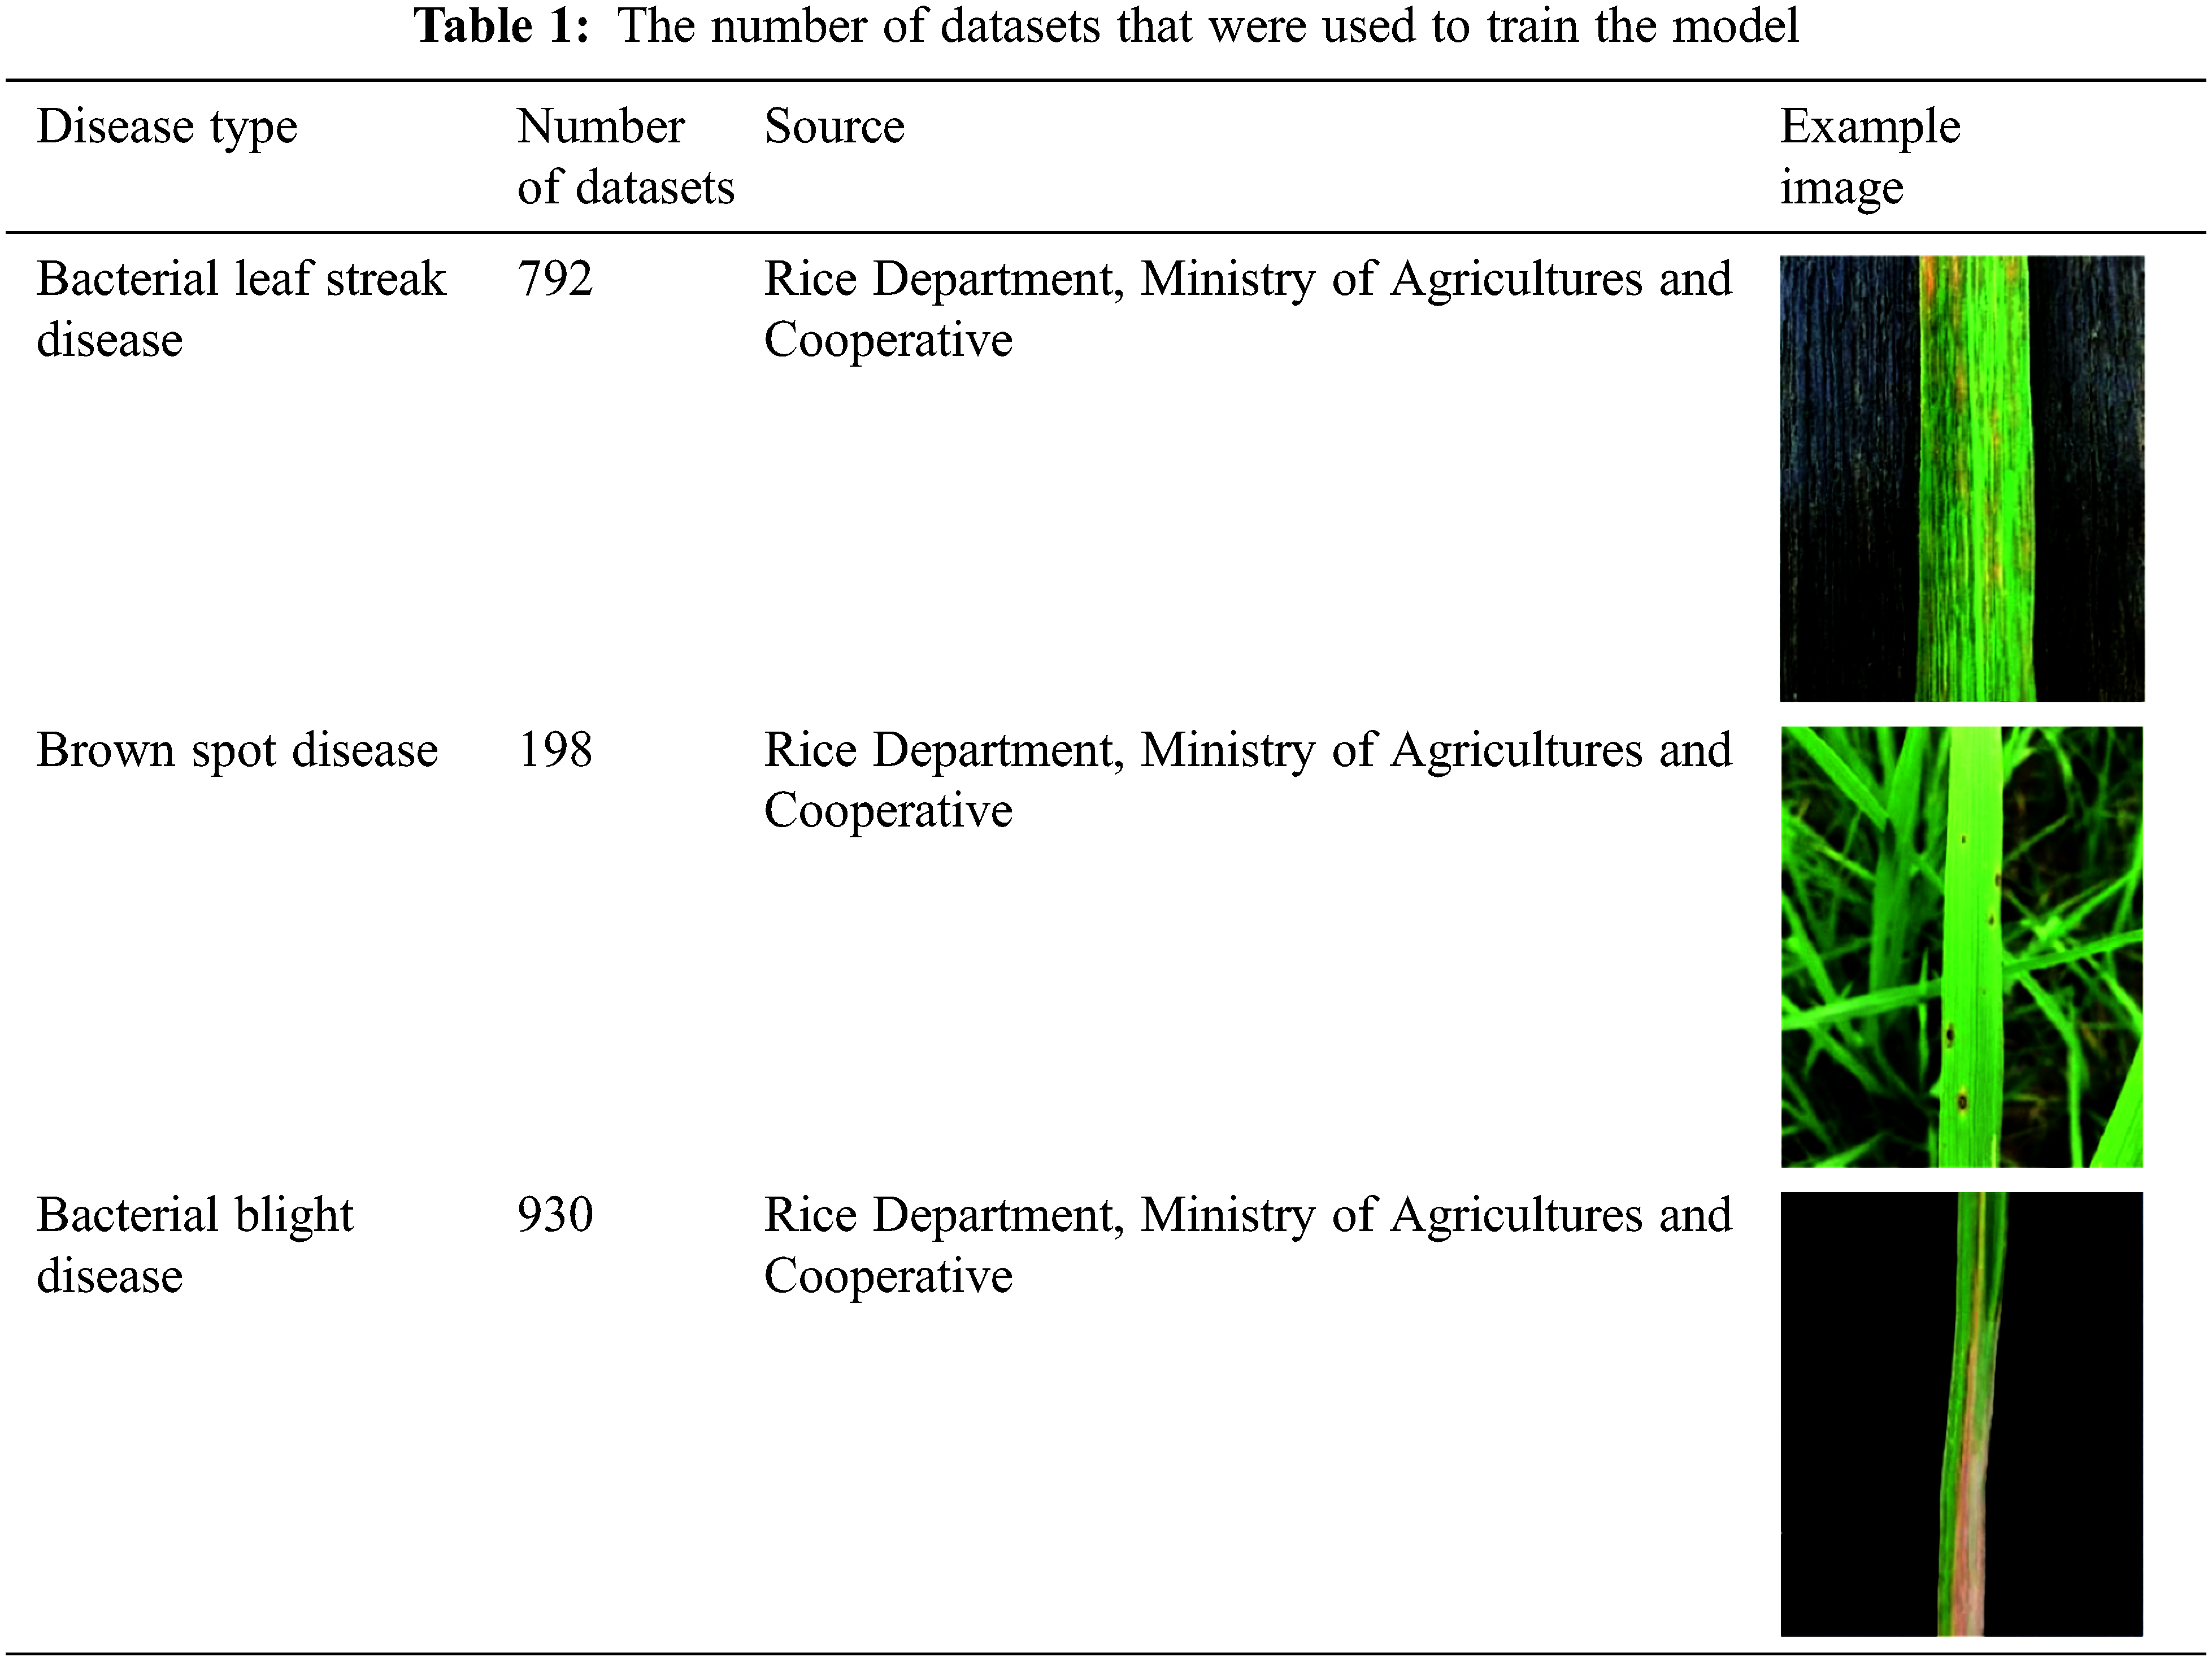
To train the model, we divided the datasets into two sections to train and validate the model correction. The best ratio for splitting the dataset was 80:20 (train:test) and was stored in a text file. For each model, we followed the following data:“number of epochs = number of classes × 2000”. Each model took up time to train for up to 24 h. Model 1: 2 classes 4000 epochs, Model 2: 3 classes 6000 epochs, learning rate 0.0001 Usually, 2000 iterations are sufficient for each class, with no less than 4000 iterations for a more precise definition of when to stop training. The number of datasets that were used to train the model is shown in Tab. 1.
The outputs after running this command are as following: True Positive (TP) for each class, False Positive (FP) for each class, False Negative (FN) for each class. In this research, we also used the precision value, which is the value that measures the number of correct predicting answers by dividing by the total number of images in the dataset. Next recall is calculated. Recall is the value that measures the number of correct predicting answers for each class and is divided by the total number of that class which is the ground truth. If we want to measure the efficiency of our model, we need to get a value to represent the performance of our model. Normally, the average precision value is used to represent the efficiency of the model. The average precision can calculate the area under the precision and recall graphs. The values being between 0 and 1. The value of 1 represents perfect precision, with the resulting precision graph resembling a square with precision and recall both being 1.
The classification results obtained by applying the proposed algorithms to categorize the deceased type of rice images were used to demonstrate the experimental findings, as shown in Fig. 11. Consequently, the classification accuracy ensures the efficiency of our image classification algorithms. Tab. 2 illustrates the categorization accuracy. The average precision of the existing approach, which is the convolution neural network, was 0.896 (89.6 percent), as shown in Tab. 2. Tab. 3 demonstrates the precision of rice classification, which can classify two classes of rice, with precisions of 89.53, 90.31 in rice and other classes, respectively, using the proposed techniques. Tab. 4 shows the Model 2 precision, which can classify three classes of rice deceases, with precisions of 89.35, 88.30, 92.39 in the bacterial leaf streak disease, brown spot disease, and bacterial leaf light disease classes, respectively, using the provided algorithms. The experimental results indicate that adopting a convolutional neural network for training to acquire the type of rice’s deceased image can be successfully used to generate the image description provided in the table. The proposed algorithms can be utilized to classify the types of rice deceases with an accuracy rate of 89.84 percent. The loss values for each epoch are shown in Fig. 12. An example of model accuracy in epoch 86–100 is shown in Fig. 13. A summary of the model is presented in Fig. 14. The comparison of average precision of classification between traditional deep learning and ensemble classification technique is illustrated in Tab. 5.

Figure 11: Experimental results (a) bacterial leaf streak disease (b) brown spot disease (c) bacterial blight disease
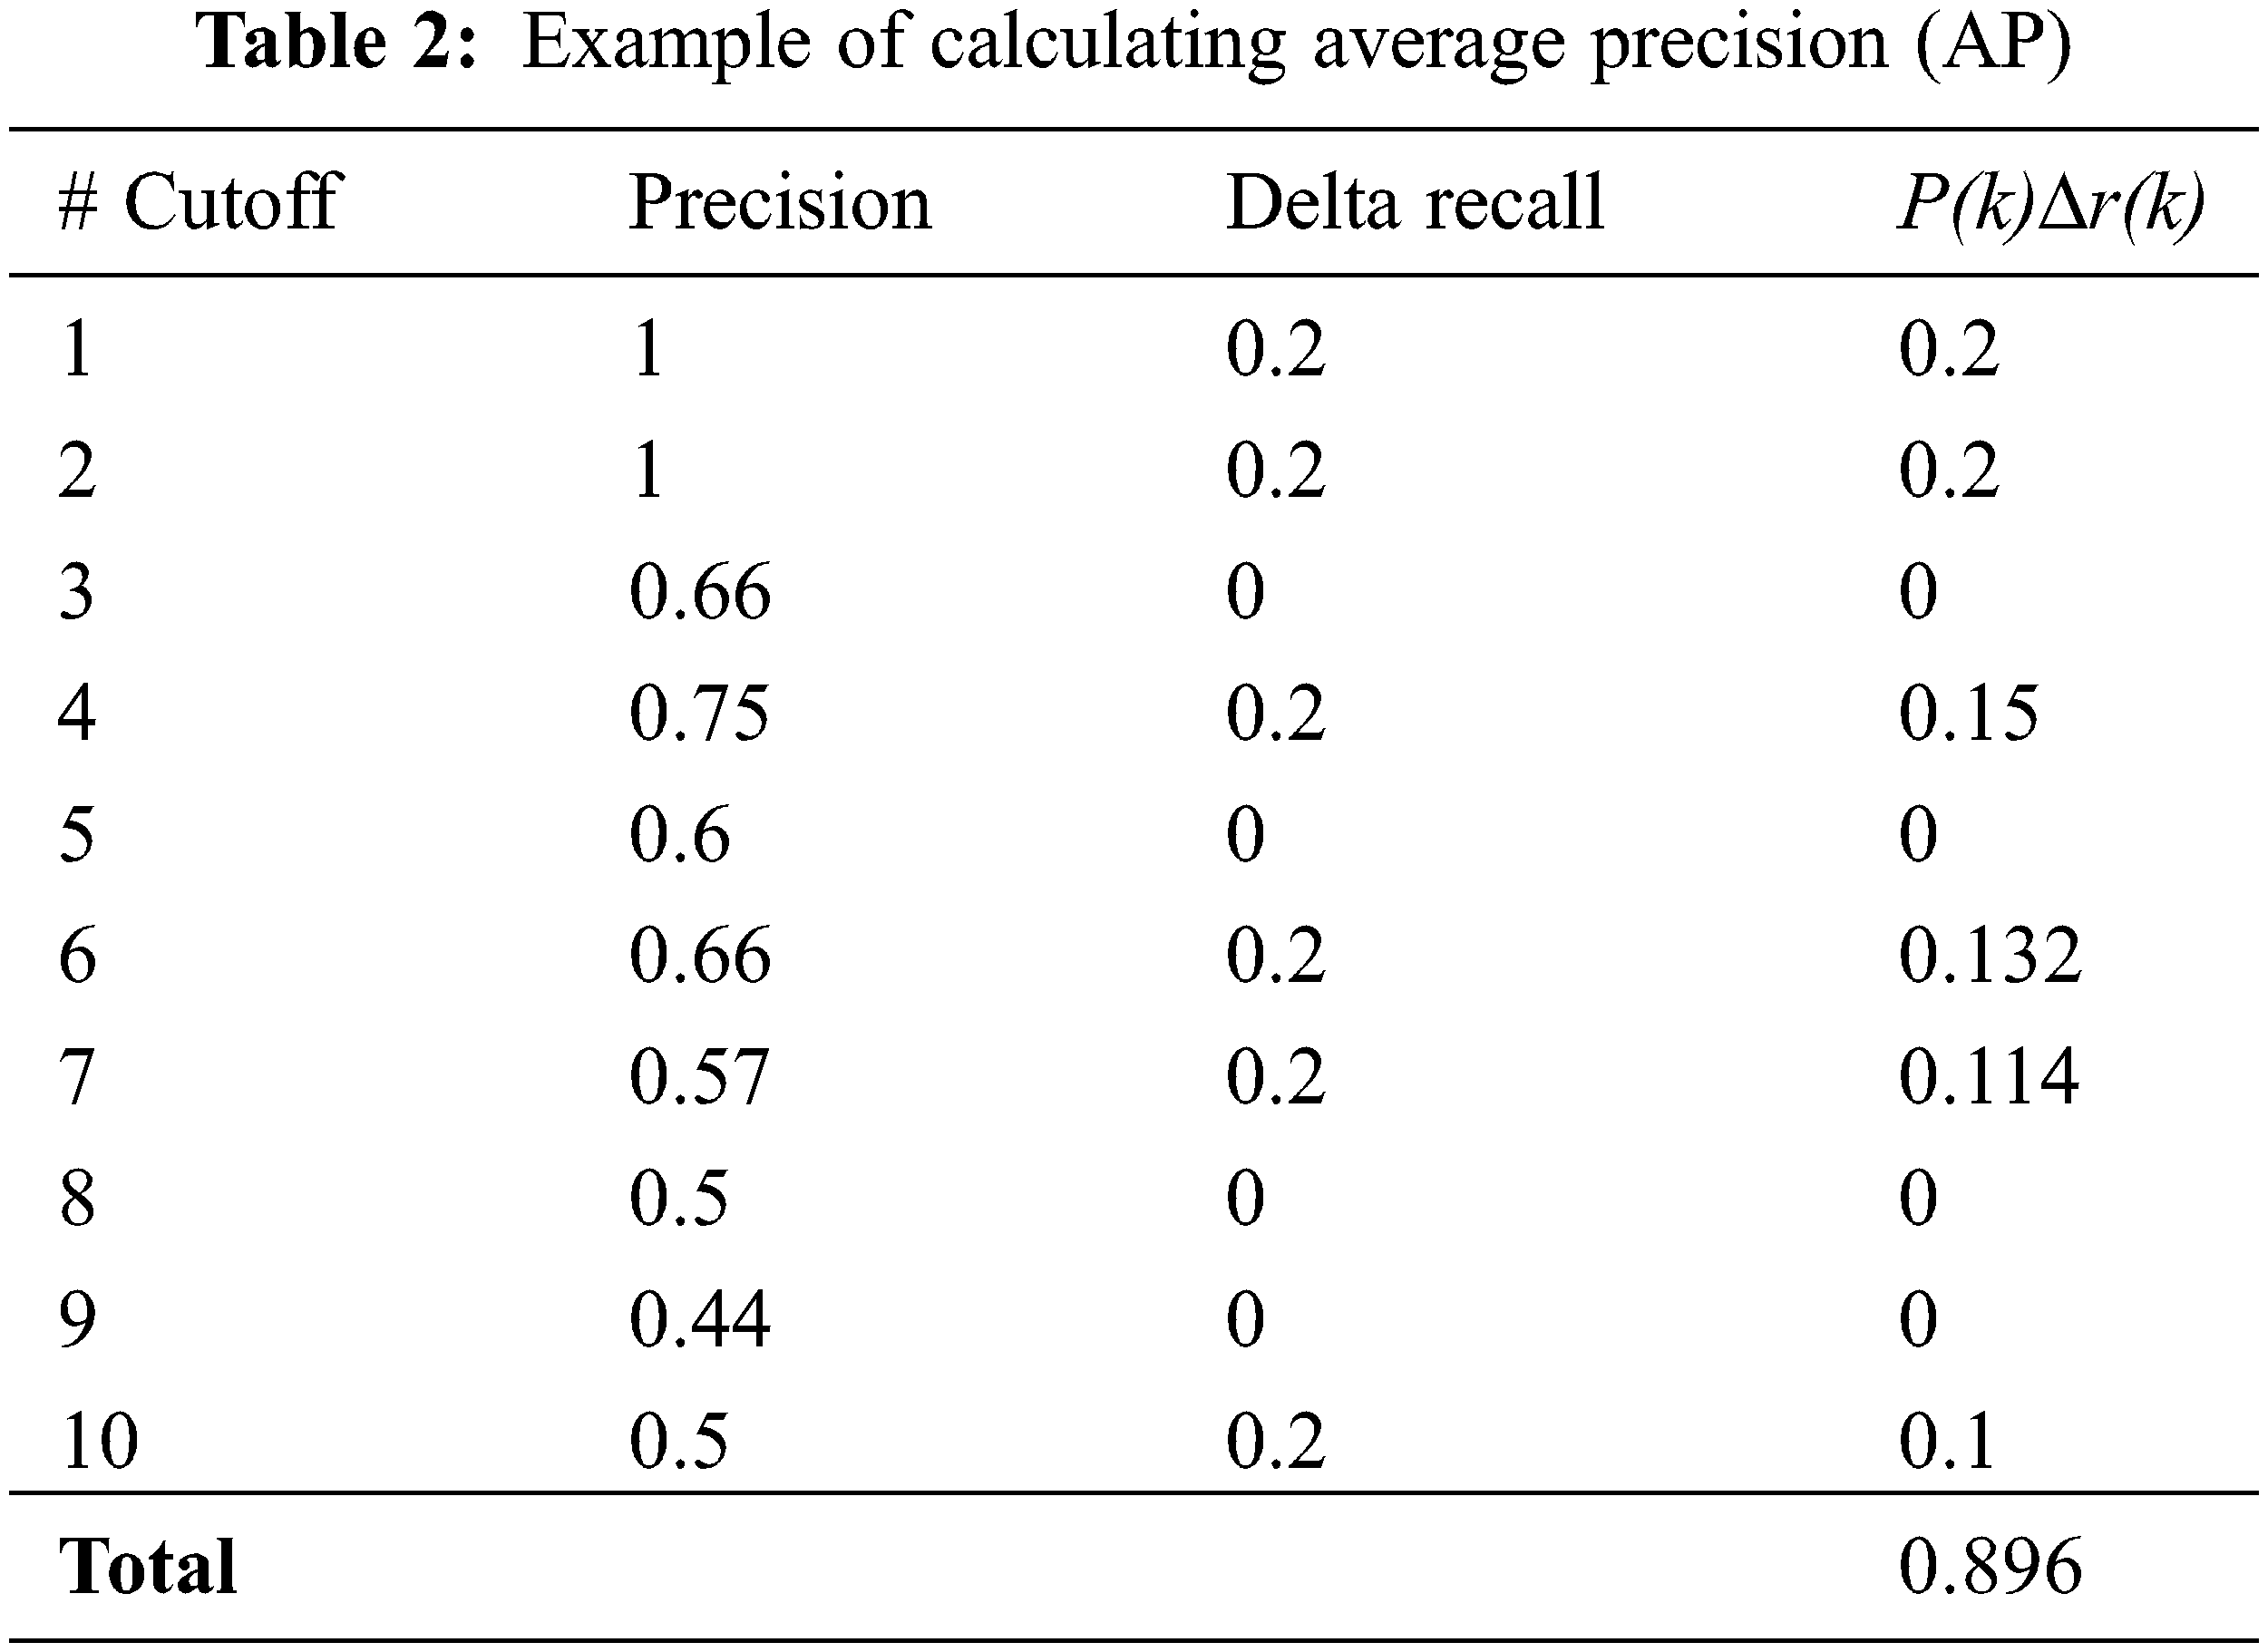
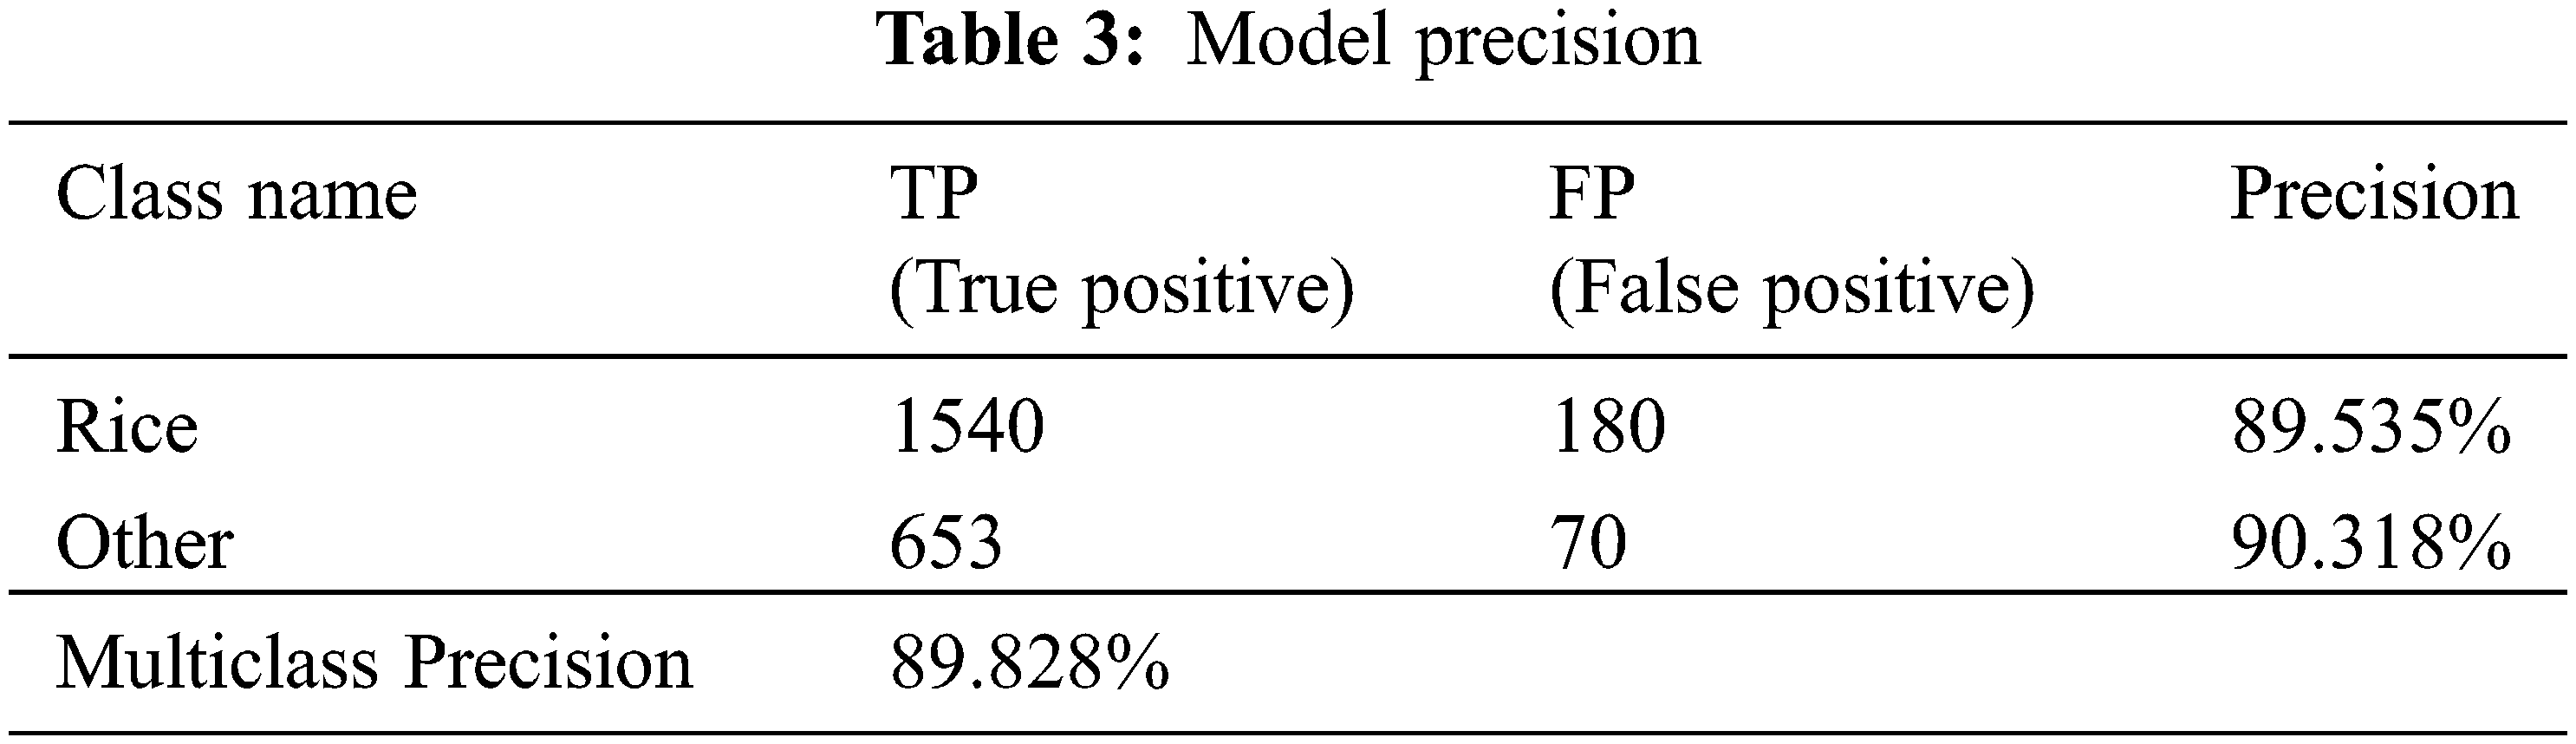
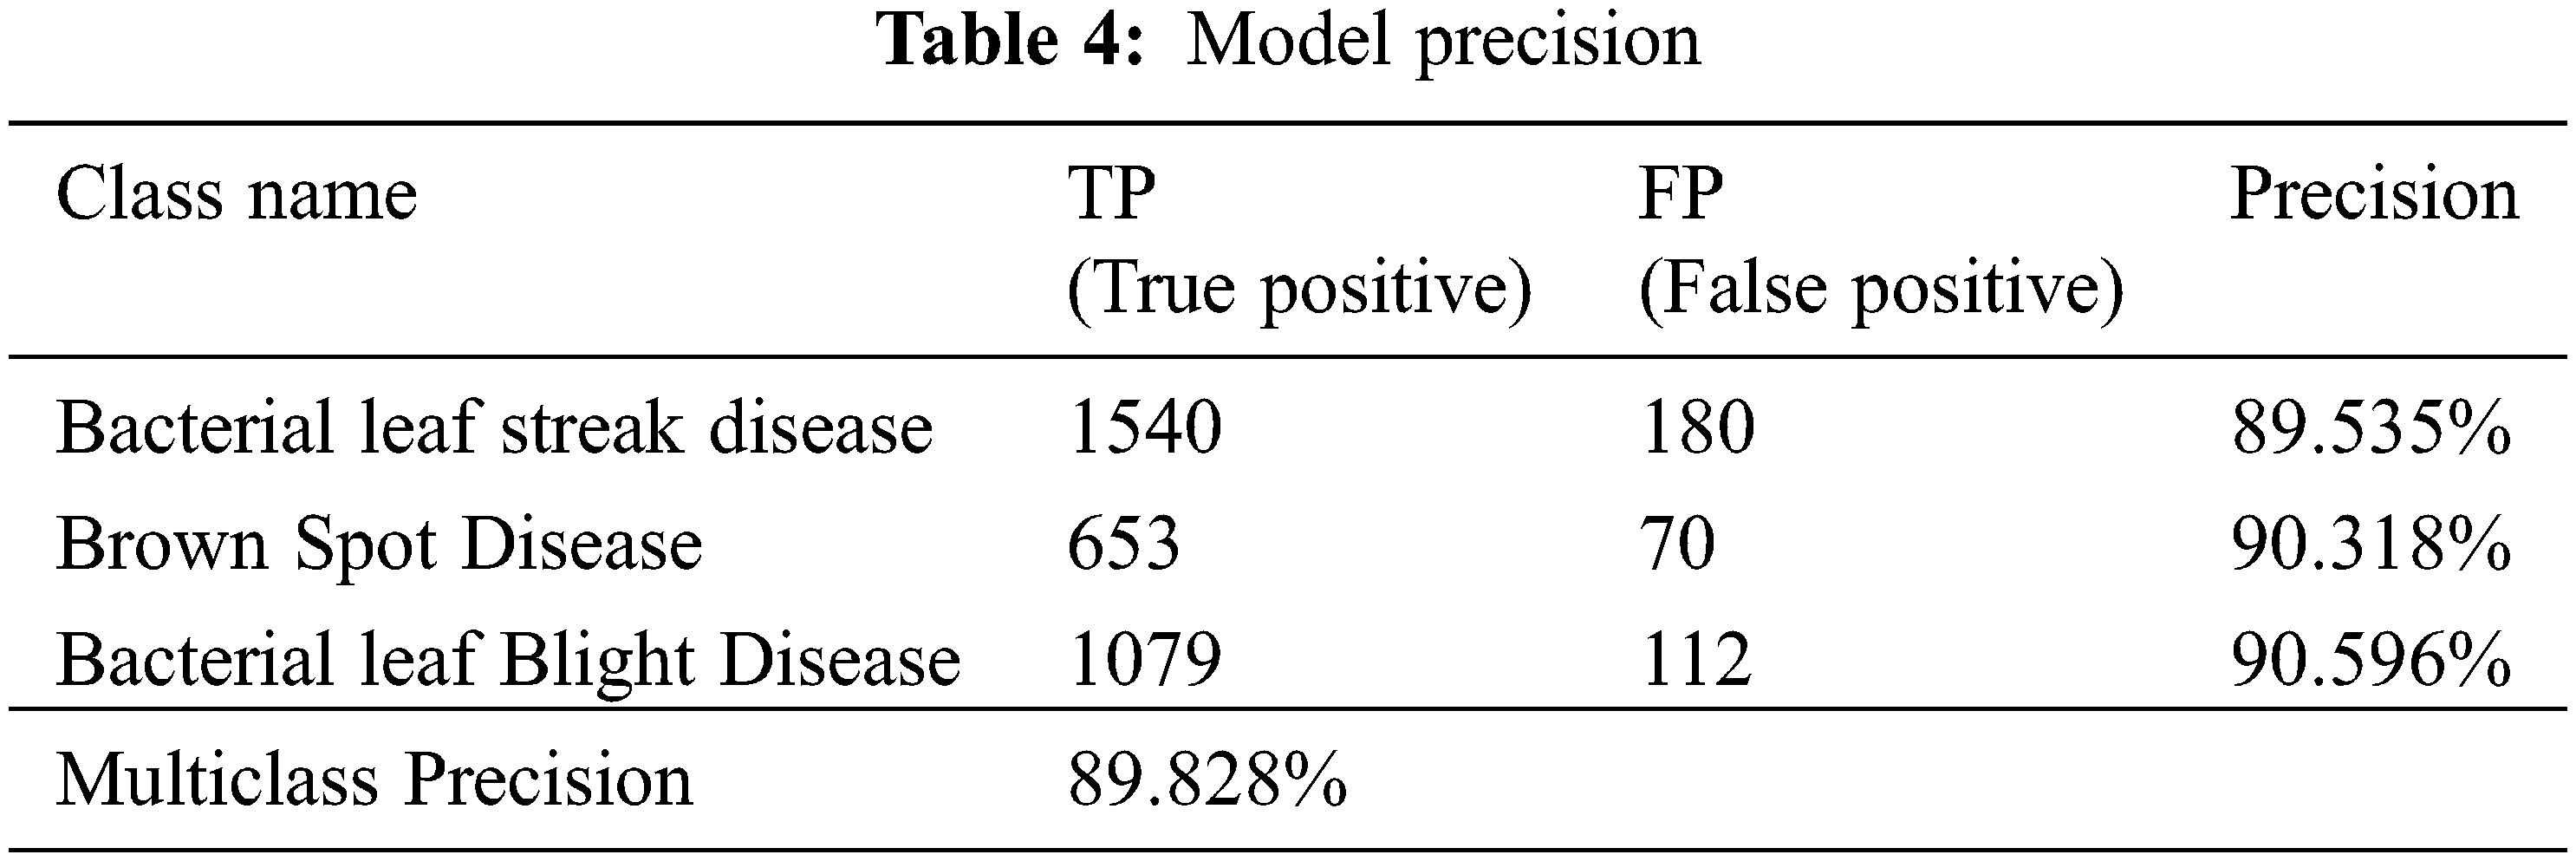
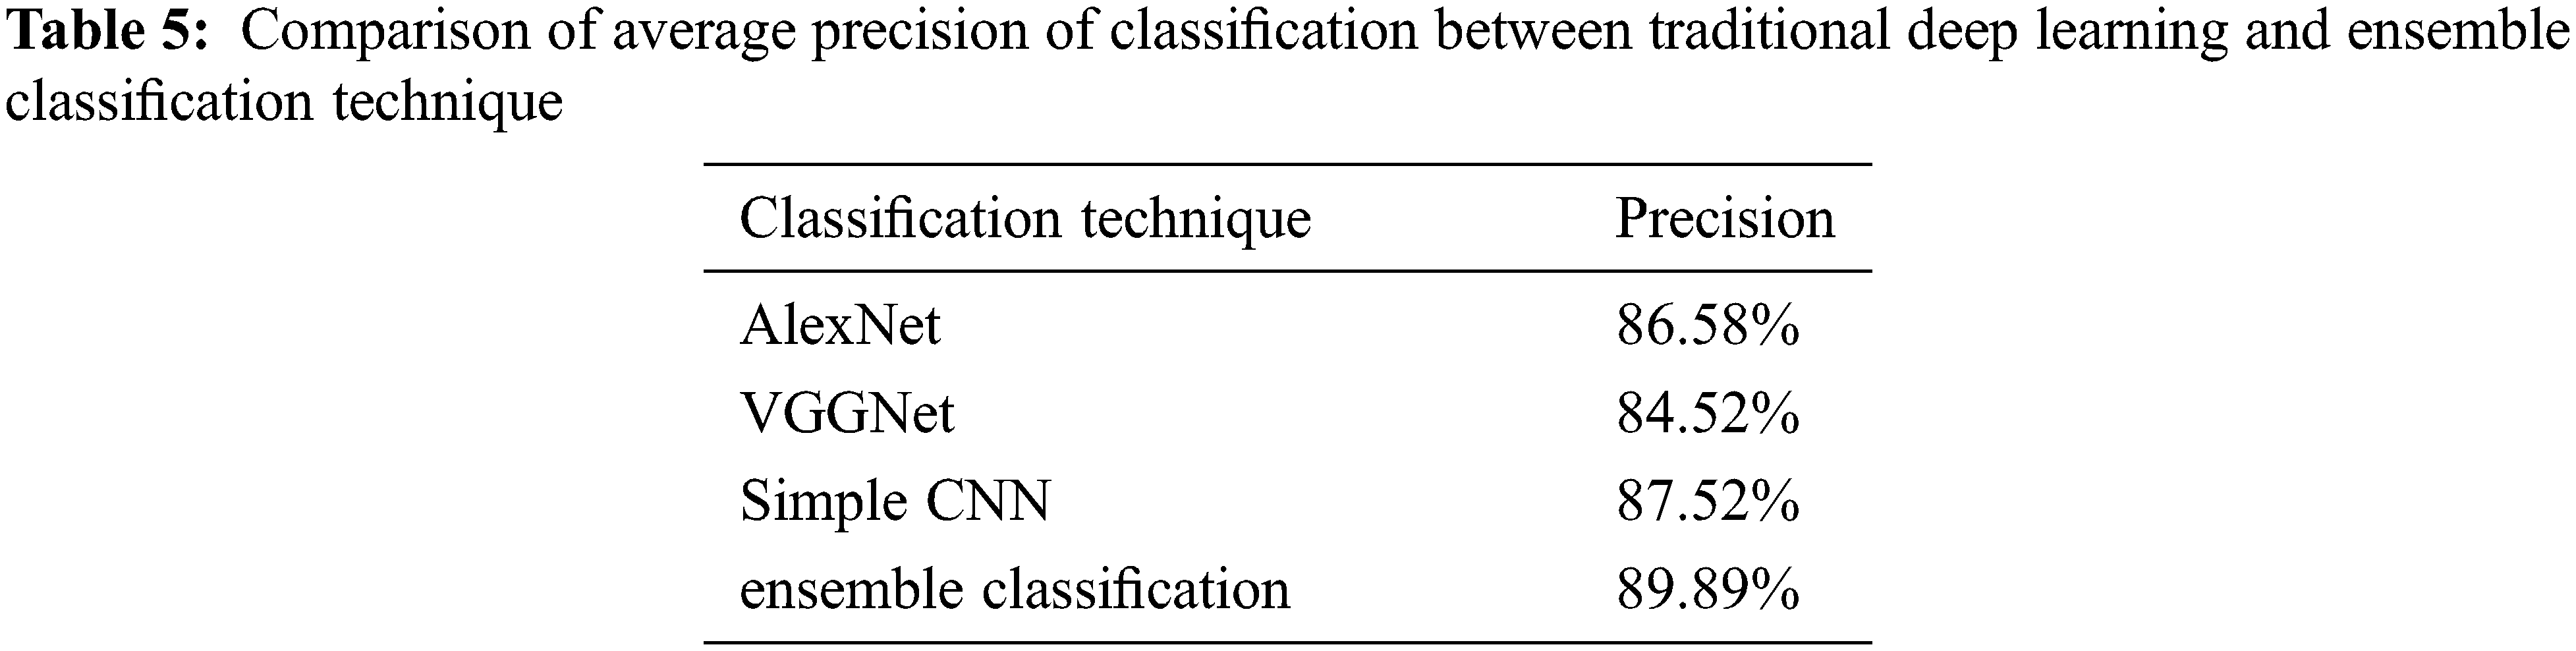

Figure 12: Loss value in each epoch

Figure 13: Model accuracy in epoch 86–100

Figure 14: Model summary
In Tab. 2, the average precision is 0.896 (89.6%); however, this was only for finding 1 class. The program evaluates all classes repeatedly and determines the mean average precision (mAP) of the model. After training and testing the precision of Models 1 and 2, we obtained the following results:
As shown in Tab. 3, the average precision was 0.896 (89.6%); however, this was only for finding 1 class. The program evaluates all classes repeatedly and determines the mean average precision (mAP) of the model. After training and testing the precision of Models 1 and 2, we obtained the following results:
The goal of this study was to create algorithms for assessing bacterial infections in rice using images from unmanned aerial vehicles (UAVs) with an ensemble classification technique. Object detection using the You Only Look Once (YOLO) method can forecast the type of rice disease. However, due to the possibility of an output fault, it is unable to determine which disease kind of rice is present in a single procedure. The model has been divided into two parts: the first recognizes the rice in the image, and the second predicts the type of rice disease based on the model’s highest probability. Convolutional neural networks in unmanned aerial vehicles image was used. To convey this interest, the rice’s health and bacterial infection inside the photo were detected. The project entailed using pictures to identify bacterial illnesses in rice. The shape and distinct characteristics of each infection were observed. Rice symptoms were defined using machine learning and image processing techniques. Two steps of a convolution neural network based on an image from a UAV were used in this study to determine whether this area will be affected by bacteria. The proposed algorithms can be utilized to classify the types of rice deceases with an accuracy rate of 89.84 percent. In future, the proposed ensemble classification technique will apply for multiclass classification to improve the detection accuracy rate with optimized feature selection strategies.
Funding Statement: This research was funded by King Mongkut’s University of Technology North Bangkok (Contract no. KMUTNB-63-KNOW-044).
Conflicts of Interest: The authors declare that they have no conflicts of interest to report regarding the present study.
1. J. Swings, M. V. D. Mooter, L. Vauterin, B. Hoste, M. Gillis et al., “Reclassification of the causal agents of bacterial blight (Xanthomonas campestris pv. oryzae) and bacterial leaf streak (Xanthomonas campestris pv. oryzicola) of rice as pathovars of Xanthomonas oryzae (ex Ishiyama 1922) sp. nov., nom. rev.,” International Journal of Systematic and Evolutionary Microbiology, vol. 40, no. 3, pp. 309–311, 1990. [Google Scholar]
2. L. Deng and D. Yu, “Deep learning: Methods and applications foundations and trends,” Signal Processing, vol. 7, no. 3–4, pp. 197–387, 2014. [Google Scholar]
3. Y. Bengio, A. Courville and P. Vincent, “Representation learning: A review and new perspectives,” IEEE Transactions on Pattern Analysis and Machine Intelligence, vol. 35, no. 8, pp. 1798–1828, 2013. [Google Scholar]
4. S. Prasomphan and J. E. Jung, “Mobile application for archaeological site image content retrieval and automated generating image descriptions with neural network,” Mobile Networks and Applications, vol. 22, no. 4, pp. 642–649, 2017. [Google Scholar]
5. S. Prasomphan, T. Tathong and P. Charoenprateepkit, “Traffic sign detection for panoramic images using convolution neural network technique,” in Proc. the 2019 3rd High Performance Computing and Cluster Technologies Conf. on - HPCCT2019, Guangzhou China, pp. 128–133, 2019. [Google Scholar]
6. A. Karpathy and F. F. Li, “Deep visual-semantic alignments for generating image descriptions,” IEEE Transactions on Pattern Analysis and Machine Intelligence, vol. 39, no. 4, pp. 664–676, 2017. [Google Scholar]
7. R. Socher, A. Karpathy, Q. V. Le, C. D. Manning and A. Y. Ng, “Grounded compositional semantics for finding and describing images with sentences,” Transactions of the Association for Computational Linguistics, vol. 2, no. 1, pp. 207–218, 2014. [Google Scholar]
8. W. Zaremba, I. Sutskever and O. Vinyals, “Recurrent neural network regularization,” preprint arXiv:1409.2329, 2014. [Google Scholar]
9. P. Young, A. Lai, M. Hodosh and J. Hockenmaier, “From image descriptions to visual denotations: New similarity metrics for semantic inference over event descriptions,” Transactions of the Association for Computational Linguistics, vol. 2, no. 1, pp. 67–78, 2014. [Google Scholar]
10. M. Nagano and T. Fukami, “Development of a skin texture evaluation system using a convolutional neural network,” International Journal of Innovative Computing, Information and Control, vol. 16, no. 5, pp. 1821–1827, 2020. [Google Scholar]
11. R. E. Saragih, D. Gloria and A. J. Santoso, “Classification of ambarella fruit ripeness based on color feature extraction,” ICIC Express Letters, vol. 15, no. 9, pp. 1013–1020, 2021. [Google Scholar]
12. E. Liu, “Research on image recognition of intangible cultural heritage based on CNN and wireless network,” EURASIP Journal on Wireless Communications and Networking, vol. 240, no. 1, pp. 1–12, 2020. [Google Scholar]
13. A. Belhi, A. Bouras, A. K. Ali and S. A. Foufou, “Machine learning framework for enhancing digital experiences in cultural heritage,” Journal of Enterprise Information Management, vol. ahead-of-print, no. ahead-of-print, pp. 1–13, 2020. [Google Scholar]
14. X. Zhang, X. Wang, Y. Du and X. Qin, “Domain adaptation image classification based on multi-sparse representation,” KSII Transactions on Internet and Information Systems, vol. 11, no. 5, pp. 2590–2606, 2017. [Google Scholar]
15. D. Zhang, X. Zhou, J. Zhang, Y. Lan, C. Xu et al., “Detection of rice sheath blight using an unmanned aerial system with high-resolution color and multispectral imaging,” PLoS ONE, vol. 13, no. 5, pp. 1–14, 2018. [Google Scholar]
16. J. Abdulridha, Y. Ampatzidis, J. Qureshi and P. Roberts, “Laboratory and UAV-based identification and classification of tomato yellow leaf curl, bacterial spot, and target spot diseases in tomato utilizing hyperspectral imaging and machine learning,” Remote Sensing, vol. 12, no. 2732, pp. 1–17, 2020. [Google Scholar]
17. D. Gao, Q. Sun, B. Hu and S. Zhang, “A Framework for agricultural pest and disease monitoring based on internet-of-things and unmanned aerial vehicles,” Sensors (Basel), vol. 20, no. 1487, pp. 1–18, 2020. [Google Scholar]
18. M. Pineda, M. L. Pérez-Bueno and M. Barón, “Detection of bacterial infection in melon plants by classification methods based on imaging data,” Frontiers in Plant Science, vol. 9, no. 164, pp. 1–10, 2018. [Google Scholar]
19. X. Wang, J. Huang, Y. Chu, A. Shi and L. Xu, “Change detection in bitemporal remote sensing images by using feature fusion and fuzzy c-means,” KSII Transactions on Internet and Information Systems, vol. 12, no. 4, pp. 1714–1729, 2018. [Google Scholar]
20. A. Karpathy and F. Li, “Deep visual-semantic alignments for generating image descriptions,” in Proc. the 2015 IEEE Conf. on Computer Vision and Pattern Recognition, VPR2015, Boston, MA, USA, pp. 3128–3137, 2015. [Google Scholar]
21. M. Hodosh, P. Young and J. Hockenmaier, “Framing image description as a ranking task: Data, models and evaluation metrics,” Journal of Artificial Intelligence Research, vol. 47, no. 1, pp. 853–899, 2013. [Google Scholar]
22. H. Su, F. Wang, Y. Li and L. J. Guibas, “3D-assisted image feature synthesis for novel views of an object,” CoRR abs/1412.0003, vol. 1412, pp. 1–21, 2014. [Google Scholar]
23. A. Farhadi, M. Hejrati, M. A. Sadeghi, P. Young, C. Rashtchian et al., “Every picture tells a story: Generating sentences from images,” Computer Vision – ECCV 2010 Lecture Notes in Computer Science, vol. 6314, pp. 15–29, 2010. [Google Scholar]
24. S. A. Zamani and Y. Baleghi, “Visible-thermal database of rice field,” Mendeley Data, V1, 2021. [Online]. Available: http://dx.doi.org/10.17632/9xg52j8tmw.1. [Google Scholar]
 | This work is licensed under a Creative Commons Attribution 4.0 International License, which permits unrestricted use, distribution, and reproduction in any medium, provided the original work is properly cited. |