DOI:10.32604/csse.2023.021332
| Computer Systems Science & Engineering DOI:10.32604/csse.2023.021332 | |
| Article |
Design of Online Vitals Monitor by Integrating Big Data and IoT
1Department of Computer Science Engineering, Vel Tech Multitech Dr. Rangarajan Dr. Sakunthala Engineering College, Chennai, 600062, India
2Department of Electronics & Communication Engineering, Vel Tech Multitech Dr. Rangarajan Dr. Sakunthala Engineering College, Chennai, 600062, India
*Corresponding Author: E. Afreen Banu. Email: afreenbanuphd@gmail.com
Received: 30 June 2021; Accepted: 02 August 2021
Abstract: In this work, we design a multisensory IoT-based online vitals monitor (hereinafter referred to as the VITALS) to sense four bedside physiological parameters including pulse (heart) rate, body temperature, blood pressure, and peripheral oxygen saturation. Then, the proposed system constantly transfers these signals to the analytics system which aids in enhancing diagnostics at an earlier stage as well as monitoring after recovery. The core hardware of the VITALS includes commercial off-the-shelf sensing devices/medical equipment, a powerful microcontroller, a reliable wireless communication module, and a big data analytics system. It extracts human vital signs in a pre-programmed interval of 30 min and sends them to big data analytics system through the WiFi module for further analysis. We use Apache Kafka (to gather live data streams from connected sensors), Apache Spark (to categorize the patient vitals and notify the medical professionals while identifying abnormalities in physiological parameters), Hadoop Distributed File System (HDFS) (to archive data streams for further analysis and long-term storage), Spark SQL, Hive and Matplotlib (to support caregivers to access/visualize appropriate information from collected data streams and to explore/understand the health status of the individuals). In addition, we develop a mobile application to send statistical graphs to doctors and patients to enable them to monitor health conditions remotely. Our proposed system is implemented on three patients for 7 days to check the effectiveness of sensing, data processing, and data transmission mechanisms. To validate the system accuracy, we compare the data values collected from established sensors with the measured readouts using a commercial healthcare monitor, the Welch Allyn® Spot Check. Our proposed system provides improved care solutions, especially for those whose access to care services is limited.
Keywords: Big data analytics; blood pressure; body temperature; physiological parameters; pulse rate; sensors; SPo2
By digitizing the physical realm, the Internet of Things (IoT) technology enables substantial societal benefits and magnifies the scope of real-time monitoring systems. Recently, the wide adoption of IoT-enabled applications has amplified the explosion of real-time monitoring systems for different domains including home automation [1], energy management [2], environmental monitoring [3], production [4], security [5], and healthcare industry [6]. The extensive collection of smart expedients and applications is called the Internet of Things. Indeed, IoT act as a predominant source of big data streams in healthcare industries which are known for their volume, velocity, and variety. Big data is a new excellent partaker employed in the healthcare sector that provides high-quality service and procures pioneering and intelligent solutions. As the capability, dependability, and accuracy of smart medical devices as well as information and communication technologies (ICT) progress, heterogeneous “real-time data streams” from interconnected medical devices will be a crucial parameter in making evidence-based decisions [7]. Sensors are the primary constituents of IoT. Indeed, enormous data generated from IoT sensors have been quite useful in developing and implementing better analysis and prediction methods employed in the healthcare domain. The data from such sensors can help patient monitoring, predicting the spread of diseases, and proposing approaches to cover certain pandemic outbursts. Albeit IoT has brought outstanding scenarios that can help care providers increase profits, reduce medical costs, and enhance performance, measuring huge data only is not sufficient.
To leverage the benefits of IoT technology, healthcare organizations must develop a system where they can measure, process, and assess big clinical data in a profitable and scalable way. Big data analytics enable the medical sector to reshape its domain efficiently. On the top-end, these organizations can employ data analytic systems to make actionable verdicts from enormous data and support medical staff to save lives by making early clinical interventions [8]. IoT is finding applications in medical as well as non-medical scenarios in the healthcare sector [9]. In a medical scenario, IoT is employed to capture physiological parameters of individuals including body temperature (BT), respiration rate (RR), blood pressure (BP), pulse rate (PR), level of oxygen saturation (SPo2), and so on. This enables tracking of vital signals and assists doctors with consoles to visualize the data. Sensors can be implemented and monitored distantly, thus enabling the best care solutions in the outpatient setting. In a non-medical scenario, IoT can be employed for tracking physician’s location, tracking resources, locating ambulances during emergencies, adherence with sanitation standards and performance by tracing resources, people inside the clinic, and delivering instantaneous data for logistics [9].
Systematic vital signals monitoring is an integral part of patient care, which targets to expedite the early detection of abnormal parameters of worsening patients. Instability in vitals is an extremely sensitive predictor of clinical deterioration and imminent adversarial happenings including heart attack or even death [10]. The erstwhile prediction of subtly deteriorating patients enables enhanced consequences such as reduced mortality rate and better-quality care [11]. Conventional discontinuous manual parameter monitoring systems (e.g., early warning score and new early warning score) lead to unobserved patient deterioration due to insufficient observation [12]. Remote patient monitoring systems in conjunction with sensor technology and ICT enable unremitting patient surveillance and provide the greatest opportunity to measure vital signs remotely. The realization of IoT also hinges on the increasing application of big data analytics to deliver an alert about a possible risky event for a patient [11]. The adoption of big data analytic tools in the medical industry has been limited so far. Complex algorithms are required for the applications like calculating whether minor variations in parameters reflect an up-and-coming health problem. These organizations also require access to various datasets that exist in data centers across healthcare organizations. In order to process real-time data streams, many healthcare institutions and investigators have developed big data analytical tools like Apache Spark, Apache Flink, Apache Storm, etc. With these processing tools, it has become more effective to process real-time data streams. Therefore, some medical specialists have done an irreversible shift towards stream computing applications using medical big data analytic tools [13]. As for as we know, no research work has been conducted to achieve online disease diagnosis and risk prediction. This motivates us to develop a prototype model with IoT-enabled sensors and a real-time risk prediction model to assess the patient’s health status in real-time. VITALS integrates an IoT-based kit to measure physiological parameters and a big data analytics system for data ingestion, processing big data streams, data archiving, information retrieval, and visualization.
The major objective of this work is to develop a multisensory online vitals monitor for the remote patient monitoring system. The key contributions of the manuscript are four-fold.
• We identify the drawbacks of traditional vital sign monitoring systems and their inappropriateness in remote health services.
• We explore the necessity for developing real-time physiological signs monitoring system and decision making by integrating IoT and big data analytics technologies to provide a reliable, real-time, and transparent interconnection among stakeholder components of the proposed system.
• We implement our system on three patients for 7 days to check the effectiveness of sensing, data processing, and data transmission mechanisms. To validate the accuracy of the proposed system, the outputs of the system are related to the sensed data values through a commercial healthcare monitor, the Welch Allyn® Spot Check.
• We develop a mobile application to send the measure parameters and statistical graphs to doctors and patients in order to enable them to track health conditions remotely.
The article is framed as follows. The following Section provides existing healthcare systems aiming to provide continuous remote healthcare monitoring and classify patient data. In Section 3, we present the architecture of the proposed system VITALS in detail. Section 4 describes the implementation details of our model and evaluates the results obtained from a real-time scenario. In Section 5, we conclude this paper.
Of late, adopting IoT-sensor technologies and big data analytics to monitor patient health has increased exponentially. Several IoT-based health monitoring applications have already been commercialized and existing in the market owing to the aptitude of these systems to deliver fast, secure, and lucrative solutions [14,15]. Islam et al. presented an overview of extant IoT–based health monitoring systems, and cutting-edge network models, recent developments, platforms, and applications in this domain [16]. Also, the authors emphasized security and privacy problems in existing relevant systems. They developed a security model targeting to reduce security breaches. Srinivasan et al. developed an intelligent monitor that gathers vital parameters of patients using various sensors and enables a physician to measure vitals distantly, diagnose diseases rapidly, and also sends warnings to both the physician and the guardian of the patient through emails or messages in real-time [17]. Acharya et al. proposed a health monitor using an IoT-based kit [18]. The proposed system measured human vitals such as PR, electrocardiogram (ECG), BT, and RR using appropriate sensors and raspberry pi. The vital signals are gathered from sensing elements and transmitted to raspberry pi for processing and again sent to the network. The key downside of this approach is that no interfaces for data visualization are designed. Majumder et al. introduced an IoT-based multi-sensory system to gather data from the body area network for delivering the primary evidence and early warning of the chances of heart attack [19]. The major goal of this work is to develop and implement an integrated IoT system to measure PR and BT through smartphones using low-power ICT without distressing day-to-day activities.
Mohammed et al. developed an IoT-enabled healthcare monitoring system using suitable sensors (for measuring ECG, BT, PR, and SPo2), the MySignals development shield, and a low-power long-range (LoRa) communication technology [20]. The sensors integrated with MySignals and LoRa wireless connectivity. The major objective of this work is to enable MySignals to collect vitals and send these signals to a personal computer through the LoRa connectivity module. The authors used statistical analysis methods to assess the efficiency of this system. Reshma et al. developed a healthcare system that assimilates Arduino Uno microcontroller and an infrared-based PR sensor [21]. The proposed approach has the potential to measure patient vitals including BT and PR. The PR sensor was employed for measuring the pulse rate directly. Also, the proposed approach enables its customers to measure the value of BT by calculating their mean blood vessel weight. The results are displayed on the Android platform.
Cloud computing is employed as an enabling technology that allows IoT systems to deliver reliable and easier communication between multiple sensors/devices and stakeholders of the healthcare system. Al-Kababji developed an IoT-enabled fall detection and ECG tracking mechanism using cloud computing and a mobile application [22]. The authors particularly developed this system to monitor elderly patients’ by measuring their accelerometer and ECG data continuously. In another study, Mohammed et al. proposed a health monitor using cloud computing and web services [23]. The authors developed a mobile application known as ECG Android App to visualize data gathered from patients. Xin and Wu proposed a wearable cuffless device to monitor both diastolic and systolic BP. The sensed data are sent to the cloud server for storage and further analysis [24]. The effectiveness and accuracy of this system are verified on 60 patients. Guntha integrated cloud and fog computing with real-time noninvasive blood glucose and BP monitoring system [25]. This system also stores the sensed parameters in a cloud server for further analysis or long-term data storage.
The abovementioned works reveal that recently, numerous architectures, models, and approaches have been emerged and implemented to deliver better-quality care for individuals. Conversely, very few dependable models have developed that can successfully implement a holistically real-time, lucrative, and intelligent method in the medical industry. Some extant healthcare systems focused on how diverse smart things efficiently assimilating, while others focused on the security of patient data. Real-time data processing and prediction are the most important endeavors in healthcare ecosystems, particularly in emergency care units [26]. With issues such as communication delay, traffic congestion, central node reliance, etc., the extant system using the cloud platform fails to address the critical requirement of real-time data processing and prediction [27]. The time taken for transferring data to the cloud server from the sensing sites and send the outcomes to the customers is considerably high. The prevailing cloud-based techniques do not deliver any dependable and noteworthy solution to handle this problem. Bearing the aforementioned deficiencies in mind, the prevailing cloud-based healthcare system cannot deliver viable healthcare solutions for serious real-time use-cases. Also, earlier research works demonstrated that cloud technology provides innumerable services and benefits to the healthcare systems; but, for data processing and management, they fail to consider the growing demands for real-time performance and fulfill the user needs. By considering these restrictions of the conventional cloud technology, we developed a novel approach that integrates the potentials of IoT and big data analytics systems to deliver real-time, lucrative, and effective data processing and management services. The proposed framework helps in processing and managing emergency use-cases at the online data analytic system instead of centralized processing at the cloud server. The proposed system provides real-time data processing and decision-making and provides accelerating and lucrative care delivery with less likelihood of data loss.
The proposed monitoring system is intended to measure four bedside vital signals using different biosensors. For this purpose, we develop a working prototype model with appropriate sensors to measure PR, BT, BP, and SPo2. Once the vital parameters are measured, they are transmitted to data analytics tools using a WiFi module for further analysis or long-term storage. The overall architecture of VITALS is shown in Fig. 1. Our VITALS captures the physiological parameters of the patients remotely and achieves real-time data processing effectively. The key objective of VITALS is the automation of the measurement of the vital signals of the patient, resulting in better healthcare services. The developed system will further make things easier to the corresponding processes related to the various participants such as patients, caregivers, physicians, and other medical staff. Each patient is equipped with different biosensors to measure a set of vital parameters. The proposed system enables an automatic vital signals measurement system for multiple patients at programmed intervals to ensure reliable care service. Also, it aids to collects vital signals and provides access to the corresponding stakeholders if needed.

Figure 1: The architecture of VITALS
Our proposed system uses an AVR-IoT WG development board (AC164160) as shown in Fig. 2. This evaluation board comprises a smart ATmega4808 microcontroller, a secure ATECC608A cryptographic coprocessor, and a specialized ATWINC1510 smart connect WiFi module to deliver the most simple and efficient method for interfacing sensing nodes with big data analytic tools. The AVR-IoT WG platform enables several biosensors and medical equipment to capture four important physiological signals including BT, PR, BP, and SPo2.

Figure 2: AVR-IoT WG development board
In this work, the AVR-IoT WG is employed to collect vitals from sensors including MCP9808 (to measure body temperature), MAX30100 (to measure SPo2), and medical equipment called Healthgenie BPM01W (to measure blood pressure and pulse rate). Our proposed system captures patient physiological signals as “live data streams” using multisensory maneuvers and other medical apparatus.
The AC164160 employs the divide and conquer technique through smart elements such as a powerful microcontroller, a secure cryptographic coprocessor chip, and a WiFi communication module to decrease the complexity of the algorithm implementation. The ATECC608A chip in this board is used to store private keys, authenticate the firmware, and provide a secure boot process for the connected maneuvers. This coprocessor chip engenders both the public and private keys by a random number generator and enables devices to create secure communication. The ATWINC1510 WiFi communication module is particularly designed for low-power sensing applications. It has an option of an embedded antenna or a micro coaxial connector for an external antenna. This WiFi unit also assimilates a power amplifier, low-noise amplifier, switch, and power controlling module, which leads to a compact structural design.
The sensing elements and other maneuvers are implemented and controlled through embedded C programming codes. The sensors and Healthgenie BPM01W equipment capture different physiological parameters and transmit them to the analog to digital converter to obtain digital signals. Nonetheless, data collected from the related biosensors/equipment are vulnerable to loss before ingesting by Kafka due to (i) obstacles and distance between connected sensors and the master node; (ii) congestion in the overwhelmed network setting; and (iii) failure in the sensors itself. In this situation, the caregivers cannot make the correct decision about the patient health status or store data for further analysis. In order to prevent this missing data problem, data preprocessing methods must be employed before making any decision or storing data. Hence, these signals are preprocessed by the ATmega4808 microcontroller and sent to the big data analytics system for analysis and visualization through a selected WiFi module as shown in Fig. 3.

Figure 3: (a) ATmega4808 (b) ATWINC1510 module
The big data analytics system used in VITALS contains Apache Kafka to gather live data streams from biosensors every 30 min, Apache Spark to categorize the vital signs and notify the medical professionals while detecting abnormalities in patient vitals, HDFS to store data streams for future analysis. For information retrieval and visualization, VITALS employs Spark SQL and Hive to explore and understand the health status of the individuals and Matplotlib to visualize the results. In addition, we develop a mobile application called VITALS to receive and display patients’ vital signals on a smartphone platform in a text and graphical form. In this work, we develop a working prototype model with appropriate sensors to measure the vitals of the patient remotely as given in Fig. 4.

Figure 4: Prototype of the developed model
3.1 Role of IoT-enabled Sensors in VITALS
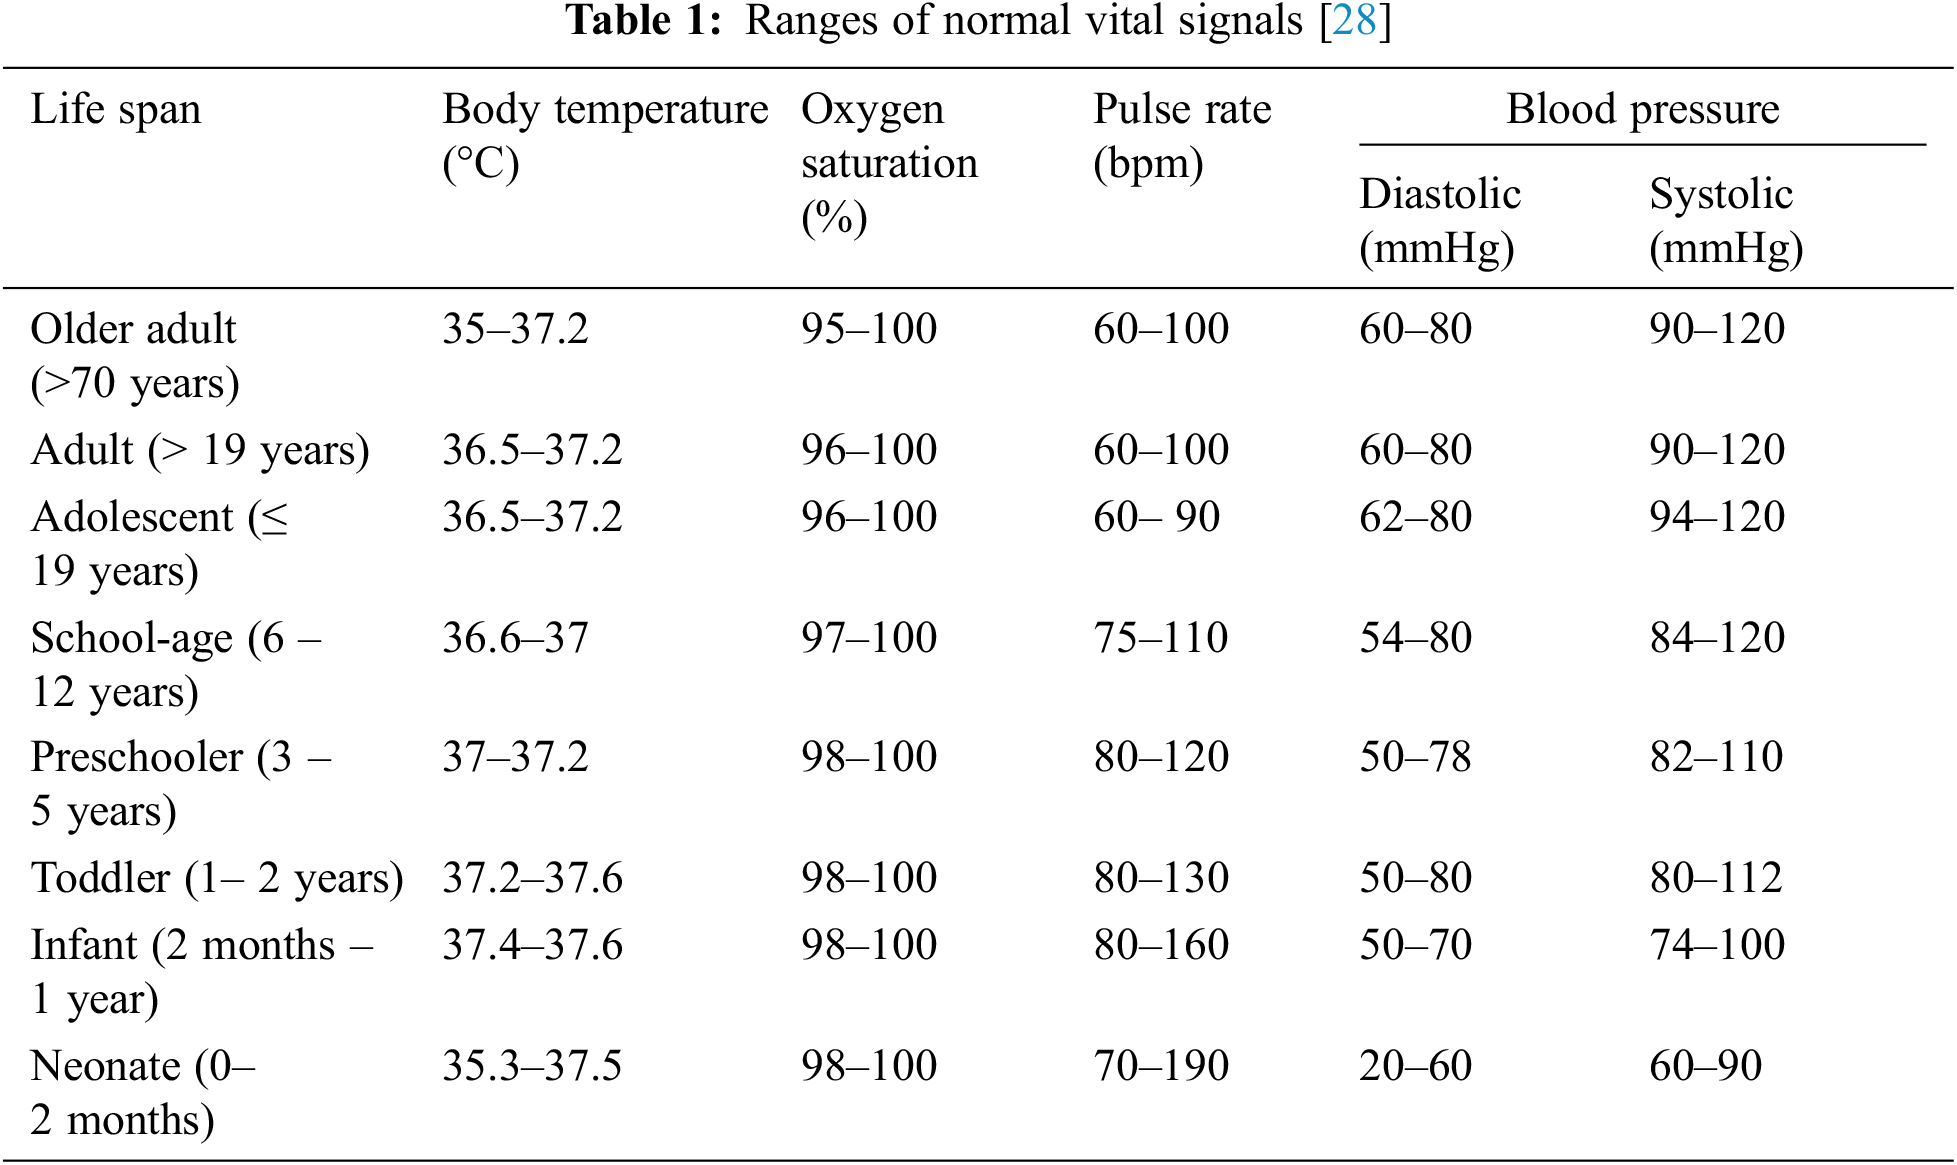
Vital signals reflect the operation of the body’s homeostatic mechanisms. Monitoring and inferring the physiological signals are significant tasks of a healthcare system that can provide knowledge about the basic health condition of the individuals. Also, they are of paramount significance in defining treatment and triage. Indeed, vitals act an important role in calculating medical deterioration in critical care. The rate of vitals anomalies reflect the persistent patient condition, frequency of readmission to clinics, return emergency room visits, and exploitation of healthcare assets in the hospitals. Body temperature, pulse rate, blood pressure, and oxygen saturation are standard vital parameters to reflect the status of the life-sustaining functions and severity of the disease. Mostly, vitals vary with age, gender, body mass index, fitness, and overall health. Tab. 1 displays the normal range of physiological parameters for healthy persons while resting for different phases of life.
The selection of biosensors and medical equipment for capturing patient vitals hinges on the reliability, availability, affordability, and compatibility of the sensors/devices with AVR-IoT WG and ATmega4808 microcontroller. The designated devices are connected to the development board using their appropriate interface units. Each sensing node collects and pre-processes the data and transfers it to the big data analytics system. The sensitivity and ruggedness of the sensors also act an important role in developing VITALS. A small variation in the readout of the sensor will modify the implication of the vital signals. For a reliable analysis, high-quality off-the-shelf sensors are designated.
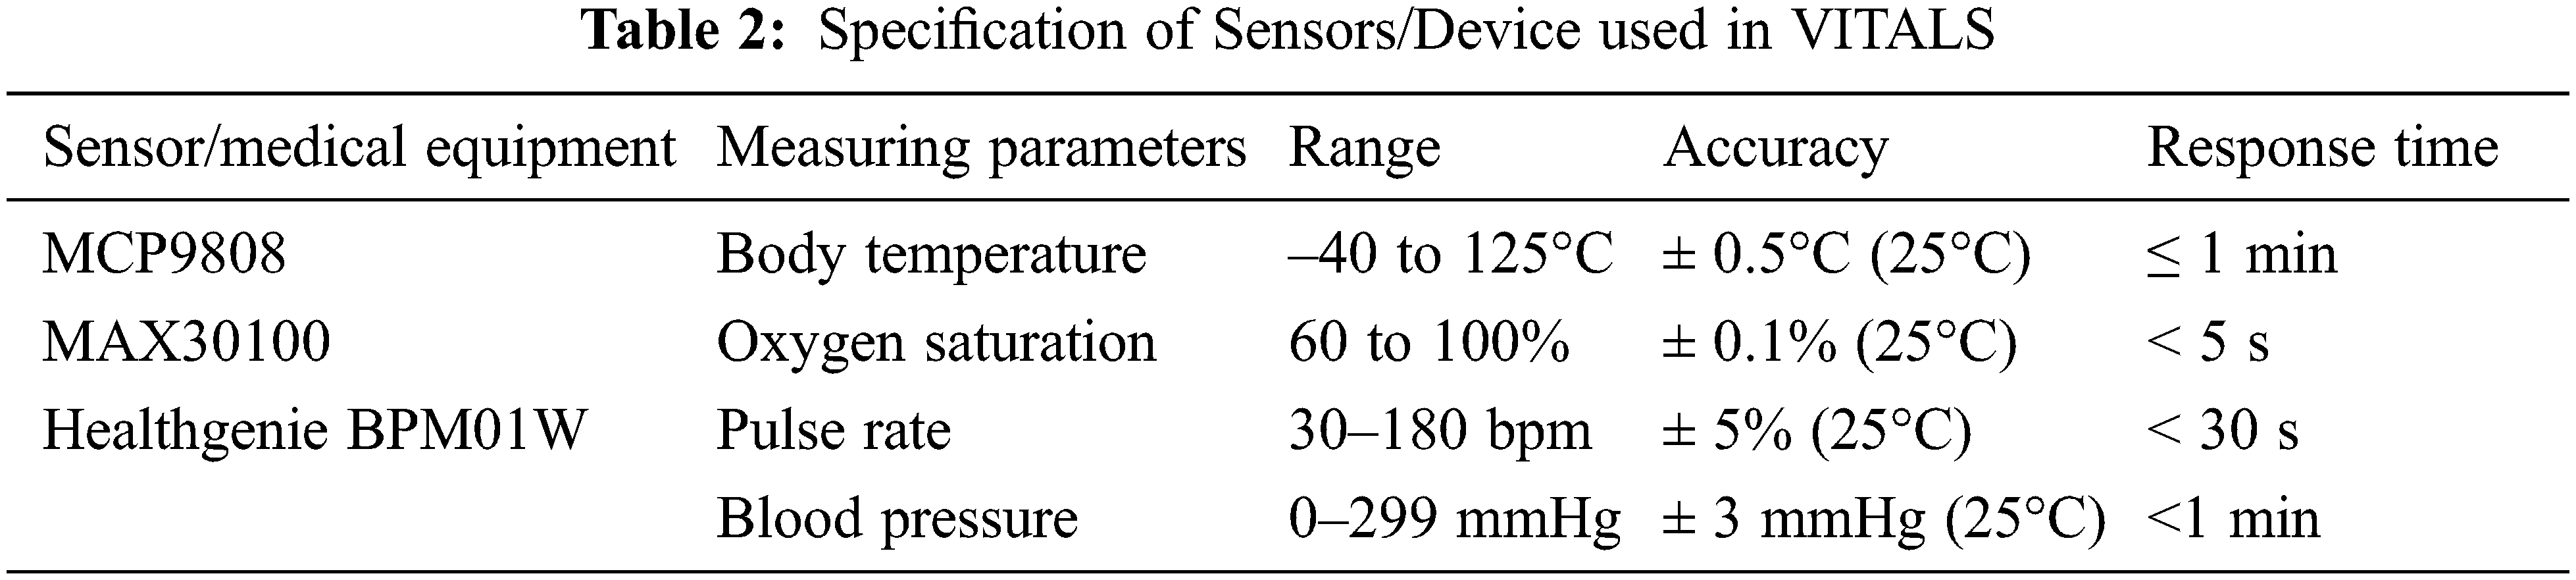
In this framework, two sensors, MCP9808, MAX30100, and non-smart medical equipment Healthgenie BPM01W are selected for measuring BT, SPo2, BP, and PR to provide a common interpretation of patient health condition but can be scaled up in the context of the number of sensors if needed. The ATWINC1510 WiFi unit transmits the measured parameters, date, and time to a master node directly. ATmega4808 is used to collect and pre-process the sensed signals. A compact ATECC608A secure element is used as standby storage for captured parameters. It uses a battery to energize the sensors and other devices in VITALS. The specification of these devices is given in Tab. 2.
3.1.1 Body Temperature Monitoring
The core temperature of the body remains constant except the user develops a febrile illness. The standard BT of humans relies on various factors including age, gender, ambient temperature, time of day, exercise, hot or cold drinks consumption, eating habits, etc. For example, the normal BT can range from 97.8°F (36.5°C) to 99°F (37.2°C) for a healthy adult. BT may be anomalous owing to hypothermia (<95°F) or fever (>98.6°F). In order to measure patient BT, we use an integral MCP9808 digital temperature sensor in the development board which is given in Fig. 5. It measures BT from –40°C to +125°C and converts to a digital word with ±0.5°C accuracy. It contains user-programmable registers which assist users to select operating modes (e.g., low-power or shutdown modes), the critical limits and the condition of BT notifications. Hence, it is very much suitable for flexible BT sensing applications. When the BT varies beyond the definite bounds, the MCP9808 generates and sends an alert signal.

Figure 5: MCP9808 digital temperature sensor
3.1.2 Blood Oxygen Saturation Monitoring
The blood oxygen saturation level of individuals is a critical parameter for predicting the improvement and severity of illness. SPo2 indicates the peripheral saturation of hemoglobin by oxygen. It reflects the general health status of the individuals. SPo2 of a normal healthy adult is 96%–100%. It drops if somebody has a respiratory disease or any other sickness [29]. For patients with minor respiratory problems, the SpO2 ought to be 90% or more. Furthermore, the resting SpO2 value is considerably lower in patients who are in serious condition. Supplementary oxygen must be given if the level of SpO2 drops below 90%, which is undesirable for a prolonged period. In this work, a pulse oximeter is realized using a MAX30100 sensor as given in Fig. 6. It is a non-invasive optical maneuver for measuring Spo2 values. The MAX30100 consists of two light-emitting diodes (one for discharging red light and another one is for emitting infrared light), and a photodetector (for measuring the reflected light from the patient), and a low-noise analog signal processing unit to sense data. It runs with 1.8 V to 3.3 V batteries and can be switched off through a program with trivial standby current, allowing the supply unit to remain coupled at all times.

Figure 6: MAX30100 oximetry sensor
3.1.3 Blood Pressure and Pulse Rate Monitoring
Blood pressure (BP) values are the predominant determining factor of therapeutic decisions as it specifies blood flow when the heart is relaxing (diastole) and contracting (systole). It is impacted by cardiac output, the volume of blood, peripheral vascular resistance, and thickness and elasticity of the vessel wall. Trends or variations in BP values reveal primary pathophysiology or the body’s efforts to sustain homeostasis. For example, a reduction in BP is a common indication in patients prior to heart attacks [30]. A variation in BP alone, however, does not specify that the patient will have a disease, but it enables the medical staff to do additional comprehensive analysis. The significance of sensing BP precisely cannot be over-emphasized; but, it is one of the most imprecisely measured parameters [31]. If a BP reading continuously undervalues the diastolic pressure by 5 mmHg, it leads to two-thirds of hypertensive patients being deprived of preventative therapy [32]. Therefore, it is obligatory to measure the correct values of BP. The proposed VITALS system employs Healthgenie BPM01W upper arm BP monitor to read the exact blood pressure of the patient.
Pulse rate is the count of heart beats per minute (bpm). In order to collect the value PR of an individual, most medical devices use the volume of blood flow. Typical PR ranges from 60 to 100 bpm for a healthy adult. The normal relaxing PR for adult females 75 bpm and males is approximately 70 bpm [33]. VITALS employ Healthgenie BPM01W to measure pulse rate. The medical equipment used to measure BP and pulse rate is given in Fig. 7. It is a non-smart device and the measured values are transmitted to the microcontroller using Universal Asynchronous Receiver/Transmitter (UART) which is embedded in the development board.

Figure 7: Healthgenie BPM01W for measuring BP and PR
3.2 Role of Big Data Analytics in VITALS
The big data analytics used in VITALS is implemented on top of the Apache Spark streaming platform. VITALS consists of the following data analytic tools: (i) Apache Kafka to gather live streams from connected biosensors; (ii) Apache spark to classify the patient data and send an alert to the healthcare professionals while detecting abnormalities in patient physiological parameters; (iii) HDFS to store data streams for future analysis, and (iv) two information retrieval tools (Spark SQL and Hive) and one graphing tool (Matplotlib) to enable medical staff to access/visualize medical records of patients and to analyze/understand the health status of the patient. Fig. 8 illustrates the flow of data streams from connected biosensors and medical equipment to the big data analytics system used in VITALS.

Figure 8: Big data analytic tools in VITALS
Our system employs Apache Kafka to collect data streams from patient vitals such as BT, PR, BP, and SPo2. Generally, Kafka is working on the idea of “topics” and input streams are stored as keys. We install Kafka on the master node and create a topic, called “Patient_Vitals”, to gather parameters from biosensors then transmit them to a Spark streaming for data processing. In this work, after receiving data streams from Kafka, Spark streaming explore them in real-time and send warning messages to the medical professionals during an emergency case detection. For this purpose, we develop a risk prediction and recommendation module that engenders an alert when an abnormal vital signal is detected. Also, it endorses an apt action that should be taken by the medical staff whenever the patient vitals deviate from the threshold values.
The real-time prediction process in VITALS includes the following modules: the learning module and the deployed model. The learning module accepts the input batches to train the model and directs the training sequences to the deployed model to learn and generate the result. The learning module receives the batch result and then prefers one-to-one analysis from the training sequences and calculates the score (weight) for new data. This model implements the learning process constantly and it updates parameters for each result, which is almost “learning-on-the-fly”. It supports envisaging differences in distribution rapidly and increases the accuracy in many cases. For each vital sign data collected from the connected sensors is related to early warning score between 0 and 3 where 0 denotes the score for normal health status where other values signify the anomaly. Therefore, the severity of the disease is increasing with the score as given in Tab. 3.
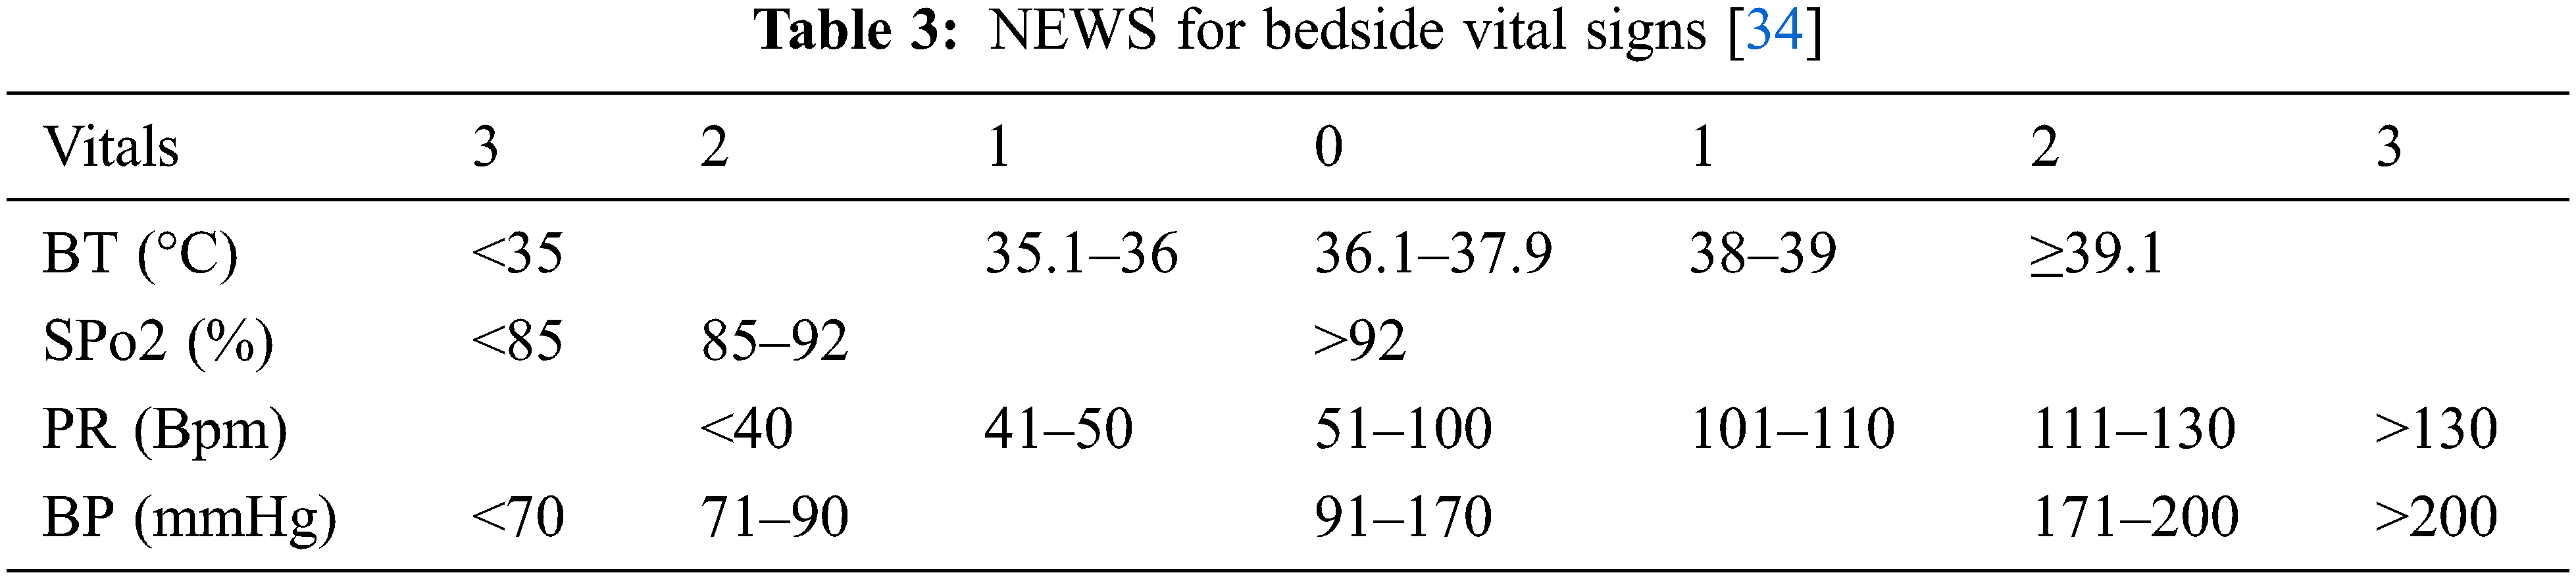
For example, the data gathered from the connected sensors are 38°C (BT), 90% (SPo2), 48 (PR), and 120 (Systolic BP), then the calculated score set is {1, 2, 1, 0}. After computing the score set for every time instance, Apache Stream evaluates the score and directs an alert to the medical professionals with proper recommendations in emergency cases. In our work, we employ the clinical responses guide, National Early Warning Score (NEWS) developed in [35] to calculate the severity of the disease and provide proper recommendations to the medical staff who treat the patient currently. For this purpose, the master node computes the cumulative score from data gathered from the sensors at a particular time and then recommends suitable action to be taken by the medical professionals. Furthermore, the criticality level is predicted from this cumulative score as shown in Tab. 4.
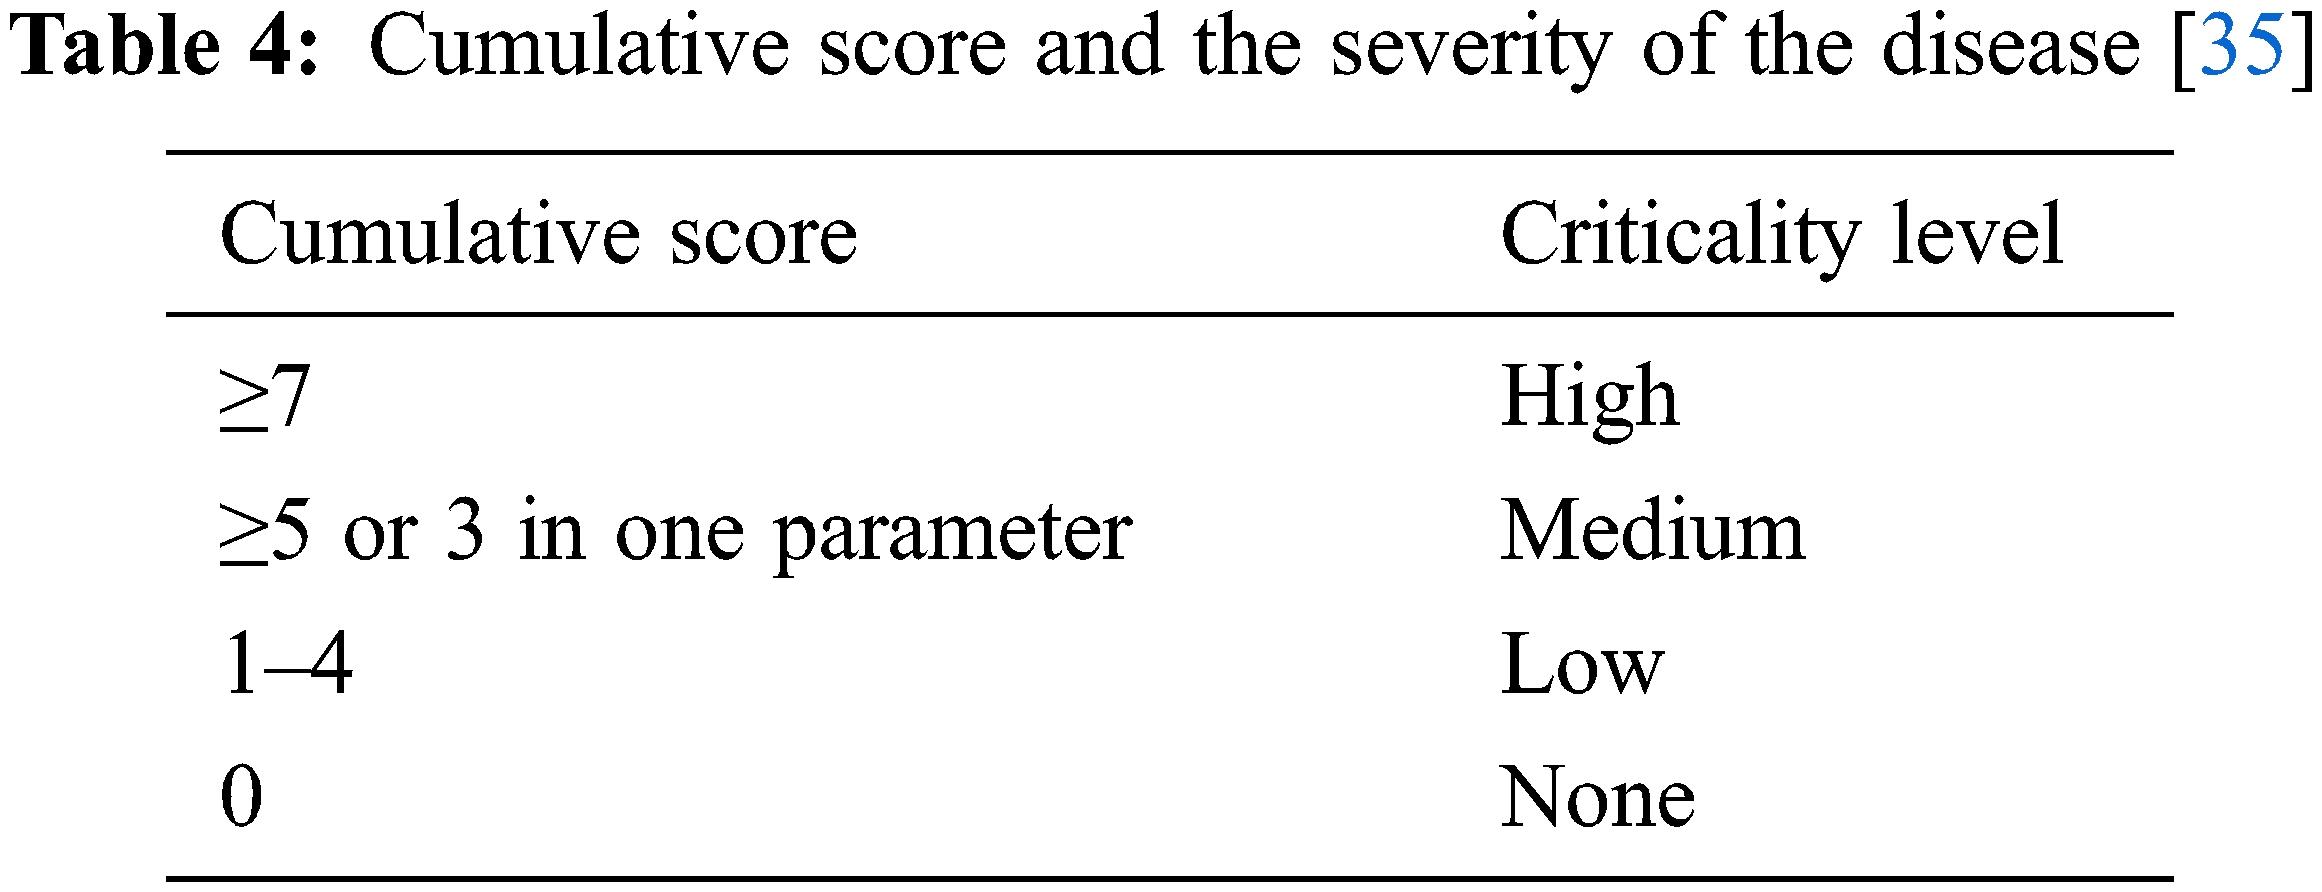
For the aforesaid example, the cumulative score is 4. Now the master node creates a notification to medical staff alerting that the frequency of surveillance of the vital signs should be once in 4 to 6 h. Hence, it is mainly imperative to consider NEWS for giving appropriate recommendations and enable healthcare workers to monitor changes in bedside signals and consequently the early predictions of patient deterioration. Fig. 9 depicts the clinical responses guide based on the calculated cumulative score. Nowadays, healthcare organizations are struggling to store their patient medical record securely. Mostly, hospitals tend to build their own data centers. These data centers enable the doctor to understand diseases, the progress of patient wellbeing over time, and improve the care quality. Our proposed system uses HDFS to archive data. HDFS uses distributed file system concepts that store medical data across several nodes, known as clusters. HDFS splits the medical records into chunks, and then it distributes them to the clusters. Typically, it is pigeonholed by the following features: (i) it delivers superior data reliability by implementing the data redundancy methods in multiple nodes (at least three), which is most useful in IoT-enabled applications, thus the data availability is guaranteed during hardware failures; and (ii) data in HDFS are handled concurrently thus effective information retrieval is ensured, which is important for medical applications especially in emergencies. In our work, we considered three clusters to store data in the form of HDFS files.

Figure 9: Cumulative score and related recommendation [35]
The VITALS uses two information retrieval tools (Spark SQL and Hive) and one graphing tool (Matplotlib) to enable the medical staff to obtain the patient vitals from HDFS. Hive is used for data warehousing to process queries and analyze big datasets archived in HDFS. In addition, it allows customers to generate metadata storage with tabular forms or views in a relational database. This makes our system more efficient by reducing the access time. Moreover, it supports the practitioners to compute the criticality level of diseases. The VITALS installs Hive on the driver and uses a table in the main directory of HDFS. Then, the doctors can search the patient clinical data through the HiveQL console. SparkSQL is used to realize a data abstraction called DataFrames for structured data processing. It enables SparkSQL to use schema and it is realized by domain-specific language. Matplotlib is a comprehensive library in Python and uses its mathematical extension NumPy to create cooperative, active, and static visualizations. Our VITALS enable us to write a Python script to access data stored in HDFS periodically and to visualize them using Matplotlib. We develop a mobile application to send statistical graphs to doctors and patients to enable them to track the health conditions remotely.
4 System Implementation and Evaluation
The proposed healthcare monitoring framework is built over the Apache Spark version 2.3.1 which involves one driver node and three slaves. Our system employed Ubuntu 14.04 virtual machines to create the clusters. The master, as well as executor nodes, contains quad cores, 16 GB of RAM, and 100 GB disk storage. We developed a working prototype model with appropriate sensors. The proposed risk prediction and recommendation module is implemented to identify the criticality level of the health condition of the patient and send an alert to the medical professionals with suitable recommendations.
4.1 To Assess the Accuracy of the Selected Sensors
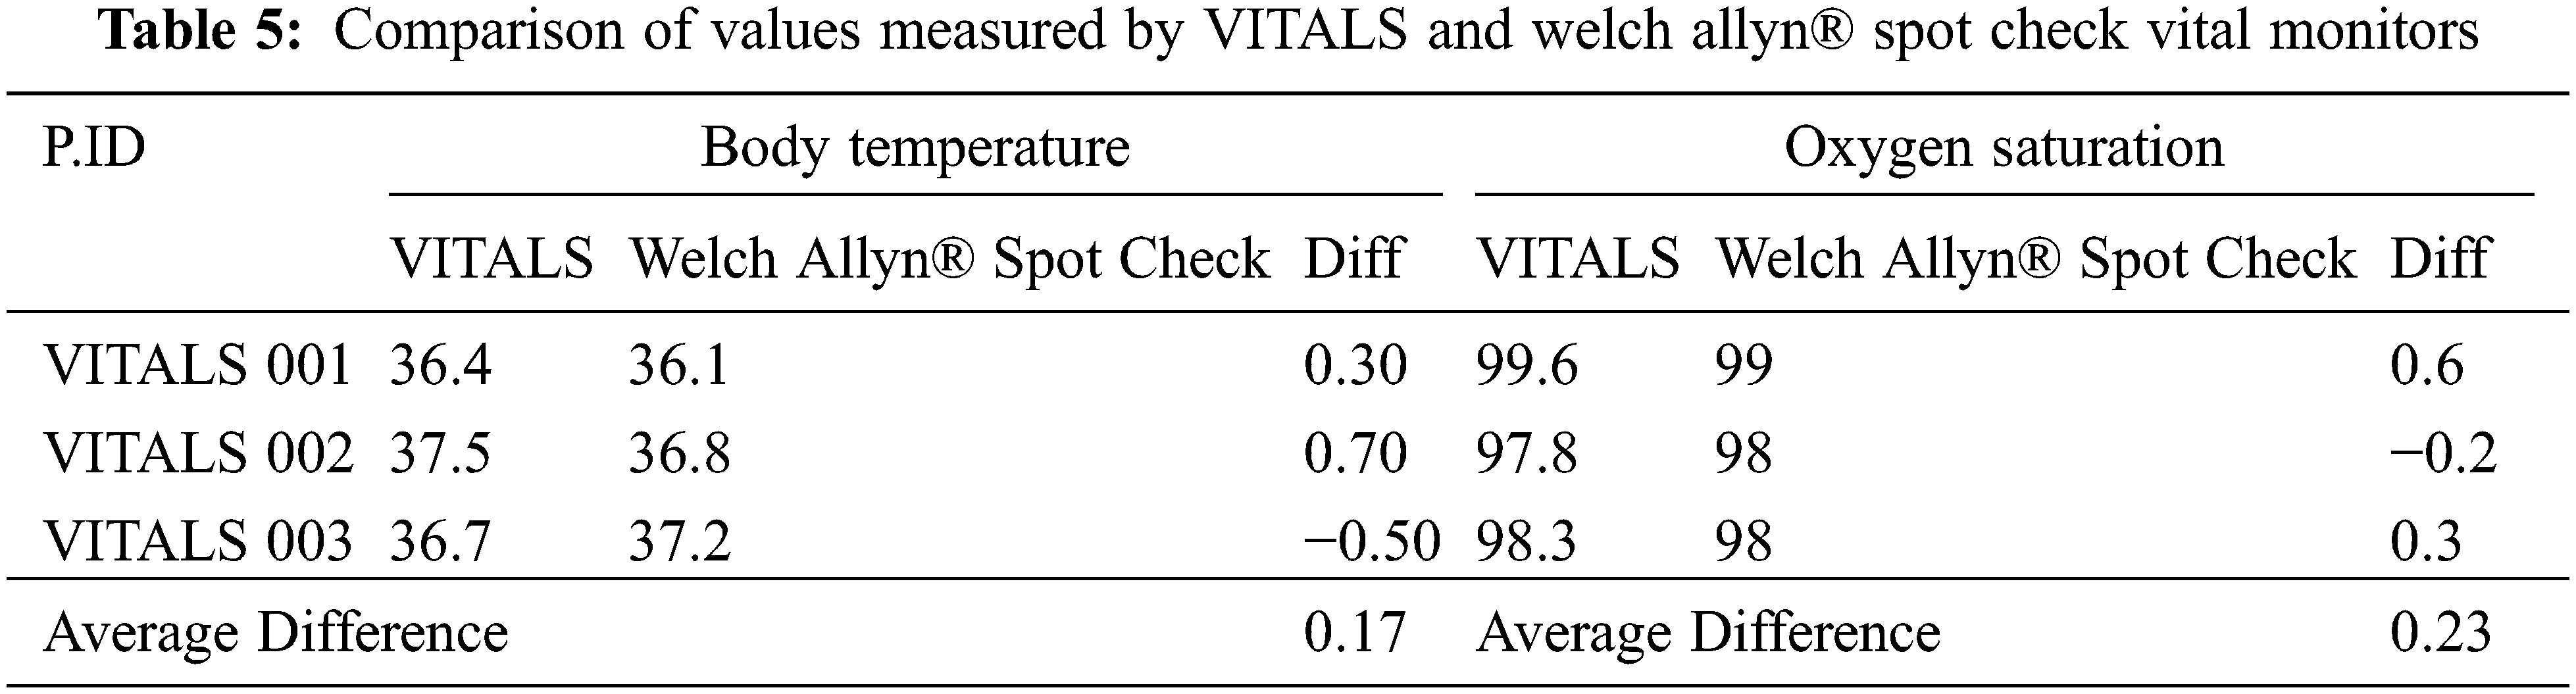
The accuracy of the sensors for BT, SPo2, BP, and PR are also assessed by relating their observed data values to that of the Welch Allyn® Spot Check which is commercial multi-parameter vital signs monitor given in Fig. 10. The Welch Allyn® Spot Check is widely used in hospitals and is known for its reliability. This is carried out by doing concurrent measurements at the selected patients using VITALS and Welch Allyn® Spot Check for each subject. All measured data are then analyzed to calculate potential differences in the acquisitions. We show here the tabulated readings of Tab. 5 taken from both the developed prototype and Welch Allyn® Spot Check vital sign monitor, to evaluate the effectiveness of the sensors. It can be observed in Tab. 5 that the average difference between the values obtained from the developed BT sensor and the observed value of BT from Welch Allyn® Spot Check is 0.17. While for SPo2, a 0.23 difference between the values obtained by the designated SPo2 sensor and with the value obtained by Welch Allyn® Spot Check.

Figure 10: Welch allyn® spot check
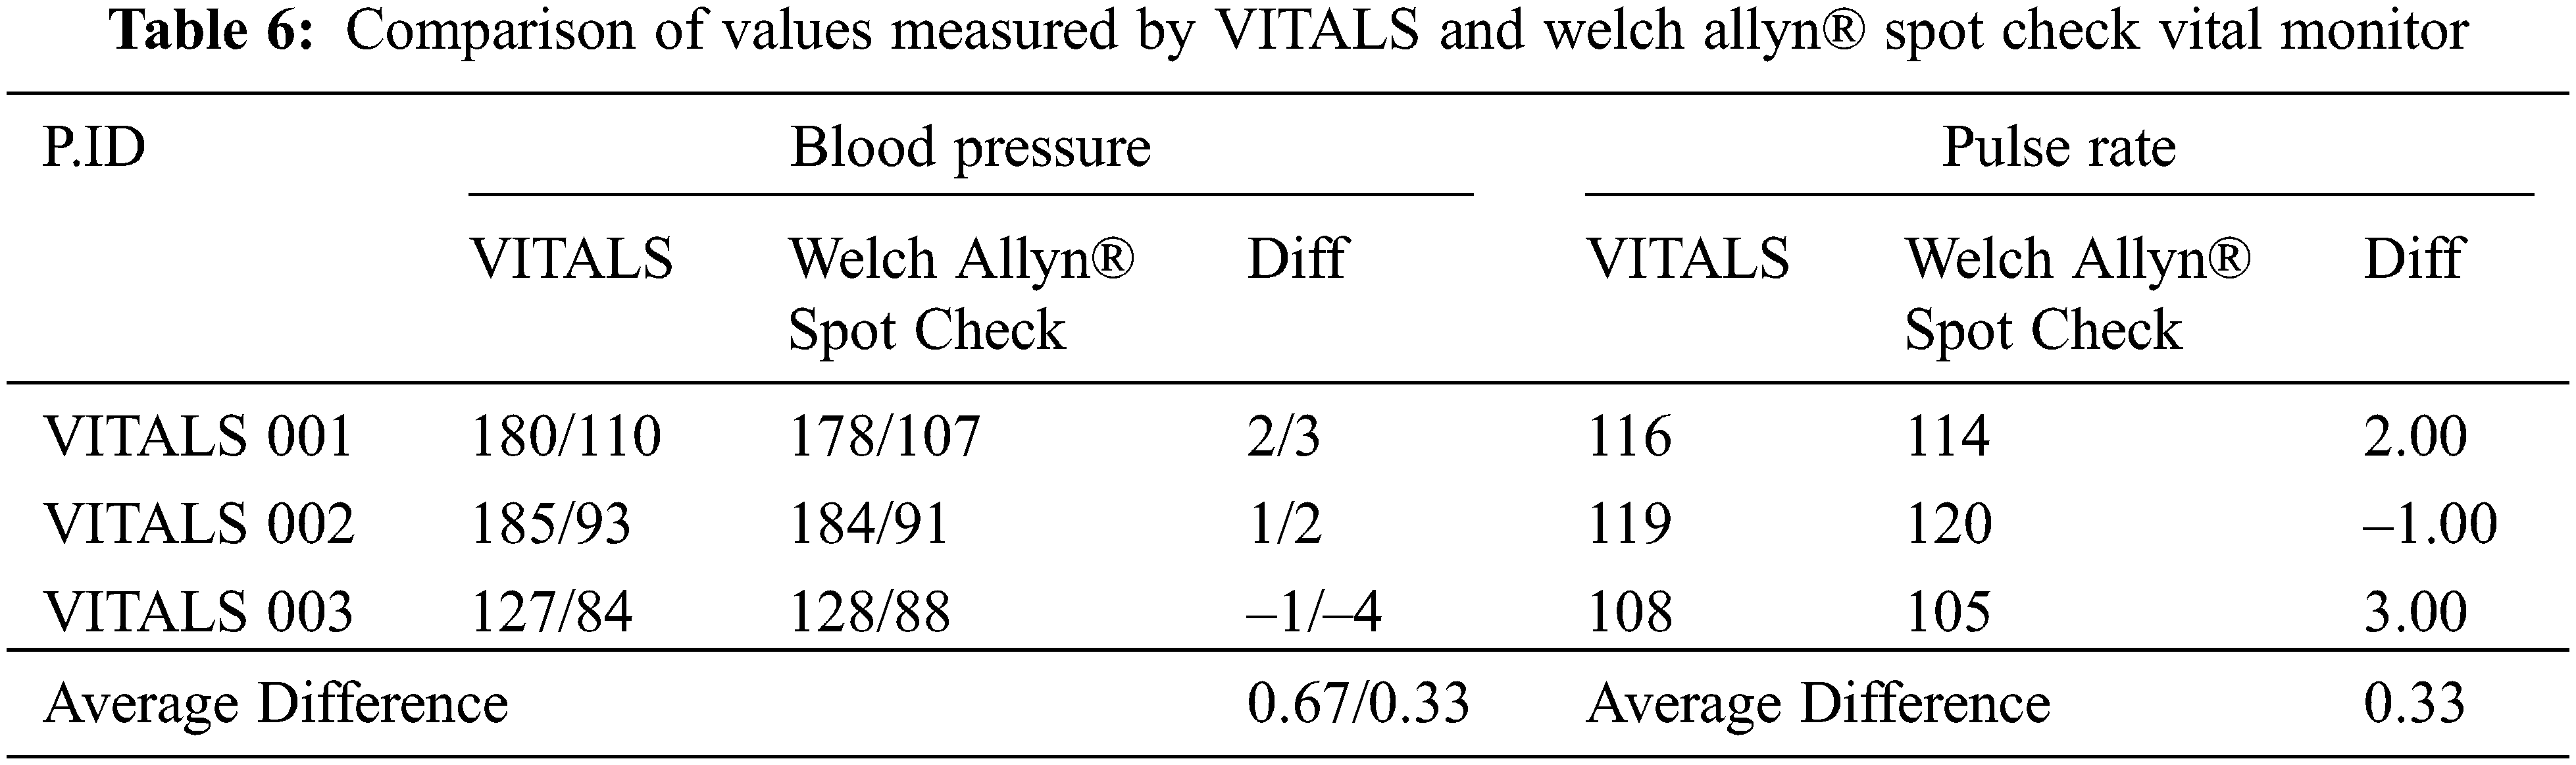
It can also be observed in Tab. 6 that the average difference of the values taken by the BP monitor and the observed value of BP from Welch Allyn® Spot Check is 0.67/0.33. While for PR, a 0.33 difference between the established PR monitor and with the Welch Allyn® Spot Check was observed.
4.2 Development of a Mobile Application
We developed a mobile application for patients and doctors (who use smartphones) named VITALS. This app is created on Android OS by means of the Java language. The app enables patients to visualize their measured physiological parameters with time stamps. It contains a patient module and a physician module. The patient’s account is created by requesting the patients to enter their details such as name, email-id, gender, age, address, and contact details. Each new user registering on our app will be provided with a user id and password. The complete system workflow is that patients register themselves on the system and enter their details such as their user id and password to access their vital signals. Doctors register themselves on the portal and access patient vitals. Fig. 11 shows the home web page of our VITALS application where patients and physicians can register themselves for the system.

Figure 11: Proposed system home page
Fig. 12 depicts the patient and doctor login page of the VITALS application. Then, VITALS will identify patients who are authorized users and display the appropriate results for the corresponding request. The estimated vital signals of the particular patient are displayed on the phone screen in real-time. Each vital sign data collected from the connected sensors is related to early warning score between 0 and 3 where 0 denotes the score for normal health status where other values signify the anomaly. Therefore, the severity of the disease is increasing with the score. The authorized user can access vital parameters at any time instances by entering their ID and password. The established mobile application extracts information from big data analytics system and displays the results as given in Figs. 13a and 13b. The system is able to present reports and dates with recommended decisions.

Figure 12: Patient/doctor login page

Figure 13: Sample patient view of the system (a) Score and recommendation for People with normal health condition (b) Score and recommendation for patient with abnormal health condition
The authorized medical professionals can access patient’s data through this application. They can select a particular patient (refer to Fig. 14) and view the data in the form of statistical graphs as given in Fig. 15.

Figure 14: Sample physician view of the system

Figure 15: Statistical graphs of patient vital signs
5 Conclusions and Future Directions
The integration of IoT, big data analytics system, and mobile applications is a predominant approach in the real-time healthcare monitoring system. This convergence is intended to decrease the total medical cost and increase the quality of care delivery to individuals, especially patients. In this work, we design a multisensory IoT-based real-time vitals monitor to sense BT, SPo2, BP, and PR and constantly transfer these signals to the big data analytics system which aids in enhancing diagnostics at an earlier stage. For this purpose, we use the AVR-IoT WG development board to collect vitals from sensors including MCP9808 (to measure BT), MAX30100 (to measure SPo2), and medical equipment called Healthgenie BPM01W (to measure BP and PR). The developed kit extracts vital signs in a 30 min interval and sends them to the big data analytics system through the WiFi module for further analysis. We use big data analytic tools including Apache Kafka, Apache Spark HDFS, Spark SQL, Hive, and Matplotlib. In addition, we develop a mobile application to send measured data with an overall health condition to the patients and doctors. To validate the accuracy of the system, we implement our system on three patients for 7 days. We compare the data values collected from established sensors with the measured parameters using the Welch Allyn® Spot Check. The VITALS provides improved healthcare facilities to patients, especially for those whose access to care services remotely.
We plan to extend the scope of the application of VITALS to (i) generate an automatic notification to ambulance, family, or friends. The alert will specify the criticality level and the GPS position of the patient to rush an ambulance from a nearby hospital to the patient location. The ambulance will exploit the GPS coordinates to get to the particular location hastily and concurrently tracks the vitals and conveys them to the concerned hospital; (ii) add a module for medicine dispensing system to send alarms to the patient to remind him/her of the scheduled timely medication/injections and out of schedule medicine dosages; (iii) design wearable system (e.g., accelerometer sensor) to monitor potentially infected Covid-19 patient and send an alert to the concerned people in case of emergency and based on violation of self-quarantine regulations; and (iv) send doctor prescriptions to selected pharmacies so that the patients can get the medicine delivered to their doorstep.
Funding Statement: The authors received no specific funding for this study.
Conflicts of Interest: The authors declare that they have no conflicts of interest to report regarding the present study.
1. M. A. Al-Shaher and N. J. Al-Khafaji, “E-healthcare system to monitor vital signs,” in 2017 9th Int. Conf. on Electronics, Computers and Artificial Intelligence (ECAI), Targoviste, pp. 1–5, 2017. [Google Scholar]
2. Z. Alaseel and D. Debnath, “Vital signs monitoring system in cloud environment,” in 2018 IEEE Int. Conf. on Electro/Information Technology (EIT), Rochester, MI, pp. 0073–0078, 2018. [Google Scholar]
3. K. Nagalakshmi, V. Vaishnavee, R. A. Babu and V. M. Suresh, “POTNET: Online potable water quality monitoring network for overhead water tanks in rural water supply schemes in india,” International Journal of Sensors, Wireless Communications and Control, vol. 10, no. 1, pp. 1–7, 2020. [Google Scholar]
4. O. Mörth, M. Eder, L. Holzegger and C. Ramsauer, “IoT-based monitoring of environmental conditions to improve the production performance,” Procedia Manufacturing, vol. 45, pp. 283–288, 2020. [Google Scholar]
5. A. Hussain, T. Ali, F. Althobiani, U. Draz, M. Irfan et al., “Security framework for iot based real-time health applications,” Electronics, vol. 10, no. 6, pp. 1–15, 2021. [Google Scholar]
6. N. Mania, A. Singh and S. L. Nimmagadda, “An IoT guided healthcare monitoring system for managing real time notifications by fog computing services,” Procedia Computer Science, vol. 167, no. 12, pp. 850–859, 2020. [Google Scholar]
7. V. D. Ta, C. M. Liu and G. W. Nkabinde, “Big data stream computing in healthcare real-time analytics,” in Proc.. Chengdu, China, pp. 37–42, 2016. [Google Scholar]
8. C. Sáez and J. M. García-Gómez, “Kinematics of Big biomedical data to characterize temporal variability and seasonality of data repositories: functional data analysis of data temporal evolution over non-parametric statistical manifolds,” International Journal of Medical Informatics, vol. 119, no. 7584, pp. 109–124, 2018. [Google Scholar]
9. S. N. Vankamamidi, S. P. Suryateja, M. Pilla-Sita-Rama and R. Sivaranjani, “Internet of Things in healthcare: Architecture, applications, challenges, and solutions,” International Journal of Computer Systems Science & Engineering, vol. 35, no. 6, pp. 411–421, 2020. [Google Scholar]
10. S. Soon, H. Svavarsdottir, C. Downey and D. G. Jayne, “Wearable devices for remote vital signs monitoring in the outpatient setting: An overview of the field,” BMJ Innovations, vol. 6, no. 2, pp. 55–71, 2020. [Google Scholar]
11. J. N. Blackwell, J. Keim-Malpass, M. T. Clark, R. L. Kowalski, S. N. Najjar et al., “Early detection of in-patient deterioration: one prediction model does not fit all,” Critical Care Explorations, vol. 2, no. 5, pp. 1–7, 2020. [Google Scholar]
12. C. Downey, R. Randell, J. Brown and D. G. Jayne, “Continuous versus intermittent vital signs monitoring using a wearable, wireless patch in patients admitted to surgical wards: Pilot cluster randomized controlled trial,” Journal of Medical Internet Research, vol. 20, no. 12, pp. e10802, 2018. [Google Scholar]
13. M. I. Razzak, M. Imran and G. Xu, “Big data analytics for preventive medicine,” Neural Computing and Applications, vol. 32, no. 9, pp. 4417–4451, 2020. [Google Scholar]
14. H. Kaur and S. K. Sood, “Energy-efficient iot-fog-cloud architectural paradigm for real-time wildfire prediction and forecasting,” IEEE Systems Journal, vol. 14, no. 2, pp. 2003–2011, 2020. [Google Scholar]
15. H. Sun, H. Yu, G. Fan and L. Chen, “Energy and time efficient task offloading and resource allocation on the generic IoT-fog-cloud architecture,” Peer-to-Peer Networking and Applications, vol. 13, no. 2, pp. 548–563, 2020. [Google Scholar]
16. S. M. R. Islam, D. Kwak, M. H. Kabir, M. Hossain and K. Kwak, “The Internet of Things for health care: A comprehensive survey,” IEEE Access, vol. 3, pp. 678–708, 2015. [Google Scholar]
17. C. R. Srinivasan, G. Charan and P. C. S. Babu, “An IoT based SMART patient health monitoring system,” Indonesian Journal of Electrical Engineering and Computer Science, vol. 18, no. 3, pp. 1657–1664, 2020. [Google Scholar]
18. A. D. Acharya and S. N. Patil, “IoT based health care monitoring kit,” in Proc. ICCMC, Erode, India, IEEE, pp. 363–368, 2020. [Google Scholar]
19. A. K. M. Majumder, Y. A. ElSaadany, R. Young and D. R. Ucci, “An energy efficient wearable smart iot system to predict cardiac arrest,” Advances in Human-Computer Interaction, vol. 2019, no. 3, pp. 1–21, 2019. [Google Scholar]
20. S. I. Mohammad, T. I. Mohammad, F. A. Ali, K. B. Gan, M. Norbahiah et al., “Monitoring of the human body signal through the Internet of Things (IoT) based LoRa wireless network system,” Applied Sciences, vol. 9, no. 9, pp. 1–17, 2019. [Google Scholar]
21. S. P. T. Reshma, Y. J. Surya and L. M. Sri, “Heart rate monitoring system using heart rate sensor and arduino uno with web application,” International Journal of Engineering and Advanced Technology, vol. 8, pp. 350–352, 2019. [Google Scholar]
22. A. Al-Kababji, “IoT-based fall and ECG monitoring system: Wireless communication system based firebase real-time database,” in Proc. SmartWorld/SCALCOM/UIC/ATC/CBDCom/IOP/SCI Leicester, UK, pp. 1480–1485, 2019. [Google Scholar]
23. J. Mohammed, C. H. Lung, A. Ocneanu, A. Thakral, C. Jones et al., “Internet of things: Remote patient monitoring using web services and cloud computing,” in Proc. iThings, GreenCom and CPSCom, Taipei, Taiwan, pp. 256–263, 2014. [Google Scholar]
24. Q. Xin and J. Wu, “A novel wearable device for continuous, non-invasion blood pressure measurement,” Computational Biology and Chemistry, vol. 69, pp. 134–137, 2017. [Google Scholar]
25. R. Guntha, “IoT architectures for noninvasive blood glucose and blood pressure monitoring,” in Proc. ISED, Kollam, India, pp. 1–5, 2019. [Google Scholar]
26. X. H. Zhao, S. N. Ma, H. Long, H. Yuan, C. Y. Tang et al., “Multifunctional sensor based on porous carbon derived from metal-organic frameworks for real time health monitoring,” ACS Applied Materials & Interfaces, vol. 10, pp. 3986–3993, 2018. [Google Scholar]
27. H. A. Khattak, H. Abbass, A. Naeem, K. Saleem and W. Iqbal, “Security concerns of cloud-based healthcare systems: A perspective of moving from single-cloud to a multi-cloud infrastructure,” in Proc. HealthCom, Boston, MA, USA, pp. 14–17, 2015. [Google Scholar]
28. K. Masaru, F. Shinya, T. Ken-ichi, K. Junji and I. Kotaro, “Can a pulse oxygen saturation of 95% to 96% help predict further vital sign destabilization in school-aged children?,” Medicine, vol. 97, no. 25, pp. e11135, 2018. [Google Scholar]
29. Q. Zhang, D. Arney, J. M. Goldman, E. M. Isselbacher and A. A. Armoundas, “Design implementation and evaluation of a mobile continuous blood oxygen saturation monitoring system,” Sensors, vol. 20, no. 22, pp. 6581, 2020. [Google Scholar]
30. M. M. Leonard and U. Kyriacos, “Student nurses’ recognition of early signs of abnormal vital sign recordings,” Nurse Education Today, vol. 35, no. 9, pp. e11–e18, 2015. [Google Scholar]
31. M. Elliott and A. Coventry, “Critical care: The eight vital signs of patient monitoring,” British Journal of Nursing, vol. 21, no. 10, pp. 621–625, 2013. [Google Scholar]
32. F. A. McAlister and S. E. Straus, “Evidence-based treatment of hypertension. Measurement of blood pressure: An evidence based review,” BMJ, vol. 322, no. 7291, pp. 908–911, 2001. [Google Scholar]
33. G. K. Reddy and K. L. Achari, “A non-invasive method for calculating calories burned during exercise using heartbeat,” in Proc. ISCO, Coimbatore, India, IEEE, pp. 1–5, 2015. [Google Scholar]
34. E. Brangan, J. Banks, H. Brant, A. Pullyblank, H. Le Roux et al., “Using the national early warning score (NEWS) outside acute hospital settings: A qualitative study of staff experiences in the west of England,” BMJ, vol. 8, no. 10, pp. 1–8, 2018. [Google Scholar]
35. National Early Warning Score (NEWS“Royal College of Physicians:London, UK,2015. [Online]. Available:http://www.rcplondon.ac.uk/resources/national-early-warning-score-news. (accessed on 5 February 2021). [Google Scholar]
 | This work is licensed under a Creative Commons Attribution 4.0 International License, which permits unrestricted use, distribution, and reproduction in any medium, provided the original work is properly cited. |