DOI:10.32604/csse.2023.024463
| Computer Systems Science & Engineering DOI:10.32604/csse.2023.024463 | |
| Article |
Efficient Grad-Cam-Based Model for COVID-19 Classification and Detection
1Department of Information Technology, College of Computer, Qassim University, Buraydah, Saudi Arabia
2Department of Electrical and Computer Engineering, Air University, Islamabad, Pakistan
3ZR-Tech, 24, Cheadle, Stockport, SK8 3EG, Greater Manchester, United Kingdom
*Corresponding Author: Saleh Albahli. Email: salbahli@qu.edu.sa
Received: 18 October 2021; Accepted: 03 December 2021
Abstract: Corona Virus (COVID-19) is a novel virus that crossed an animal-human barrier and emerged in Wuhan, China. Until now it has affected more than 119 million people. Detection of COVID-19 is a critical task and due to a large number of patients, a shortage of doctors has occurred for its detection. In this paper, a model has been suggested that not only detects the COVID-19 using X-ray and CT-Scan images but also shows the affected areas. Three classes have been defined; COVID-19, normal, and Pneumonia for X-ray images. For CT-Scan images, 2 classes have been defined COVID-19 and non-COVID-19. For classification purposes, pre-trained models like ResNet50, VGG-16, and VGG19 have been used with some tuning. For detecting the affected areas Gradient-weighted Class Activation Mapping (GradCam) has been used. As the X-rays and ct images are taken at different intensities, so the contrast limited adaptive histogram equalization (CLAHE) has been applied to see the effect on the training of the models. As a result of these experiments, we achieved a maximum validation accuracy of 88.10% with a training accuracy of 88.48% for CT-Scan images using the ResNet50 model. While for X-ray images we achieved a maximum validation accuracy of 97.31% with a training accuracy of 95.64% using the VGG16 model.
Keywords: Convolutional neural networks (CNN); COVID-19; pre-trained models; CLAHE; Grad-Cam; X-ray; data augmentation
A virus is derived from a family of Latin words, has the meaning of poison or slimy liquid. It is a microscopic contagious agent compromised of the genetic material which may consist of single-stranded or double-stranded deoxyribonucleic acid (DNA) or ribonucleic acid (RNA) and may be linear or circular, trapped in a capsid, proactive coat made up of protein. They have a unique ability to lock on to the host and multiply inside them of any living organism. This mechanism kills or harms the cells and leaves us ill, and this kind of virus is called the “pandemic virus.” A pandemic is described as a globally occurring disease that crosses international borders and affects a wide range of the population. The pandemic virus has a long history, one of the deadliest influenza pandemics was an outbreak in 1918, which has affected almost 500 million or one-third of the population [1]. After that Asian flu emerged in 1957 which caused almost 1.1 million deaths, then the 1968 pandemic from which it is estimated 1 million deaths was reported globally. After almost 100 years, another most deadly pandemic virus known as Coronavirus (Covid-19) emerged in Wuhan, China in December 2019 [2]. Since World War II, Covid-19 is one of the greatest challenges and major public health crises of our time. Since its emergence, the virus has spread to all continents even in most remote Antarctica. Severe Acute Respiratory Syndrome coronavirus (SARS-CoV-2) is the virus causing the infectious novel coronavirus. It is believed that this virus is originated from birds like bats or animals like raccoon dogs and has the ability to grow and infect humans, therefore rapidly and easily spread among the population [3].
The typical symptoms of the virus are closely like flu such as consistent high fever, frequent dry cough, and difficulty in breathing, lightheadedness, and chest pain. The new signs are loss of taste or smell, body aches, inability to walk or even stand, and Pale, gray, or blue-colored skin, lips, or nail beds [4]. In particular, the disease can be passed from person to person through particles while talking, sneezing, or coughing with an infected person. So, it is considered a direct close contact within 1 meter is the transmission of the virus without protective measures. As the vaccine is not available for the majority part of the world, the world health organization (WHO) recommends such precautions for safety: Prevent close contact with a person having cough and fever, keep washing hands with soap for 20 secs or sanitizing it frequently, cover the mouth with an N-95 mask, don’t touch the eyes, mouth when came back from outside.
After the outbreak, the coronavirus outspread like a fire and become a global pandemic. As of 20 September 2021, the total number of confirmed cases is 228 million of which the number of deaths is 4.69 million worldwide. The overall number of countries affected by COVID-19 is 219 of which currently USA, India, Brazil, United Kingdom, and Russia are the top five most affected countries in which the current cases is 41.71 million, 33.47 million, 21.23 million, 7.42 million, and 7.29 million respectively according to World Health Organization (WHO). The mortality rate in these countries is 667244 in the USA, 590508 in Brazil, 445133 in India, 198996 in Russian, and 135203 in the UK [5].
One of the most crucial steps in combating coronavirus is the effective testing of the patient. The standard and main test for diagnosing coronavirus is real-time reverse transcription-polymerase chain reaction (RRT-PCR) and is performed on a respiratory sample of the affected patient [6]. The issue with the test is that it is a time-consuming process and also expensive [7]. Therefore, the alternative method to overcome this is through medical image processing which includes Chest X-ray and Computed Tomography (CT-scan). In comparison to computed tomography (CT) and magnetic resonance imaging (MRI), a chest X-ray exposes the patient to less radiation, also it is cheap and fast [8]. That is why it is mostly recommended by the specialist, but it requires great knowledge and expertise to make correct diagnoses. Usually, different clinicians or consultants interpret the same picture differently; moreover, the X-ray image is not consistent with time. Also, the virus is spreading rapidly, so the workload on the doctors and experts is vast, so naturally, they are vulnerable to misdiagnosis because of fatigue. All the factors combined motivate new advanced and fast techniques for diagnosing. COVID-19 is indeed one of the toughest eras for the whole world but in medical science, it can be one of the breaking points by applying and developing new and improved digital techniques in detecting many future diseases also. Among these digital techniques, artificial intelligence which uses machine learning and deep learning are not able to assist the experts in detecting and distinguishing affirmative COVID patients from other diseases like pneumonia through X-ray and CT-Scan images. This gives motivation to researchers to develop different techniques for the classification and detection of COVID patients [9]. One of the accurate techniques of deep learning for classification is through pre-trained models.
A pre-trained model is the existing framework used as a starting point instead of building from scratch due to time and computational restrictions to solve similar problems. It can be also used to improve existing models or test-own models against it. The most commonly used pre-trained models for image classifications are Very Deep Convolutional Networks for Large-Scale Image Recognition (VGG-16/19) [10], and ResNet50 [11]. After classification, to detect the affected areas Grad-Cam [12] algorithm is widely used. Grad-Cam, a high-class discriminative localization technique that uses the gradients of any target flowing into the final convolution layer to produce a coarse localization map highlighting the important regions in the image for predicting the concept.
The clinical symptoms of coronavirus are closely related to pneumonia so previously there is a lot of work done in the detection and distinguishment of COVID-19 patients through AI techniques by using chest X-ray images from only one other same disease i.e., pneumonia. However, in this paper, a model has been suggested that not only detects the COVID-19 but also shows the affected areas. According to our knowledge, our work is different from previous works as we are detecting COVID from both X-ray and CT-Scan images. With the burden on the health care system, it is necessary to use all the resources available. This is the reason along with X-ray images, we are also using the CT-Scan images. Furthermore, we are also localizing the COVID-19 in both X-ray and CT-Scan images. The reason for adding the feature of localization using Grad-Cam is that along with detection of COVID-19 it is also important to notice that how much the patient is affected by the disease. This also helps in giving the initial insight that if the patient needs emergency attention. For classification purposes, we have applied different pre-trained models like VGG-16, ResNet-50, and VGG-19 with some tuning and to detect affected areas Grad-Cam has been used. Pre-trained models have been used due to various reasons. The first reason is that pre-trained models can work with less data, the second reason is that pre-trained models use less computational power and resources to train as they already have updated weights to some extent. CLAHE has also been applied to enhance the images as they are taken under different light intensity settings. The contributions of our paper are as follow:
1. We fine-tuned different pre-trained models like VGG-16, ResNet50, and VGG-19 for classification purposes.
2. Analyze the effects of balanced and unbalanced data along with normal and enhanced X-rays and CT-scan images.
3. Localize the affected area through Grad-Cam for X-rays and CT-Scan images of lungs to provide initial insights.
The paper is further characterized into the following sections. In Section 2, the literature review will be discussed in detail. The next Section 3 described the proposed methodology, Section 4 discussed and presents the experimental results of the model. The paper ends with the conclusion.
In 2019, WHO declared a new virus called coronavirus also known as COVID-19, after that to assist the radiologists, experts and doctors, persistent research work was presented in making a quick diagnostic to differentiate positive COVID from Chest X-Ray using Artificial techniques. Currently, Artificial Intelligence techniques have been commonly regarded for addressing a variety of health-related problems and have proven successful in achieving meaningful results.
The pre-trained model has been employed by many researchers for chest disease detection. The reason behind the use of pre-trained models is quite clear as, at the start of the COVID-19 outbreak, the X-ray dataset for COVID-19 patients was scarce. Pre-trained models and data augmentation happened to be best in this type of case. Rahimzadeh et al. [13] proposed an algorithm based on Xception and ResNet-50 models for the classification of coronavirus patients using chest X-ray images. They used 180, 6054, and 8851 images of coronavirus patients, pneumonia patients, and normal people respectively. They attained 99.56% accuracy and 80.5% recall for coronavirus cases. Loey et al. [14] proposed a generative adversarial network (GAN) with three pre-trained models AlexNet, GoogleNet, and Rest-Net18 to identify COVID-19 from chest X-rays. The scheme used the three pre-trained models. The dataset includes four class images, 69 of coronavirus, 79 of pneumonia bacteria, virus, and normal respectively. Using four and two classes, Google Net gave the test accuracy of 80.6% and 99.9% correspondingly while AlexNet, with three classes, gave 85.2 test accuracy.
Apostolopoulos et al. [15] automatically detect the coronavirus patient by extracting the essential features of X-ray images via implementing transfer learning with CNN. For the classification of COVID-19 images, they used five different pre-trained models i.e., VGG19, Inception, MobileNet, Xception, and Inception-ResNetV2. The dataset utilized by them is a total of 1427 images of which 504 are non-COVID images, 224 COVID images, and 700 pneumonia images, and reported an overall accuracy of 97.82%. While through VGG-19 they obtained 93.48% accuracy and 98.75% sensitivity. Abbas et al. [16] used DeTrac deep convolutional neural network for the classification of COVID-19 cases in chest X-ray images. They used 80 samples of normal X-ray and 105 images of COVID with 11 samples of SARS. Using this dataset they obtained 95.15% accuracy, 97.91% sensitivity, and 91.87% specificity.
Ying et al. [21] implemented a modified version of the pre-trained ResNet-50 model called as DRE-Net. They applied multiclass classification and used the dataset of 88 images of COVID patients, 86 of Non-COVID, and 100 of bacterial pneumonia patients and reported an accuracy of 86%. Sethy et al. [19] extracted the features using ImageNet a pre-trained model and to classify it SVM is used as the last layer. For this, they prepared a dataset that contained 127 images of each COVID patient, Non-COVID patient, and pneumonia i.e., a total of 381 samples. For this dataset, the accuracy they obtained by ResNet50 plus SVM is 98.66%. Ucar et al. [17] suggested a COVID 19 architectural detection method using deep X-ray images. The data collection contained 76 COVID-19 case pictures, 4290 Pneumonia case pictures, and 1583 regular case pictures and gained 98.3% accuracy. Kumar et al. [20] suggested a deep learning technique in which nine pre-trained models are used for features extraction and then SVM for classification purposes. There are a total of 158 of both normal and coronavirus images and by this, they obtained 95.38% accuracy via ResNet50 plus SVM. Farooq et al. [18] used the public dataset Covidx which includes only 69 COVID images and proposed a ResNet-based CNN model. They achieved an accuracy of 96.23% from this model. Nayak et al. [22] took eight pre-trained CNN models and suggested an automatic diagnostic of coronavirus patients using chest X-ray images. The dataset contained 203 coronavirus patient chest X-ray images and 203 without coronavirus X-ray images. The highest three accuracies obtained are through AlexNet, ResNet50, and GoogleNet with 99.05%, 98.78%, and 98.62% respectively.
In chest disease detection and localization, GradCam has been employed in many pieces of research. Basu et al. [23] suggested domain extension transfer learning (DETL) with the pre-trained model with some fine-tuning on chest X-ray dataset for classifying between four classes normal, pneumonia, others, and COVID. Accuracy of 90.13% was achieved by performing 5 fold cross-validation. Also, they employed Grad-CAM to localize the COVID-affected areas. In another work, Panwar et al. [24] formed a link between COVID patients and pneumonia patients and used Grad-Cam-based color visualization to detect the affected areas in the chest Xray Images of coronavirus patients. The used dataset consists of combined 673 images of COVID-19 cases along with normal and pneumonia cases. The sensitivity and specificity obtained by this framework are 76.19% and 97.22% respectively.
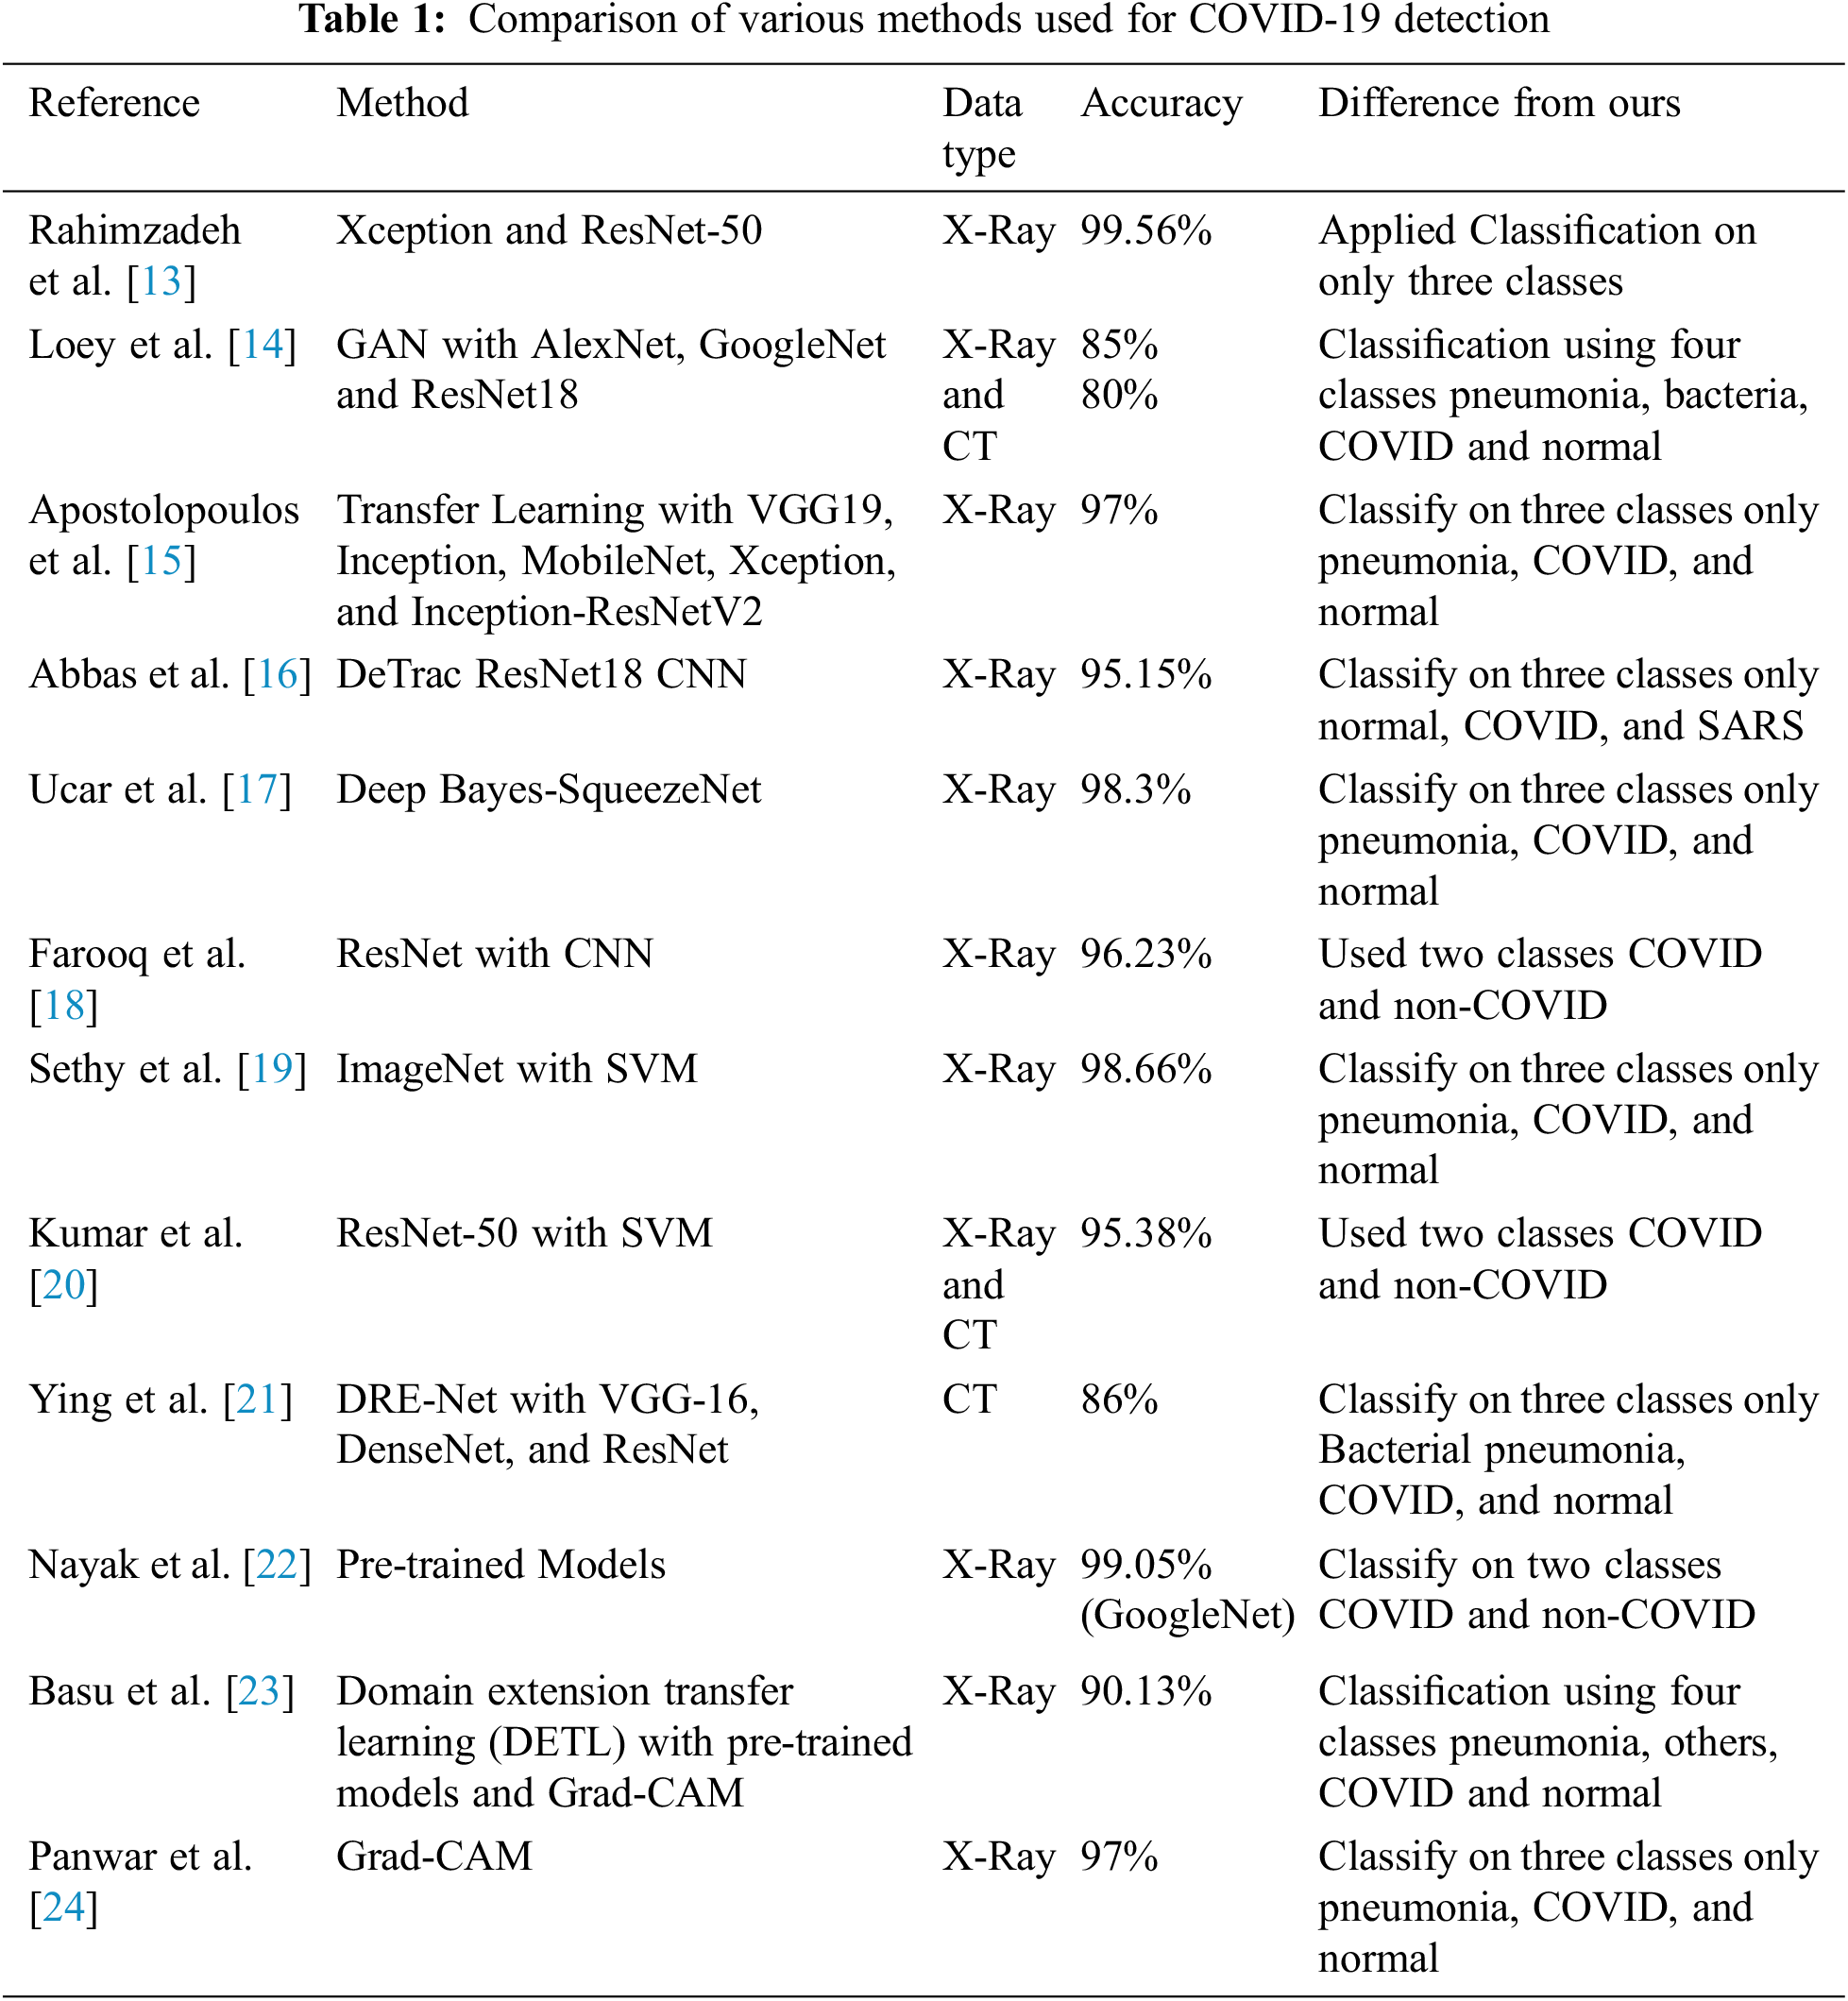
Tab. 1 presents a comparison of previous studies models using radiographic imaging classification for COVID-19 cases, normal cases, and other chest diseases.
The pipeline proposed by us is consists of pre-processing the dataset [25,26], which is then used to train the pre-trained model. After that, the trained model is passed onto the GradCam which then localizes the affected areas in the input X-ray or CT-Scan images. Fig. 1 shows the proposed pipeline in detail.
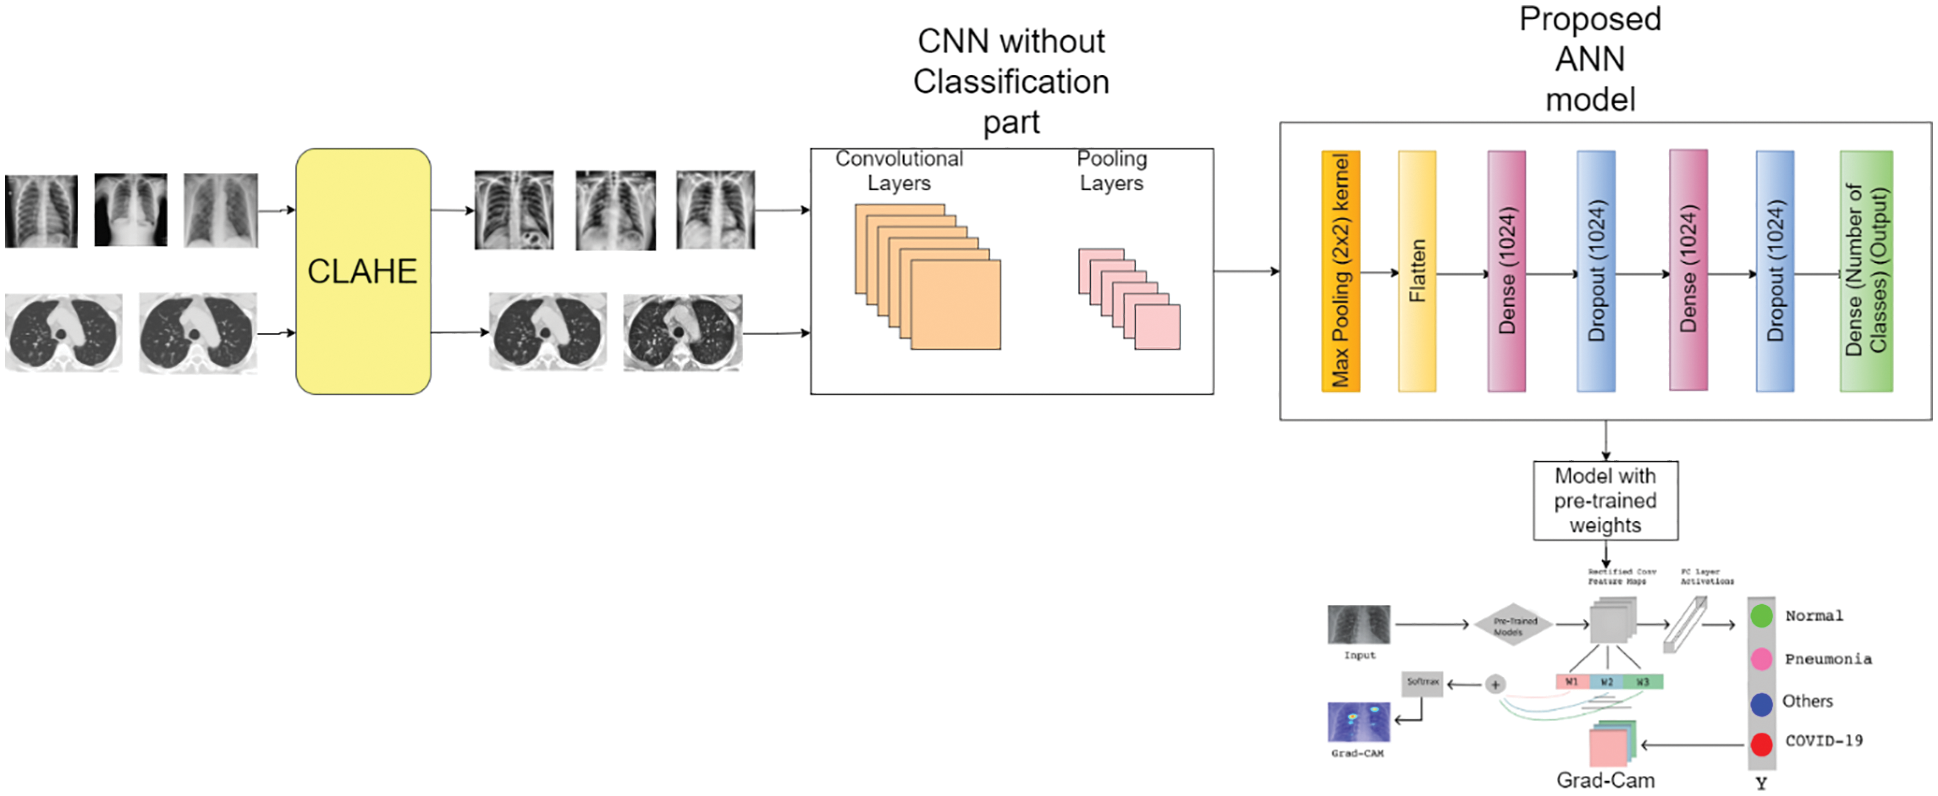
Figure 1: Proposed pipeline of the classification
X-ray and CT images are taken under different lighting conditions, due to which they have different contrast and illumination. Therefore, they need to be adjusted using histogram equalization. So, CLAHE was applied to all the X-ray and CT images. Before feeding the dataset to the classification models, data augmentation was applied to further increase the number of images. In data augmentation images are changed by changing their angle, stretching, and squeezing them. These newly generated images are recognized by the model as new images. Images generated using data augmentation have a rotation angle of 90o and were flipped horizontally and vertically.
The main objective of this study is to classify COVID-19 images using X-ray, and CT-scan images and to localize the affected area in the images. To classify the images pre-trained models were used and fine-tunned. Pre-trained models are previously trained on some dataset and are fine-tuned to train on some other dataset. The advantage of training a pre-trained model is that it requires fewer epochs to train the model. Models used in this paper were pre-trained on the ImageNet dataset which classifies 1000 images i.e., key-board, mouse, and pencil. The following models were used for classification:
RenNet50 was proposed by Microsoft in 2015 [27]. It consists of 50 layers. This convolutional neural network is different from other networks because it used identity map-ping which let the output of some layers pass directly to the input of some other layers.
VGG-16 and VGG-19 were proposed by “Visual Graphic Group” at Oxford University [28]. These networks are pyramidal. Layers closer to the image are wider and a pooling layer after each convolutional layer makes the network narrower as it goes deeper. VGG-16 and VGG-19 consist of 16 and 19 layers respectively.
Xception was proposed by “Google” in 2017 [29]. It consists of three parts; the first part consists of convolutional and max-pooling layers with ReLU as activation function, the second part consists of convolutional layers with ReLU as activation function, and the third part consists of convolutional, max-pooling, and global average pooling layers with ReLU as activation function. In the end, classification is done by fully connected layers of ANN.
InceptionV3 was proposed by “Google” in 2015 [30]. It is a classic CNN with convolutional and pooling layers, the main change is the three inception architectures that are proposed in the paper. In the end, it has softmax and logistic functions for classification.
InceptionResNetV2 was proposed by “Google” in 2016 [31]. It has proposed inception and reduction blocks at the start and in the end, it has a pooling layer and dropout layer to prevent overfitting. It classifies using the softmax function.
DenseNet was proposed in 2017 [32], and the idea behind these networks was that deeper CNN gives better accuracy. They proposed densely connected layers where each layer is connected to every other layer in a feed-forward fashion. Each dense block is separated by transition layers that consist of a convolutional and average pooling layer. In the end, fully connected layers are used along with the softmax function for classification.
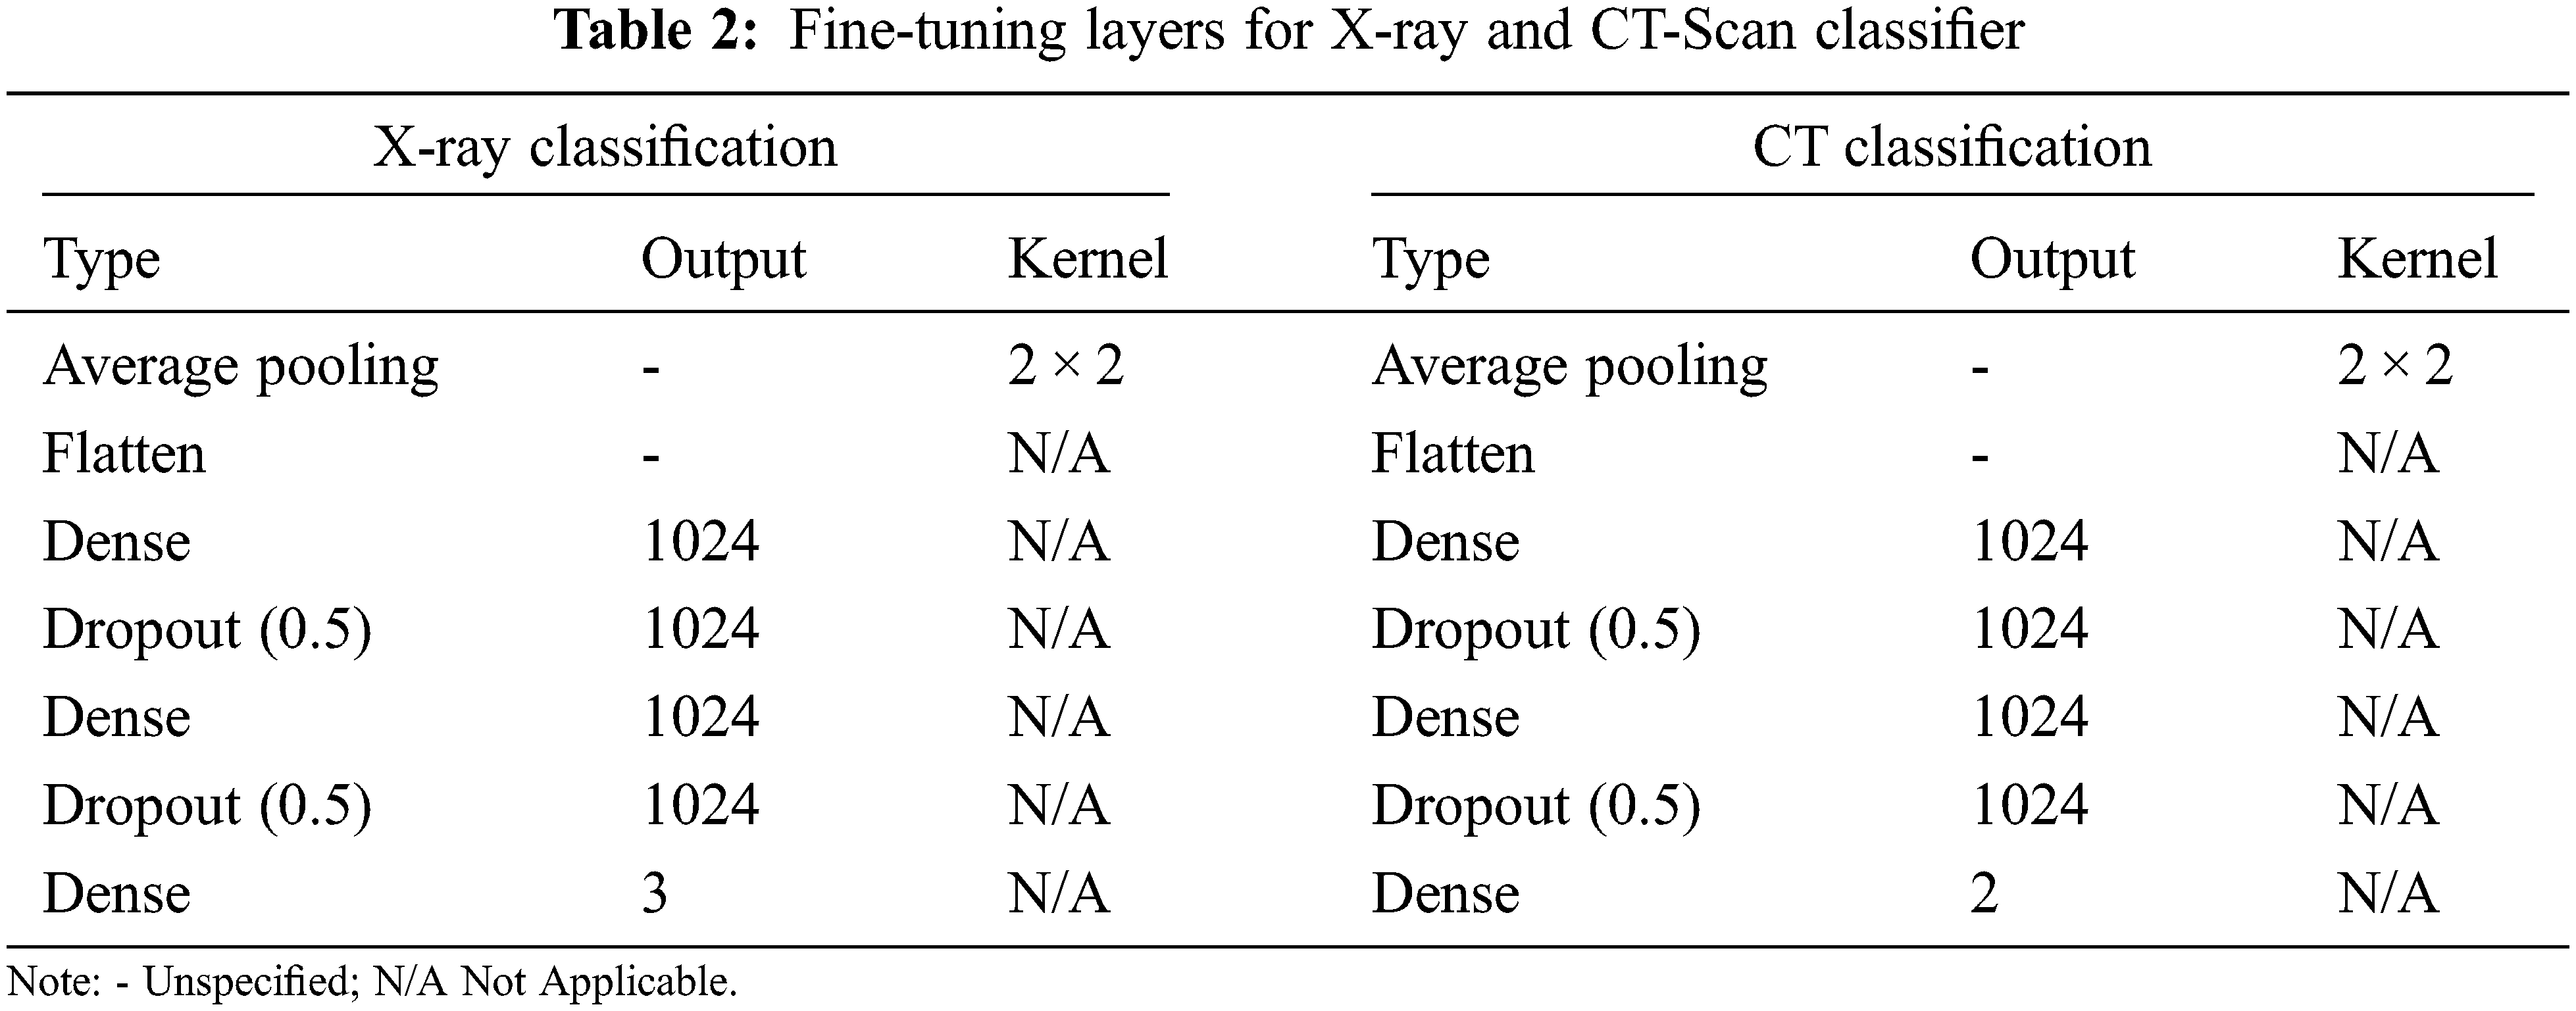
As these models were pre-trained to classify 1000 classes, they were modified to classify 3 classes for X-ray images classification and 2 classes for CT-scan images classification. Tab. 2 shows additional layers added during finetuning. The input image size given to the models was 700 × 700 × 3.
After the classification process, the next objective of our research is to localize the COVID-19 affected area in the chest-ray and CT-scan images. For localization, we use the Gradient Weighted Class Activation Mapping (Grad-Cam) algorithm which offers an overview of deep learning models by creating heat maps (visuals) for every deeply linked neural network and enables to determines more about models while detecting and predicting the respective task. The basic explanatory diagram of Grad-Cam is shown in Fig. 2. We gave a pre-trained model as input to Grad-Cam which first detects the class of dataset, after that its attempts to find the final convolution layers of the pre-trained model by looping over the layers of the network in the reverse order. Moreover, the gradient model generated heatmaps at the affected areas by observing the input and output layers of the pre-trained models and by the softmax function of the output layers.
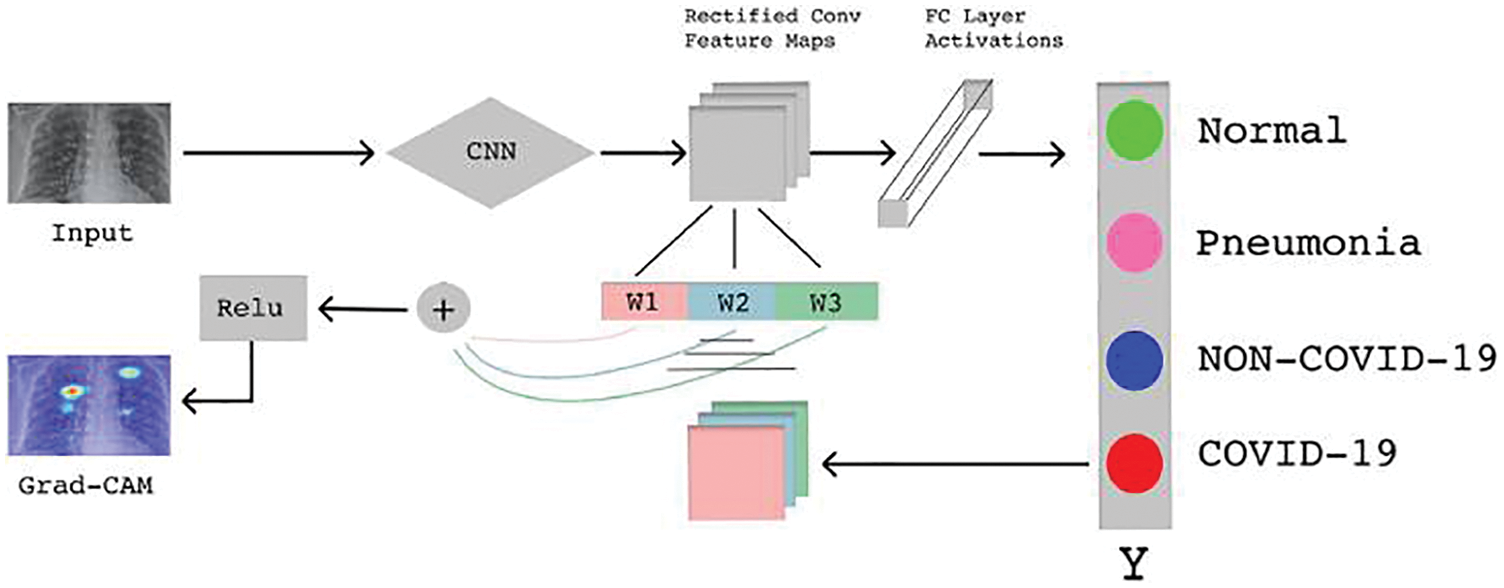
Figure 2: Basic Grad-Cam architecture [24]
4 Experimental Setup and Results
The first step was to pre-process the data and that included applying CLAHE to the acquired X-rays and CT-scan images.
For classification using X-ray images, three classes have been used. Dataset for these 3 classes was acquired from the Kaggle repository of “COVID-19 Radiography Database” [25]. This database consists of normal x-ray images, lungs opacity images, pneumonia images, and COVID-19 images. These images came from different sources which can be found at the competition link.
For the classification of CT-scan images, two classes have been used. Dataset for these 2 classes was collected from the Kaggle repository of “SARS-COV-2 Ct-Scan Dataset” [26]. This database consists of COVID and non-COVID images. This database consists of COVID and non-COVID images.
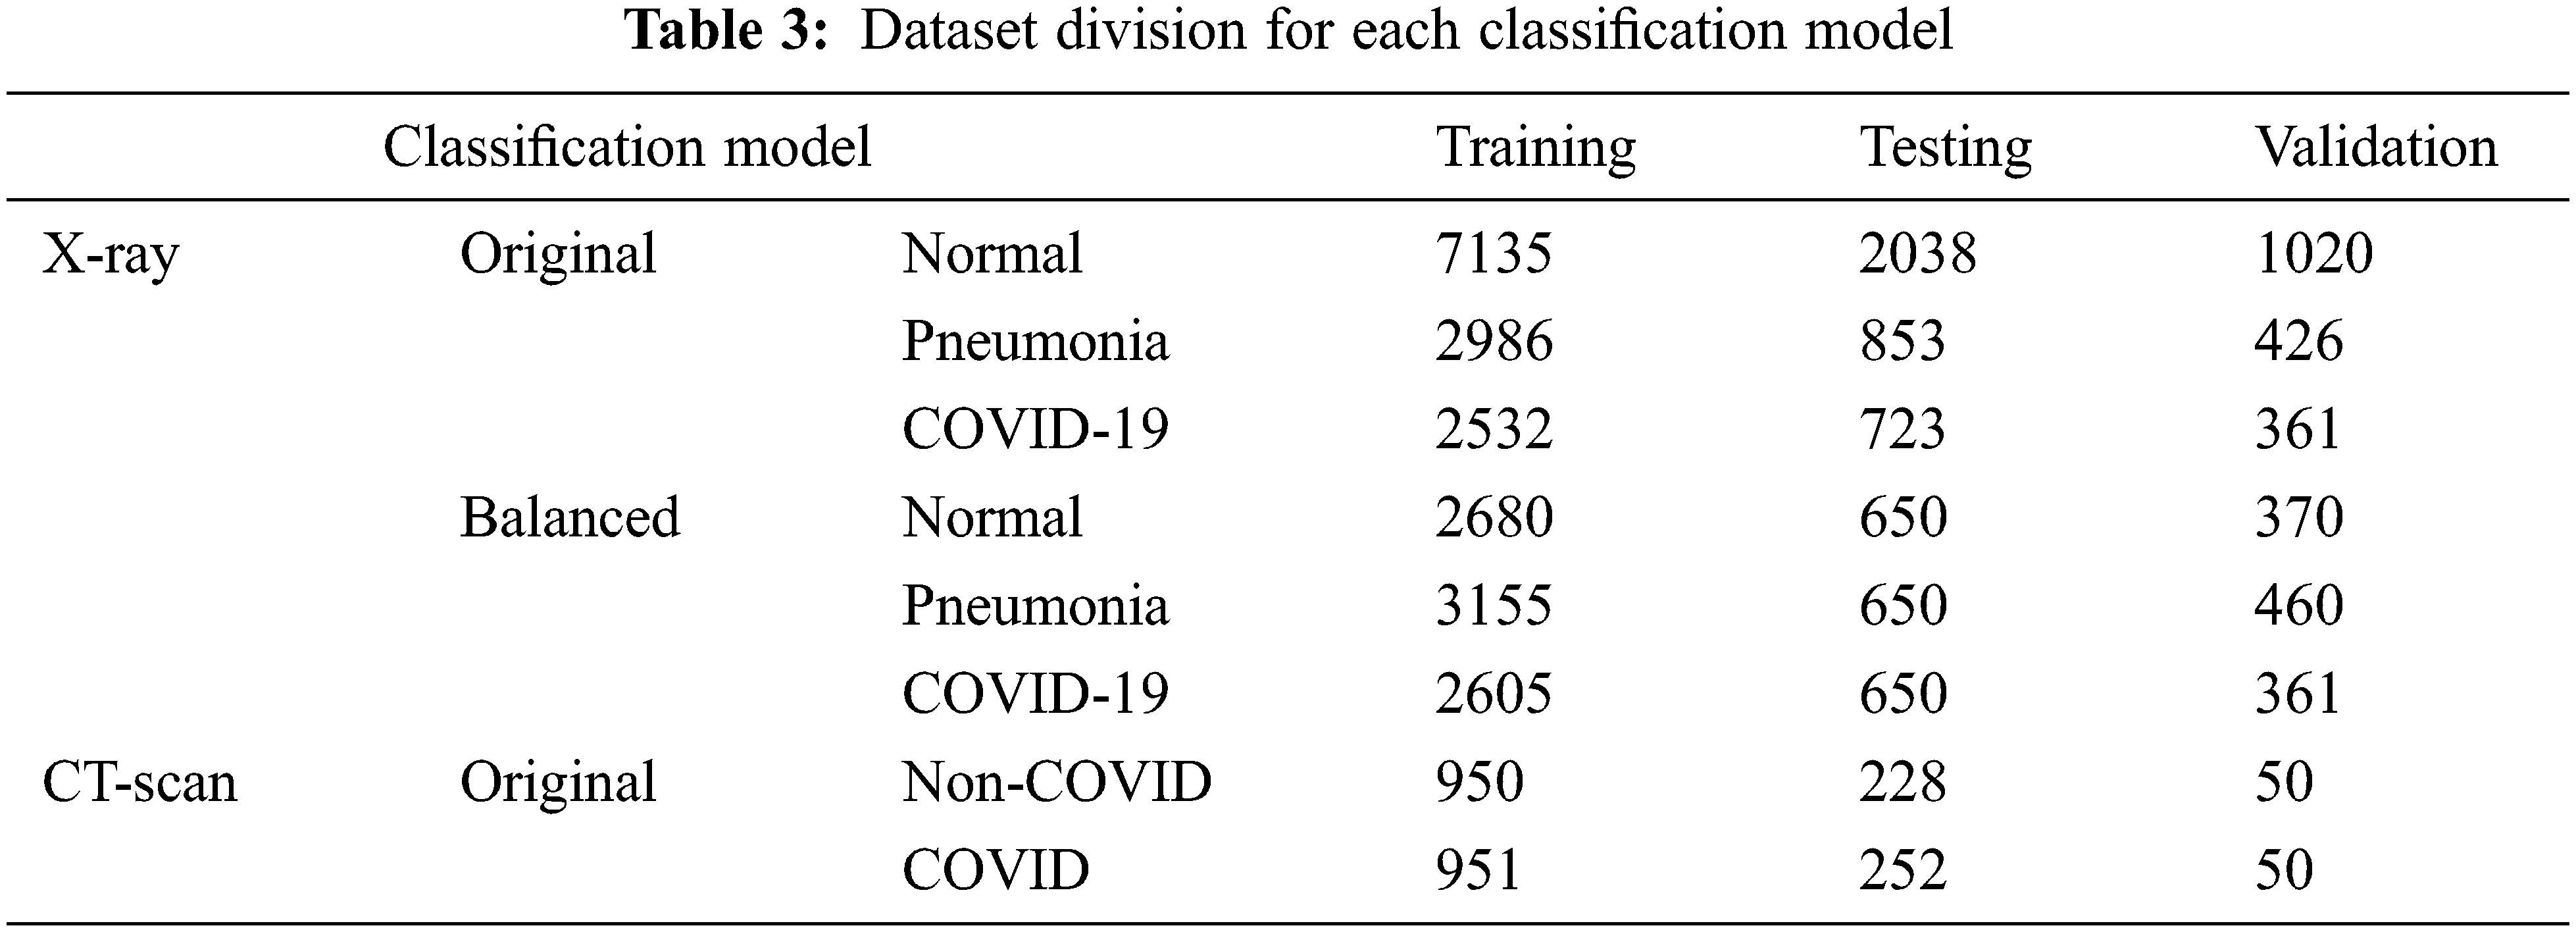
Dataset for each classification problem was divided into three parts, training, testing, and validation. Data was divided into 70%, 20%, and 10% for training, testing, and validation respectively. Furthermore, for X-ray classification dataset was used in their original numbers and balanced state. In the balanced state, the number of images used for each class was almost the same. The CT-scan dataset was already in a balanced state so there was no need for further division.
So, in total models were trained on 4 different datasets; original, balanced, original with CLAHE, balanced with CLAHE.
Tab. 3 shows the division of images of each class for both classification problems along with when data is balanced and not balanced.
In the first stage, images were cleaned using CLAHE, and augmentation was applied. Fig. 3 shows images before and after applying CLAHE, while Fig. 4 shows images generated via data augmentation.
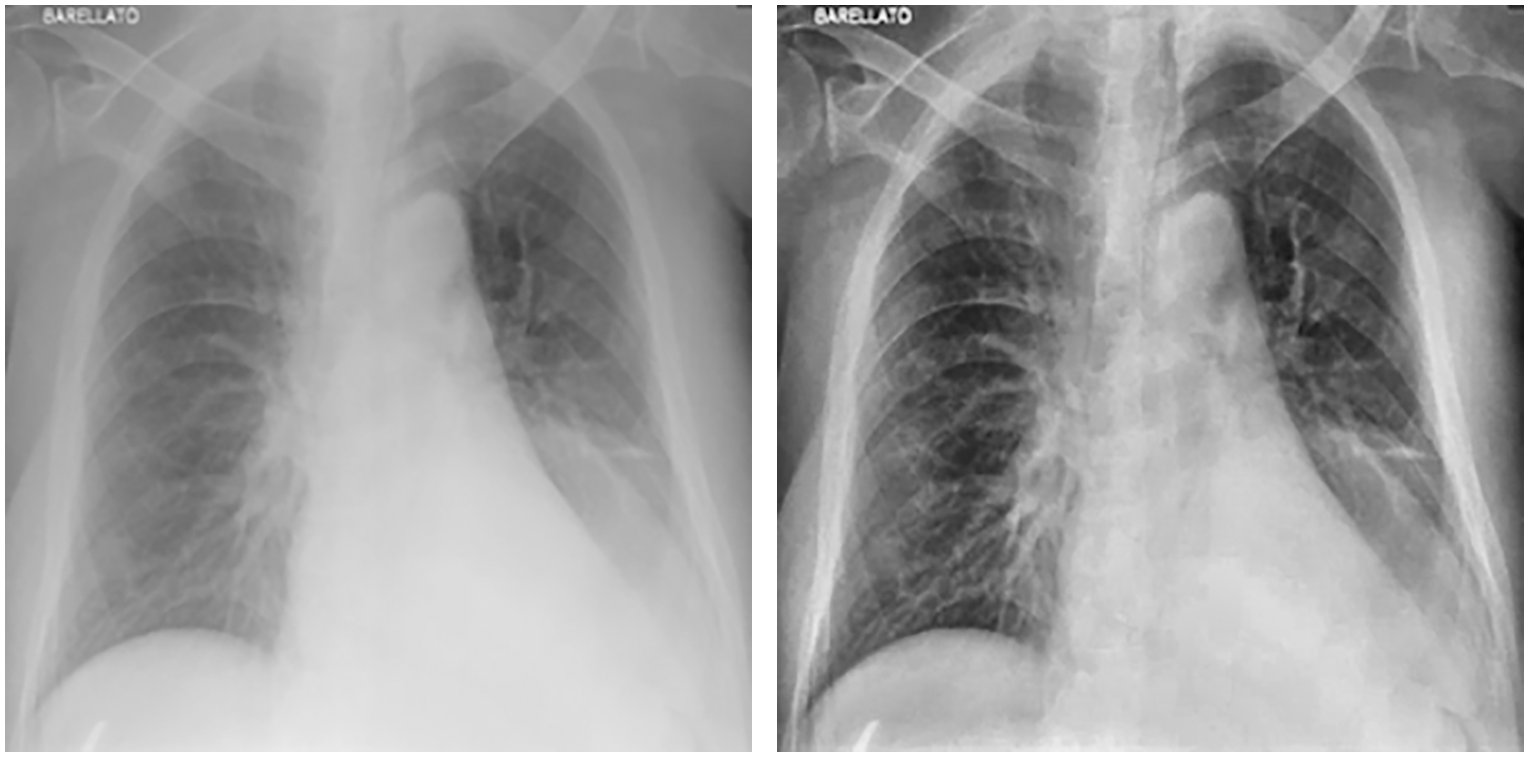
Figure 3: Chest X-ray before (left) and after (right) applying CLAHE
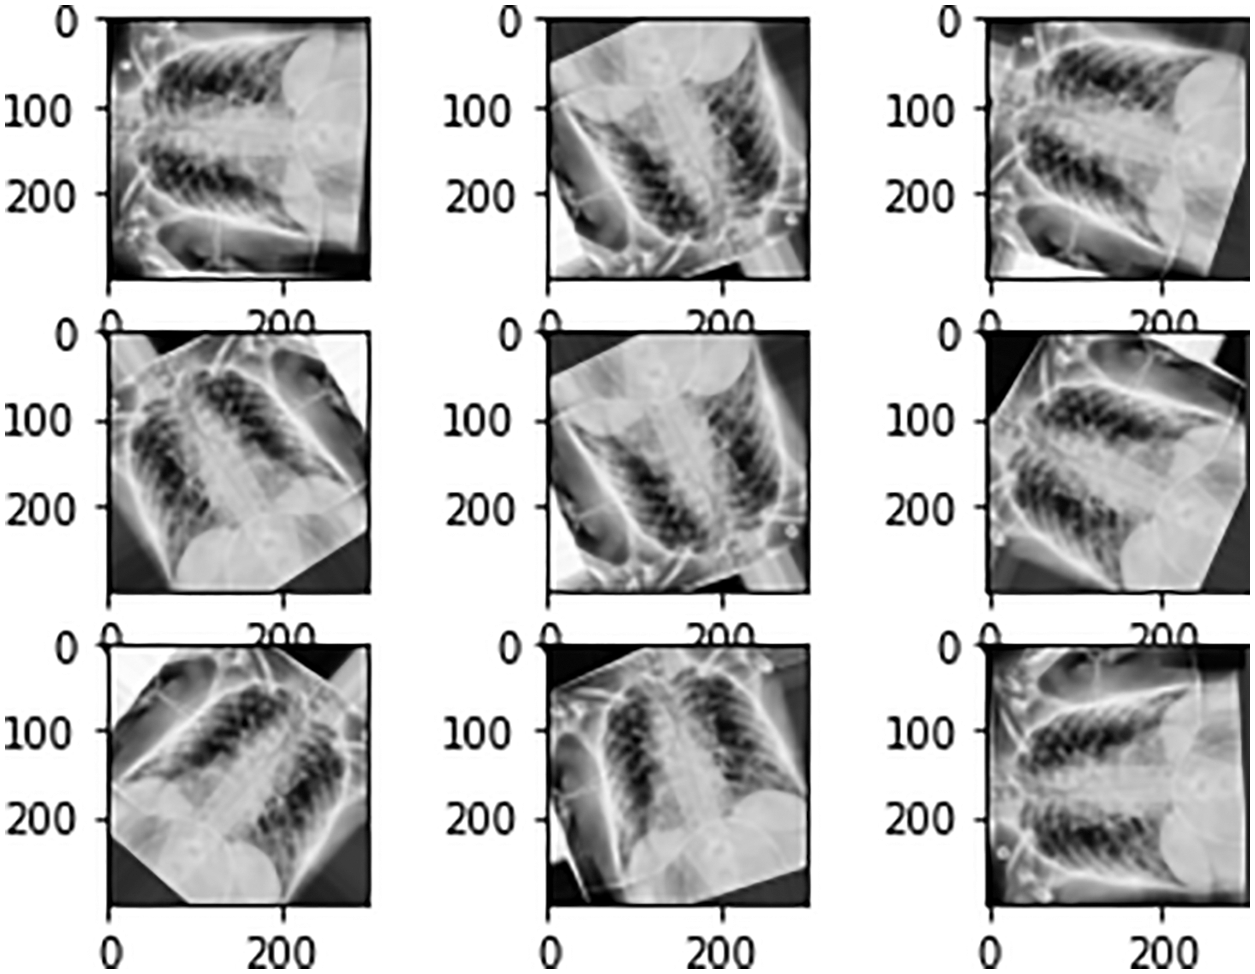
Figure 4: Image augmentation by horizontal and vertical flip with 90° rotation range
After applying CLAHE and image augmentation, 4 different datasets were obtained for x-ray images; original, balanced, original and enhanced, and balanced and enhanced. For CT-scan images two datasets were formed; original, and CLAHE. Results for models trained on CT-Scan images are shown in Tab. 4, and for x-ray images, results are shown in Tab. 5. The tables also show the training, testing, and validation accuracy and loss. Each model was trained for 10 epochs with a batch size of 8. It is clear from the tables that the accuracy for Xception, InceptionV3, and InceptionResNetV2 is low for each kind of dataset. It doesn’t matter if the dataset is original, enhanced, or balanced, these 3 models performed really low. The accuracy provided by DenseNet121 was relatively high but was not up to the mark when compared to the accuracy given in the literature.
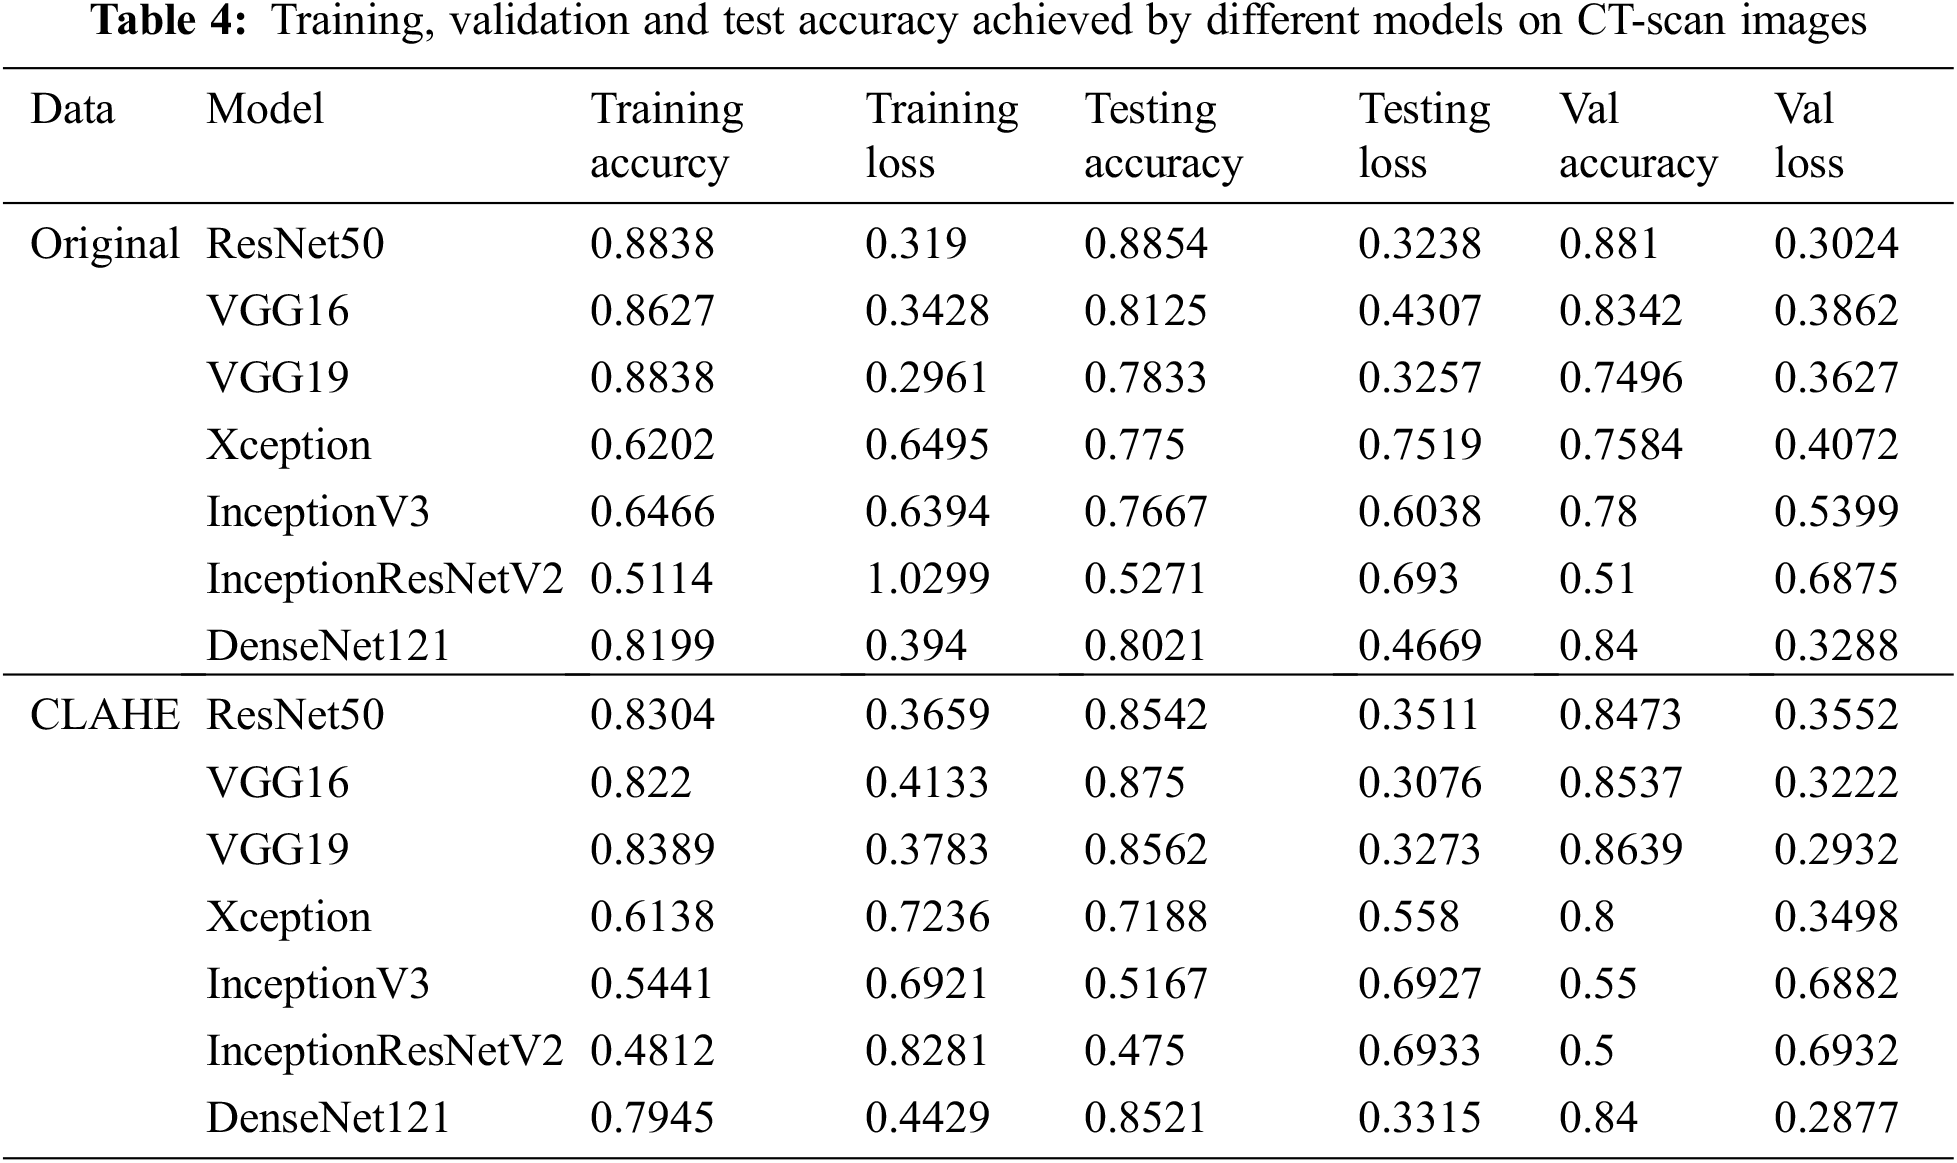
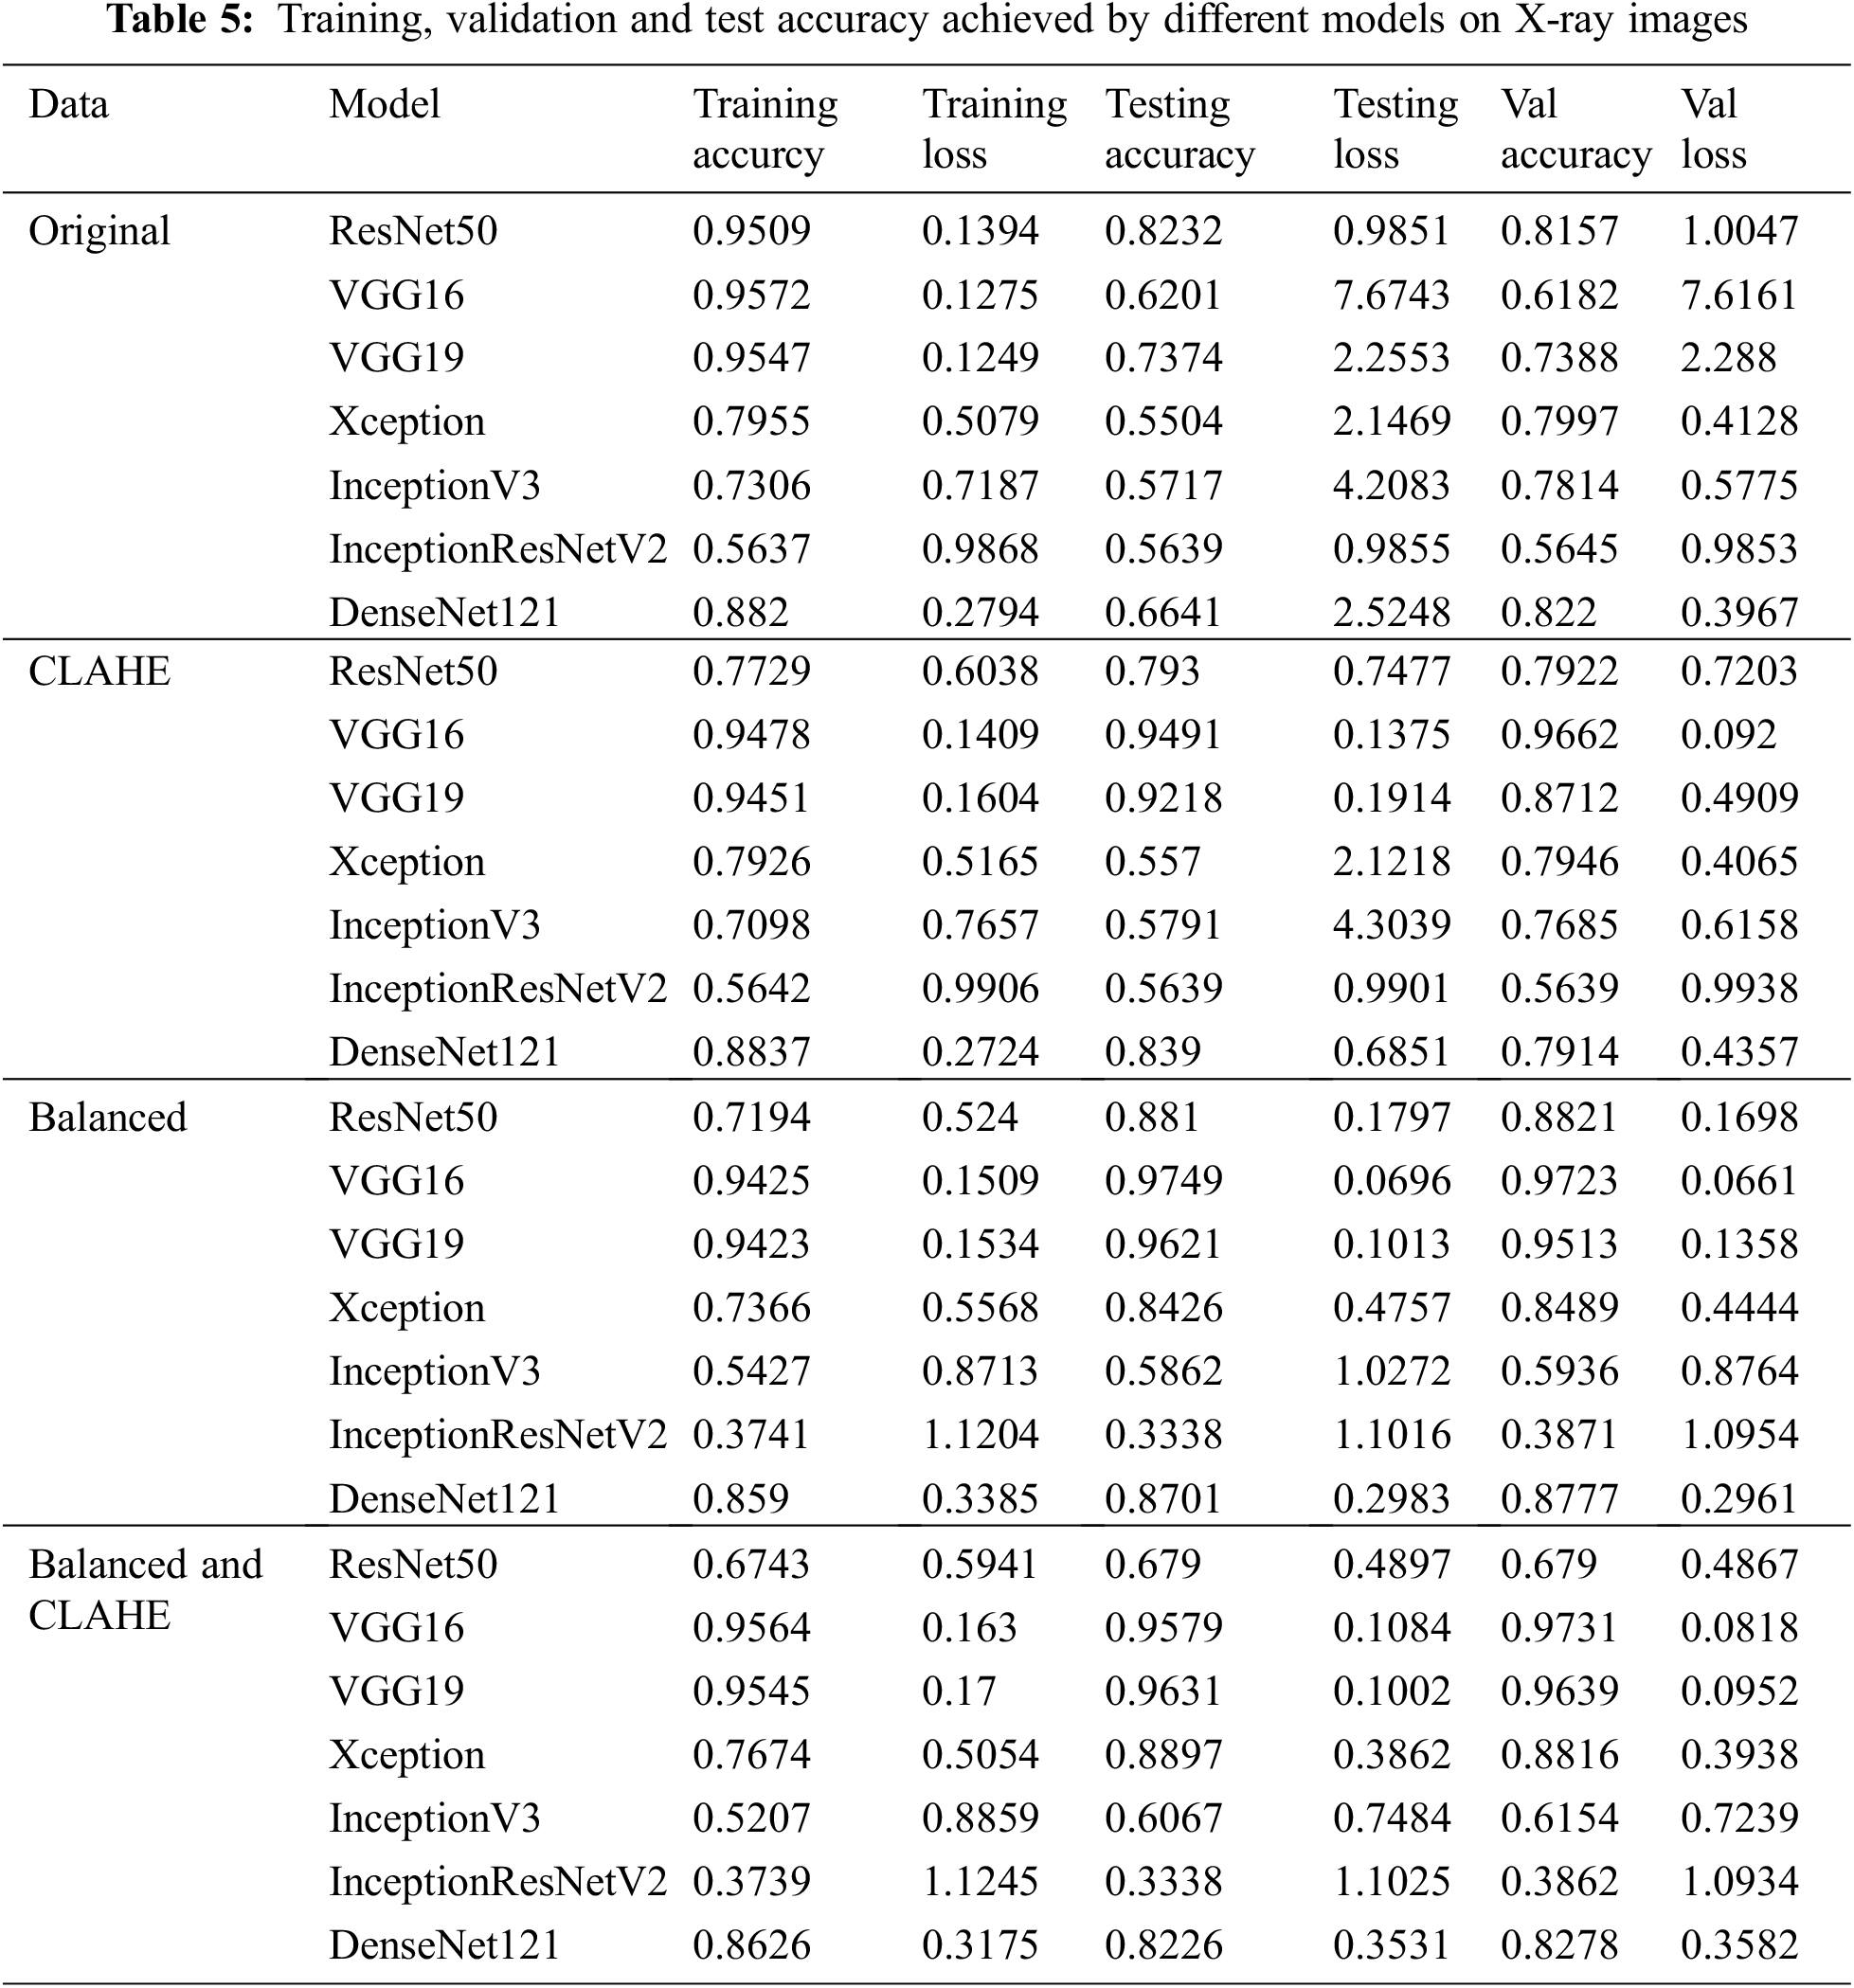
Models that performed better than all the other models were ResNet50, VGG16, and VGG19. For CT-Scan images of lungs, on the original dataset ResNet50 gave the highest accuracy of 88.1% validation dataset. When compared to the literature [14,21], this accuracy is an improvement. Even when the validation accuracy decreases to 86.39% for VGG19 in the case of enhanced CT-scan images.
For X-ray images, ResNet50 gave the best accuracy for the original unbalanced dataset. While for all the other datasets VGG16 gave the best performance, although VGG16 showed overfitting for the original unbalanced dataset. Results were also according to what was expected. CLAHE helped in boosting the validation accuracy from 81.57% to 96.62%. Balancing the dataset also boosted the validation accuracy up to 97.23%. Applying CLAHE on a balanced dataset did not increase the accuracy by a notable amount and the maxi-mum validation accuracy achieved was 97.31%. When compared to the literature this pipeline gave the competing ac-curacy. Although it did not surpass the accuracy achieved by [13,20,22], our pipeline is based on pre-trained models that consume less time and resources. Also, our models were only trained for 10 epochs.
In the end, each trained model is used to localize the disease-affected areas using the Grad-Cam algorithm. Fig. 5 shows the covid affected areas for best performing models. It can be seen from the images that the model trained on the original dataset highlighted the affected area more accurately than the model trained on enhanced images. This is also evident from high accuracy in the case of original images. Fig. 6 shows the covid and pneumonia affected areas for best performing models. It can be seen that the higher the accuracy, the more accurate the localization becomes. Localization also gets affected depending upon the resolution of the image. Right now, the resolution used is 700 × 700. If we decrease this resolution, the localization becomes vaguer but if we increase the resolution the localization becomes sharper.
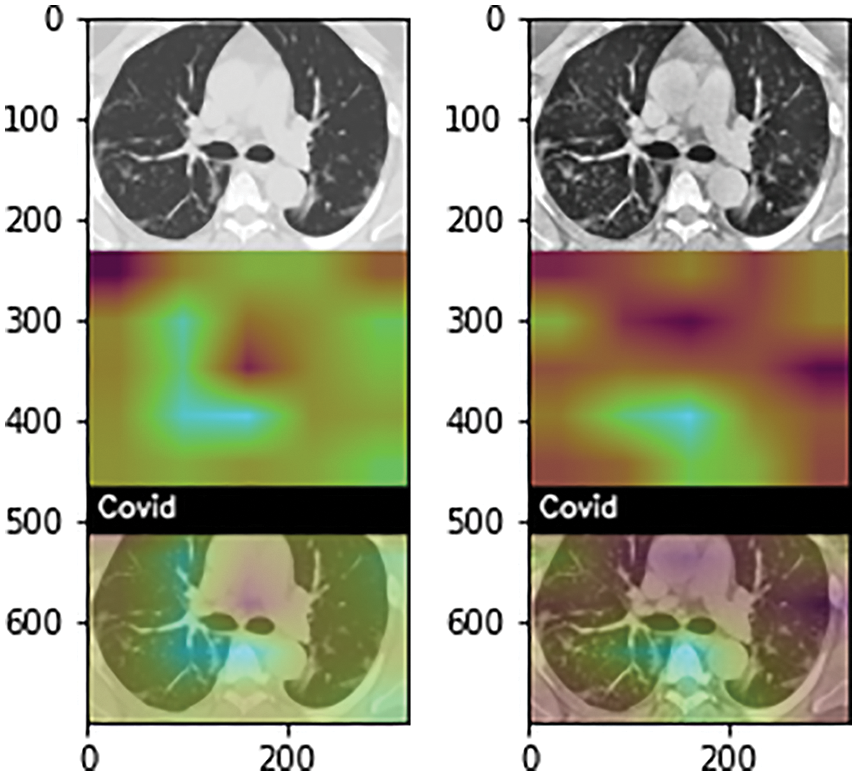
Figure 5: Heatmap of COVID-19 affected areas for original (left) and CLAHE enhanced (right) CT-Scan images
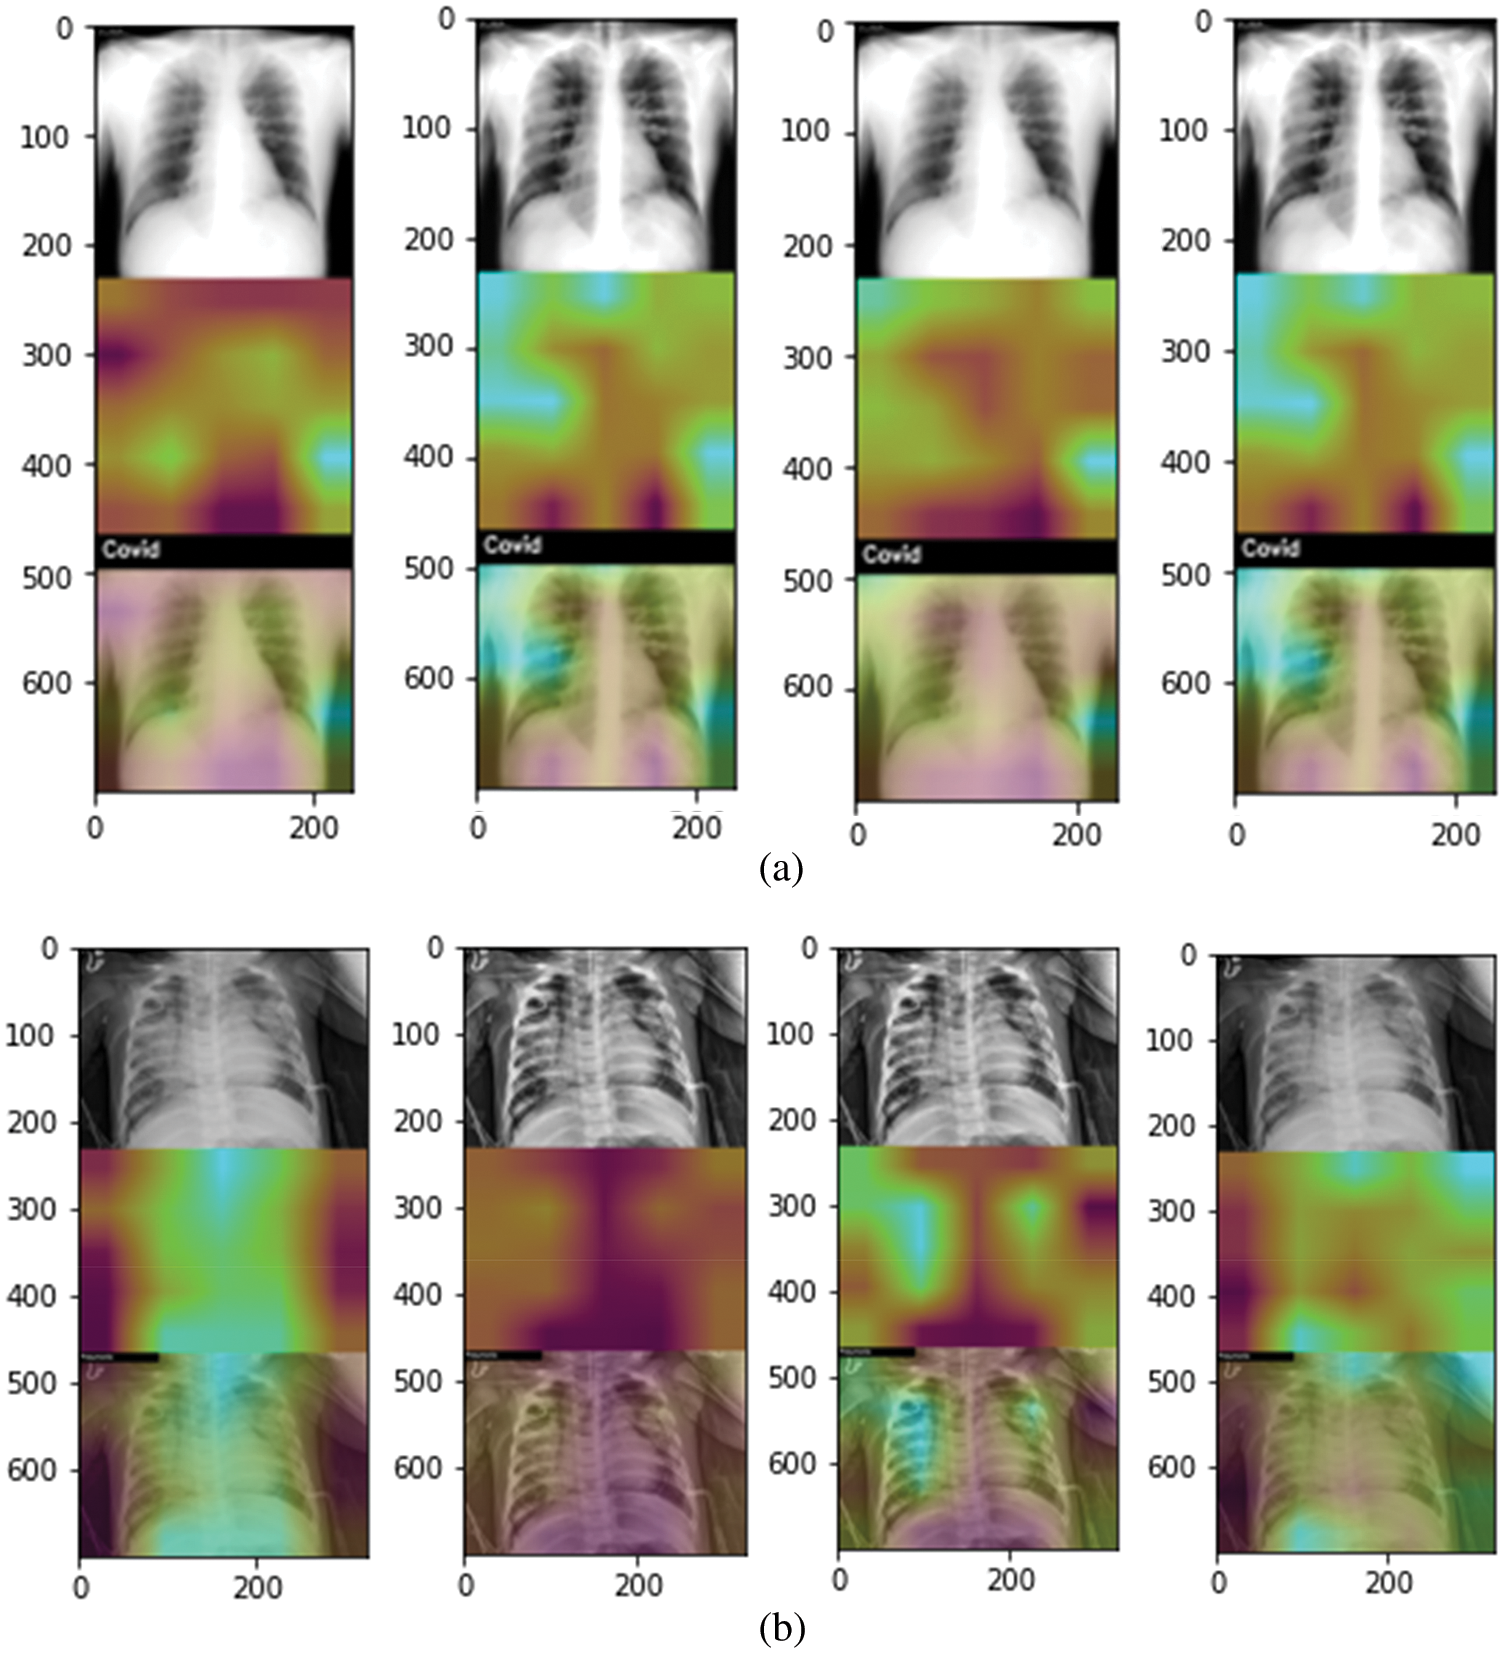
Figure 6: Grad-Cam heat plots of COVID and Pneumonia affected areas for best performing model (highlighted in Tabs. 4 and 5). (a) Heatmap of COVID-affected area using Grad-Cam best performing models with original (left), enhanced (mid-left), balanced (mid-right), and balanced enhanced (right) (b) Heatmap of Pneumonia-affected area using Grad-Cam best performing models with original (left), enhanced (mid-left), balanced (mid-right), and balanced enhanced (right)
When looking at the models in the literature many models have performed very well in the classification of chest X-ray diseases. When comparing with the models that classify the CT-Scan images Loey et al. [14] achieved 80% accuracy and Ying et al. [21] achieved 86% accuracy. While our model achieved 88.1% accuracy on the original dataset with the ResNet50 model. When comparing on basis of X-ray images, the most similar experiment to our experiment are by Apostolopoulos et al. [15] with 97% accuracy, Ucar et al. [17] with 98.3%, Sethy et al. [19] with 98.66%, Panwar et al. [24] with 97% as they also classify three classes that are pneumonia, normal and COVID-19. While maximum accuracy achieved by us is 97.31% on the cleaned and balanced dataset using the VGG-16 model. Our model did not surpass the models present in the literature but it gives a competitive accuracy. It can be said that our research is a better version of researches in the literature as it also classifies CT-scan images along with localizing the disease. Loey et al. [14] also worked on classification using both CT and X-ray images, it achieved accuracies of 80% and 85% for CT-Scan and X-ray images respectively. The experiments done by them do not achieve the accuracy that we achieved.
It would not be wrong to say that COVID-19 has brought the healthcare system to its knees due to an overwhelming number of patients and fewer doctors to diagnose them. This paper gave an architecture to relieve the burden of the doctors by diagnosing the patient using X-rays and CT-Scan, not only that our model helps in localizing the affected areas and thus highlighting the severity of the disease. Our proposed technique relieves the burden of the healthcare system as it helps the hospitals use all the resources available i.e., CT-Scan along with X-ray. Furthermore, our system localizes the affected areas and also shows how much area is affected by the disease, thus providing initial insights on the condition of the patient. Pretrained models were used and the best model turned out to be ResNet50 which gave 88.48% training and 88.1% validation accuracy for CT-Scan images on the original dataset. For X-ray images, VGG16 gave the best results for the balanced and enhanced dataset with a training accuracy of 95.64% and validation accuracy of 97.31%. In the end, to check the severity of the disease and to see how the model is predicting grad-cam has been used. Our models give accuracy as good as many other models that have been built and it also detects the affected areas which makes it better.
Acknowledgement: The researchers would like to thank the Deanship of Scientific Research, Qassim University for funding the publication of this project.
Funding Statement: The authors received no specific funding for this study.
Conflicts of Interest: The authors declare that they have no conflicts of interest to report regarding the present study.
1. T. M. Tumpey, A. García-Sastre, J. K. Taubenberger, P. Palese, D. E. Swayne et al., “Pathogenicity of influenza viruses with genes from the 1918 pandemic virus: Functional roles of alveolar macrophages and neutrophils in limiting virus replication and mortality in mice,” Journal of Virology, vol. 79, no. 23, pp. 14933–14944, 2019. [Google Scholar]
2. World Health Organization, “Covid-19 situation report,” World Health Organization, vol. 31, no. 2, pp. 61–66, 2020. [Google Scholar]
3. H. A. Rothan and S. N. Byrareddy, “The epidemiology and pathogenesis of coronavirus disease (COVID-19) outbreak,” Journal of Autoimmunity, vol. 109, no. February, pp. 102433, 2020. [Google Scholar]
4. C. C. Lai, T. P. Shih, W. C. Ko, H. J. Tang and P. R. Hsueh, “Severe acute respiratory syndrome coronavirus 2 (SARS-CoV-2) and coronavirus disease-2019 (COVID-19The epidemic and the challenges,” International Journal of Antimicrobial Agents, vol. 55, no. 3, pp. 105924, 2020. [Online]. [Google Scholar]
5. World Health Meter, https://www.worldometers.info/coronavirus/, 2021. [Google Scholar]
6. T. Ai, Z. Yang, H. Hou, C. Zhan, C. Chen et al., “Correlation of chest CT and RT-PCR testing in coronavirus disease 2019 (COVID-19) in China,” Radiology, vol. 96, pp. E32–E40, 2019. [Google Scholar]
7. S. A. Lauer, K. H. Grantz, Q. Bi, F. K. Jones, Q. Zheng et al., “The incubation period of coronavirus disease 2019 (CoVID-19) from publicly reported confirmed cases: Estimation and application,” Annals of Internal Medicine, vol. 172, no. 9, pp. 577–582, 2020. [Google Scholar]
8. H. Shi, X. Han, N. Jiang, Y. Cao, O. Alwalid et al., “Radiological findings from 81 patients with COVID-19 pneumonia in Wuhan, China: A descriptive study,” The Lancet Infectious Diseases, vol. 20, no. 4, pp. 425–434, 2020. [Google Scholar]
9. S. Albahli, “A deep neural network to distinguish covid-19 from other chest diseases using x-ray images,” Current Medical Imaging, vol. 17, no. 1, pp. 109–119, 2021. [Google Scholar]
10. K. Simonyan and A. Zisserman, “Very deep convolutional networks for large-scale image recognition,” in 3rd Int. Conf. on Learning Representations, ICLR 2015-Conf. Track Proc., San Diego, CA, USA, pp. 1–14, 2015. [Google Scholar]
11. K. He, X. Zhang, S. Ren and J. Sun, “Deep residual learning for image recognition,” in Proc. of the IEEE Computer Society Conf. on Computer Vision and Pattern Recognition, Las Vegas, NV, USA, vol. 20, no. December, pp. 770–778, 2016. [Google Scholar]
12. R. R. Selvaraju, A. Das, R. Vedantam, M. Cogswell, D. Parikh et al., “Grad-CAM: Why did you say that?,” arXiv, vol. abs/1611.07450, pp. 1–4, 2016. [Online]. Available: http://arxiv.org/abs/1611.07450. [Google Scholar]
13. M. Rahimzadeh and A. Attar, “A new modified deep convolutional neural network for detecting covid-19 from X-ray images,” arXiv, 2020. [Google Scholar]
14. M. Loey, F. Smarandache and N. E. M. Khalifa, “Within the lack of chest covid-19 x-ray dataset: A novel detection model based on GAN and deep transfer learning,” Symmetry, vol. 12, no. 4, pp. 651–662, 2020. [Google Scholar]
15. I. D. Apostolopoulos and T. A. Mpesiana, “Covid-19: Automatic detection from X-ray images utilizing transfer learning with convolutional neural networks,” Physical and Engineering Sciences in Medicine, vol. 43, no. 2, pp. 635–640, 2020. [Google Scholar]
16. A. Abbas, M. M. Abdelsamea and M. M. Gaber, “Classification of COVID-19 in chest X-ray images using DeTraC deep convolutional neural network,” Applied Intelligence, vol. 51, no. 2, pp. 854–864, 2020. [Google Scholar]
17. F. Ucar and D. Korkmaz, “COVIDiagnosis-Net: Deep Bayes-SqueezeNet based diagnosis of the coronavirus disease 2019 (COVID-19) from X-ray images,” Medical Hypotheses, vol. 140, no. April, pp. 109761, 2020. [Google Scholar]
18. A. Farooq, S. Anwar, M. Awais and S. Rehman, “A deep CNN based multi-class classification of Alzheimer’s disease using MRI,” in Proc. IEEE Int. Conf. on Imaging Systems and Techniques, Beijing, China, vol. xs2018-January, pp. 1–6, 2017. [Google Scholar]
19. P. K. Sethy, S. K. Behera, P. K. Ratha and P. Biswas, “Detection of coronavirus disease (COVID-19) based on deep features and support vector machine,” International Journal of Mathematical Engineering and Management Sciences, vol. 5, no. 4, pp. 643–651, 2020. [Google Scholar]
20. R. Kumar, R. Arora, V. Bansal, V. J. Sahayasheela, H. Buckchash et al., “Accurate prediction of COVID-19 using chest X-ray images through deep feature learning model with SMOTE and machine learning classifiers,” medRxiv, vol. 140, no. April, pp. 1–10, 2020. [Google Scholar]
21. S. Ying, S. Zheng, L. Li, X. Zhang, X. Zhang et al., “Deep learning enables accurate diagnosis of novel coronavirus (covid-19) with CT images,” IEEE/ACM Transactions on Computational Biology and Bioinformatics, vol. 90, no. 3, pp. 990–999, 2021. [Google Scholar]
22. S. R. Nayak, D. R. Nayak, U. Sinha, V. Arora and R. B. Pachori, “Application of deep learning techniques for detection of covid-19 cases using chest x-ray images: A comprehensive study,” Biomedical Signal Processing and Control, vol. 64, pp. 102365, 2021. [Google Scholar]
23. S. Basu, S. Mitra and N. Saha, “Deep learning for screening COVID-19 using chest X-ray images,” in Proc. IEEE Symp. Series on Computational Intelligence, SSCI 2020, Canberra, Australia, no. Ml, pp. 2521–2527, 2020. [Google Scholar]
24. H. Panwar, P. K. Gupta, M. K. Siddiqui, R. Morales-Menendez, P. Bhardwaj et al., “A deep learning and grad-CAM based color visualization approach for fast detection of COVID-19 cases using chest X-ray and CT-scan images,” Chaos, Solitons and Fractals, vol. 140, pp. 110190, 2020. [Google Scholar]
25. M. E. Chowdhury, R. Tawsifur, A. Khandakar, R. Mazhar, A. Muhammad et al., “Can AI help in screening viral and COVID-19 pneumonia?,” IEEE Access, vol. 8, no. 2, pp. 132665–132676, 2020. [Google Scholar]
26. A. Plamen and E. A. Almeida, “SARS-CoV-2 CT-scan dataset: A large dataset of real patients CT scans for SARS-CoV-2 identification,” MedRxiv, vol. 130, no. 2, pp. 185–194, 2020. [Google Scholar]
27. K. He, X. Zhang, S. Ren and J. Sun, “Deep residual learning for image recognition,” in Proc. of the IEEE Conf. on Computer Vision and Pattern Recognition, Las Vegas, NV, USA, pp. 770–778, 2016. [Google Scholar]
28. K. Simonyan and A. Zisserman, “Very deep convolutional networks for large-scale image recognition,” in Proc. of the 3rd Int. Conf. on Learning Representations, San Diego, CA, USA, pp. 142–161, 2018. [Google Scholar]
29. F. Chollet, “Xception: Deep learning with depth wise separable convolutions,” in Proc. of the IEEE Conf. on Computer Vision and Pattern Recognition, Honolulu, HI, USA, pp. 1251–1258, 2017. [Google Scholar]
30. S. Albahli, N. Ayub and M. Shiraz, “Coronavirus disease (COVID-19) detection using X-ray images and enhanced DenseNet,” Applied Soft Computing, vol. 110, pp. 107645, 2021. [Google Scholar]
31. C. Szegedy, S. Ioffe, V. Vanhoucke and A. A. Alemi, “Inception-v4, inception-resnet and the impact of residual connections on learning,” in Thirty-first AAAI Conf. on Artificial Intelligence, San Francisco, California, USA, pp. 4278–4284, 2017. [Google Scholar]
32. G. Huang, Z. Liu, L. Van Der Maaten and K. Q. Weinberger, “Densely connected convolutional networks,” in Proc. of the IEEE Conf. on Computer Vision and Pattern Recognition, Honolulu, HI, USA, pp. 4700–4708, 2017. [Google Scholar]
 | This work is licensed under a Creative Commons Attribution 4.0 International License, which permits unrestricted use, distribution, and reproduction in any medium, provided the original work is properly cited. |