DOI:10.32604/csse.2023.026712
| Computer Systems Science & Engineering DOI:10.32604/csse.2023.026712 | |
| Article |
Anomaly Detection for Industrial Internet of Things Cyberattacks
College of Computing and Information Technology, University of Tabuk, Tabuk, 71491, Saudi Arabia
*Corresponding Author: Rehab Alanazi. Email: 421009273@stu.ut.edu.sa
Received: 03 January 2022; Accepted: 30 March 2022
Abstract: The evolution of the Internet of Things (IoT) has empowered modern industries with the capability to implement large-scale IoT ecosystems, such as the Industrial Internet of Things (IIoT). The IIoT is vulnerable to a diverse range of cyberattacks that can be exploited by intruders and cause substantial reputational and financial harm to organizations. To preserve the confidentiality, integrity, and availability of IIoT networks, an anomaly-based intrusion detection system (IDS) can be used to provide secure, reliable, and efficient IIoT ecosystems. In this paper, we propose an anomaly-based IDS for IIoT networks as an effective security solution to efficiently and effectively overcome several IIoT cyberattacks. The proposed anomaly-based IDS is divided into three phases: pre-processing, feature selection, and classification. In the pre-processing phase, data cleaning and normalization are performed. In the feature selection phase, the candidates’ feature vectors are computed using two feature reduction techniques, minimum redundancy maximum relevance and neighborhood components analysis. For the final step, the modeling phase, the following classifiers are used to perform the classification: support vector machine, decision tree, k-nearest neighbors, and linear discriminant analysis. The proposed work uses a new data-driven IIoT data set called X-IIoTID. The experimental evaluation demonstrates our proposed model achieved a high accuracy rate of 99.58%, a sensitivity rate of 99.59%, a specificity rate of 99.58%, and a low false positive rate of 0.4%.
Keywords: Anomaly detection; anomaly-based IDS; Industrial Internet of Things (IIoT); IoT; industrial control systems (ICSs); X-IIoTID
The Internet of Things (IoT) has been deployed and integrated into several critical sectors, including transportation, health care, energy, and agriculture. The IoT is a promising technology that connects multiple devices over wireless communication technologies to send and receive data without human intervention. The IoT paradigm shifts traditional systems into smart, cost-effective, and scalable systems. As such, technology has been involved extensively in the industrial and manufacturing sectors, which has led to the Industrial Internet of Things (IIoT). The IIoT applications in the industrial domain are highly sensitive and critical, such as industrial control systems (ICSs), which integrate both hardware and software to monitor and control the operation of systems and their related components in industrial environments [1]. Examples of technologies that use ICSs in the IIoT are supervisory control and data acquisition (SCADA), programmable logic controllers, and human–machine interfaces [2,3].
Although the IIoT has improved operational efficiency, productivity, and cost optimization, cybersecurity risks remain a significant challenge that threaten critical smart systems in IIoT environments [4–6]. Critical infrastructures are vulnerable to a wide range of cyberattacks, which have a significant economic impact on organizations and service providers. Cyberattacks such as distributed denial of service cause the service to be unavailable for its intended clients [7]. The dictionary is another common attack against remote access services; it is used to crack a password in a dictionary or word list, which allows attackers to hijack the system remotely [8]. The man-in-the-middle attack aims to exploit the communication between two endpoints by intercepting and eavesdropping on the traffic on legitimate nodes [9]. Reportedly, multiple power stations in Ukraine were compromised in the most recent attack on IIoT applications, which resulted in a power outage affecting approximately 225,000 clients [10]. An attacker obtained access to SCADA systems and shut down the power. Another cyberattack occurred when several European energy companies suffered from an SFG malware [11].
To maintain the confidentiality, integrity, and availability of data transmitted in IIoT environments, an intrusion detection system (IDS) can be used as an effective security solution to mitigate cyberattacks. The IDS can monitor, detect, and mitigate any fraudulent or suspicious behavior that has the potential to disrupt IIoT networks. IDSs can be classified into two main categories [12]: signature-based and anomaly-based IDSs. The signature-based IDS detects an attack based on the predetermined attack pattern (a signature), which then is stored as a list of indicators of compromise (IoCs). When an attack matches a signature in the IoCs, it is classified as a threat, and appropriate action will be taken to eliminate such an attack. The signature-based technique has several limitations. For example, such a technique fails to detect unknown attacks (zero attacks), and the signature list must be updated to include new attack patterns. As a result, the computation resources of such a real-time detection system increase. Moreover, it requires human experts to analyze, create, and update signature rules when including new attack signatures to the signature list. To overcome these drawbacks, an anomaly-based IDS addresses several limitations in the signature-based technique. An anomaly-based IDS is a powerful security tool because it can detect both known and unknown attacks. Such a technique learns from normal user behavior to establish a typical user profile, and it observes anomalies when the incoming traffic differs from normal user patterns. Although an anomaly-based IDS is considered a better alternative than a signature-based technique, it has a high false–positive rate [13].
With the rapid growth of smart technology use, Artificial Intelligence (AI) plays a vital role in the development of smart systems. Machine learning techniques have been used a wide range of critical sectors. Specifically, integrated machine learning techniques are integral to IDS [14–16]. Learning algorithms train the system on normal and attack behavior to build the learning parameter model used to predict attacks successfully. Machine learning techniques provide efficient, flexible, automated detection approaches that can overcome various cybersecurity issues. Traditional IDS methods have been designed and implemented using different techniques such as statistical and rule-based techniques [17]. Many of these approaches, however, are prone to increasing the false positive rate by misclassifying normal and abnormal traffic. Furthermore, because traditional IDS techniques are designed for dedicated or traditional networking environments, less effort has been put into developing anomaly-based IDS for IIoT applications.
In this paper, we propose an intelligent anomaly-based IDS to overcome a diverse range of IIoT cyber threats. Because data features play a vital role in predicting and mitigating cyberattacks, we use different feature selection methods, such as minimum redundancy maximum relevance (MRMR) and neighborhood components analysis (NCA), to demonstrate the most effective feature selection technique for reducing data dimensionality, improving computational resources, and increasing detection performance. For anomaly classification, we employ multiple machine learning classifiers such as decision tree (DT), K-nearest neighbor (KNN), support vector machine (SVM), and linear discriminant analysis (LDA) to identify whether traffic flow is normal or an attack. We evaluate and validate the proposed work using the most recent available data set for the IIoT: the X-IIoTID, which contains new IIoT connectivity protocols, recent device activities, and diverse attack scenarios and protocols. We perform a comparison between the proposed work and other machine learning techniques and recent proposed studies. The proposed work demonstrates its efficacy in detecting several IIoT cyberattacks with a high accuracy rate and low false–positive rate.
The reminder of this research is organized as follows. Section 2 presents the related works of this study. The proposed anomaly detection method is discussed in Section 3. The evaluation performance of the proposed anomaly detection method is presented in Section 4. Section 5 concludes the research with a summary of the original contributions and future work.
A number of related works have been proposed for anomaly-based IDS in the IoT/IIoT networks. Muna et al. [17] proposed anomaly-based IDS for ICSs using deep learning techniques. The detection architecture included a deep auto-encoder and a deep feed-forward network model for detecting anomalies in IIoT environments. The evaluation results showed that the proposed work is effective; however, the dataset used is not specific to the IIoT domain. A study by [18] presented a novel ML security model in IoT networks. Their model has a monitoring agent and a reacted agent which utilizes ML models separated into the analysis of network patterns, and the IDS. They have evaluated the model using real-smart building scenario by using SVM method. Their developed approach achieved an overall accuracy in detection anomalies with 99.71%. A study by [19] proposed an IDS for IIoT implemented for feature selection using genetic algorithm. Their model includes several classification techniques such as linear regression, NB, DT, ET, Extreme Gradient Boosting (EGB), and RF. The GA-RF obtained 10 data features in the context of binary classification, and 7 data features for multiclass classification. They used UNSW-NB15 for the assessment the effectiveness and the robustness of their model. However, they achieved 87.61% overall accuracy for the binary modeling process, the experimental results were acceptable compared to the existing IDS models. Another study by [20] proposed a novel IDS using Tree-CNN hierarchical method associated with SRS activation function. Their approach reduced the computation time for the training time model. In addition, the model is developed in a medium-sized firm, analyzing the level of complexity of the proposed model aimed at performance evaluation. The outcome of their model showed that the developed hierarchical model reduced the execution and achieved an overall accuracy rate of 0.98. Ludwig [21] proposed an ensemble technique for anomaly detection using deep learning techniques. The proposed method achieved a higher accuracy rate but with increased false alarm. Awotunde et al. [22] proposed intrusion detection for IIoT networks using feedforward neural network model. The proposed mechanism achieved a good accuracy rate; however, the dataset used is not specified for the IIoT domain. Moreover, [23] developed a novel anomaly-based IDS or IoT networks. They used a convolutional NN approach to create a multi-class classification method. Then they implemented their model using convolutional NN in 1D, 2D, and 3D. Their model has been evaluated by using different intrusion detection datasets. They used the transfer learning to perform binary and multi-class classification by a convolutional NN multiclass pre-trained approach. Their developed classification model achieved high accuracy, F1 score, precision, and recall compared to the existing models. However, ML methods are used for implementing a high-level of security capabilities in IDSs [24]. Furthermore, the previous research is based on KDD-CUP99 or NSL-KDD datasets. The newly cyberattacks cannot be found in these datasets. That’s why, they formulated a real dataset named ToN-IoT in which it obtained from a large scale of IoT networks. Authors has validated different ML techniques in order to perform binary and multiclass classification. They utilized the Chi-square (Chi2) technique as a feature selection method and the Synthetic Minority Oversampling Technique (SMOTE) for class balancing. They found that, the XGBoost approach obtained better performance results compared to other ML algorithms. Alanazi et al. [25] proposed a detection method for identifying anomalies in IoT environments. For feature selection, the proposed method employed a variety of machine learning algorithms, as well as an ensemble learning technique for traffic classification. The performance results demonstrated the efficacy of the proposed method. The literature has identified several limitations. For instance, using customized datasets rather than real-time IIoT traffic may have an impact on the detection performance. Another issue is that outdated datasets are limited to specific types of cyberattacks and cannot identify modern attack scenarios. Furthermore, many traditional anomaly-based IDS do not use an appropriate intrusion dataset for IIoT environments, such a suitable dataset which reflects the heterogeneous, homogeneous, and pervasive nature of IIoT networks is highly suggested to securely design an effective, efficient, and reliable IIoT ecosystems. While some of the related work achieved promises performance results; however, reduced false alarm rate remains a major concern.
Fig. 1 depicts the proposed anomaly-based IDS for the IIoT, which is divided into three phases: pre-processing, feature selection, and classification. In the pre-processing phase, data cleaning, missing values compensation, and normalization are performed. In the feature selection phase, the candidates’ feature vectors are computed using two feature reduction techniques, MRMR and NCA. For the final step, the modeling phase, the following classifiers are used to perform the classification: SVM, DT, KNN, and LDA. We illustrate the three phases of the proposed anomaly detection system in the following subsection.

Figure 1: The architecture of proposed anomaly-based IDS for IIoT
Data cleaning, missing values compensation, and normalization are the most critical aspects of the pre-processing stage. The steps taken during this phase are threefold. The first is replacing the missing data using the mean value of that feature if the data type was numeric; the missing value must be replaced with the mode value if the data were nominal. The second is encoding the categorical values into integer values. The third is converting numeric values into a new integer values range between 0 and 1. The normalization step is done using the min–max algorithm, which can be defined as follows [26]:
where
The feature selection phase is critical for the modeling and classification phase. The selected features play an important role in reducing the dimensionality of large data sets, improving detection performance, and reducing prediction time. Our proposed anomaly detection employs different feature selection models to nominate the best distinctive features and remove the useless ones to detect cyberattacks effectively with a high detection rate and a reduced false–positive rate. We use two feature selection techniques: MRMR and NCA. Each feature selection technique independently selects the best features based on their criteria; the optimal feature set from each feature selection method is entered into the different classifiers in the classification phase to predict whether the given traffic flow is normal or an attack. We provide a detailed explanation of the feature selection methods in the following subsections.
3.2.1 Neighborhood Components Analysis
NCA is a learning technique that maximizes a stochastic variant of the leave-one-out KNN score on such a training data set. It also can learn a linear transformation to enhance the classification performance of a stochastic nearest neighbors rule in the transformed domain [27]. The classification model’s output is nonparametric, with no assumptions about the structure of the class distributions or their boundaries. Considering multiclass classification problems with a training data set that contains n observations:
In which xi ∈ ℝp indicates the feature instances, and yi ∈ {1, 2,…,c} indicates the labels of a class, and c is represented as the number of classes. The main objective is to learn a method of classification f: ℝp→ {1, 2,…,c} which receives a feature instance and performs a decision f(x) for the true label y of x.
Considering a randomized method that Ref(x) is chosen at random from S as the reference point for x, labeling x with the label of the reference point’s Ref (x).
Such a method is similar to nearest neighbor approach in which the reference point is selected to be the nearest neighbor of a new point x. In the case of NCA, the reference point is selected randomly, in addition, all points in S have some probability of they are choosen as a reference point [28]. The likelihood P(Ref(x) = xj|S) that point xj is chosen from S as the reference point for x is greater if xj is nearer to x as evaluated by the distance equation dw [29].
and
and
Because a reference point of x is picked from S, the sum of P(Ref(x) = xj|S) for all j must be 1.
The randomized classifier’s average leave-one-out probability of classification model is presented in Eq. (7).
The purpose of NCA is to achieve maximum F(w) in relation to w [30].
In which λ indicates the regularization variables. Many of the weights in w are set to zero by the regularization term.s
After selecting the kernel variable σ in pij as 1, discovering the weight vector w can be formulated in Eq. (9).
where
consider that:
When adds a constant to an objective function, such a minimum argument will not change. As a result, the objective function can be expressed in Eq. (12) after including the constant 1 [30].
and the loss function can be expressed as:
The minimum argument is a weight vector which reduces such a prediction error.
3.2.2 Minimum Redundancy Maximum Relevance
MRMR [31] is used to find the “minimal–optimal” set of features. MRMR requires the user to choose only one option by indicating how many features they want to keep [32]. MRMR is an iterative process that determines the optimal features based on rules. The selected features are added to the optimal feature list. When a feature is added to the list, it never comes out. The score is determined for every feature to be assessed at each iterative process
The classification phase is the third phase of our proposed anomaly system, which aims to perform the classification process for different normal and attack scenarios by using several classifying techniques. The modeling phase receives the best selected features from each feature selection method and feeds them into several classifier models, such as DT, KNN, SVM, and LDA. We discuss each classifier in the following subsections.
3.3.1 Anomaly Detection Model Based on Decision Tree
DT is a type of supervised learning method that is used widely for classification and prediction. In simple terms, DT follows a top-down approach and consists of three main elements: root node, which represents the decision; branches that develop from the root, which represent different options; and leaf nodes, which indicate possible outcomes. When these elements are combined, they resemble a tree [33] (see Fig. 2).
The Gini index is an indicator of sample disparity. It has a value of 0 when a sample is totally homogeneous, and all components are similar and a value of 1 when there is the most inequality among the items.

Figure 2: Anomaly detection framework based on descision tree
3.3.2 Anomaly Detection Model Based on K-Nearest Neighbor
The KNN algorithm is classified as supervised learning and is used to solve classification problems. KNN estimates the likelihood that input points from a given training set will belong to one of two groups based on which data points are closest to it. The KNN uses a voting mechanism to predict the class of new cases. The majority votes of its KNNs will identify the data point’s class [34,35]. Fig. 3 presents the anomaly detection framework based on k-nearest neighbor. The first step in implementing KNN is to transform data points into numerical values (vectors). The classifier works by computing the distance between these points’ values. The Euclidean distance is simply the shortest distance between two points, regardless of their dimensions. The Euclidean distance is the most commonly used method for calculating the distance between two points. The distance between two point values with coordinates (x, y) and (a, b) is expressed by the following equation.
KNN predicts a given data point by searching the nearest annotated points and assigns the class to given data points based on the class with the most data points among the K neighbors. Following the computation of the distance, the class with the highest probability is assigned to the given input data point x.

Figure 3: Anomaly detection framework based on k-nearest neighbor
3.3.3 Anomaly Detection Model Based on Support Vector Machine
SVM is a supervised ML model that can be used to solve a two-class classification problem, such as whether a given traffic flow is normal or an attack. The SVM algorithm implements learning by providing a collection of samples for each category. Each data item in SVM can be seen as a point in an n-dimensional space, where n is the number of attributes that can be obtained. To perform the classification step, the algorithm should define a hyperplane that discriminates between the two classes [36] (see Fig. 4). The two-dimensional line that divides the hyperplane can be called the classifier’s decision line, which separates the two classes; each class is placed on a different location. The classification data can be represented as a single point in space, with each point defined by a feature vector x.
Now that we have visually represented the points, the next step is to differentiate them with a line called a decision boundary. The decision boundary is the major task of such a technique used to classify points. The hyperplane formula divides the points for classification and can be written as [37]:
Where b denotes the hyperplane equation’s intercept and bias term. The hyperplane would always be D-1 operator in D-dimensional space. When fitting the separating boundary, we need a line that can split the data points as well as possible with the fewest misclassification errors. The margin of any hyperplane, ax + by + c = 0 from the input of data points (x0, y0) is provided by d. Accordingly, the margin of the hyperplane formula, wTΦ(x) + b = 0, from a given vector Φ(x0) is represented as:
where ||w||2 indicates the Euclidean norm, and the length of w is shown in Eq. (21).

Figure 4: Anomaly detection framework based on support vector machine
3.3.4 Anomaly Detection Model Based on Linear Discriminant Analysis
The LDA is a supervised technique used to solve classification problems. Such a supervised method is used when the class frequencies are unequal, and its performance assessed using randomly generated testing data set. In any given data set, this LDA technique maximizes the ratio of class variance into within-class variance, ensuring maximum separation and reducing data variation within a class [38] (see Fig. 5). The LDA technique computes the prior probabilities of a class

Figure 5: Anomaly detection framework based on linear discriminant analysis
The evaluation results were obtained using Matlab2018b software to create the proposed model and machine learning libraries to assist the model in loading, extracting features, classifying the data, and obtaining results. The experiments were carried out on an Intel core i7-1165G7 processor with 16 GB of RAM and the Microsoft Windows 10 OS. Several terms are commonly used to describe accuracy, specificity, sensitivity, and f1-score. They are true positive (TP), true negative (TN), false negative (FN), and false-positive (FP). If the attack exists in a system and the model correctly predicts the attack, it is considered a true positive. Similarly, if a system has been shown to be free of an attack, the test indicates that the attack is also absent, which is known as TN. When the system predicts the positive class incorrectly, this is referred to as FP. Likewise, if the test result indicates that the system is free of attacks, but the system actually has the attack, it is known as FN. We used the confusion matrix to evaluate, analyze, and validate the proposed anomaly detection method. In particular, we used accuracy, sensitivity, specificity, F1-score, false–positive rate (FPR), positive predictive value (PPV), and negative predictive value (NPV) to quantitatively validate the efficacy of different classifier models with the feature selection methods used. We evaluated and analyzed the proposed work by measuring various important metrics, as follows [39]:
Choosing an appropriate data set, including real-time IIoT traffic, is a critical step in validating our anomaly-based IDS method. In addition, a diverse range of IIoT cyberattacks—both rudimentary and sophisticated—should be taken into account when evaluating the robustness and effectiveness of such a detection approach. We analyzed and evaluated the proposed anomaly detection method on the X-IIoTID data set [40], which is the most recent and comprehensive data set for IIoT environments. The X-IIoTID data set contains new IIoT connectivity protocols, recent device activities, diverse attack scenarios, and attack protocols. Such a data set reflects normal behaviors and includes modern cyberattack activities such as reverse shell, MitM, TCP relay, C&C, and brute force.
Tab. 1 illustrates the performance results of different classifier models when MRMR is used as a feature selection method. As Tab. 1 shows, the DT model obtained a high accuracy rate of 99.586%, the best accuracy result of all the classifiers used. The LDA and SVM models achieved similar accuracy rates of 85.577% and 85.807%, respectively. The KNN classifier performed well in terms of accuracy rate (98.652%), with the second-best accuracy rate after the DT model. The DT also outperformed other classifiers in terms of sensitivity and specificity, with 99.593% and 99.58%, respectively. LDA and SVM achieved similar results for sensitivity, with 73.7.61% and 73.804%, respectively; for specificity measure, LDA and SVM obtained 97.573% and 97.993%, respectively. In the case of the F1-score, the DT model obtained 99.59%, whereas KNN obtained a similar performance result of 98.666%. The LDA and SVM classifiers obtained a similar F1-score, with 83.748% and 83.973%, respectively. the DT model outperformed other classifiers in terms of NPV and PPV, with 99.587% and 99.586%, respectively. The KNN model achieved performance results similar to those of the DT model, with 98.904% and 98.406%, respectively. By contrast, the LDA and SVM classifiers achieved a lower performance result for NPV, with 78.653% and 78.553%, respectively. For the PPV measure, LDA and SVM obtained 97.392% and 96.861%, respectively.


Figure 6: Performance evaluation of different classifier models when using the MRMR technique
Fig. 7 illustrates the FPR for the different classifiers used when employing MRMR as a feature selection method. As Fig. 7 shows, the DT model achieved the lowest FPR of all classifiers used with 0.42%, whereas the LDA and SVM models obtained similar FPR with 2.42% and 2.007%, respectively. The KNN model obtained FPR with 1.627%, better than LDA and SVM.

Figure 7: False positive rate of different classifier models when using MRMR technique
Tab. 2 illustrates the performance results of different classifier models when NCA is used as feature selection technique. As Tab. 2 shows, the DT model obtained a high accuracy rate of 99.355%, the best accuracy result of all the classifiers used. The LDA and SVM models achieved similar accuracy rates of 78.858% and 78.82%, respectively. The KNN classifier achieved a better accuracy rate that LDA and SVM, with 97.913%. The DT also performed well in a comparison with other classifiers in terms of sensitivity and specificity, with 99.442% and 99.267%, respectively, LDA and SVM achieved similar results for sensitivity, with 65.642% and 65.577%, respectively, and for specificity measure LDA and SVM obtained 92.277% and 92.267%, respectively. In the case of F1-score, the DT model obtained 99.36%, whereas KNN obtained a similar performance result of 97.941%. The LDA and SVM classifiers obtained a similar F1-score with 75.778% and 75.726%, respectively. the DT model outperformed other classifiers in terms of NPV and PPV, with 98.709% and 99.279%, respectively. The KNN model achieved performance results similar to those of the DT model, with 98.498% and 97.35%, respectively. By contrast, the LDA and SVM classifiers achieved a lower performance result for NPV, with 72.567% and 72.527%, respectively. For the PPV measure, LDA and SVM obtained 86.615% and 89.594%, respectively. Fig. 6 presents the performance evaluation of different classifier models when using the MRMR technique.
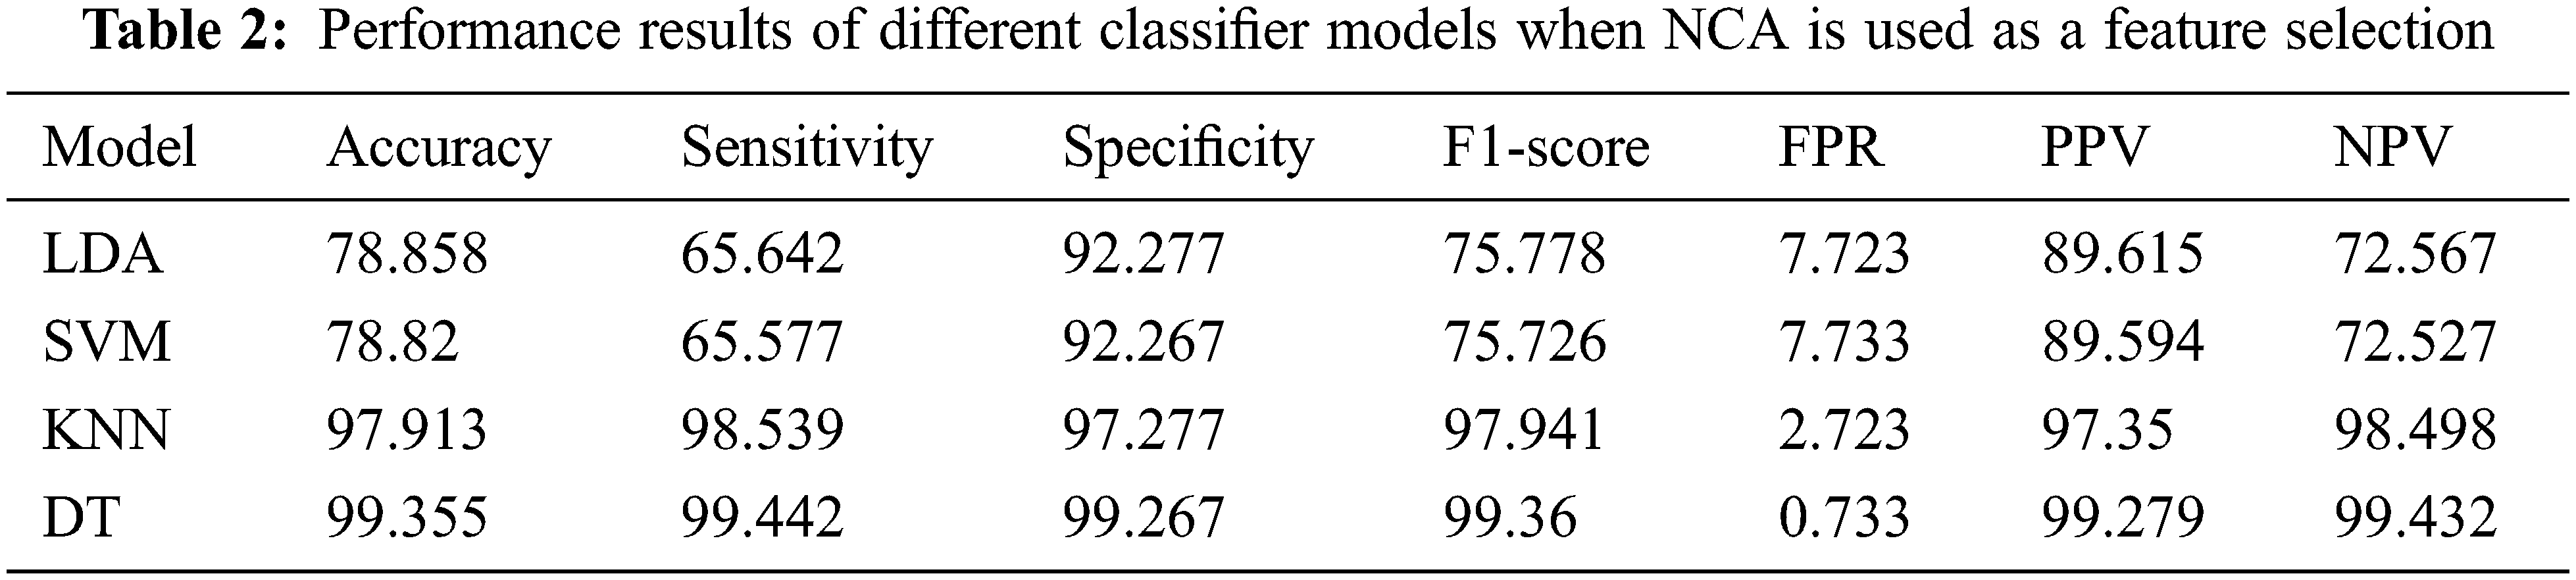

Figure 8: Performance evaluation of different classifier models when using NCA technique
Fig. 9 illustrates the FPR for the different classifiers used when employing NCA as a feature selection method. As Fig. 9 shows, the DT model outperformed other classifiers and achieved the lowest FPR of all classifiers used with 0.73%, whereas the LDA and SVM models obtained worse performance results in terms of FPR with 7.72% and 7.73%, respectively. The KNN model obtained FPR with 2.273%, better than the LDA and SVM. Fig. 8 illustrates the performance evaluation of different classifier models when using NCA technique.

Figure 9: False positive rate of different classifier models when using NCA technique
Fig. 10 compares the accuracy rates of all classifiers when NCA and MRMR are used to select features. As shown in Fig. 10, the MRMR technique obtained higher accuracy rates than the NCA technique when used with different classifier models. In particular, the DT model with MRMR outperforms all other classifiers as it obtained higher accuracy, sensitivity, specificity, F1-score, and lower FPR.

Figure 10: Comparison of MRMR and NCA with different classifier models
We have compared the performance of our proposed anomaly-based IDS with that of recently developed detection techniques (see Tab. 3). Compared with Ludwig [21], our proposed approach enhanced the accuracy rate by 7.09% while significantly reducing the FPR by 14.31%. Our anomaly-based IDS method also outperformed a recently proposed method by Kasongo [19], who used the GA algorithm for feature selection and the RF model as the detection model. Our method improved the accuracy rate by 11.97%. We also compared the proposed anomaly detection with other techniques that used a deep learning model proposed by Muna et al. [17]; the accuracy rate of our proposed work was enhanced by 0.98%, and FPR was reduced by 1.4%. The proposed method also achieved a higher accuracy rate and a reduced FPR compared with Awotunde et al. [22]. Our method improved the accuracy and FPR by 0.68% and 0.7%, respectively. Tab. 3 presents the classification accuracy and FPR of the proposed method with existing anomaly detection models.

In this paper, we proposed an anomaly-based IDS method to overcome modern cyberattacks in IIoT environments. The proposed work employed two feature selection techniques to reduce data dimensionality, improve computational resources, and improve detection performance. We used a set of machine learning techniques in the classification phase to determine whether a given flow of traffic was normal or an attack. We evaluated, analyzed, and validated the proposed work using the X-IIoTID, the most recent and comprehensive data set for IIoT environments. The performance results demonstrated the DT model with MRMR as a feature selection technique achieved a higher accuracy rate of 99.58%, a sensitivity rate of 99.59%, a specificity rate of 99.58%, an F1-score rate of 99.59%, and a lower FPR of 0.4% than other techniques used in recent studies. In the future, we will extend our work by employing different classification algorithms such as deep learning techniques. We will also investigate, analyze, and evaluate additional feature selection techniques to select a lightweight and efficient mechanism. In addition, the integration of anomaly detection with other emerging technologies, such as blockchain, will be investigated.
Funding Statement: The authors received no specific funding for this study.
Conflicts of Interest: The authors declare that they have no conflicts of interest to report regarding the present study.
1. T. Huong, T. Bac, D. Long, T. Luong, N. Dan et al., “Detecting cyberattacks using anomaly detection in industrial control systems: A federated learning approach,” Computers in Industries, vol. 132, no. 7, pp. 1–16, 2021. [Google Scholar]
2. M. Hassan, A. Gumaei, S. Huda and A. Almogren, “Increasing the trustworthiness in the industrial IoT networks through a reliable cyberattack detection model,” IEEE Transactions on Industrial Informatics, vol. 16, no. 9, pp. 6154–6162, 2020. [Google Scholar]
3. F. Reegu, W. Khan, S. Daud, Q. Arshad and N. Armi, “A reliable public safety framework for industrial internet of things (IIoT),” in 2020 Int. Conf. on Radar, Antenna, Microwave, Electronics, and Telecommunications (ICRAMET), Serpong, Indonesia, pp. 189–193, 2020. [Google Scholar]
4. T. Gebremichael, “Security and privacy in the industrial internet of things: Current standards and future challenges,” IEEE Access, vol. 8, pp. 152351–152366, 2020. [Google Scholar]
5. A. Sari, A. Lekidis and I. Butun, “Industrial networks and IIoT: Now and future trends,” in Industrial IoT. Cham, Switzerland: Springer, pp. 3–55, 2020. [Google Scholar]
6. S. Tan and A. Samsudin, “Recent technologies, security countermeasure and ongoing challenges of industrial internet of things (IIoTA survey,” Sensors, vol. 21, no. 19, pp. 1–30, 2021. [Google Scholar]
7. A. Aljuhani, “Machine learning approaches for combating distributed denial of service attacks in modern networking environments,” IEEE Access, vol. 9, pp. 42236–42264, 2021. [Google Scholar]
8. I. Jamai, L. Ben Azzouz and L. A. Saïdane, “Security issues in industry 4.0,” in 2020 Int. Wireless Communications and Mobile Computing (IWCMC), Harbin, China, pp. 481–488, 2020. [Google Scholar]
9. M. M. Hassan, S. Huda, S. Sharmeen, J. Abawajy and G. Fortino, “An adaptive trust boundary protection for IIoT networks using deep-learning feature-extraction-based semisupervised model,” IEEE Transactions on Industrial Informatics, vol. 17, no. 4, pp. 2860–2870, 2021. [Google Scholar]
10. X. Jiang, M. Lora and S. Chattopadhyay, “An experimental analysis of security vulnerabilities in industrial IoT devices,” ACM Transactions on Internet Technology, vol. 20, no. 2, pp. 1–24, 2020. [Google Scholar]
11. A. Kalam, “Securing SCADA and critical industrial systems: From needs to security mechanisms,” International Journal of Critical Infrastructure Protection, vol. 32, pp. 1–16, 2021. [Google Scholar]
12. M. Eskandari, Z. H. Janjua, M. Vecchio and F. Antonelli, “Passban IDS: An intelligent anomaly-based intrusion detection system for IoT edge devices,” IEEE Internet of Things Journal, vol. 7, no. 8, pp. 6882–6897, 2020. [Google Scholar]
13. P. Satam and S. Hariri, “WIDS: An anomaly based intrusion detection system for Wi-Fi (IEEE 802.11) protocol,” IEEE Transactions on Network and Service Management, vol. 18, no. 1, pp. 1077–1091, 2021. [Google Scholar]
14. H. Liu and B. Lang, “Machine learning and deep learning methods for intrusion detection systems: A survey,” Applied Science, vol. 9, no. 20, pp. 4396, 2019. [Google Scholar]
15. D. Kwon, H. Kim, J. Kim, S. Suh, I. Kim et al., “A survey of deep learning-based network anomaly detection,” Cluster Computing, vol. 4, no. 3, pp. 1–13, 2017. [Google Scholar]
16. N. Moustafa, J. Hu and J. Slay, “A holistic review of network anomaly detection systems: A comprehensive survey,” Journal of Network Computer Applications, vol. 128, no. 10, pp. 33–55, 2019. [Google Scholar]
17. A. Muna, N. Moustafa and E. Sitnikova, “Identification of malicious activities in industrial Internet of Things based on deep learning models,” Journal of Information Security and Applications, vol. 41, no. 5, pp. 1–11, 2018. [Google Scholar]
18. M. Bagaa, T. Taleb, J. B. Bernabe and A. Skarmeta, “A machine learning security framework for IoT systems,” IEEE Access, vol. 8, pp. 114066–114077, 2020. [Google Scholar]
19. S. M. Kasongo, “An advanced intrusion detection system for IIoT based on GA and tree based algorithms,” IEEE Access, vol. 9, pp. 113199–113212, 2021. [Google Scholar]
20. R. V. Mendonça, A. Teodoro, R. Rosa, M. Saadi, D. Melgarejo et al., “Intrusion detection system based on fast hierarchical deep convolutional neural network,” IEEE Access, vol. 9, pp. 61024–61034, 2021. [Google Scholar]
21. S. A. Ludwig, “Intrusion detection of multiple attack classes using a deep neural net ensemble,” in 2017 IEEE Symp. Series on Computational Intelligence (SSCI), Hawaii, USA, pp. 1–7, 2017. [Google Scholar]
22. J. Awotunde, J. Bamidele, C. Chakraborty and A. Adeniyi, “Intrusion detection in industrial internet of things network-based on deep learning model with rule-based feature selection,” Wireless Communications and Mobile Computing, vol. 2021, no. 2, pp. 1–17, 2021. [Google Scholar]
23. I. Ullah and Q. Mahmoud, “Design and development of a deep learning-based model for anomaly detection in IoT networks,” IEEE Access, vol. 9, pp. 103906–103926, 2021. [Google Scholar]
24. A. Gad, A. Nashat and T. Barkat, “Intrusion detection system using machine learning for vehicular ad hoc networks based on ton-IoT dataset,” IEEE Access, vol. 9, pp. 142206–142217, 2021. [Google Scholar]
25. M. Alanazi and A. Aljuhani, “Anomaly detection for Internet of Things cyberattacks,” Computers Materials & Continua, vol. 72, no. 1, pp. 261–279, 2022. [Google Scholar]
26. W. Li and Z. Liu, “A method of SVM with normalization in intrusion detection,” Procedia Environmental Sciences, vol. 11, pp. 256–262, 2011. [Google Scholar]
27. M. Qian and L. Yan-Fu, “Weakly supervised-based oversampling for high imbalance and high dimensionality data classification,” pp. 1–9, 2009. [Online]. Available: https://arxiv.org/abs/2009.14096. [Google Scholar]
28. J. Goldberger, S. Roweis, G. Hinton and R. Salakhutdinov, “Neighbourhood components analysis,” Advances In Neural Information Processing Systems, Whistler, BC, pp. 571–577, 2005. [Google Scholar]
29. W. Yang, K. Wang and W. Zuo, “Neighborhood component feature selection for high-dimensional data,” Journal of Computers, vol. 7, no. 1, pp. 161–168, 2012. [Google Scholar]
30. Neighborhood component analysis (NCA) feature selection, MathWorks,” Accessed: 09-Dec-2021, 2022. [Online]. Available: https://es.mathworks.com/help/stats/neighborhood-component-analysis.html#bvfe818. [Google Scholar]
31. H. Peng, F. Long and C. Ding, “Feature selection based on mutual information criteria of max-dependency, max-relevance, and minredundancy,” IEEE Transactions on Pattern Analysis and Machine Intelligence, vol. 27, no. 8, pp. 1226–1238, 2005. [Google Scholar]
32. M. Killioglu, M. Taskiran and N. Kahraman, “Anti-spoofing in face recognition with liveness detection using pupil tracking,” in 2017 IEEE 15th Int. Symp. on Applied Machine Intelligence and Informatics (SAMI), Herl’any, Slovakia, pp. 87–92, 2017. [Google Scholar]
33. D. Vikrant and E. Mario, “Gradient boosted decision trees for lithology classification,” Computer Aided Chemical Engineering, vol. 47, pp. 113–118, 2019. [Google Scholar]
34. N. Ali, D. Neagu and P. Trundle, “Evaluation of k-nearest neighbour classifier performance for heterogeneous data sets,” Social Network Applied Science, vol. 1, no. 12, pp. 1–15, 2019. [Google Scholar]
35. A. Alagha, S. Singh, H. Otrok and R. Mizouni, “RFLS-resilient faultproof localization system in IoT and crowd-based sensing applications,” Journal of Network and Computer Applications, vol. 170, pp. 1–16, 2020. [Google Scholar]
36. M. Mohammadi, T. Rashid, S. Karim, A. Aldalwie, Q. Tho et al., “A comprehensive survey and taxonomy of the SVM-based intrusion detection systems,” Journal of Network and Computer Applications, vol. 178, no. 4, pp. 1–24, 2021. [Google Scholar]
37. H. Hindy, R. Atkinson, C. Tachtatzis, J. Colin, E. Bayne et al., “Utilising deep learning techniques for effective zero-day attack detection,” Electronics, vol. 9, no. 10, pp. 1–16, 2020. [Google Scholar]
38. A. Lawi, S. Wungo and S. Manjang, “Identifying irregularity electricity usage of customer behaviors using logistic regression and linear discriminant analysis,” in 3rd Int. Conf. on Science in Information Technology (ICSITech), Indonesia, pp. 552–557, 2017. [Google Scholar]
39. A. Sedik, L. Tawalbeh, M. Hammad, A. Abd El-latif and G. El-banby, “Deep learning modalities for biometric alteration detection in 5g networks-based secure smart cities,” IEEE Access, vol. 9, pp. 94780–94788, 2021. [Google Scholar]
40. M. Al-Hawawreh, E. Sitnikova and N. Aboutorab, “X-IIoTID: A connectivity-and device-agnostic intrusion dataset for industrial internet of things,” IEEE Internet of Things Journal, vol. 9, no. 5, pp. 3962–3977, 2021. [Google Scholar]
 | This work is licensed under a Creative Commons Attribution 4.0 International License, which permits unrestricted use, distribution, and reproduction in any medium, provided the original work is properly cited. |