DOI:10.32604/csse.2023.026877
| Computer Systems Science & Engineering DOI:10.32604/csse.2023.026877 | |
| Article |
Stacked Gated Recurrent Unit Classifier with CT Images for Liver Cancer Classification
1Information Technology Department, Faculty of Computing and Information Technology, King Abdulaziz University, Jeddah, 21589, Saudi Arabia
2Centre of Artificial Intelligence for Precision Medicines, King Abdulaziz University, Jeddah, 21589, Saudi Arabia
3Department of Mathematics, Faculty of Science, Al-Azhar University, Naser City, 11884, Cairo, Egypt
4Department of Diagnostic Radiology, Faculty of Applied Medical Sciences, King Abdulaziz, Jeddah, 21589, Saudi Arabia
5Imaging Unit, King Fahd Medical Research Centre, King Abdulaziz, Jeddah, 21589, Saudi Arabia
*Corresponding Author: Mahmoud Ragab. Email: mragab@kau.edu.sa
Received: 06 January 2022; Accepted: 10 March 2022
Abstract: Liver cancer is one of the major diseases with increased mortality in recent years, across the globe. Manual detection of liver cancer is a tedious and laborious task due to which Computer Aided Diagnosis (CAD) models have been developed to detect the presence of liver cancer accurately and classify its stages. Besides, liver cancer segmentation outcome, using medical images, is employed in the assessment of tumor volume, further treatment plans, and response monitoring. Hence, there is a need exists to develop automated tools for liver cancer detection in a precise manner. With this motivation, the current study introduces an Intelligent Artificial Intelligence with Equilibrium Optimizer based Liver cancer Classification (IAIEO-LCC) model. The proposed IAIEO-LCC technique initially performs Median Filtering (MF)-based pre-processing and data augmentation process. Besides, Kapur’s entropy-based segmentation technique is used to identify the affected regions in liver. Moreover, VGG-19 based feature extractor and Equilibrium Optimizer (EO)-based hyperparameter tuning processes are also involved to derive the feature vectors. At last, Stacked Gated Recurrent Unit (SGRU) classifier is exploited to detect and classify the liver cancer effectively. In order to demonstrate the superiority of the proposed IAIEO-LCC technique in terms of performance, a wide range of simulations was conducted and the results were inspected under different measures. The comparison study results infer that the proposed IAIEO-LCC technique achieved an improved accuracy of 98.52%.
Keywords: Liver cancer; image segmentation; artificial intelligence; deep learning; CT images; parameter tuning
Globally, liver cancer is one of the major causes that leads to high mortality [1]. Liver cancer may either start in liver itself or it may begin somewhere else in the body and reach the liver cell at last in the form of secondary liver cancer (otherwise called metastasis). Different types of liver cancers have been identified so far such as Hepatocellular Carcinoma (HCC), bile duct cancer, angiosarcoma, hepatoblastoma, and hemangiosarcoma. Among these, Hepatocellular carcinoma (HCC) is the most common and predominant liver cancer reported among men than their counterparts [2]. Usually, HCC spreads across the body of the patient diagnosed with chronic liver disease [3]. Numerous imaging methods exist for the diagnoses of HCC for example, Positron Emission Tomography (PET), contrast-enhanced ultrasound perfusion magnetic resonance imaging, Computed Tomography (CT), and PET-CT. Among these, CT is the most preferred imaging method for diagnosis as well as recognition of hepatic metastases and HCC, thanks to its high specificity and sensitivity [4]. Further, multi-slice CT scanner provides high resolution 3D images through low dose radiation. CT technique captures 3D volume images of the liver through X-rays produced by a rotating X-ray source and detector assembly over the patients [5]. CT scan investigation is a critical phase in the early diagnosis of liver cancer. The investigation is conducted through manual, semi-automatic, or automatic models through certified professionals such as radiotherapist. Among the given models, manual method lacks repeatability and is also a time-consuming process. In the past few years, with rapid advancements made in the field of Machine Learning (ML) and Computer Vision (CV) algorithms, the automatic classification methods for liver cancer images too have tremendously increased.
Computer Aided Diagnosis (CAD) is used to classify the stage of liver cancer so as to support the physician in decision making procedures [6]. For efficient classification of different stages of liver cancer, artificial intelligence and image processing methods must have the capability in study application. Liver cancer can be diagnosed through different methods such as watershed transform, ML, and region-based methods. Usually, Deep Learning (DL) is the simplest method to standardize the pixels of images to a similar level. Therefore, the extracted image could reflect the features of image itself for the preprocessed image whereas the nature of the extracted features determine the accuracy of the process [7]. Finally, it can be concluded that the object class in images is the key component in DL method. It is also the focus of a number of existing works [8]. ML algorithm has attained good radiological efficacy and solved the gap in radiological classification of distinct diseases [9,10]. Convolution Neural Network (CNN) of DL methods have been employed earlier for automated identification of liver cancer from CT scan images.
Mao et al. [11] examined the application of ML-based ultrasound radiomics in effective segmentation of metastatic and primary liver cancer images. In this study, liver lesion was automatically classified by two professionals using ITK-SNAP software. The seven classes of radiomics features have been extracted from Pyradiomics framework. Ding et al. [12] presented the current technological provisions for medical treatment and diagnoses and he validated the provisions in terms of enhanced rigor, objectivity, and accuracy of segmentation of Traditional Chinese medicine (TCM) syndrome. According to fuzzy mathematics concept, the authors measured the signs and symptoms of syndrome-based TCM factor and also the data from TCM four diagnosis modes. Following this, with Extreme Learning Machine (ELM) system and Particle Swarm Optimization (PSO), a Neural Network (NN) syndrome prediction and classification model was created utilizing ‘TCM symptom + sign + tongue diagnoses data + pulse diagnoses data’ as input and syndrome as output. This method was utilized in the mining of non-linear relationships among medical information with different syndrome types and electronic medical records.
Rajesh et al. [13] deliberated a predictive method for liver cancer. Being reported as one of the most deadly types of cancer, a straightforward method was presented in this study to predict liver cancer via widely accessible data sets. Distinct kinds of data preprocessing were performed on the data set to extract the optimal data. Further, the study experiments utilized distinct kinds of classifier methods too to arrive at the predictive outcomes. In the study conducted earlier [14], histopathological H&E image from Genomic Data Common Databases was utilized to train a NN system (inception V3) for automated classification. When this method that use Matthew relation coefficients was assessed, the efficiency level was found to be closer to the capacity of 5-year experiences. The researchers [15] projected a hybrid Feature Selection (FS) method by integrating sequential forward selection and data gain-based class-dependent method (IGSFS-CD) for the segmentation of liver cancer images. Two distinct classifications namely naïve Bayes (NB) and Decision Tree (DT) have been utilized in this study to evaluate the feature subset.
The current study introduces an Intelligent Artificial Intelligence with Equilibrium Optimizer based Liver Cancer Classification (IAIEO-LCC) model. The proposed IAIEO-LCC technique initially performs Median Filtering (MF)-based pre-processing and data augmentation process. Besides, Kapur’s Entropy (KE)-based segmentation technique is also used to identify the affected regions in liver. Moreover, VGG-19 based feature extractor and Equilibrium Optimizer (EO)-based hyperparameter tuning processes are also involved in this study to derive the feature vectors. Finally, Stacked Gated Recurrent Unit (SGRU) classifier is exploited to detect and classify the stages of liver cancer effectively. In order to demonstrate the superior performance of the proposed IAIEO-LCC technique, a wide range of experiments was carried out.
2 The Proposed IAIEO-LCC Technique
In this study, an effective IAIEO-LCC technique has been developed to differentiate the classes of liver images. The proposed IAIEO-LCC technique primarily undergoes MF-based noise elimination, data augmentation, KE-based segmentation, VGG-19 based feature extraction, EO-based hyperparameter tuning, and SGRU-based classification. SGRU classifier is exploited to detect and classify the liver cancer effectively.
2.1 Pre-processing: Data Augmentation and Filtering Technique
In order to train the CNN model, huge quantities of labeled data are required. Since the model, trained with restricted data, might fail to achieve generalization, increasing the size of the dataset is a promising way to reduce overfitting or memorization problems. Data augmentation is an effective way to raise the number of images whereas geometric translations such as shearing, flipping, shifting, and zooming are used to augment the images.
MF utilizes the median values of the window to replace intermediate pixels treated by the window. When intermittent pixels are noisy, it gets substituted by intermediate window value. The median value is considered as the mid-point value after sorting process. Hence, the undistorted pixels can be substituted using the median value of the window.
Sample window Output
2.2 Segmentation: Kapur’s Entropy
Both pre-processed and augmented images are then passed on to KE-based segmentation approach for the identification of affected regions. KE technique seeks to determine the optimal threshold value,
where
2.3 Feature Extraction: EO+VGG-19 Model
The segmented images are then passed onto VGG19 method to produce a collection of feature vectors. VGGNet [17] is a kind of DL model with numerous layers. It mainly depends upon CNN model, exhibits simplicity and has 3 × 3 convolution layers which are kept at the top for increasing the depth. In order to reduce the size of volume, max-pooling layer is employed as a handler in VGG-19 model. A pair of Fully Connected (FC) layers is utilized with 4,096 neurons. During training process, the convolution layer is applied to derive the features and max-pooling layer related to few convolution layers can be utilized for minimizing the feature dimensionalities. At initial convolution layer, 64 kernels (3 × 3 filter size) are utilized to derive the feature vectors from input image, and the FC layer is utilized to prepare the feature vectors. Fig. 1 offers the structure of VGG-19 model.

Figure 1: Structure of VGG-19 model
For optimal modification of the hyperparameters involved in VGG19, EO is utilized. A metaheuristic technique, simulated as physics laws such as EO, was presented to resolve the optimized issues. Further, the data on the simulation of EO was established in [18]. The mathematical process of EO technique was showcased in subsequent three steps.
Step 1: Initiation
In this step, EO utilizes a set of particles, in which all the particles signify the concentration vector which has the solution to optimize the issue. The primary concentration vector is created arbitrarily from search space, utilizing the equation given below.
where
Step 2: Equilibrium pool and candidate solutions
In order to incorporate metaheuristic technique, there exists an objective for everyone, based on their nature, who tries to achieve it. If receiving the equilibrium state is the objective, EO receives near-optimum solutions for optimized problems. During optimization procedure, EO does not recognize the level of concentration that attains the equilibrium state. Therefore, it allocates four optimum particles established from the population at equilibrium candidate solution and it also comprises of different average of four optimum particles. These five equilibrium candidate solutions support EO from exploration and exploitation operators. The 1st four candidate solutions help EO in attaining optimum diversification abilities, and the average enhancement from exploitation. These five candidate solutions are saved from the vector such as equilibrium pool [19]:
Step 3: update the concentration
The subsequent term supports the EO containing a plausible balance between intensification and diversification. As the turnover rate differs over time in real control volumes,
where
where
where
where
where
where
2.4 Classifier: Stacked GRU Model
Finally, SGRU classifier is utilized for the differentiation of liver cancer images effectively. Conventional ML techniques manage time series issues; all the moments of instance are considered to be independent arbitrary variables which can be provided as to regression technique or NN to train. But, this technique considers that the data at distinct moments are independent of each other, and its order in time remains non-assumed. Recurrent Neural Network (RNN) is presented to capture this temporal correlation with the help of ML. GRU has been altered with RNN depending upon Long Short Term Memory (LSTM). If the error signal propagates backward with time in conventional RNN, then the signal is provided to vanish or blow up. This case eventually leads to failure of the learning network [20]. GRU not only maintains the capability to prevent the earlier revealed problems whereas it also decreases the difficulty of framework without losing an efficient learning capability.
Both reset and update gates are FC layers with sigmoid activation and are utilized for controlling the memory [20]. GRU cell is demonstrated as follows.
where

Figure 2: Overall structure of SGRU model
The performance of the proposed IAIEO-LCC technique was validated using a collection of CT scan images collected from various sources. The dataset includes images under three classes such as Hemangioma (HEMA), Hepatocellular Carcinoma (HCC), and Metastatic Carcinoma (MEC). Each class holds a set of 75 images which became 150 after data augmentation process. Fig. 3 demonstrates the sample test images. The confusion matrix generated by the proposed IAIEO-LCC technique with training/testing set of 80:20 is portrayed in Fig. 4. The results report that IAIEO-LCC technique has classified 29 instances under HEMA class, 30 images under HCA class, and 29 instances under MSC class.

Figure 3: Sample test images

Figure 4: Confusion matrix of IAIEO-LCC approach with a training/testing set of 80:20
The results obtained by IAIEO-LCC technique, on the classification of liver cancer images under training/testing set of 80:20, are shown in Tab. 1 and Fig. 5. The results demonstrate the enhanced effectiveness of the proposed IAIEO-LCC technique in terms of different measures. The proposed IAIEO-LCC technique classified HEMA class with
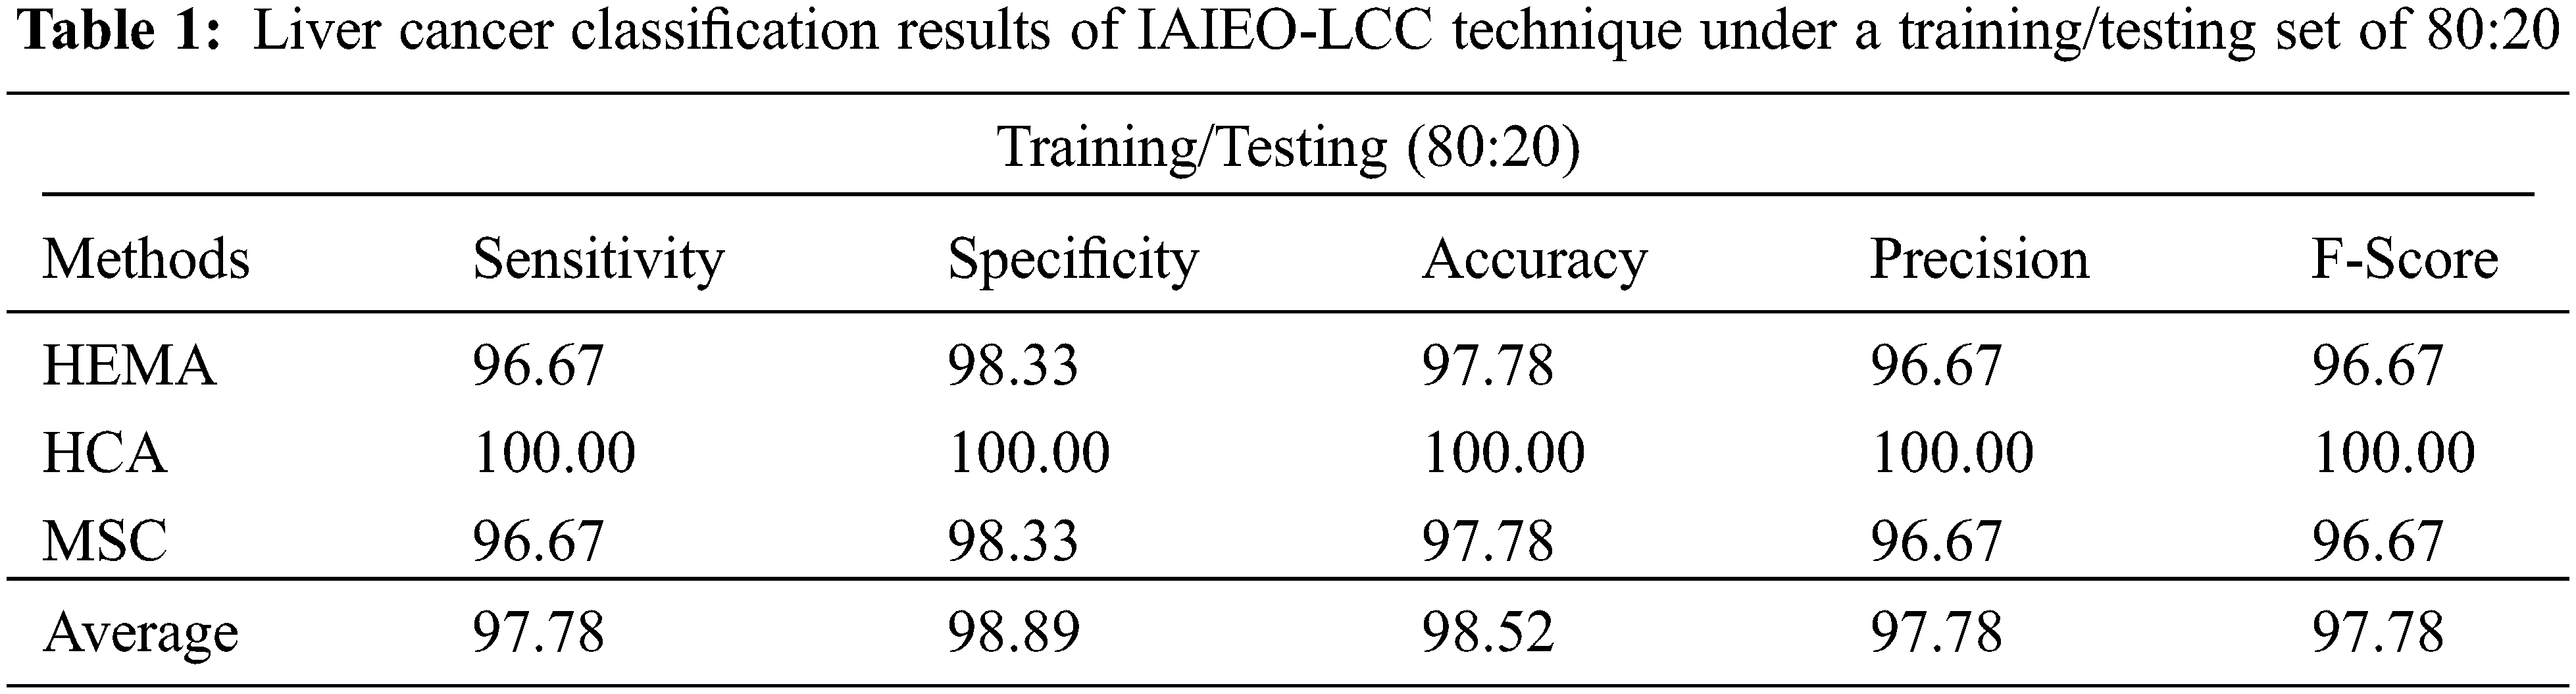

Figure 5: Classifier results of IAIEO-LCC technique under a training/testing set of 80:20
Moreover, IAIEO-LCC technique categorized the HCA class with
The confusion matrix generated by IAIEO-LCC technique with training/testing set of 70:30 is portrayed in Fig. 6. The experimental values highlight that the proposed IAIEO-LCC technique recognized 44 instances as HEMA class, 41 images as HCA class, and 42 instances as MSC class.

Figure 6: Confusion matrix of IAIEO-LCC approach with a training/testing set of 70:30
The experimental values offered by the proposed IAIEO-LCC technique on the classification of liver cancer with training/testing set of 70:30, are presented in Tab. 2 and Fig. 7. The results reveal the improved effectiveness of IAIEO-LCC technique in terms of dissimilar measures. The proposed IAIEO-LCC technique categorized HEMA class with
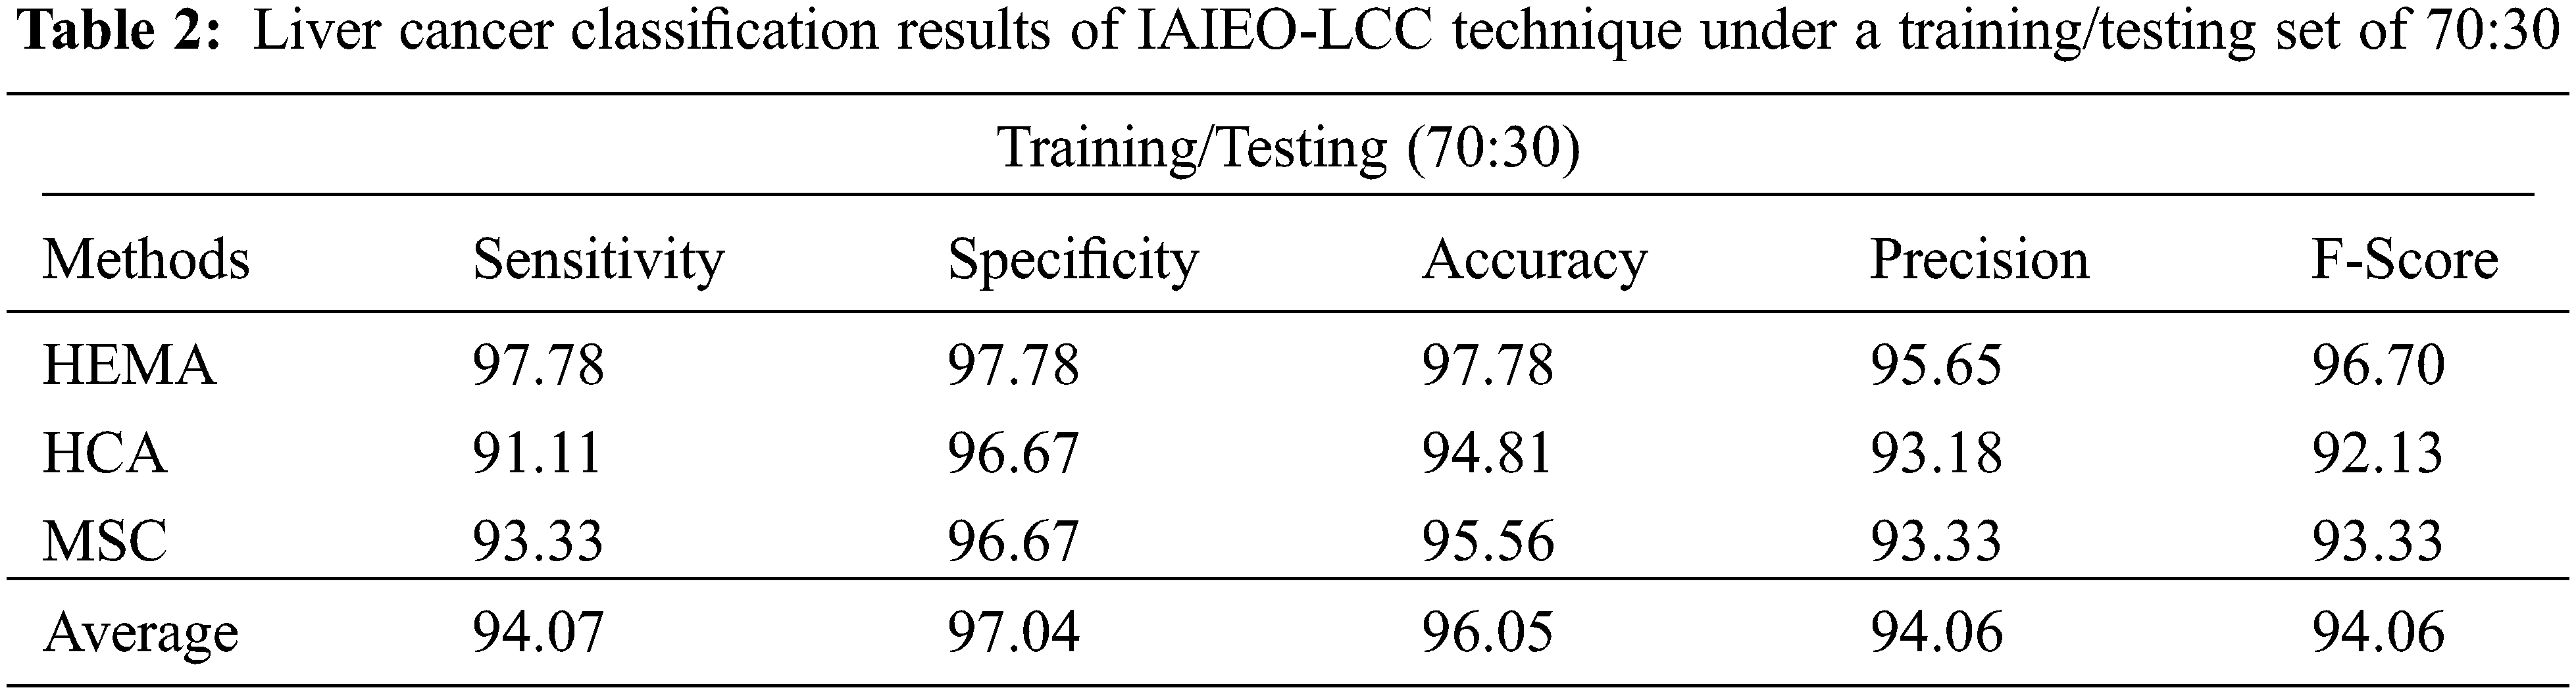
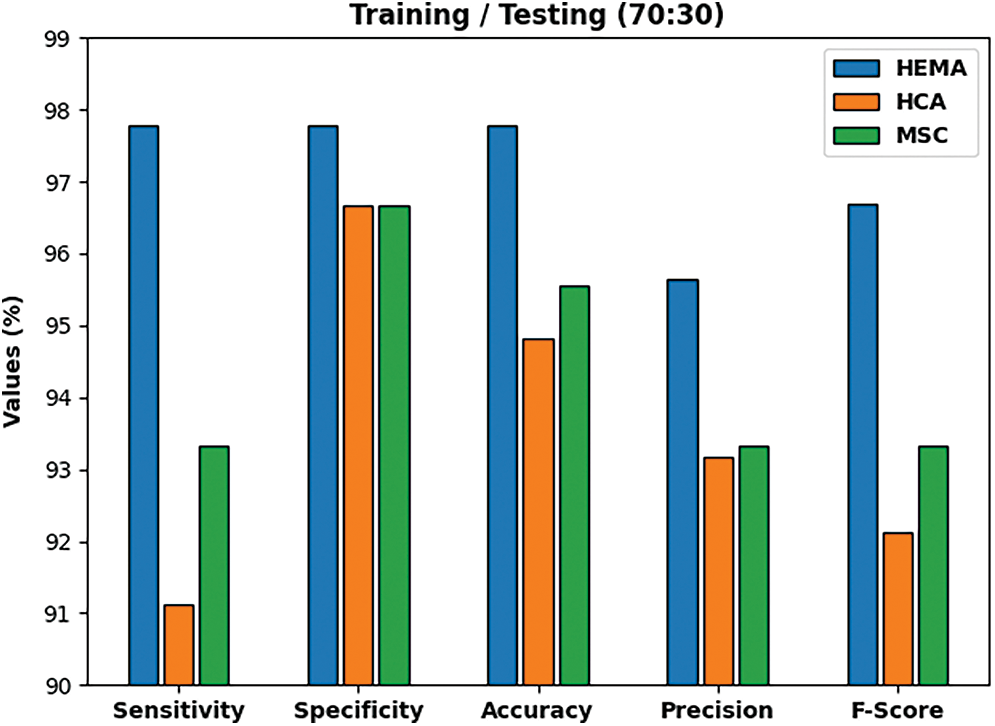
Figure 7: Classification results of IAIEO-LCC approach with a training/testing set of 70:30
The confusion matrix generated by IAIEO-LCC technique with a training/testing set of 60:40 is portrayed in Fig. 8. The results state that the proposed IAIEO-LCC technique recognized 58 instances as HEMA class, 57 images as HCA class, and 57 instances as MSC class.
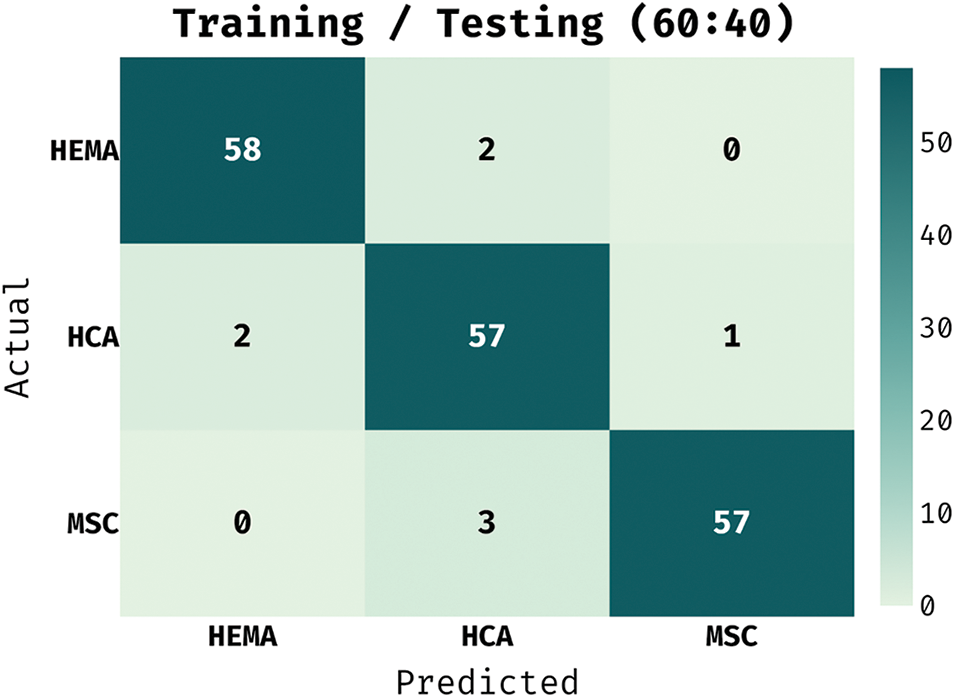
Figure 8: Confusion matrix of IAIEO-LCC approach with a training/testing set of 60:40
The results achieved by the proposed IAIEO-LCC technique, on the classification of liver cancer with training/testing set of 60:40, are presented in Tab. 3 and Fig. 9. The results validate the boosted effectiveness of IAIEO-LCC technique in terms of different measures. The IAIEO-LCC technique categorized HEMA class with
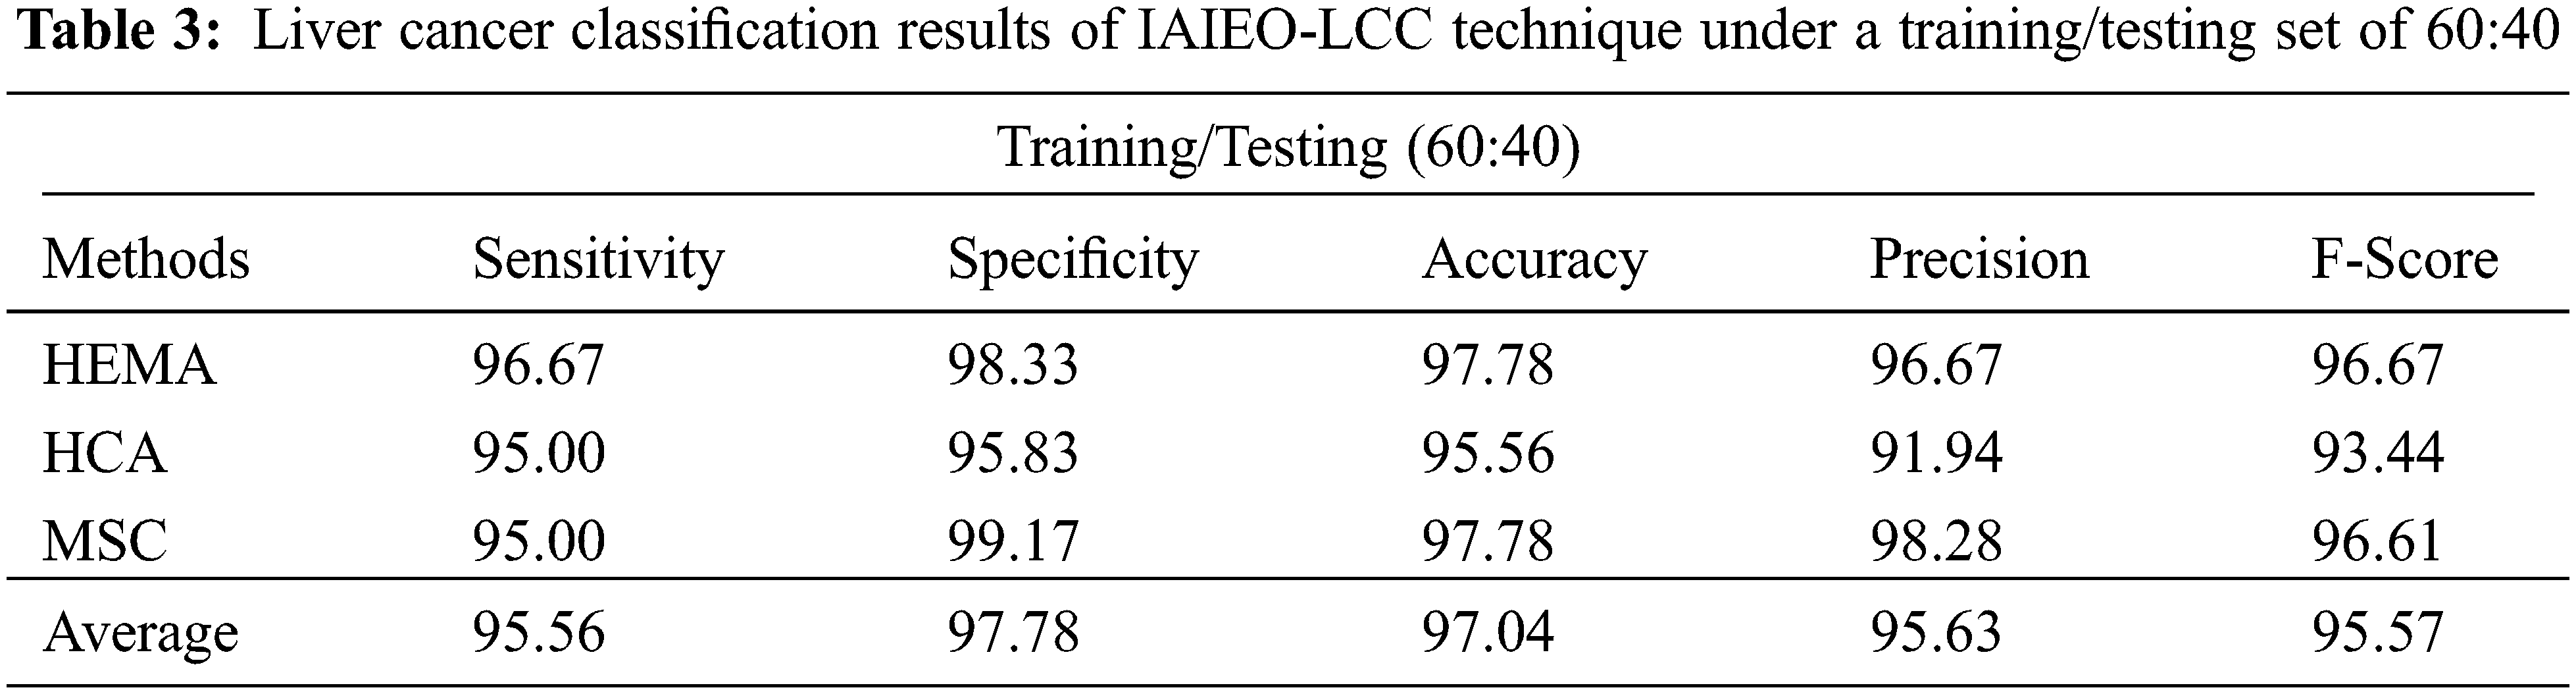
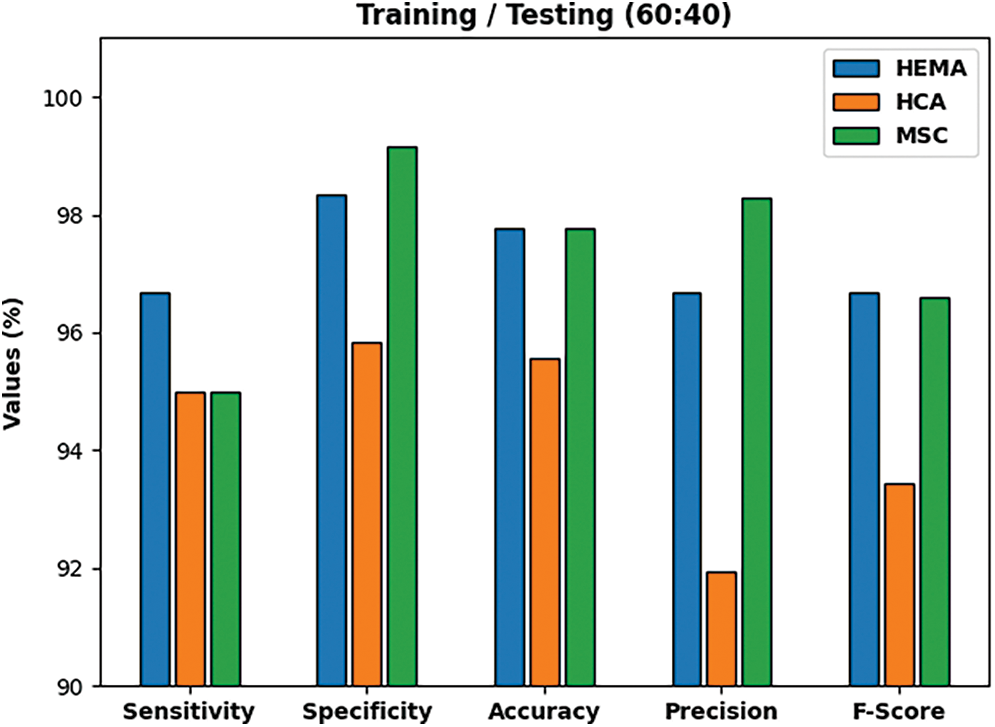
Figure 9: Classifier results of IAIEO-LCC technique under a training/testing set of 60:40
In order to ensure the betterment of the proposed IAIEO-LCC technique, a comparison study was conducted against MLP, SVM, Random Forest (RF), J48, and NB models [21,22] and the results are shown in Tab. 4. Fig. 10 illustrates the comparison of IAIEO-LCC technique against other methods in terms of
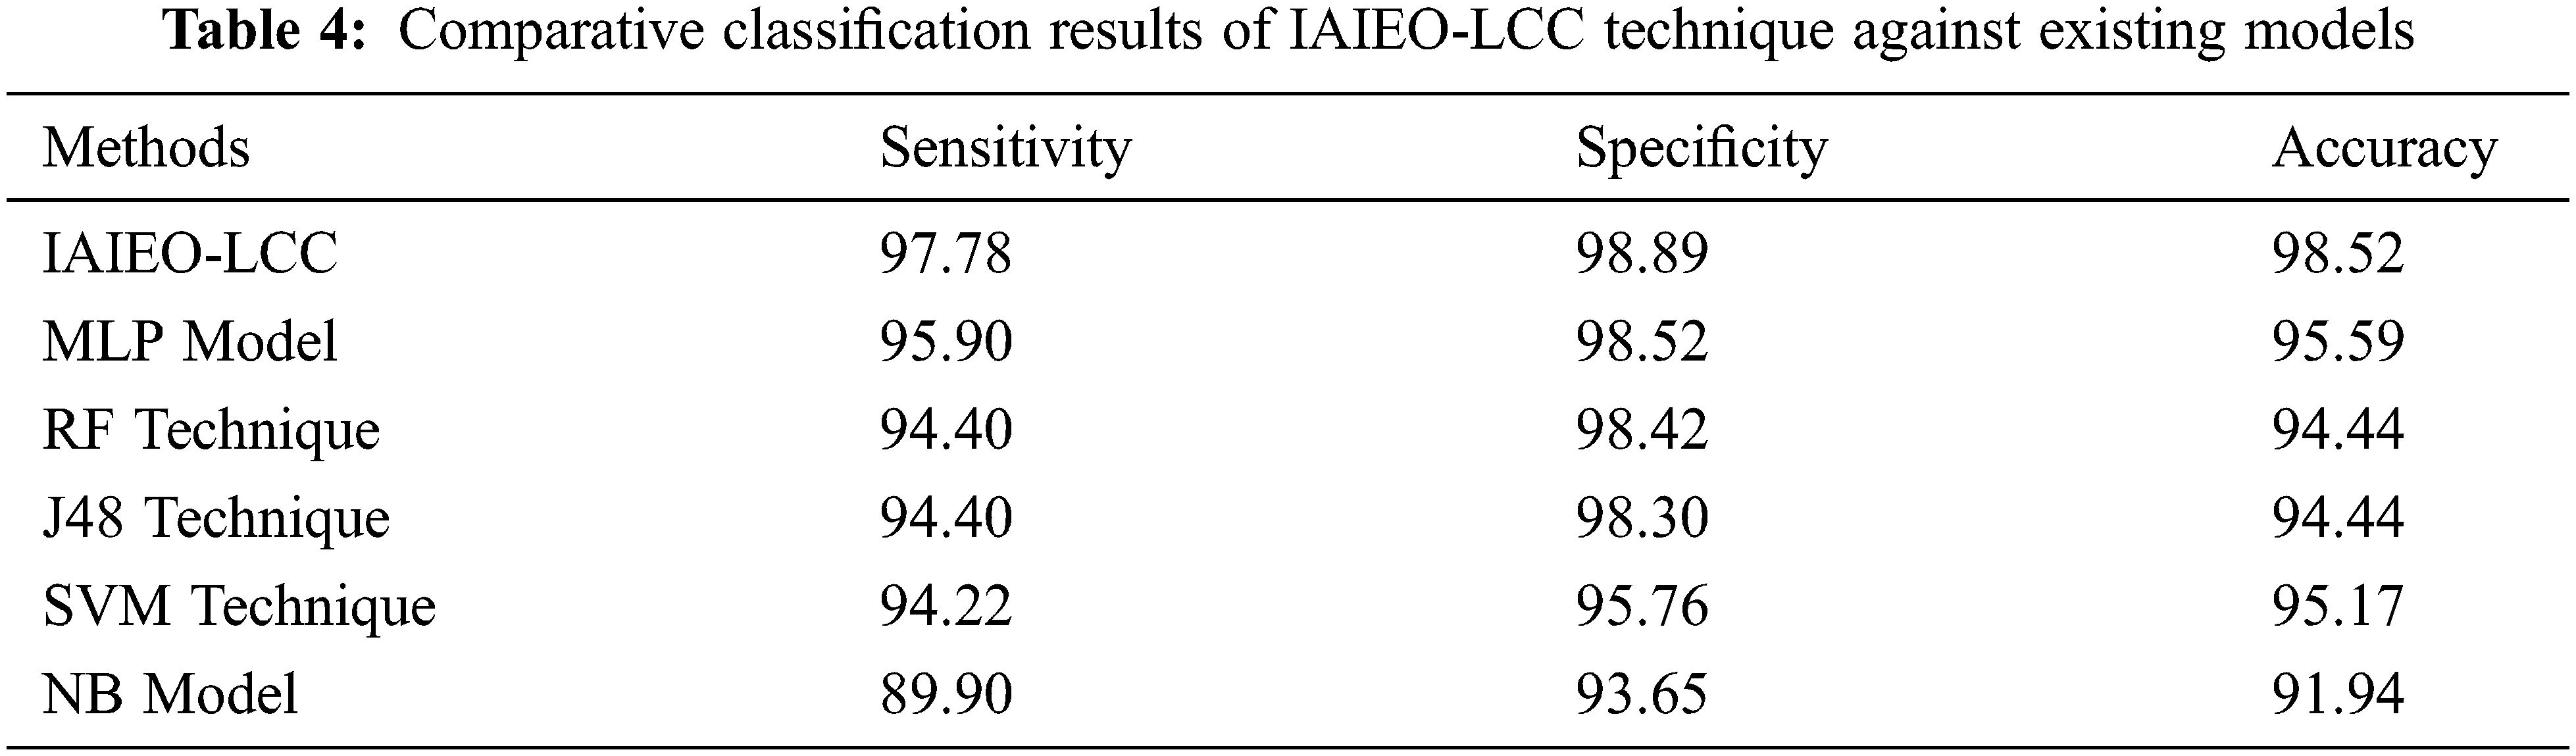

Figure 10: Comparative
Fig. 11 exemplifies the comparison study results of IAIEO-LCC technique against existing approaches with respect to

Figure 11: Comparative
Finally, Fig. 12 illustrates the comparison study results of IAIEO-LCC technique against other methods in terms of

Figure 12: Comparative
In this study, an effective IAIEO-LCC technique has been developed to differentiate various classes of liver cancer images. The presented IAIEO-LCC technique primarily undergoes MF-based noise elimination, data augmentation, KE-based segmentation, VGG-19 based feature extraction, EO-based hyperparameter tuning, and SGRU-based classification. SGRU classifier is exploited to detect and classify the liver cancer images effectively. In order to demonstrate the superiority of the proposed IAIEO-LCC technique in terms of performance, a wide range of simulations was conducted and the results were inspected under distinct measures. The experimental results established the superiority of the proposed IAIEO-LCC technique over recent approaches. Thus, IAIEO-LCC technique can be utilized for the classification of liver cancer images. In future, deep instance segmentation approaches can be followed to improve the detection performance of IAIEO-LCC technique.
Acknowledgement: The Deanship of Scientific Research (DSR) at King Abdulaziz University, Jeddah, Saudi Arabia has funded this project, under grant no. (FP-206-43). The authors, therefore acknowledge with thanks DSR for technical and financial support.
Funding Statement: The Deanship of Scientific Research (DSR) at King Abdulaziz University, Jeddah, Saudi Arabia has funded this project, under grant no. (FP-206-43).
Conflicts of Interest: The authors declare that they have no conflicts of interest to report regarding the present study.
1. A. B. Cohen, I. Diamant, E. Klang, M. Amitai and H. Greenspan, “Fully convolutional network for liver segmentation and lesions detection,” in Deep Learning and Data Labeling for Medical Applications, DLMIA 2016, LABELS 2016. Lecture Notes in Computer Science, vol. 10008, Cham: Springer, pp. 77–85, 2016. [Google Scholar]
2. N. Nanda, P. Kakkar and S. Nagpal, “Computer-aided segmentation of liver lesions in CT scans using cascaded convolutional neural networks and genetically optimised classifier,” Arabian Journal for Science and Engineering, vol. 44, no. 4, pp. 4049–4062, 2019. [Google Scholar]
3. D. Liang, Y. Xu, L. Lin, N. Zhou, H. Hu et al., “CasCRNN-GL-Net: Cascaded convolutional and recurrent neural networks with global and local pathways for classification of focal liver lesions in multi-phase CT images,” Communications in Information and Systems, vol. 20, no. 4, pp. 415–442, 2020. [Google Scholar]
4. F. Özyurt, T. Tuncer, E. Avci, M. Koç and İ. Serhatlioğlu, “A novel liver image classification method using perceptual hash-based convolutional neural network,” Arabian Journal for Science and Engineering, vol. 44, no. 4, pp. 3173–3182, 2019. [Google Scholar]
5. S. M. Anwar, M. Majid, A. Qayyum, M. Awais, M. Alnowami et al., “Medical image analysis using convolutional neural networks: A review,” Journal of Medical Systems, vol. 42, no. 11, pp. 226, 2018. [Google Scholar]
6. B. Sahiner, A. Pezeshk, L. M. Hadjiiski, X. Wang, K. Drukke et al., “Deep learning in medical imaging and radiation therapy,” Medical Physics, vol. 46, no. 1, pp. e1–e36, 2019. [Google Scholar]
7. H. C. Shin, H. R. Roth, M. Gao, L. Lu, Z. Xu et al., “Deep convolutional neural networks for computer-aided detection: Cnn architectures, dataset characteristics and transfer learning,” IEEE Transactions on Medical Imaging, vol. 35, no. 5, pp. 1285–1298, 2016. [Google Scholar]
8. W. Wang, Y. Iwamoto, X. Han, Y. W. Chen, Q. Chen et al., “Classification of focal liver lesions using deep learning with fine-tuning,” in Proc. of the 2018 Int. Conf. on Digital Medicine and Image Processing, Okinawa Japan, pp. 56–60, 2018. [Google Scholar]
9. X. Dong, Y. Zhou, L. Wang, J. Peng, Y. Lou et al., “Liver cancer detection using hybridized fully convolutional neural network based on deep learning framework,” IEEE Access, vol. 8, pp. 129889–129898, 2020. [Google Scholar]
10. S. Naeem, A. Ali, S. Qadri, W. K. Mashwani, N. Tairan et al., “Machine-learning based hybrid-feature analysis for liver cancer classification using fused (MR and CT) images,” Applied Sciences, vol. 10, no. 9, pp. 3134, 2020. [Google Scholar]
11. B. Mao, J. Ma, S. Duan, Y. Xia, Y. Tao et al., “Preoperative classification of primary and metastatic liver cancer via machine learning-based ultrasound radiomics,” European Radiology, vol. 31, no. 7, pp. 4576–4586, 2021. [Google Scholar]
12. L. Ding, X. Zhang, D. Wu and M. Liu, “Application of an extreme learning machine network with particle swarm optimization in syndrome classification of primary liver cancer,” Journal of Integrative Medicine, vol. 19, no. 5, pp. 395–407, 2021. [Google Scholar]
13. S. Rajesh, N. A. Choudhury and S. Moulik, “Hepatocellular carcinoma (HCC) liver cancer prediction using machine learning algorithms,” in 2020 IEEE 17th India Council Int. Conf. (INDICON), New Delhi, India, pp. 1–5, 2020. [Google Scholar]
14. M. Chen, B. Zhang, W. Topatana, J. Cao, H. Zhu et al., “Classification and mutation prediction based on histopathology H&E images in liver cancer using deep learning,” NPJ Precision Oncology, vol. 4, no. 1, pp. 14, 2020. [Google Scholar]
15. R. Panthong and A. Srivihok, “Liver cancer classification model using hybrid feature selection based on class-dependent technique for the central region of thailand,” Information, vol. 10, no. 6, pp. 187, 2019. [Google Scholar]
16. M. A. Basset, V. Chang and R. Mohamed, “A novel equilibrium optimization algorithm for multi-thresholding image segmentation problems,” Neural Computing and Applications, vol. 33, no. 17, pp. 10685–10718, 2021. [Google Scholar]
17. M. Mateen, J. Wen, Nasrullah, S. Song and Z. Huang, “Fundus image classification using vgg-19 architecture with PCA and SVD,” Symmetry, vol. 11, no. 1, pp. 1, 2018. [Google Scholar]
18. M. A. Basset, V. Chang and R. Mohamed, “A novel equilibrium optimization algorithm for multi-thresholding image segmentation problems,” Neural Computing and Applications, vol. 33, no. 17, pp. 10685–10718, 2021. [Google Scholar]
19. A. Faramarzi, M. Heidarinejad, B. Stephens and S. Mirjalili, “Equilibrium optimizer: A novel optimization algorithm,” Knowledge-Based Systems, vol. 191, pp. 105190, 2020. [Google Scholar]
20. J. Xie, H. Zhang, L. Liu, M. Li and Y. Su, “Decomposition-based multistep sea wind speed forecasting using stacked gated recurrent unit improved by residual connections,” Complexity, vol. 2021, no. 10, pp. 1–14, 2021. [Google Scholar]
21. A. Das, U. R. Acharya, S. S. Panda and S. Sabut, “Deep learning based liver cancer detection using watershed transform and Gaussian mixture model techniques,” Cognitive Systems Research, vol. 54, no. 3–4, pp. 165–175, 2019. [Google Scholar]
22. S. Naeem, A. Ali, S. Qadri, W. K. Mashwani, N. Tairan et al., “Machine-learning based hybrid-feature analysis for liver cancer classification using fused (MR and CT) images,” Applied Sciences, vol. 10, no. 9, pp. 3134, 2020. [Google Scholar]
 | This work is licensed under a Creative Commons Attribution 4.0 International License, which permits unrestricted use, distribution, and reproduction in any medium, provided the original work is properly cited. |