DOI:10.32604/csse.2023.026976
| Computer Systems Science & Engineering DOI:10.32604/csse.2023.026976 | |
| Article |
Gamma Correction for Brightness Preservation in Natural Images
1IKG Punjab Technical University, Kapurthala, Punjab, India
2DAV Institute of Engineering & Technology, Jalandhar, 144008, Punjab, India
*Corresponding Author: Navleen S Rekhi. Email: rekhinavleen@yahoo.com
Received: 07 January 2022; Accepted: 30 March 2022
Abstract: Due to improper acquisition settings and other noise artifacts, the image degraded to yield poor mean preservation in brightness. The simplest way to improve the preservation is the implementation of histogram equalization. Because of over-enhancement, it failed to preserve the mean brightness and produce the poor quality of the image. This paper proposes a multi-scale decomposition for brightness preservation using gamma correction. After transformation to hue, saturation and intensity (HSI) channel, the 2D- discrete wavelet transform decomposed the intensity component into low and high-pass coefficients. At the next phase, gamma correction is used by auto-tuning the scale value. The scale is the modified constant value used in the logarithmic function. Further, the scale value is optimized to obtain better visual quality in the image. The optimized value is the weighted distribution of standard deviation-mean of low pass coefficients. Finally, the experimental result is estimated in terms of quality assessment measures used as absolute mean brightness error, the measure of information detail, signal to noise ratio and patch-based contrast quality in the image. By comparison, the proposed method proved to be suitably remarkable in retaining the mean brightness and better visual quality of the image.
Keywords: Natural and aerial images; wavelet transform; gamma correction; brightness preservation
The rapid development of advanced imaging gadgets is helpful to get images, be it from a cell phone camera, digital camera, or scanner [1]. Digital imaging has become as common as word processing. Such developments have shown their uses in a large community that works productively in photography, web-based media and TV programs. The scene captured by optical imaging gadgets is often dull due to many reasons like improper light conditions, atmospheric noise, improper camera settings, or other noise artifacts The Fig. 1a is an example where the attribute (contrast and brightness) in an image are concentrated narrowly to either part of the intensity scale of the histogram. Due to poor illumination, the image is affected by low contrast. For an image with non-uniform illumination, enhancement plays a significant role to extract details and processing the information. The enhancement is a process to manipulate the pictorial information to improve the contrast while preserving the mean brightness. For an image to yield high contrast, it must produce a uniform distribution of intensity values across the scale [2]. It can be achieved with a linear technique of stretching the intensity scale by piece-wise linear contrast stretching [3]. By linearity, it means the intensity values are uniformly distributed for each channel of red, green and blue (sRGB) space. The approach of contrast stretching distributes the histogram values across the intensity scale. Fig. 1b is the resultant image of the piece-wise contrast stretching technique. Even the histogram values are stretched across the intensity scale, the final image is degraded with saturation effects. The non-linear transformation techniques are also used to avoid saturation effects in images. The functions like logarithmic, exponential, sigmoid and gamma correction [4] are known to point-processing techniques for quality improvement of an image.
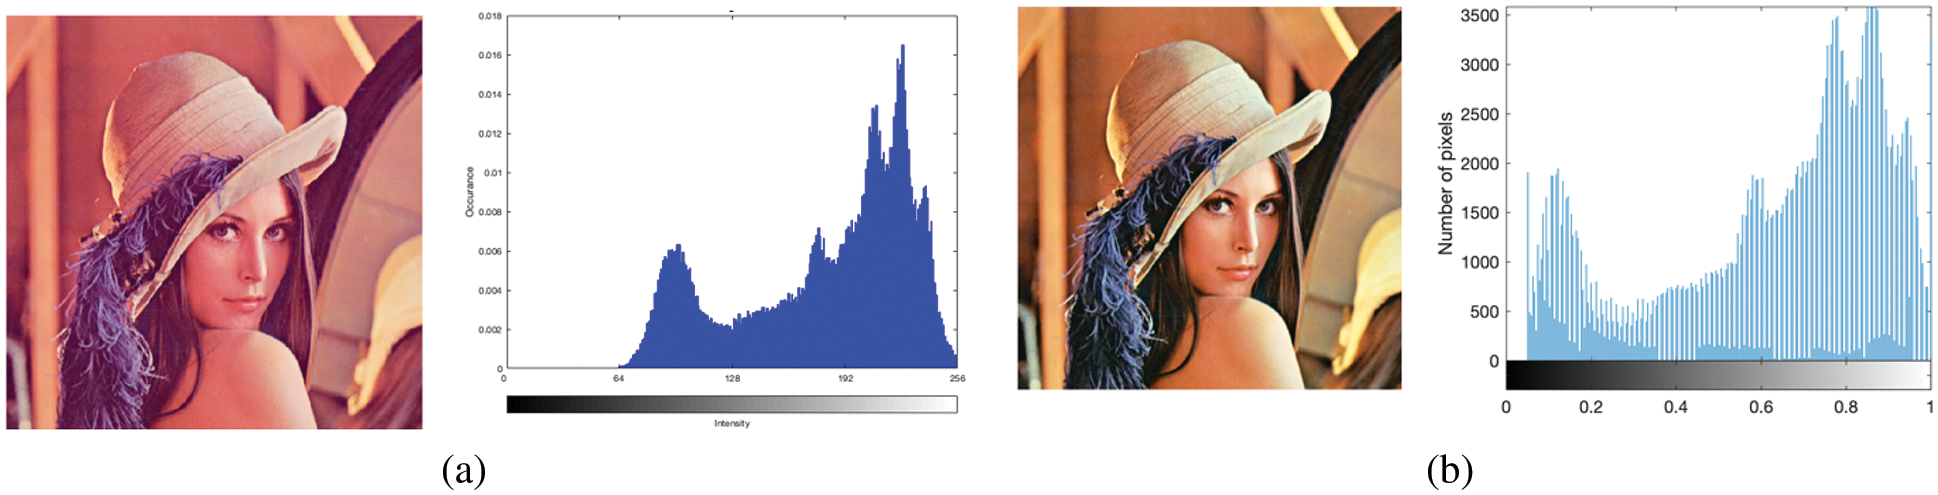
Figure 1: (a) Reference Image and (b) Enhanced image by Piecewise linear stretch
The use of the logarithmic function expands the dark region and limits the light portion of the intensity scale. The exponential enhances the intensity scale of bright region and decreases it vice-versa. This causes the smoothing artifact and thus the image is degraded with washed-out effect. Lastly, gamma correction is the simplest approach to preserve the brightness. The challenging task in gamma correction is the selection of scale values and is a time-consuming approach. In this paper, the adaptive gamma correction is presented for brightness preservation in the image. The proposed work is the wavelet-based approach with the adjustable scale of gamma correction. The contribution of the paper is as follows: (a) Obtained luminance from multi-scale wavelet transform, (b) estimated scale parameter from the adaptive logarithmic scale function, (c) auto-tuning the scale calculated from the weighted distribution of mean-standard deviation. The proposed method is evaluated from the available datasets of USC-SIPI (including aerial images) and Kodak images. The experimental results showed the effectiveness in terms of brightness preservation and the improved contrast quality of the reconstructed image.
The most popular image enhancement technique is the histogram equalization (HE). It is non-linear transformation that produces the uniform histogram to obtain distribution of pixel values. It computes the cumulative histogram to generate mapping function. Despite the simplicity in implementation, the enhanced image shows over-enhancement with visual artifacts. To overcome limitation, numerous modifications are introduced to alter the framework of HE technique. Based on the comparison of different histogram techniques, as claimed by Patel et al. [5] and Patel et al. [6] it was concluded that bi Histogram approach proposed by Ibrahim et al. [7] is the best suited for image enhancement. Also, the other way to improve HE is proposed by Tan et al. [8]. It is based on exposure based multi-histogram technique. The entropy value is used to compute the new mapping function. The entropy of the image largely varies for different images. Hence, the improvement in image would introduce saturation effects in the reconstructed image. The global and local contrast enhancement are the other effective techniques to improve the quality in the image. With the fusion of global and local contrast method, Tian et al. [9] produced the enhanced image. Based on quality measure, the method is proved to be effective in improving the contrast in the picture. But, with the improvement in contrast, brightness is not well preserved. With the transformation to YCbCr model, the automated gamma correction is proposed by Cao et al. [10]. The fusion of original and negative of the reference image showed improved contrast with minimal preservation in illumination.
Alternately, the sigmoid function is the ‘S-shaped convergence to produce smooth transitions between the intensities. Using the same property, Arriaga-Garcia et al. [11] used the sigmoid while computing the sub-histogram. Instead of computing the cumulative density function, the sigmoid clipped the aberrant peaks for a smooth transition between the high-intensity values. A similar approach is used by Srinivas et al. [12] to improve the contrast in the images. But, the limitation in these approaches is to manually control the gain factor of the sigmoid function.
In consumer electronics and remote sensing images, the brightness is required to improve the visual quality of the image with minimum computational complexity. In the proposed algorithm, the purpose is to preserve the mean brightness for better visual appearance of the image. In most of the recent algorithms, the method based on HE is proposed for preserving the brightness. However, the over-enhancement results into saturation effects. From the above discussion, it is also concluded that auto-tune of brightness preservation still presents a challenging task. The method of adaptive gamma correction based on logarithmic scale is implemented. The adaptive approach effectively produces a pleasing quality of the image. This section of the paper is followed by the proposed method, estimation of adaptive gamma scale, image quality metrics and the experimental results. Finally, the paper is concluded with the future scope of the proposed algorithm.
In this section, the flow diagram shown in Fig. 2 presented the brightness preserving algorithm. Firstly, the reference image is transformed into HSI channel. The transformation is necessary since it is difficult to process the RGB channels separately. Moreover, the color saturation degraded the enhanced image. From HSI, hue and saturation are kept unchanged and the intensity component is further processed. Secondly, the intensity component is analyzed by 2D-discrete wavelet transform to obtain low-low pass (LL/approximation) coefficients. The scale value of gamma is computed from ‘LL’ coefficients. The model proposed by Veluchamy et al. [13] computed the gamma scale parameter as a weighted distribution with respect to threshold values. Thirdly, the scale parameter is computed from the inverse of the logarithmic function. The exaggerated value of scale is down-sampled to obtain an optimal balance between brightness and contrast in the enhanced image. Further, the confidence factor is computed from the weighted average mean-standard deviation of the reference image. This factor optimally controls the intensity of the gamma scale for optimal balance in contrast to the enhanced image. Lastly, the gamma correction is implemented on the intensity component. It may be noted that scale value is self-tuned for individual images. Hence, the process is termed to be adjustable gamma correction.
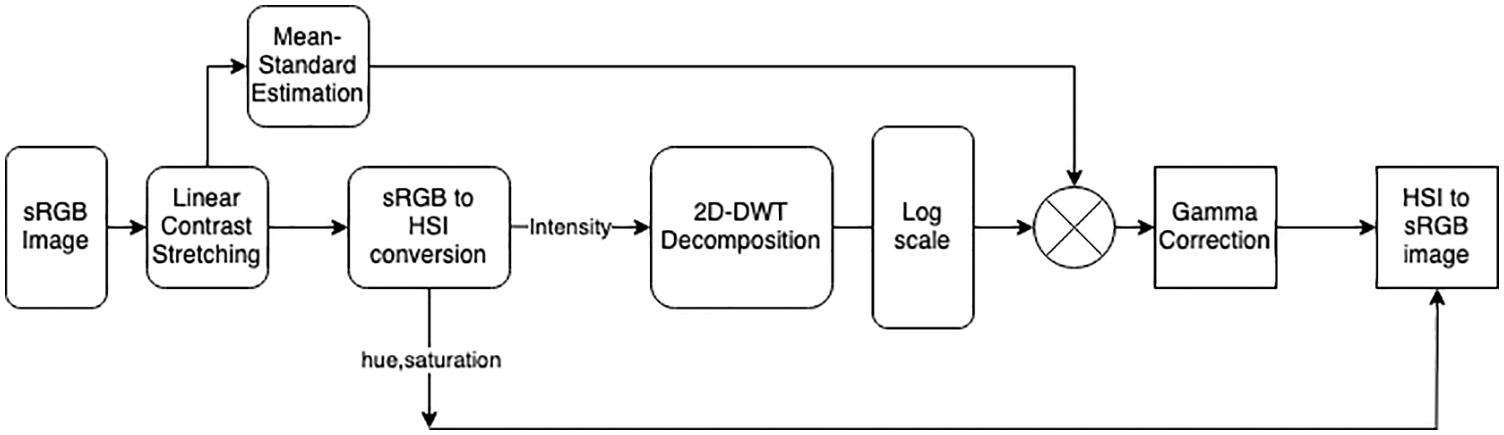
Figure 2: Flow Diagram of the proposed method
Initially, the magnitude of each color of input image is linearly stretched for permissible values. After stretching, the input image is transformed to hue, saturation and intensity channel (HSI). The intensity component has the maximal luminance of RGB color space is obtained as:
3.2 2D-Discrete Wavelet Transform
The wavelets in the image could be seen as the content of both spatial and frequency coordinates [14]. It decomposes the information into sub-bands comprised of high and low pass coefficients. The band ‘LL’ is an approximation of low pass filter and the other variants consists of high pass sub-bands in horizontal, vertical and diagonal directions. The intensity part in HSI channel space is used for wavelet decomposition. The one-level 2D- discrete wavelet transform (DWT) decomposition is implemented using mother wavelet as ‘sym4’. In most of the recent published work, wavelet is looked upon as fusion method. But, in our work, DWT is processed to estimate the scale parameter from the approximation coefficients. The coefficients are obtained as follows:
where
The gamma correction is the non-linear transformation that scales the intensity values by the combination logarithmic and exponential function. In this framework, scale parameter is designed from wavelet decomposition of intensity component and reference image.
3.3.1 Choice of Scale Parameter
The individual pixel has a brightness level that ranges from 0 to 1. The ‘0’ indicates the darkest and ‘1’ is for the brightest level in the image. Since digital cameras are not able to acquire accurate luminance, so the approach of gamma is used to scale the brightness while improving the quality of the image. It is an alternate approach to both logarithmic and exponential functions. The non-linear transformation is given as:
‘Jm’ indicates the maximum intensity in the luminance component,
To avoid successive expansion in scale value, confidence scale (Cs) is used to produce adjustable gamma correction. The Cs is defined as the statistical average of weighted distribution of mean and standard deviation of the contrast stretched image. The given relation is defined as:
I′(x, y) and I′′(x, y) are the mean and standard deviation computed from the total of 100 reference images from USC-SIPI [15], aerial and Kodak datasets [16]. The final scale parameter is obtained as: γ = ξ − Cs. The preposition is to improve the visual quality in the image. The effect of the Eq. (5) on the performance of the proposed method is displayed in Fig. 3. The score of absolute mean brightness error (AMBE) and patch-based contrast quality index (PCQI) clearly showed the improvement in both visual and quantitative analysis. Finally, the gamma correction is implemented with the given relation as below:
where
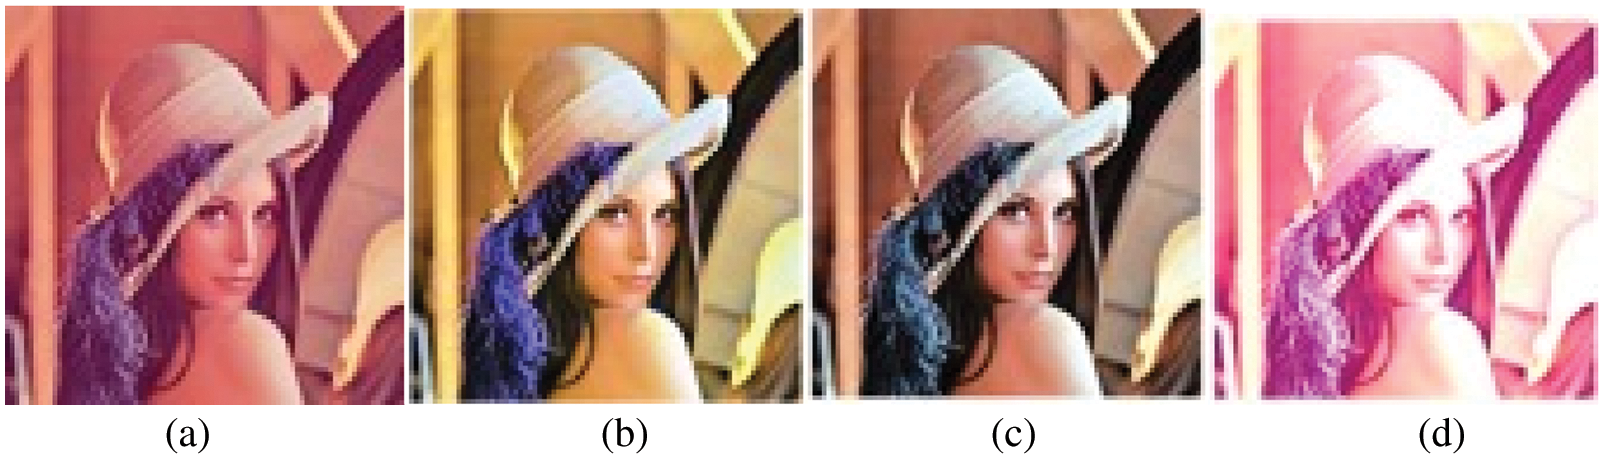
Figure 3: Effect of confidence scale on reference image, (a): reference image, (b): without Cs (AMBE: 13.26, PCQI:0.78) and (c): with Cs (AMBE:0.97, PCQE:0.97) and (d) conventional gamma correction (AMBE: 127.2, PCQI:0.65)
The flow process of the proposed method as image decomposition based on gamma correction for brightness preserving (IDGB) is summarized as below:
Step I: Contrast (Piecewise linear) stretching for uniform colour distribution from the minimum and maximum intensity in the reference image.
Step II: Conversion of sRGB to HSI channel space as stated in Eq. (1)
Step III: Decompose the ‘I’ component using 2D- discrete wavelet transform (keeping hue and saturation unchanged). From Eqs. (2) and (3)
Step IV: Estimate the scale parameter from image decomposition (Eq. (4)) and confidence scale from contrast stretched image (Eq. (5))
Step V: Implement gamma correction as stated in Eq. (6) on the luminance component
Step VI: The final enhanced image is obtained after conversion to sRGB channel.
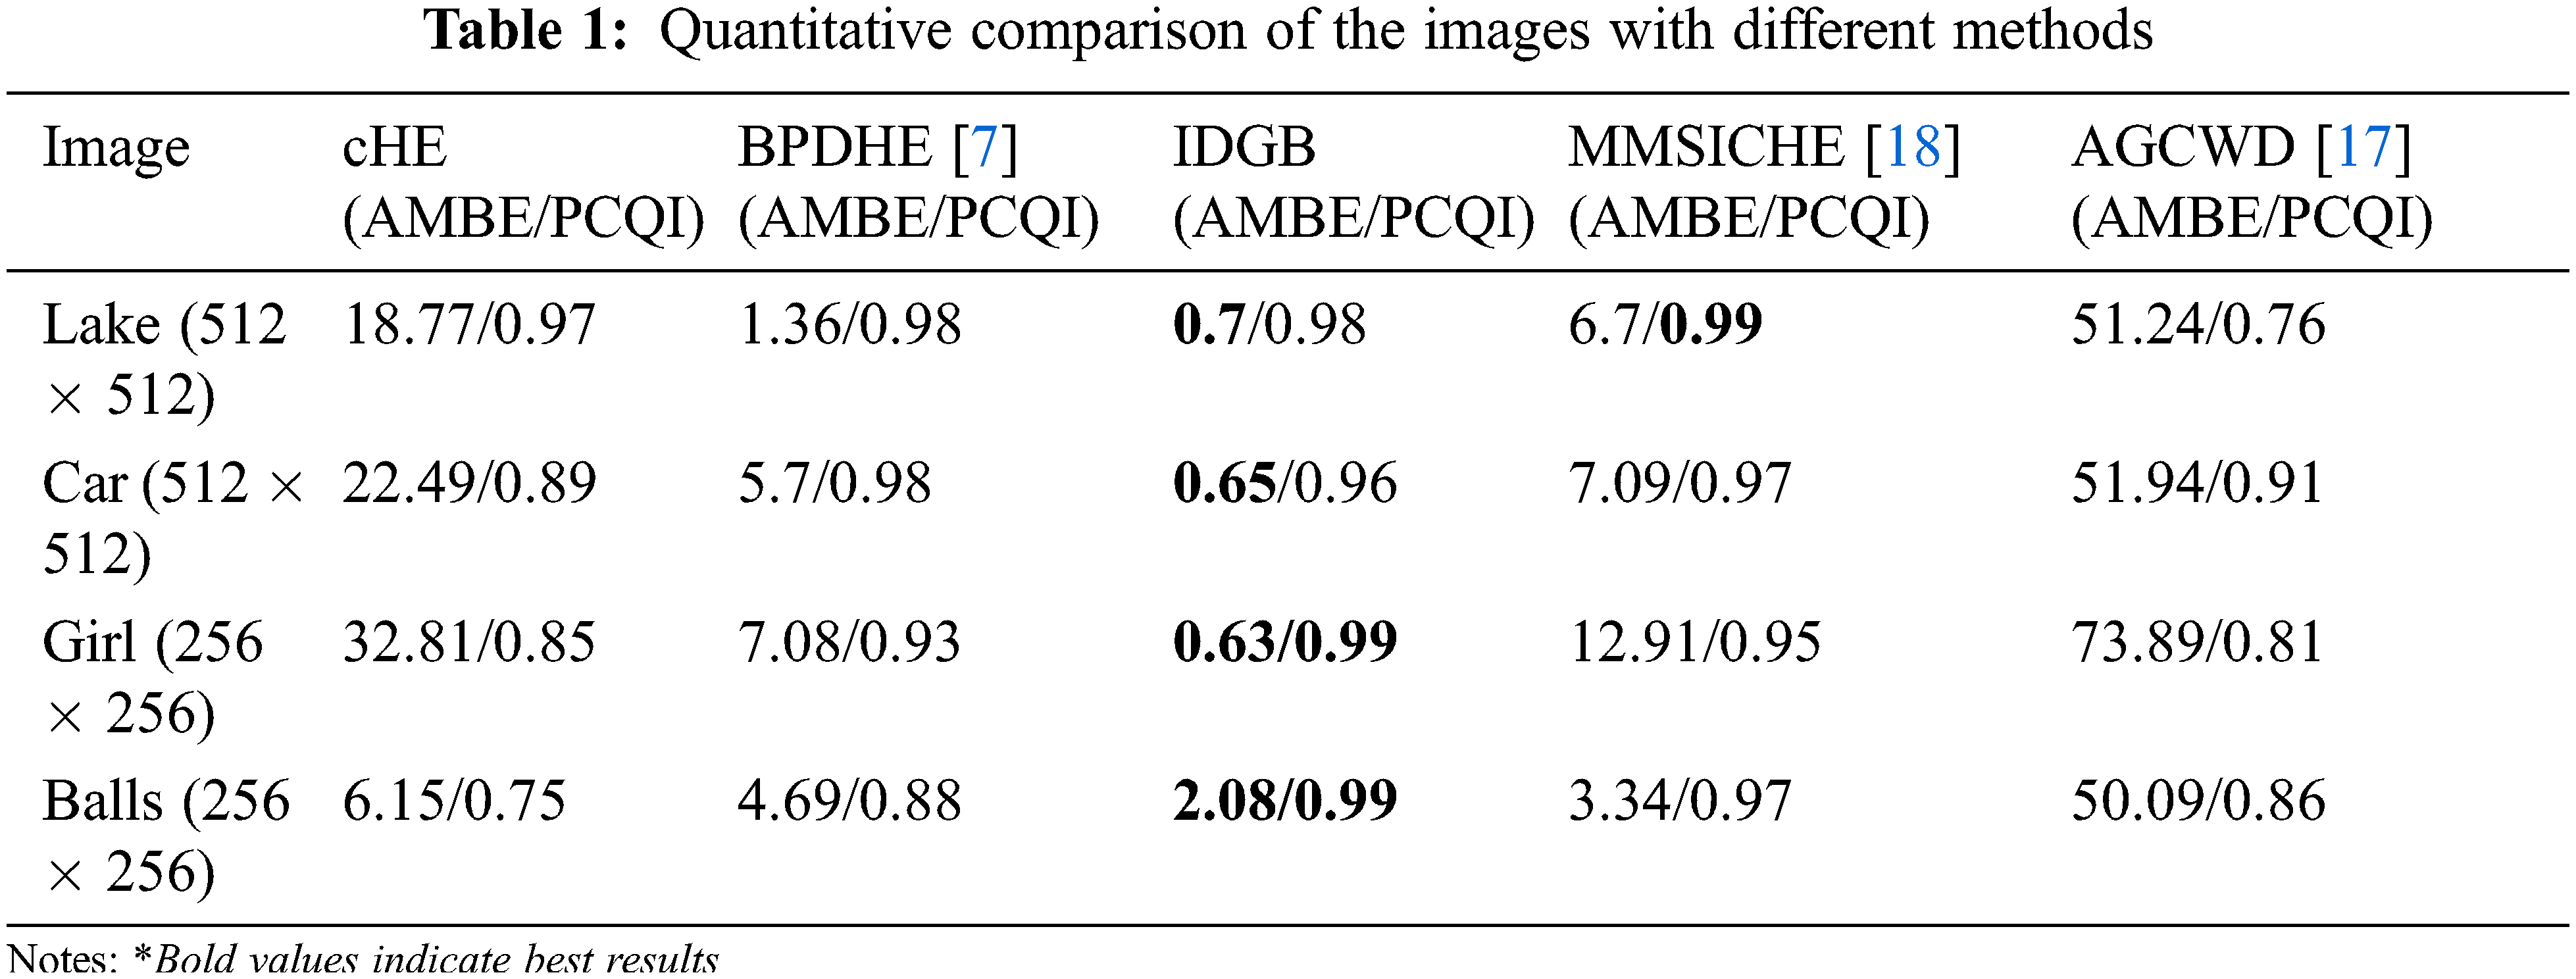
The quality assessment is used to quantify the visual appearance obtained from the enhanced image. With careful observation of published algorithms (reference to the Tabs. 1 and 3), the peak signal to noise ratio (PSNR), AMBE, PCQI and entropy (E) is chosen as a performance measures. The proposed method is compared with conventional HE (cHE), brightness preserving dynamic HE (BPDHE) [7], adaptive gamma weighted distribution (AGCWD) [17] and median-mean clipped HE (MMSICHE) [18]. The experiments were conducted on image with size of 512 × 512 and 256 × 256 resolution.
The entropy is the measure of richness in the information detail. As the entropy increases, the richness in detail also increases. The measure of entropy is given as:
As shown in Fig. 4a, in comparison to reference entropy of 7.12, the IDGB recorded an average of 7.24. Whereas the other methods except BPDHE, showed the loss of hidden content in the image.
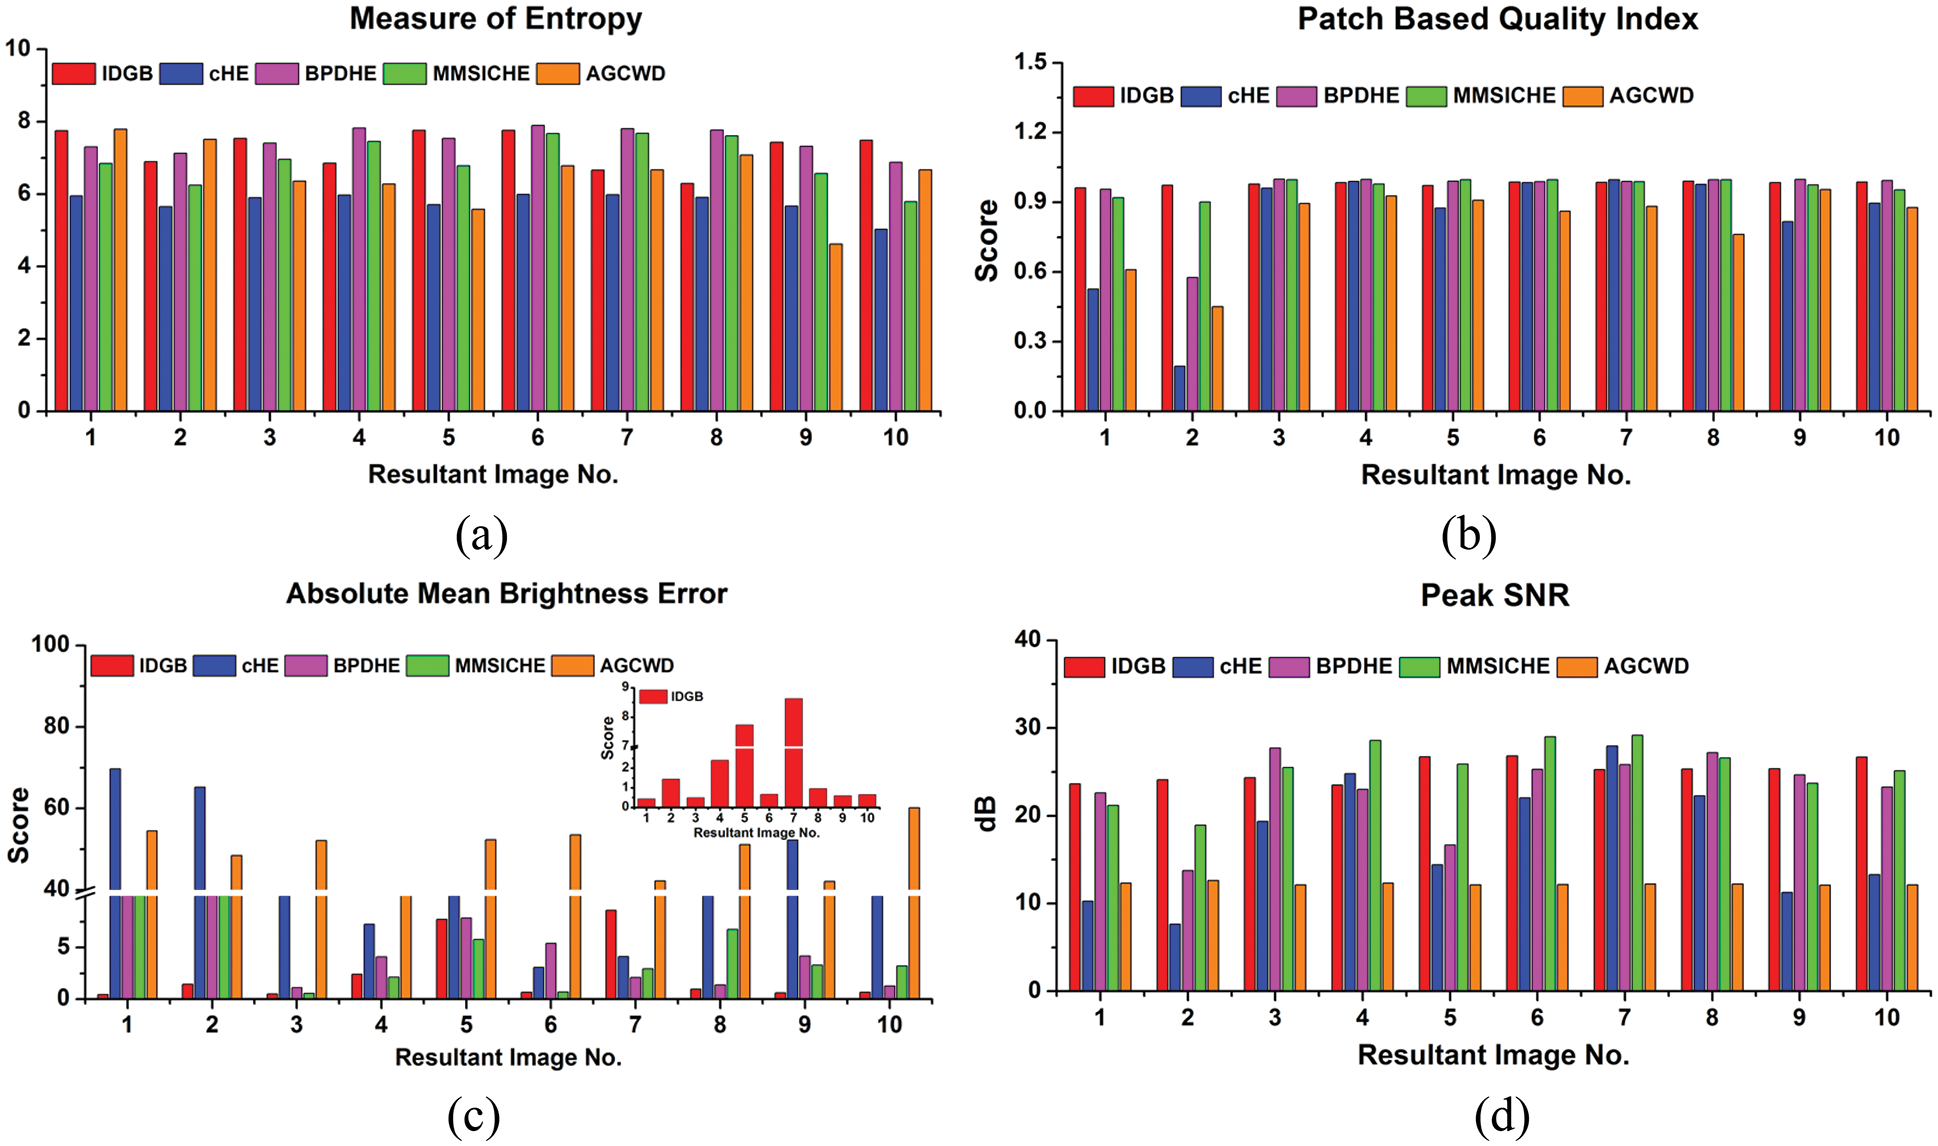
Figure 4: Image Quality Metrics (a) Entropy, (b) Patch-based Contrast Quality Index, (c) Absolute Mean Brightness Error and (d) Peak Signal-to-noise ratio
4.2 Patch Based Contrast Quality Index (PCQI)
Since contrast plays the significant role in estimating the quality of image. The PCQI is measured for the fidelity of the final image. It is a local patch-based approach which yields single value based on averaging of mean intensity, signal strength and structure of each patch. It could be seen clearly from Fig. 4b that the enhanced output produces high PCQI with an average value of 0.98.
4.3 Absolute Mean Brightness Error
It is the statistical approach to measure the performance in preserving brightness. It is evaluated by:
It is the popular method in quantification of brightness error. Any value of AMBE less than ‘20’ is considered to have better mean preservation of brightness. In our case, the minimum value of 0.43 and maximum of 8.62 (as shown in inset of Fig. 4c) is obtained.
4.4 Peak Signal to Noise Ratio
The other parameter used to predict the visual quality of image is peak signal to noise ratio [19]. Based on empirical calculation, it computes the effectiveness of the algorithm. Higher the value of peak signal to noise ratio, better will be the contrast enhancement.
It is given by the relation as:
where ‘max’ defines the maximum possible value that exist in the image and ‘mse’ is the mean square error. From Fig. 4d, the proposed method is able to produce better PSNR at dB level of 25.17.
While preserving the mean brightness, quality of the picture is also improved. From the random selection of ten images of USC-SIPI image dataset, it is shown that the method has the capability to produce better visual appearance of the image.
The standard database from USC-SIPI [15] is used as reference images. The color images are used with two different sizes as 512 × 512 and 256 × 256. The proposed method, IDGB is compared with the HE based modified algorithms and automated weighted gamma correction method. The results from these algorithms are computed with their default settings as prescribed in their original published work. The visual and qualitative analysis shown the efficacy of the proposed method.
5.1 Visual Analysis of USC-SIPI Dataset
The proposed method is implemented on a dataset of color images. As it is clear from Fig. 5, the reference image has the histogram values concentrated to the right side of the intensity scale. Hence, the image degrades with low contrast. On the other hand, the histogram values of the IDGB produce the distribution of histogram values across the intensity scale. The minimum deviation is observed (computed from median-based absolute deviation) in comparison to reference with IDGB image (shown at top of the histogram scales). With the improved contrast, the tonal quality had also been improved. With a minimum brightness error of 0.40, the visual quality (PCQI) is appreciably better at 0.97.
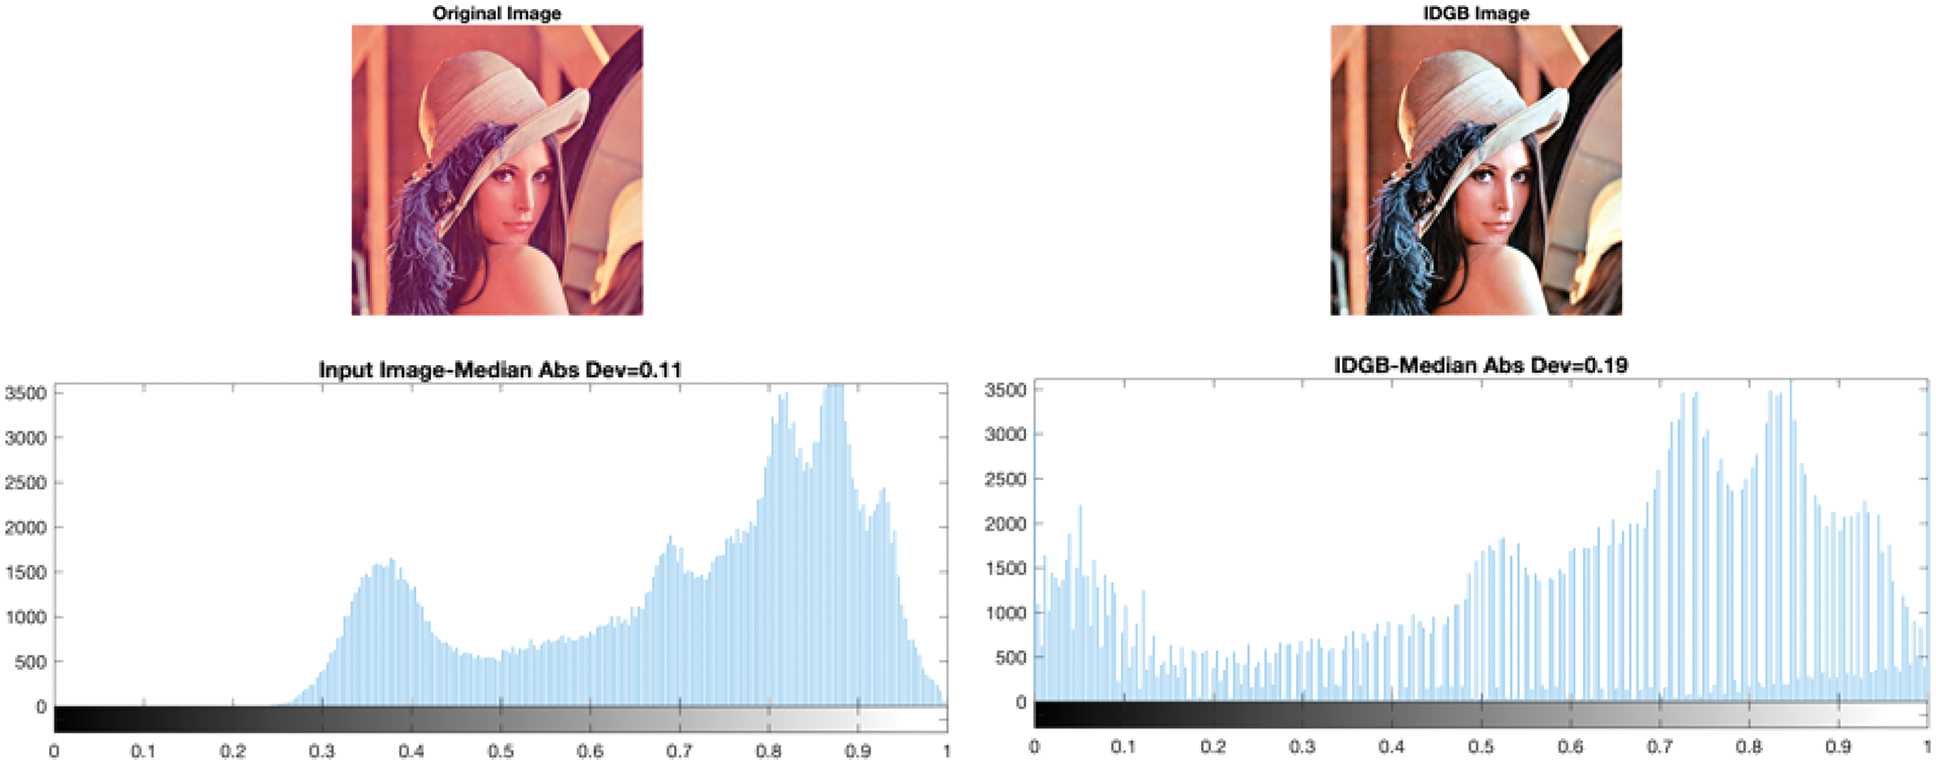
Figure 5: Left: Reference Low contrast image and Right: Enhanced (IDGB) image
The visual comparison shown in Fig. 6 showcased IDGB performance with other HE-based algorithms. It could be observed that the AGCWD [15] degraded the overall quality and is affected with over-enhancement. With improving in the contrast, MMSICHE [16] image was degraded due to pixel saturation. The pixel saturation is the scaling that caused one of the RGB channels to extend to its maximum value. In the case of conventional HE and BPDHE [7], the color saturation effects showed poor response in the final image. Whereas, in IDGB, the method improved the mean brightness without producing any visual artifacts.
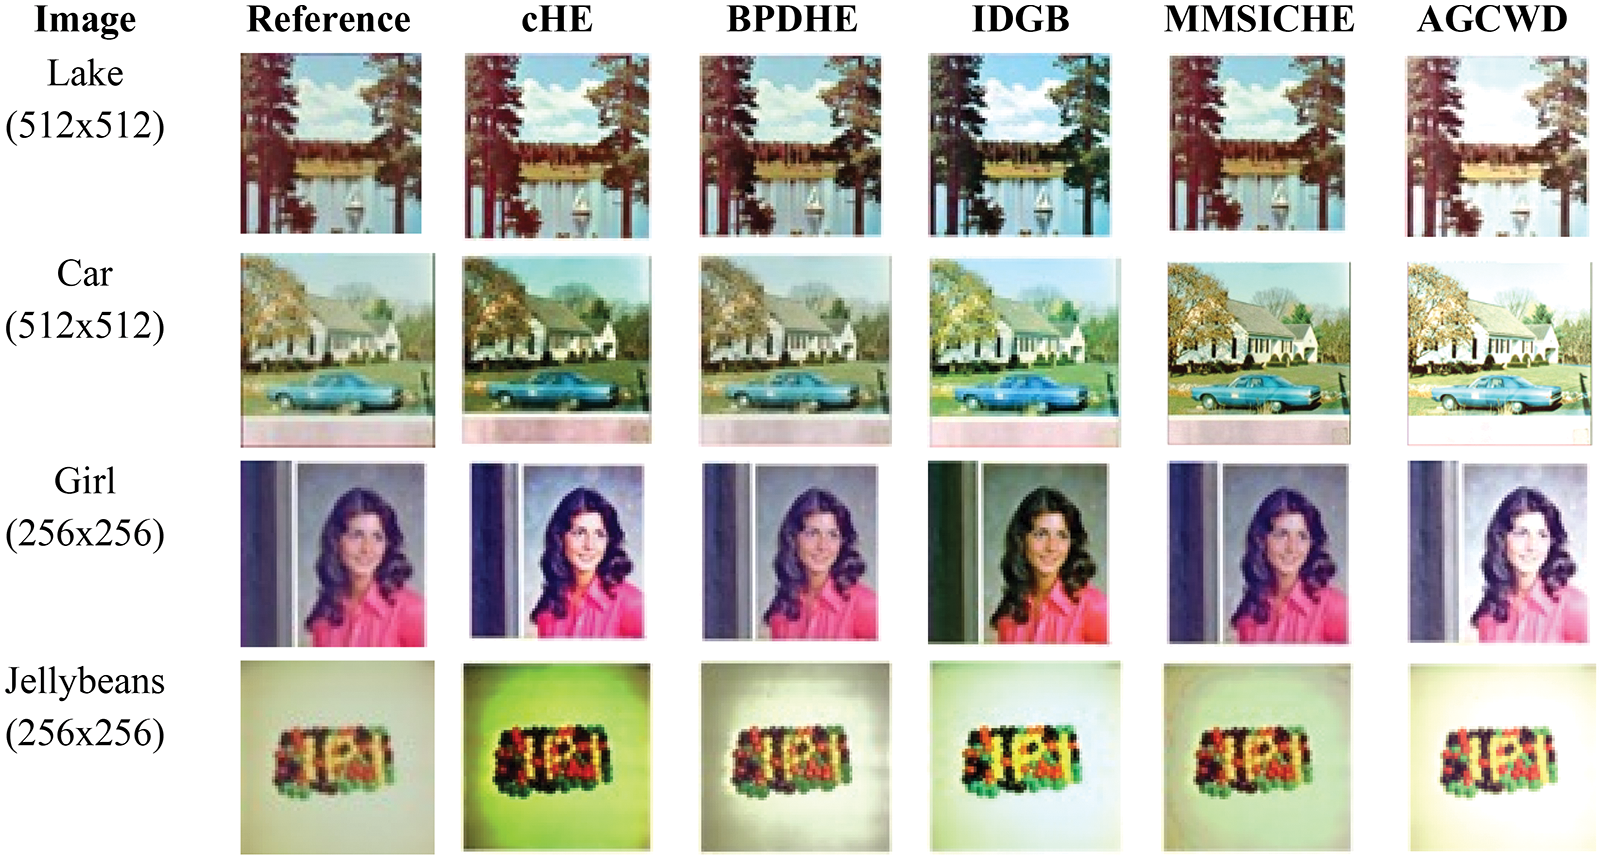
Figure 6: The visual comparison of the proposed method with other relevant HE techniques and gamma weighted distribution
Also, from Tab. 1, the proposed method (IDGB) out-performed over other methods in terms of preservation of mean brightness (AMBE) and better contrast quality (PCQI) of the images.
5.2 Comparison of USC-SIPI Dataset with Recent Published Algorithm
Since HE produces noise artifacts like pixel saturation and under/over enhancement in the resultant images, the details in the information retention become poor and thus degrades the quality of an image. Recently, Singh et al. [20] had proposed the modified approach of HE to preserve the mean brightness to improve the overall quality. The author claimed to minimize the histogram prickles by combining the gamma and logarithmic function (named CGL) to improve contrast. To provide scaling in the information entropy (Tab. 2), the author failed to minimize the over-brightness. It is clear from the Fig. 7, that with the poor preservation in brightness, the image showed low contrast. Similarly, the approach proposed by Wang et al. [21] showed over-enhancement. The method was based on bi-HE to uniformly distribute the pixel values across the intensity scale. The object in the image had clearly shown the ‘blur’ effect and washed-out of the grey scale represented in Fig. 7. From the viewpoint of Fig. 7, the visual appearance of balls and lady showed the over-enhancement, whereas that of ‘couple’ showed the under-enhancement.
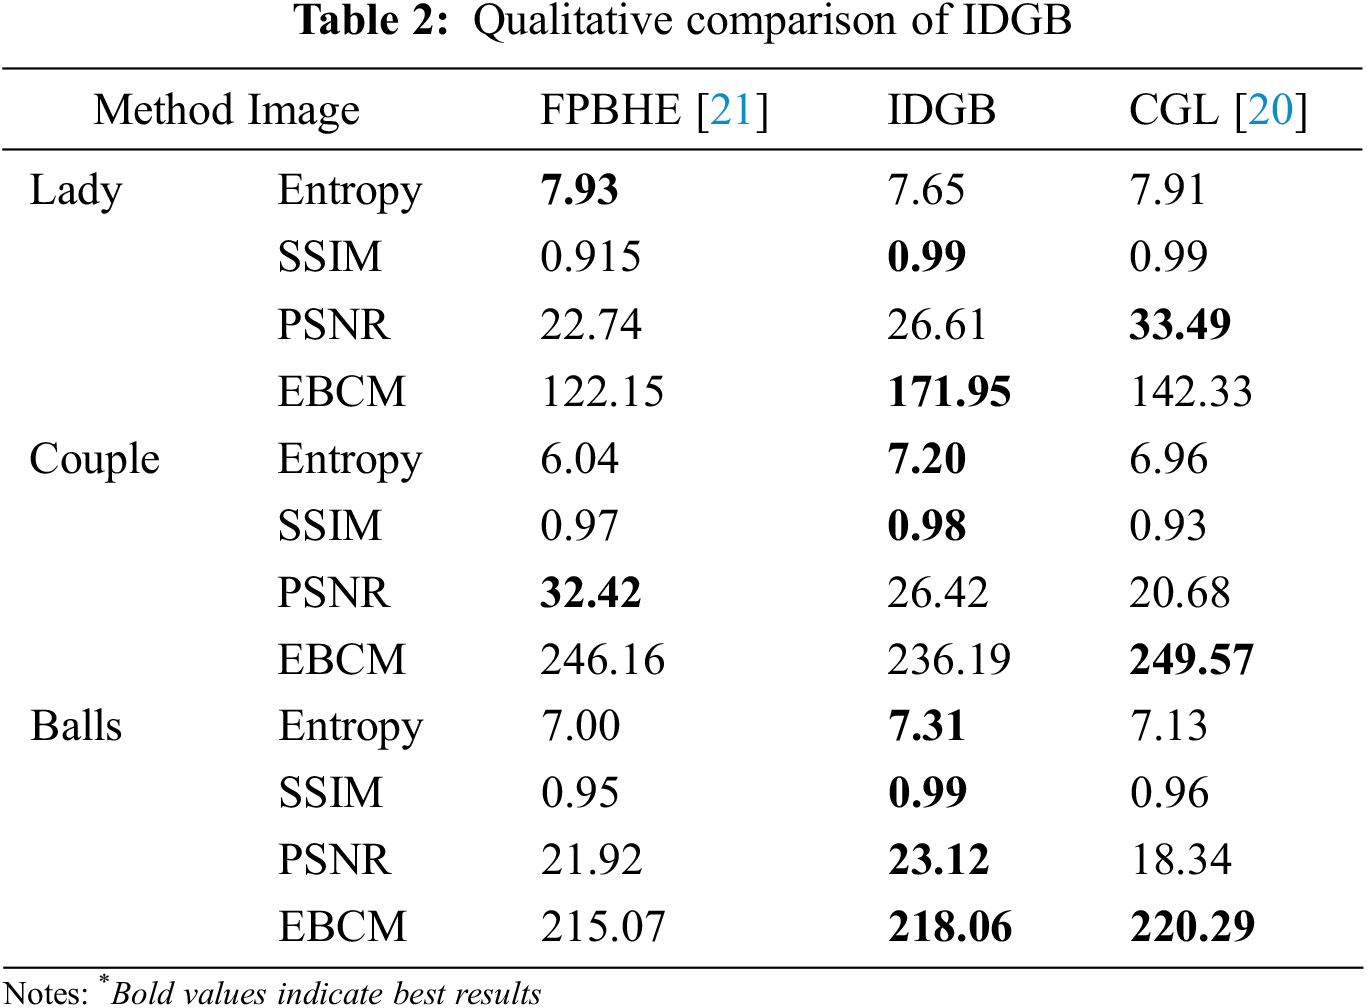
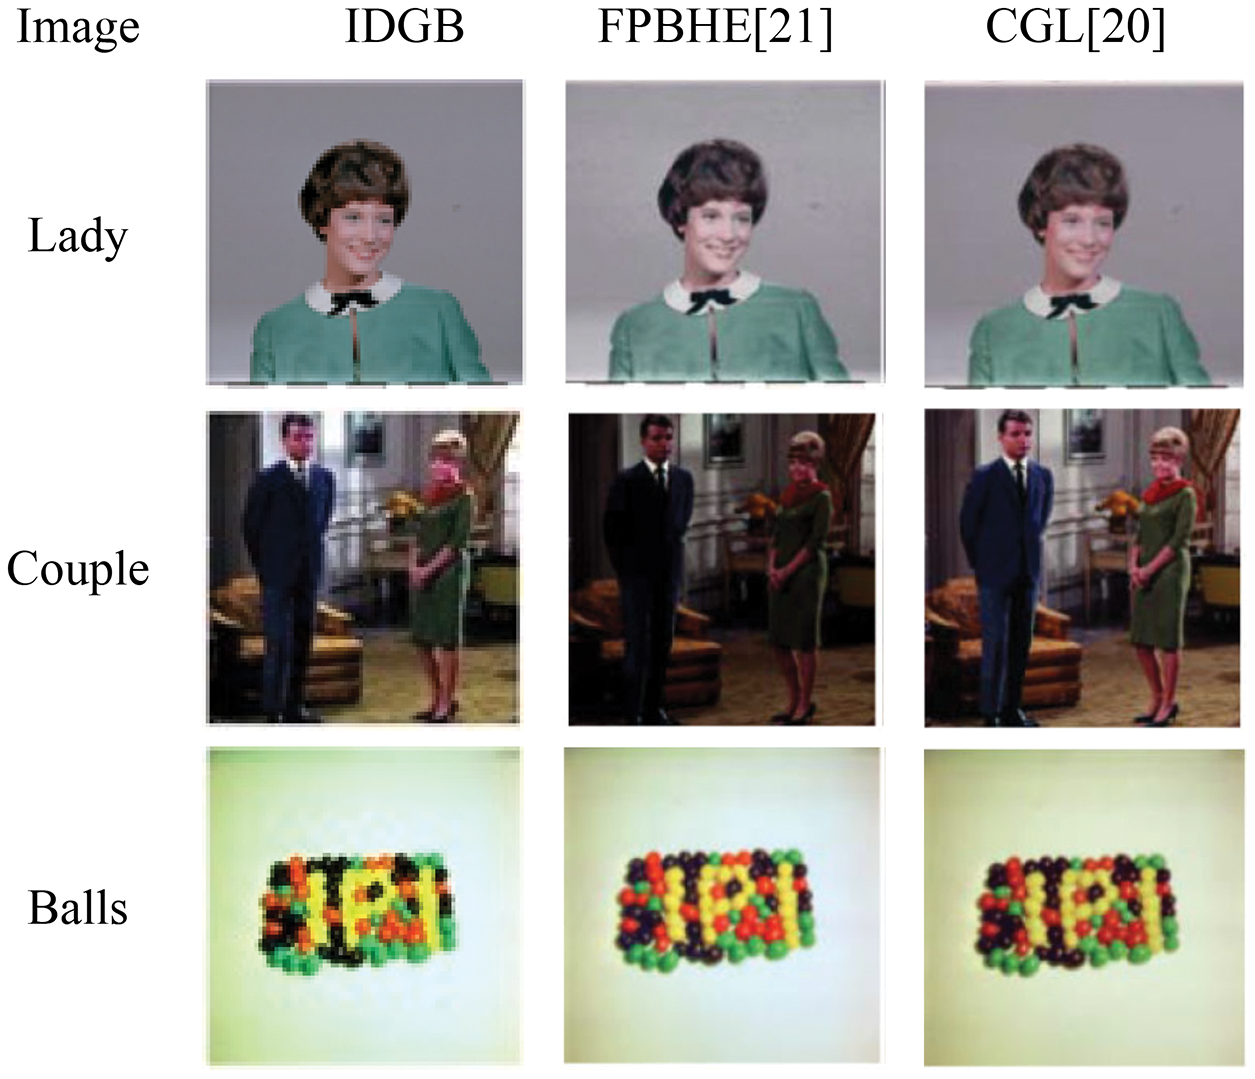
Figure 7: Comparison of IDGB with recent algorithms for the dataset of USC-SIPI
The qualitative metrics such as entropy, PSNR, structure similarity index (SSIM) and edge-based contrast measure are recorded. The tabulated results shown in Tab. 2 proved the efficacy of IDBG on improving the quality with preservation in mean brightness. For all the images, the proposed method had shown enriched detail of the information content (no information loss) and better structure similarity with other relevant approaches. Additionally, the appreciable value of the edge-based contrast measure outperformed the relevant methods.
Lastly, the performance of the IDGB may be summarized as the alternate approach to the HE based techniques. The recorded values corresponding to the computed parameters are tabulated in Tab. 2. The visual comparison of images in Fig. 7 has shown that the proposed method shows the improved brightness and better contrast in improving the overall quality in the image.
5.3 Visual Analysis of Kodak Dataset
From the view point of Fig. 2, the step-wise approach of IDGB is shown in Fig. 8. In comparison to reference image, where the area in and around the object (face) is dull with low brightness had been improved with the proposed method.
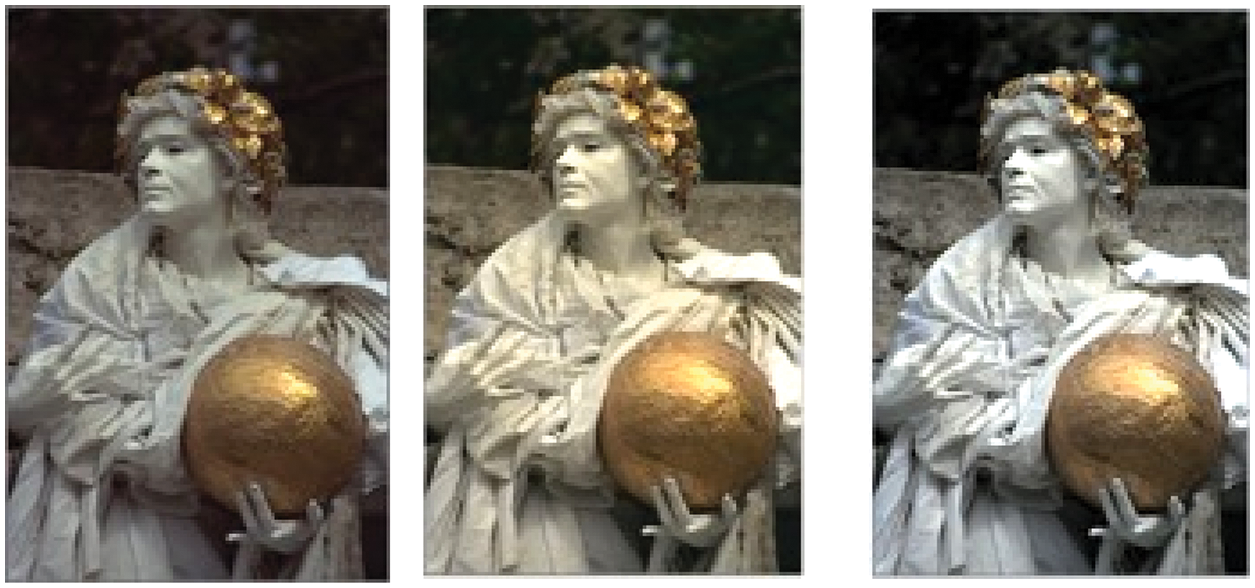
Figure 8: Visual comparison of the proposed technique IDGB. Left to Right: input image, linear stretched and reconstructed image
The middle image is the pre-processed stage by piecewise linear contrast stretch. Even though the brightness was improved, dark patches in and around the object degraded the visual quality. At this stage of pre-processing, the AMBE was 17.81, generally at the higher value of error in brightness. Finally, the pre-processed image was auto-adjusted with the tuneable scale of gamma correction. By tuneable, it means the computation of scale adjustment was computed automatically from the reference image. The image on the extreme right is the final image after enhancement. With the improvement in overall appearance, the AMBE was minimum at 0.60. As discussed in Section 3.3.1, the dark scale intensity was changed to new mapping matrix and lighter regions were suppressed.
As shown in Fig. 9, the histogram values showed the effect of expansion in both dark (left region) and bright (right region) respectively. Referring to Eq. 6, the gamma value computed at 0.97 produces the optimal expansion at both sides of the intensity scale is obtained.
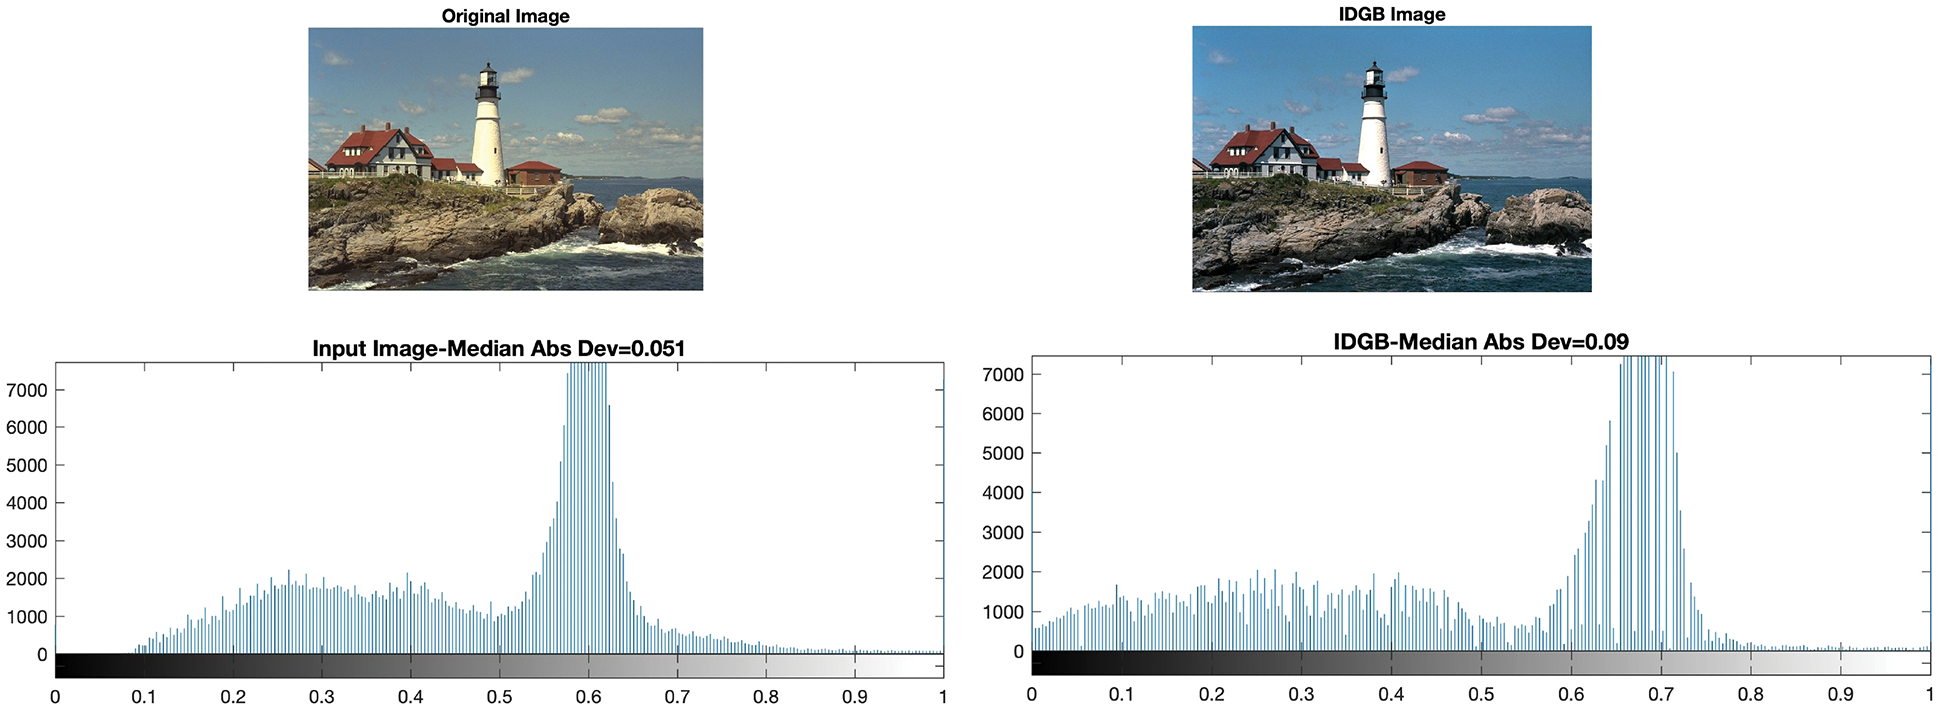
Figure 9: Histogram comparison of enhanced image (Left: Reference Image and Right: Enhanced Image)
5.4 Qualitative Measure of Kodak Dataset
Furthermore, the proposed method is evaluated for Kodak dataset. The dataset comprises of 24 lossless true color images of varying size of 768 × 512 and 512 × 768. The comparison is made with quality metrics as AMBE, PSNR, structure similarity index (SSIM).
The value of AMBE is to be minimum for preservation in the mean brightness. Otherwise, large variation in AMBE will degrade the quality in the image. As shown in Fig. 10, the proposed method had recorded AMBE at the minimum value of 0.08 and maximum of 3.74. Also, AMBE does-not account for the noise in the image. Hence, peak signal to noise ratio is computed to validate the brightness preservation in the reconstructed image. The value of PSNR greater than 20 dB is stated to be better for image quality. As shown in Fig. 10, for all the images the values lie in the range of 27 to 31 dB. Similarly, the average performance of structure similarity index is found to be 0.99. The value close to ‘1’ indicates no disorientation in structure due to moderation in the reconstructed image.
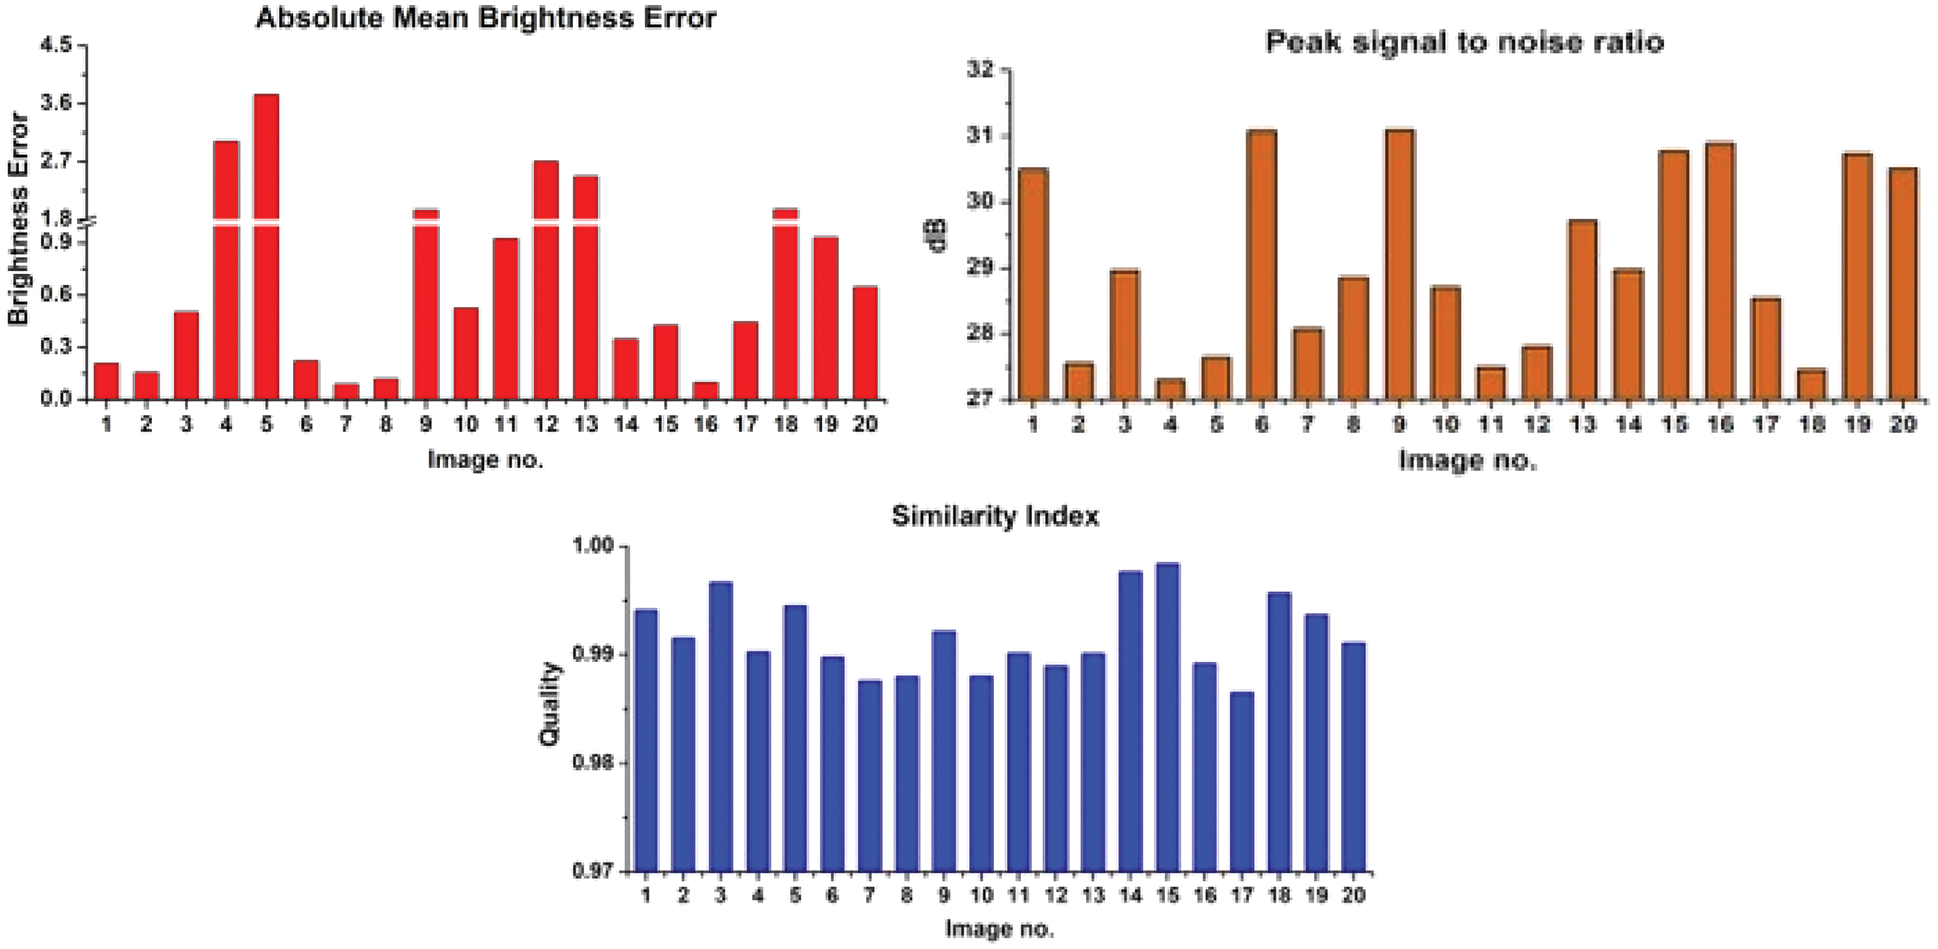
Figure 10: Performance metrics for Kodak dataset
Further, the quantitative metrics tabulated in Tab. 3 is evaluated with the algorithms that used the Kodak dataset. Kansal et al. [22] designed an adaptive gamma correction, in which the gamma value for each image was changed. Alternately, the authors used contrast limited adaptive HE (CLAHE) with several filters to improve image contrast while simultaneously reducing noise. The CLAHE worked on limiting the contrast and thus not suitable for natural images. For enhancement in contrast, Vishwakarma et al. [23] used the combination of CLAHE and logarithmic function. Even, the limitation of CLAHE is monitored by logarithmic function but logarithmic has the property to over-enhance the image by mapping the intensity values to the higher portion of values. For natural images, the values are distributed at every range of scale. Hence, the scaling of brighter region would make the washed-out detail in the image. Whereas, Palanisamy et al. [24] combined CLAHE with singular value decomposition and gamma correction for improvement in contrast. Further, Kandhway et al. [25] worked on adaptive thresholding of HE for brightness preservation.
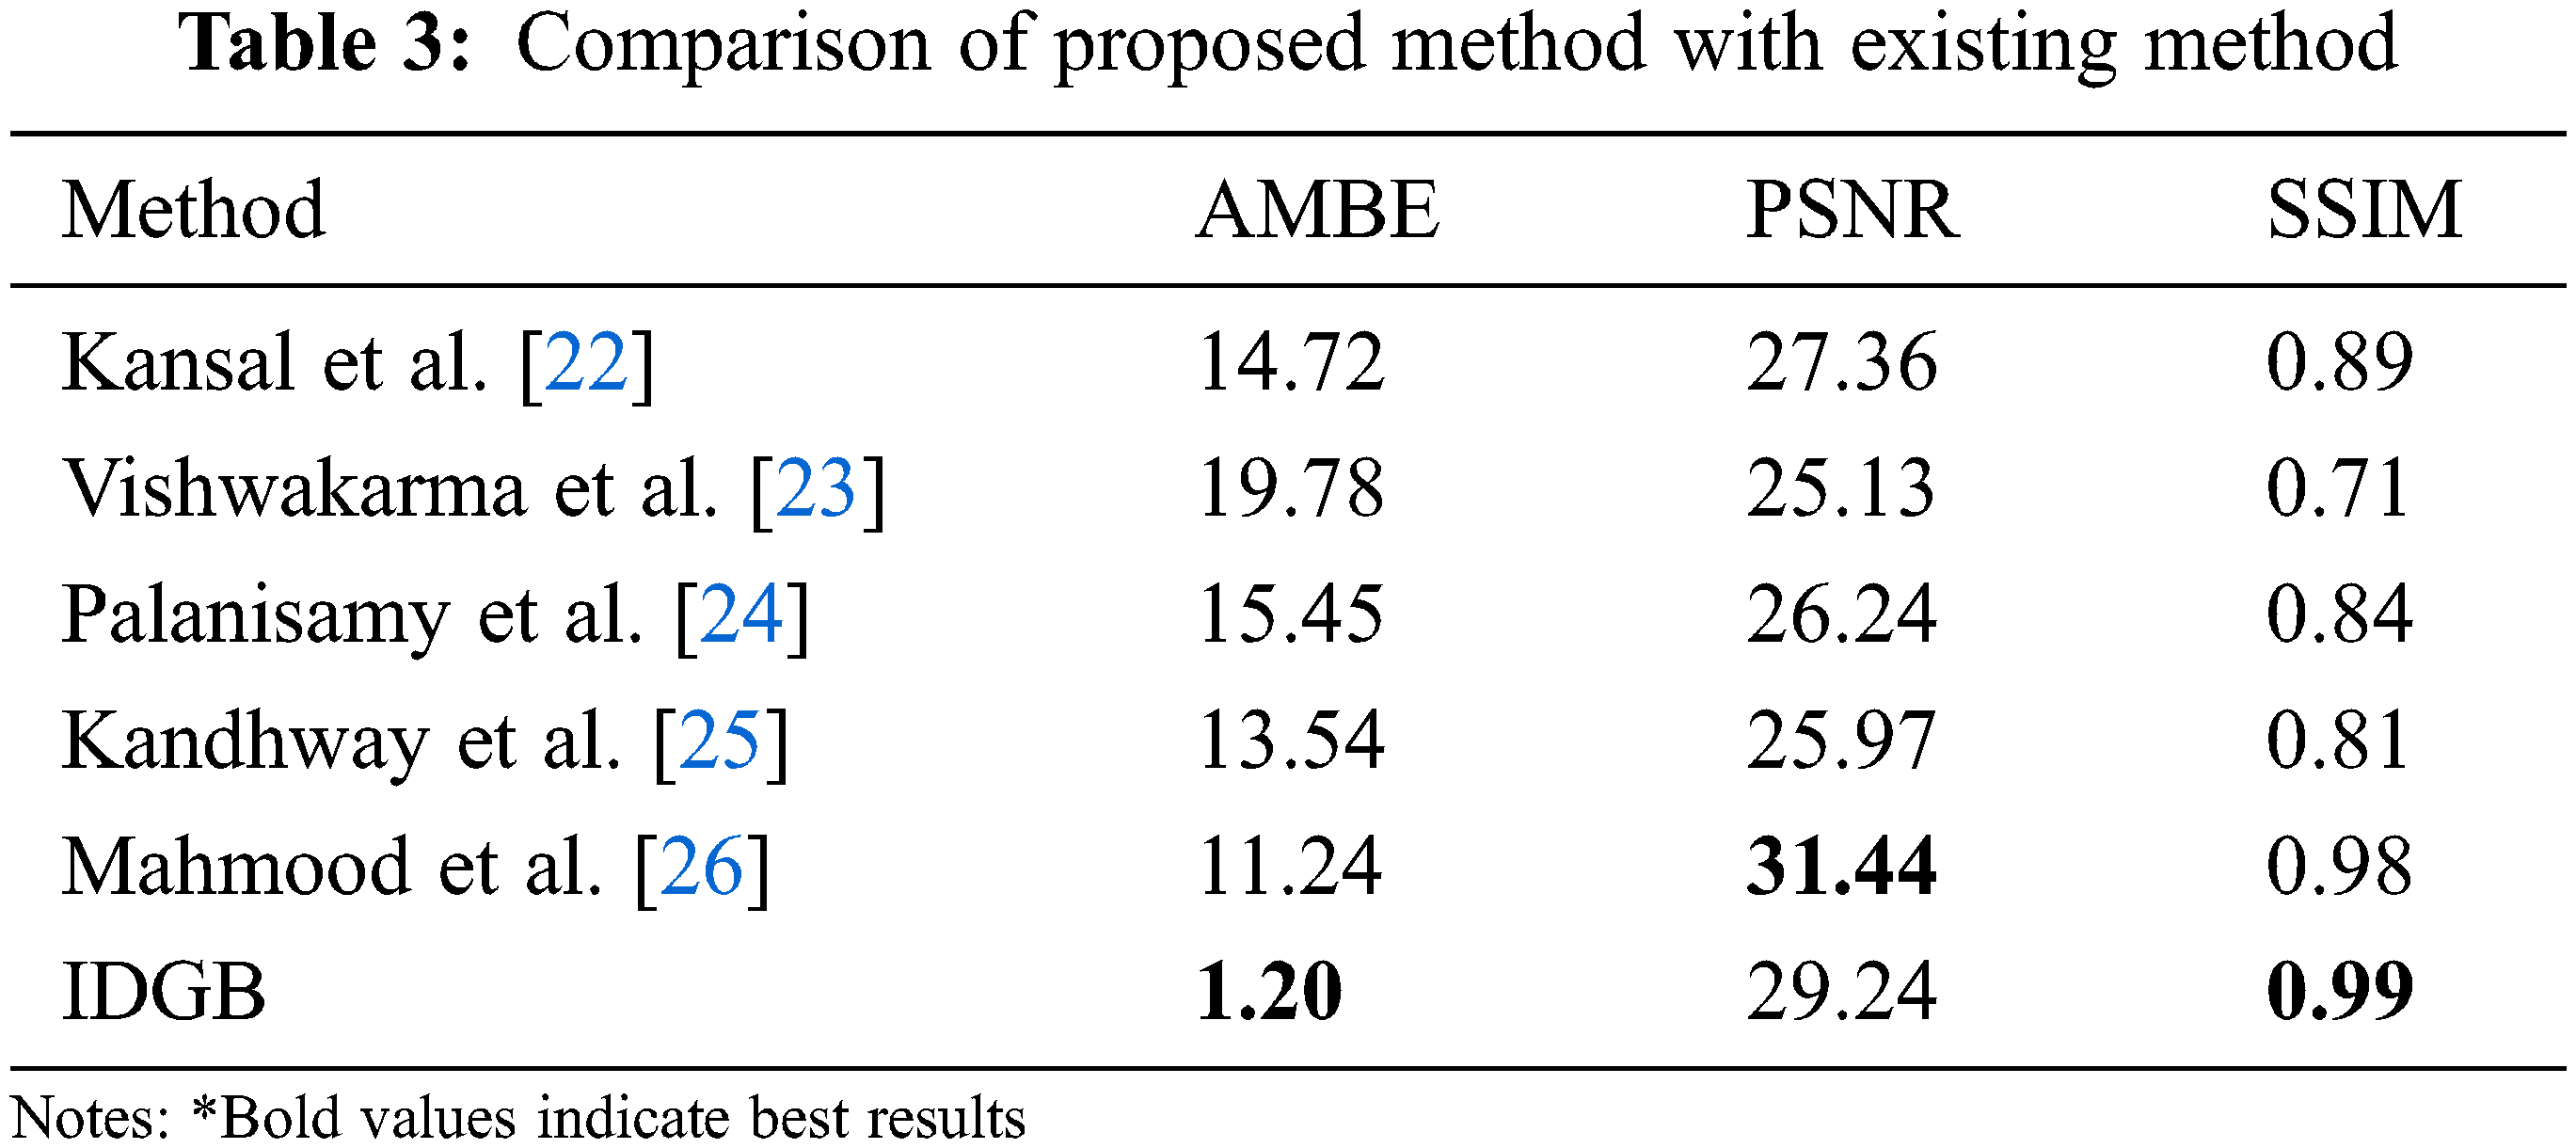
The application of neural network was proposed by Kuang et al. [27] to improve quality in the image. Khan et al. [26] proposed an adaptive approach of gamma, where scale parameter was computed from the algorithm using particle swarm optimization. The author claimed to preserve the mean brightness and improving the richness in the detail information. The Tab. 3 showed that the proposed IDGB has outperformed over all the above method in terms of preserving mean brightness and improved quality in the image.
Due to non-uniform illumination, images are degraded with un-even distribution of brightness. As stated above in tabulated results, if the brightness is well preserved, the quality of the image is improved. In the recent relevant algorithms, AMBE was computed to be high and thus the picture quality was degraded. But in the proposed method, auto-tune of scale parameter is efficient to preserve the mean brightness for improvement in the visual appearance of the image. For the dataset of USC-SIPI and Kodak, the minimum value of AMBE in IDGB effectively improved the visual quality.
5.5 Qualitative Analysis of Aerial Images
The remote sensing image is utilized to understand the earth’s surface or in the field of astronomy. Such type of images often is complex to understand and is degraded with atmospheric noise. The role of image enhancement is to improve the visual perception of the recorded objects. So, the proposed method is further extended to show the efficacy in preserving the visual quality. The purpose is to minimize the brightness error that must produce an improved quality of the object. In aerial images, rather than uniform distribution, it is required to scale the frequently occurring histogram values in the original image. The dataset of the aerial images used from the available resources from USC-SIPI and satellite images recorded by Yang et al. [28]. The 100 set of images are randomly selected of the image size 256 × 256 pixels.
Hence, the gamma correction enhanced the frequently occurring scale portion of intensity scale. As shown in Fig. 11, for the narrow distribution of pixels in reference image, the adaptive gamma correction scales the frequent values of histogram for improved quality and minimum brightness error. The graphical representation in Fig. 12 showed the efficacy in terms of richness in information detail, AMBE and PCQI.
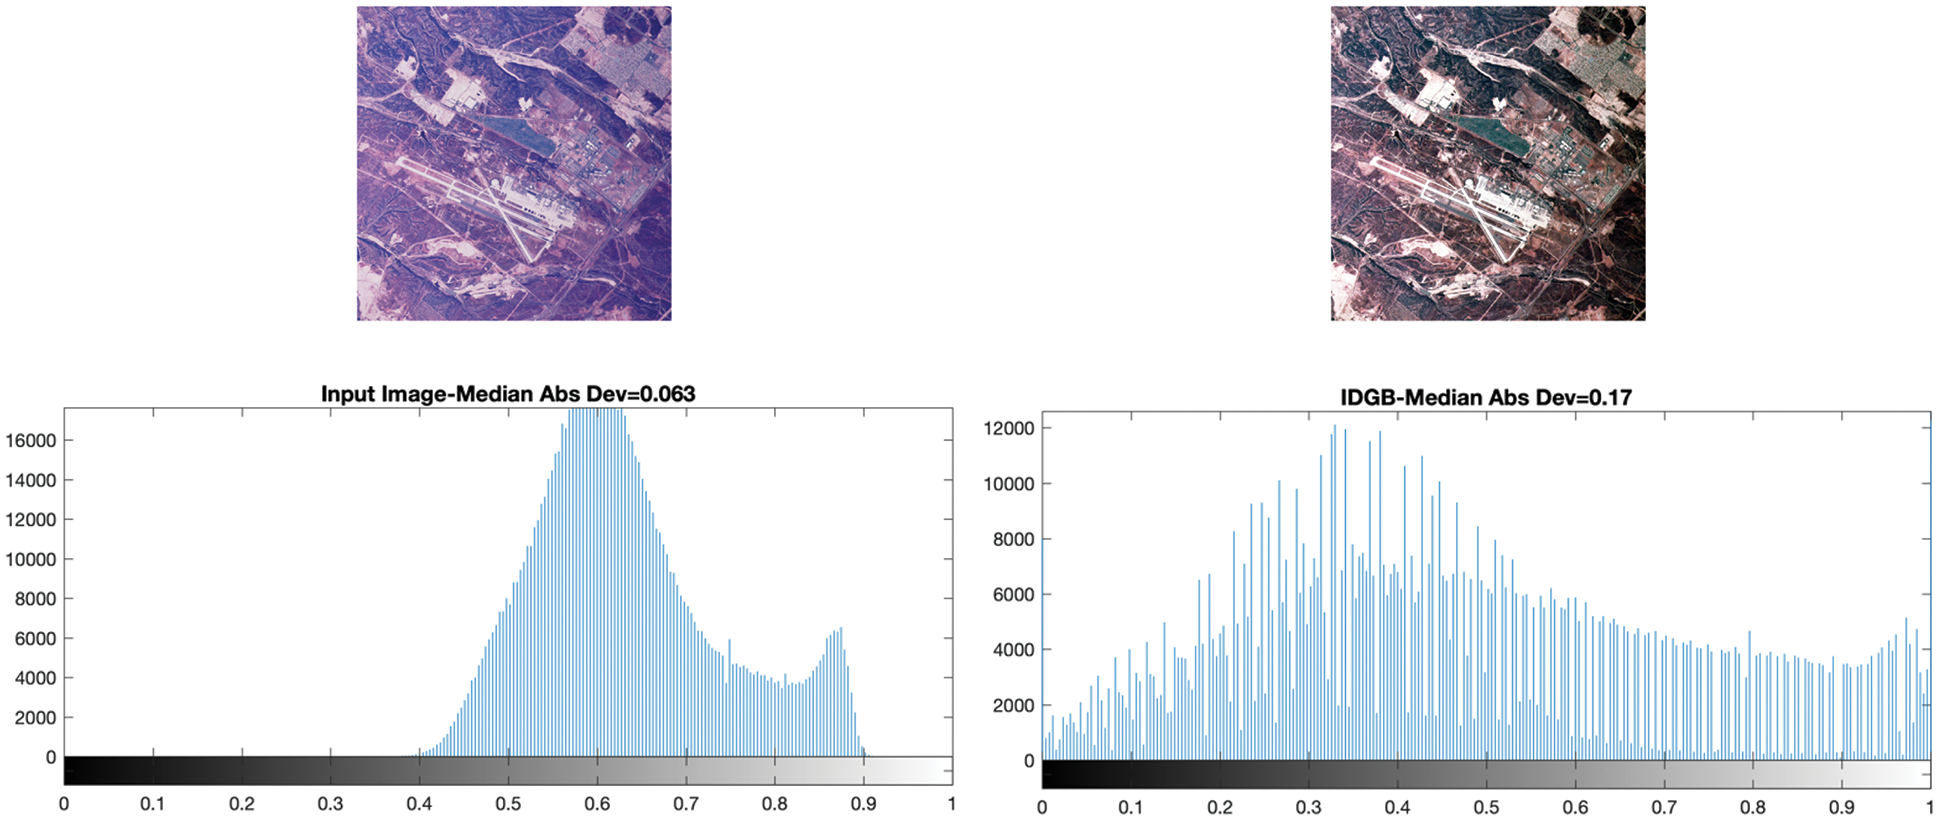
Figure 11: Comparison of the proposed method with the reference image
In Fig. 12, the measure of entropy compared the information content of the reference and the enhanced image. The increase of 10% in entropy is recorded for the dataset available by Yang et al. [28]. The comparison of AMBE and PCQI is also shown. With an average score of 0.99 in PCQI, a minimum brightness error of 1.19 is found. It might be concluded that the proposed method is also effective for satellite images to produce better visibility in the picture.
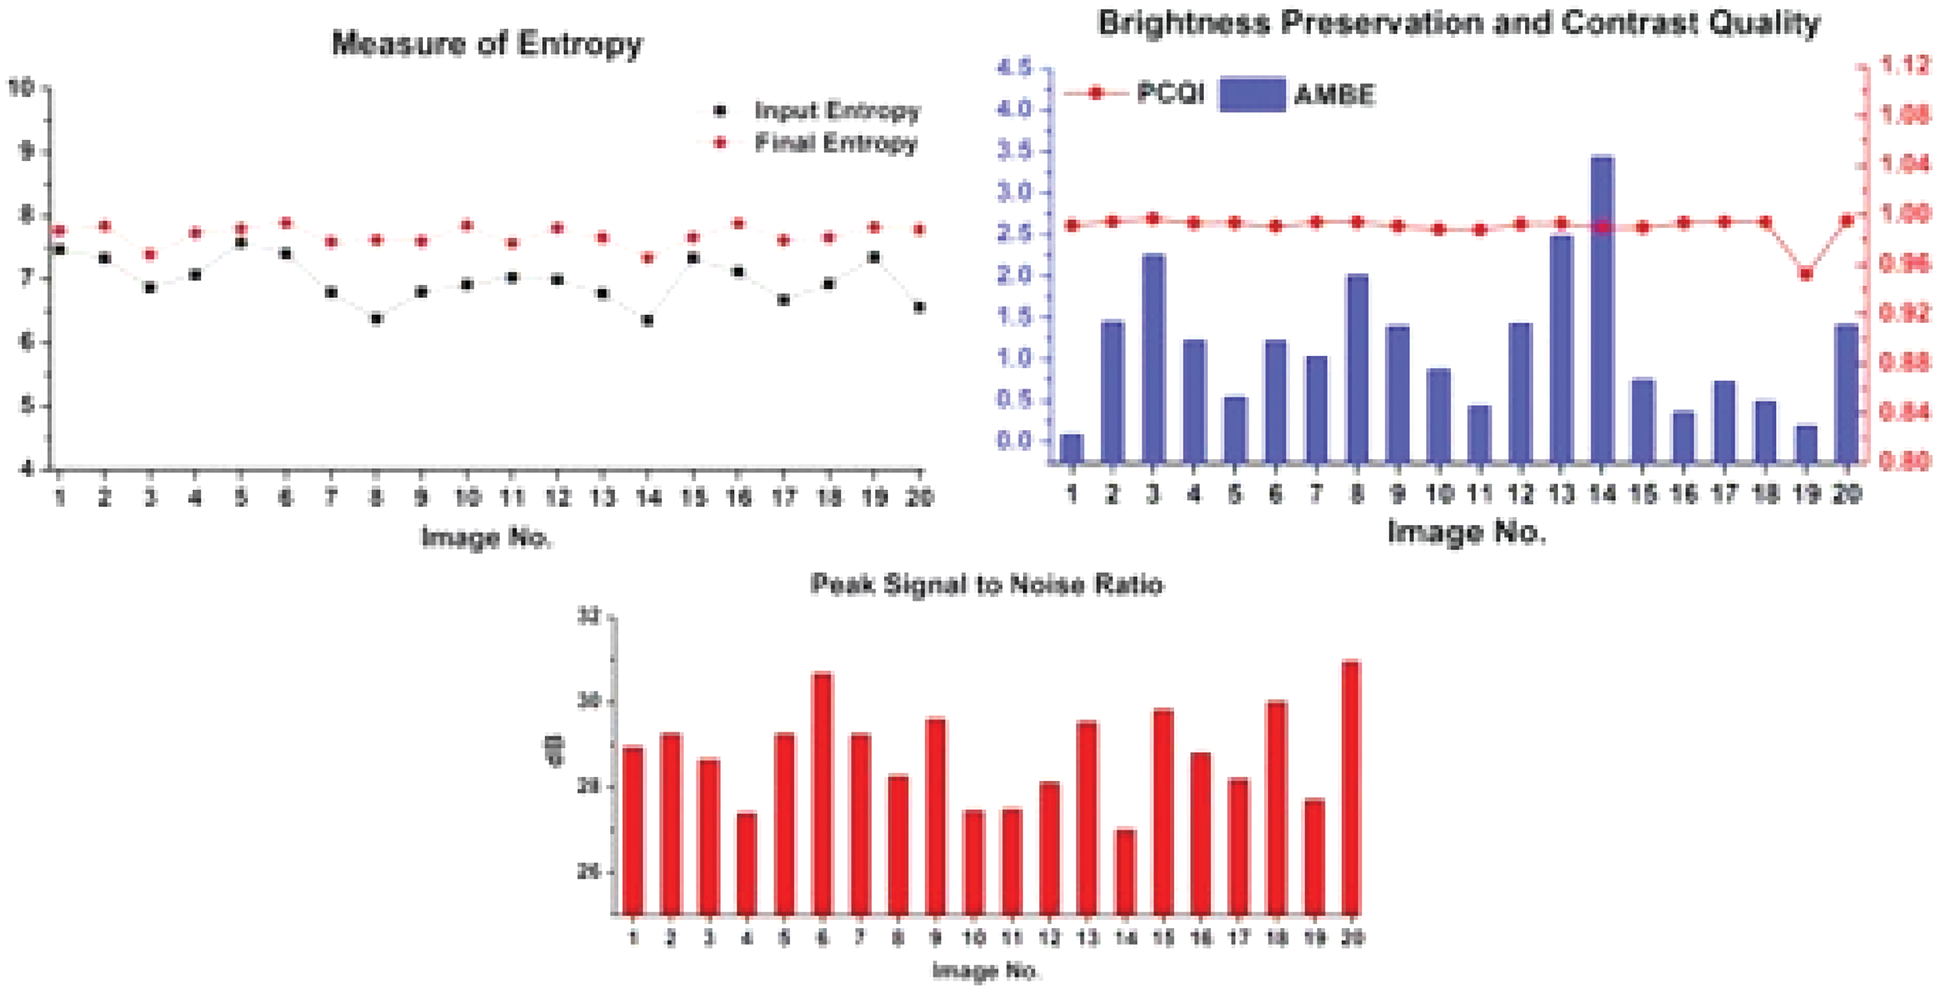
Figure 12: The results obtained from proposed method for quality metrics as: Entropy, AMBE, PCQI and PSNR
Since the satellite images are distorted due to atmospheric noise and are captured from a long distance. The enhancement is required to improve the visual appearance of the image. It is clear from Fig. 13 that with the improvement, in contrast, the visual quality of the image is also improved. As displayed in Fig. 12, brightness is also preserved with no loss of information contained in the image.
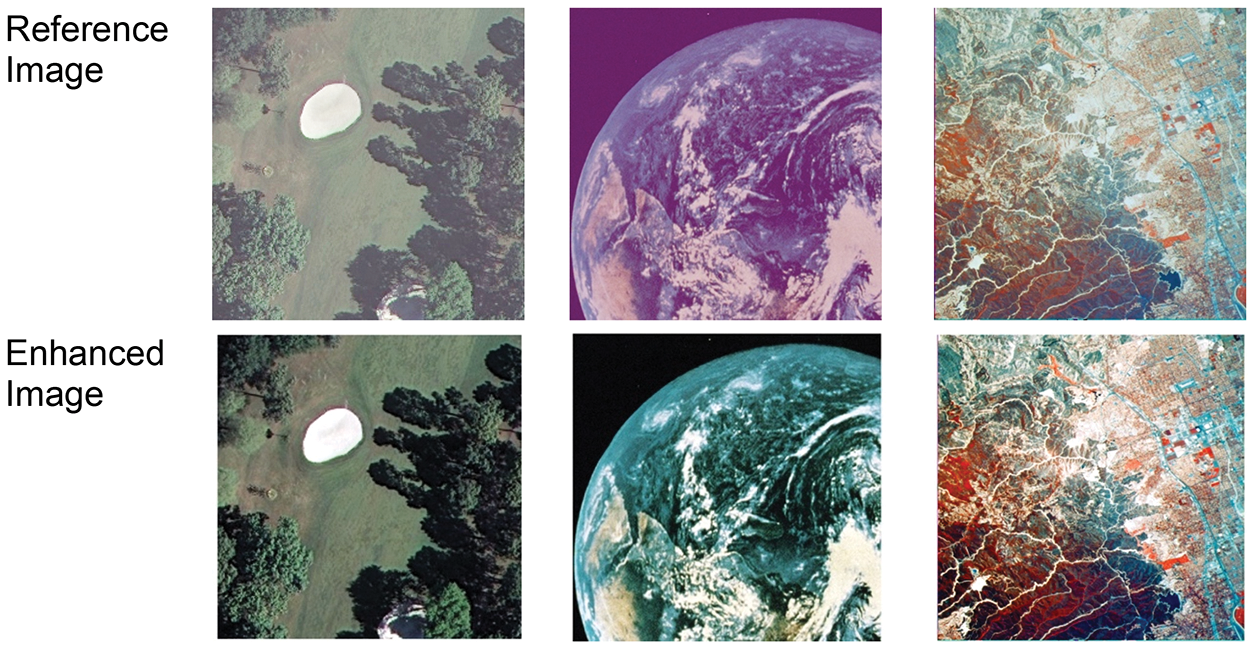
Figure 13: Resultant images from the proposed method
Image enhancement is necessary for consumer electronics products and remote sensing applications where the quality is degraded because of non-uniform illumination and low contrast. It is a challenging task to deal with the non-linear characteristics of an image to preserve the mean brightness. Most of the methods had relied on the approach of HE for the better visual appearance of an image. As discussed, the modified approach of HE often produced over-enhancement, and in most cases, caused the saturation effects. So, the proposed work presented the wavelet-based image decomposition by auto tuned scale parameter of gamma correction. The significance of the method was to experience a better visual appearance by adjusting the illumination. The tabulated results showed the proposed method outperformed the other relevant approaches of HE. The gamma correction is a tedious task to achieve optimal quality in the image. The major challenge was to adjust the gamma scale for better visibility. The gamma scale was optimized by the statistical approach computed from the mean and standard deviation of the input image. However, the confidence scale computed may differ for the images with a dark intensity scale. So, it will be further extended to scale the dark images for better visibility in the images.
Acknowledgement: The authors acknowledge IKG Punjab Technical University, Kapurthala and DAV Institute of Engineering & Technology, Jalandhar, Punjab for necessary tools and journal access for possible outcome of this work.
Funding Statement: The authors received no funding from any government or private agency for this article.
Conflicts of Interest: The authors declare no conflicts of interest for this article.
1. U. Qidwai and C. H. Chen, Digital image processing, Chapman and Hall/CRC, 1st Edition, pp. 19–38. 2009. https://doi.org/10.1201/9781420079517. [Google Scholar]
2. K. S. Thyagarajan, Still Image and Video Compression with MATLAB, Hoboken, NJ, USA: John Wiley & Sons, Inc., 2011. https://doi.org/10.1002/9780470886922. [Google Scholar]
3. Z. Al-Ameen, “Contrast enhancement for color images using an adjustable contrast stretching technique,” International Journal of Computing, vol. 17, no. 2, pp. 74–80, 2018, https://doi.org/10.47839/ijc.17.2.993. [Google Scholar]
4. R. Maini and H. Aggarwal, “A comprehensive review of image enhancement techniques,” 2010. [Google Scholar]
5. O. Patel, Y. P. S. Maravi, and S. Sharma, “A comparative study of histogram equalization-based image enhancement techniques for brightness preservation and contrast enhancement,” Signal & Image Processing: An International Journal, vol. 4, no. 5, pp. 11–25, 2013, https://doi.org/10.5121/sipij.2013.4502. [Google Scholar]
6. S. Patel and M. Goswami, “Comparative analysis of histogram equalization techniques,” in Proceedings of 2014 International Conference on Contemporary Computing and Informatics, IC3I 2014, vol. 1, no. 2, pp. 167–168, 2014, https://doi.org/10.1109/IC3I.2014.7019808. [Google Scholar]
7. H. Ibrahim and N. Pik Kong, “Brightness preserving dynamic histogram equalization for image contrast enhancement,” IEEE Transactions on Consumer Electronics, vol. 53, no. 4, pp. 1752–1758, 2007, https://doi.org/10.1109/TCE.2007.4429280. [Google Scholar]
8. S. F. Tan and N. A. M. Isa, “Exposure based multi-histogram equalization contrast enhancement for non-uniform illumination images,” IEEE Access, vol. 7, pp. 70842–70861, 2019, https://doi.org/10.1109/ACCESS.2019.2918557. [Google Scholar]
9. Q. C. Tian and L. D. Cohen, “A Variational-based fusion model for non-uniform illumination image enhancement via contrast optimization and color correction,” Signal Processing, vol. 153, pp. 210–220, 2018, https://doi.org/10.1016/j.sigpro.2018.07.022. [Google Scholar]
10. G. Cao, L. Huang, H. Tian, X. Huang, Y. Wang et al., “Contrast enhancement of brightness-distorted images by improved adaptive gamma correction,” Computers and Electrical Engineering, vol. 66, pp. 569–582, 2018, https://doi.org/10.1016/j.compeleceng.2017.09.012. [Google Scholar]
11. E. F. Arriaga-Garcia, R. E. Sanchez-Yanez, J. Ruiz-Pinales, and M. d. G. Garcia-Hernandez, “Adaptive sigmoid function bihistogram equalization for image contrast enhancement,” Journal of Electronic Imaging, vol. 24, no. 5, pp. 053009, 2015. https://doi.org/10.1117/1.jei.24.5.053009. [Google Scholar]
12. K. Srinivas and A. K. Bhandari, “Low light image enhancement with adaptive sigmoid transfer function,” IET Image Processing, vol. 14, no. 4, pp. 668–678, 2020, https://doi.org/10.1049/iet-ipr.2019.0781. [Google Scholar]
13. M. Veluchamy and B. Subramani, “Fuzzy dissimilarity color histogram equalization for contrast enhancement and color correction,” Applied Soft Computing Journal, vol. 89, pp. 1–11, 2020, https://doi.org/10.1016/j.asoc.2020.106077. [Google Scholar]
14. A. Mohsin Abdulazeez, D. Q. Zeebaree, D. A. Zebari, G. M. Zebari, I. Mohammed et al., “The applications of discrete wavelet transform in image processing: A review,” Journal of Soft Computing and Data Mining, vol. 1, no. 2, pp. 31–43, 2020, https://doi.org/10.30880/jscdm.2020.01.02.004. [Google Scholar]
15. A. G. Weber, “The USC-SIPI image database version 5,” USC-SIPI Rep, 1997, vol. 315, pp. 1–24. https://sipi.usc.edu/database/ (accessed Dec. 13, 2021). [Google Scholar]
16. R. Franzen, “Kodak lossless true color image suite,” 1999. [Google Scholar]
17. S. C. Huang, F. C. Cheng, and Y. S. Chiu, “Efficient contrast enhancement using adaptive gamma correction with weighting distribution,” IEEE Transactions on Image Processing, vol. 22, no. 3, pp. 1032–1041, 2013, https://doi.org/10.1109/TIP.2012.2226047. [Google Scholar]
18. K. Singh and R. Kapoor, “Image enhancement via median-mean based sub-image-clipped histogram equalization,” Optik, vol. 125, no. 17, pp. 4646–4651, 2014, https://doi.org/10.1016/j.ijleo.2014.04.093. [Google Scholar]
19. A. Horé and D. Ziou, “Image quality metrics: PSNR vs. SSIM,” in Proc. - Int. Conf. on Pattern Recognition, Istanbul, Turkey, pp. 2366–2369, 2010, https://doi.org/10.1109/ICPR.2010.579. [Google Scholar]
20. N. Singh and A. K. Bhandari, “Image contrast enhancement with brightness preservation using an optimal gamma and logarithmic approach,” IET Image Processing, vol. 14, no. 4, pp. 794–805, 2020, https://doi.org/10.1049/iet-ipr.2019.0921. [Google Scholar]
21. X. Wang and L. Chen, “Contrast enhancement using feature-preserving bi-histogram equalization,” Signal, Image and Video Processing, vol. 12, no. 4, pp. 685–692, 2018, https://doi.org/10.1007/s11760-017-1208-2. [Google Scholar]
22. S. Kansal and R. K. Tripathi, “Adaptive gamma correction for contrast enhancement of remote sensing images,” Multimedia Tools and Applications, vol. 78, no. 18, pp. 25241–25258, 2019, https://doi.org/10.1007/s11042-019-07744-5. [Google Scholar]
23. V. P. Vishwakarma and T. Goel, “An efficient hybrid DWT-fuzzy filter in DCT domain based illumination normalization for face recognition,” Multimedia Tools and Applications, vol. 78, no. 11, pp. 15213–15233, 2019, https://doi.org/10.1007/s11042-018-6837-0. [Google Scholar]
24. G. Palanisamy, P. Ponnusamy, and V. P. Gopi, “An improved luminosity and contrast enhancement framework for feature preservation in color fundus images,” Signal, Image and Video Processing, vol. 13, no. 4, pp. 719–726, 2019, https://doi.org/10.1007/s11760-018-1401-y. [Google Scholar]
25. P. Kandhway and A. K. Bhandari, “An optimal adaptive thresholding based sub-histogram equalization for brightness preserving image contrast enhancement,” Multidimensional Systems and Signal Processing, vol. 30, no. 4, pp. 1859–1894, 2019, https://doi.org/10.1007/s11045-019-00633-y. [Google Scholar]
26. A. Mahmood, S. A. Khan, S. Hussain, and E. M. Almaghayreh, “An adaptive image contrast enhancement technique for low-contrast images,” IEEE Access, vol. 7, pp. 161584–161593, 2019, https://doi.org/10.1109/ACCESS.2019.2951468. [Google Scholar]
27. X. Kuang, X. Sui, Y. Liu, Q. Chen, and G. Gu, “Single infrared image enhancement using a deep convolutional neural network,” Neurocomputing, vol. 332, pp. 119–128, 2019, https://doi.org/10.1016/j.neucom.2018.11.081. [Google Scholar]
28. Y. Yang and S. Newsam, “Bag-of-visual-words and spatial extensions for land-use classification,” in ACM Sigspatial Int. Conf. on Advances in Geographic Information Systems (ACM GIS), 2010. [Google Scholar]
 | This work is licensed under a Creative Commons Attribution 4.0 International License, which permits unrestricted use, distribution, and reproduction in any medium, provided the original work is properly cited. |