DOI:10.32604/csse.2023.028053
| Computer Systems Science & Engineering DOI:10.32604/csse.2023.028053 | |
| Article |
An Ontology Based Multilayer Perceptron for Object Detection
1Department of Computer Science, S. T. Hindu College, Nagercoil, Affiliated to Manonmaniam Sundaranar University, Abishekapatti, Tirunelveli, 627012, Tamilnadu, India
2Department of Computer Science and Applications, S. T. Hindu College, Nagercoil, 629002, India
*Corresponding Author: P. D. Sheena Smart. Email: sheenasmartpd@gmail.com
Received: 01 February 2022; Accepted: 03 March 2022
Abstract: In object detection, spatial knowledge assisted systems are effective. Object detection is a main and challenging issue to analyze object-related information. Several existing object detection techniques were developed to consider the object detection problem as a classification problem to perform feature selection and classification. But these techniques still face, less computational efficiency and high time consumption. This paper resolves the above limitations using the Fuzzy Tversky index Ontology-based Multi-Layer Perception method which improves the accuracy of object detection with minimum time. The proposed method uses a multilayer for finding the similarity score. A fuzzy membership function is used to validate the score for predicting the burned and non-burned zone. Experimental assessment is performed with different factors such as classification rate, time complexity, error rate, space complexity, and precision by using the forest fire dataset. The results show that this novel technique can help to improve the classification rate and reduce the time and space complexity as well as error rate than the conventional methods.
Keywords: Object detection; similarity score; ontology; deep learning; fuzzy function; perception
Spatial data mining (SDM) is the method of extracting information from spatial datasets. With the data mining techniques application, it becomes possible to extract valuable information from spatial data (SD). The spatial information in data mining includes the position of the spatial features, an association of the geospatial features, and measurement values. Many research works have been designed in SD analytics. But it is still a challenging and time-demanding task. To make and manage the complexity of spatial object primitives with Very High Spatial Resolution (VHSR) satellite images, an automatic non-parametric cooperative segmentation method was developed [1]. High spectral satellite images do not improve the classification accuracy on Object-Based Image Analysis (OBIA). A Mutual Information (MI) based Segmented Stacked Autoencoder (S-SAE) method was developed to classify the spectral-SD [2]. The designed method minimizes the complexity and computational time but the error rate was not reduced.
A classification algorithm was introduced with a stochastic transmission model, for analyzing the time series data [3]. But the performance analysis of classification accuracy remained unaddressed. A Spatio-temporal model (STM) was introduced for forest fire detection using temporal remotely sensed data [4]. But the model failed to accurately analyze the features. A novel approach was introduced for study in the Spatially Spreading process (SSP) with the help of Reinforcement Learning (RL) [5]. These SSPs happen when the local attributes keep varying over a period of time by some other active process. Spatial correlation acts as an indicator that tells about the existence of SSP. At the same time, the modifications that have been made between spatial locations do not yield the same or reversely correlated values. The Random Forest (RF) algorithm was designed for evaluating the geographical data and reducing the fault [6]. But the time complexity analysis was not performed. A novel spatial prediction framework was introduced [7]. But the prediction error was not minimized. The Random Forest (RF) machine learning technique was introduced to minimize the false alarms for the detection of forest fires [8]. However, it takes more time for forest fire detection.
A Gaussian random field (GRF) model was introduced for classifying its observation into one of two populations [9]. But the model accurate classification was not performed with minimum time. A Random Forest prediction model was employed using spatially-heterogeneous data [10]. A random forests (RFs) classifier was established for spatial multi-feature classification using both spatial and temporal data [11]. Although the classifier reduces the error, it does not reduce the time consumption. Ensemble learning approaches were developed to forecast the occasion of large-scale forest fires and forest fire burned areas [12]. The established method failed to address the performance of time consumption for burned area detection. Logitboost Ensemble-based Decision Tree (LEDT) method created for mapping the forest fire vulnerability [13]. However, the designed process was unable to enhance classification precision. An (IFDS) Integrated Forest Fire Danger Assessment System was introduced to investigate the correlation among the burned area features then classify the forest fire cases using linear regression [14]. However, the time and space consumption for accurate forest fire detection was not minimized.
The existing researches work has been developed to find the fired area. The conventional approaches have not adequately improved the forest fire detection accuracy. Several classification methods were introduced to perform feature extraction but it takes more time needed for classifying the spatial data. In addition, the forest fire performance of error rate was not focused. In order to overcome the issue, a novel proposed FTIO-MPOD method is developed to increase the object detection accuracy with aid of SD-position characteristics. The key factor of ontology-based object detection using Tversky similarity index and Fuzzy triangular membership is used to detect the object as burned or non-burned with higher accuracy and minimum time, error rate.
The main contributions of this paper are (1) proposed technique is designed for improving the object detection and reducing the time for determining the burned locality with the implementation of Multilayer Perceptive Neural Learning technique and Triangular Fuzzy Membership Function. (2) The novelty of multilayer perceptron deep neural learning is applied in the FTIO-MPOD technique to deeply investigate the spatial attributes (i.e. features) based on the multiple layers. (3) The ontology-based concept is used in the FTIO-MPOD technique to compute the semantic similarity search by using the innovation of the Tversky similarity index. The similarity function is applied to measure the similarity among the extracted attributes and testing attributes. The similarity coefficient offers the numerical value between [0,1]. (4) The novelty of the triangular fuzzy memberships function is employed in the FTIO-MPOD technique to validate the similarity score among the two attributes with the threshold value. When the similarity is maximum than the threshold, then the burned zone is determined. Otherwise, the non-burned zone is determined.
The rest of the paper is arranged into different sections as given below. Section 2 discusses related works. Section 3 describes the proposed FTIO-MPOD technique with a neat diagram. Section 4 provides the experimental settings with the spatial dataset. Section 5 discusses the results of the FTIO-MPOD proposed and conventional methods with the appropriate performance metrics. At last, the paper is concluded in Section 6.
A convolutional neural network was presented for predicting the forest fire vulnerability using spatial data [15]. However, it lacks improving the accuracy of forest fire prediction. Networks on Convolutional feature maps (NoCs) were developed to obtain better accuracy [16]. A small deep neural network was developed for fast and efficient video smoke detection [17]. Though the network increases the accuracy and minimizes the memory consumption the time consumption was not decreased. A deep learning classification method was introduced to address man-made object detection with hyperspectral data [18]. Support vector machine (SVM) Classifier was introduced to extract the engineered objects [19]. But the deep learning concept was not considered. An adaptive Neuro-Fuzzy inference system (ANFIS) was developed which can be used on hotspot data [20]. The location of fires is mentioned as a hotspot. This model developed classification algorithms for hotspot events. Here, the input dataset is represented as a Fuzzy Inference System (FIS) where it executes a nonlinear mapping between input and output space. As a result, hotspots are classified using the ANFIS algorithm and the best model is obtained.
A Spatiotemporal Contextual Model (STCM) was developed using geostationary data for fire detection [21]. A new active fire detection algorithm was introduced based on multi-temporal data [22]. But the machine learning technique was not applied to improve the detection precision. A forest fire probability mapping method was introduced [23]. The designed method minimizes the computational time but the rate of false positive was not decreased. The Airborne Visible/Infrared Imaging Spectrometer (AVIRIS) for benthic habitat mapping was introduced [24]. Geographic Information Systems (GIS) was developed for fire detection based on the domain area of tropical forests [25]. But the better performance of fire detection was not achieved. (GIS) Geographic information system-based machine-learning algorithms were designed [26] to evaluate the forest fire influence factors using spatial data. But the relationship between the forest fire influence features was not estimated to minimize the time consumption.
An object detection framework that was based on deep learning was introduced [27]. It handled many sub problems like occlusion and low resolution. A GOES Early Fire Detection algorithm was introduced for reducing the time consumption [28]. Movement containing Region Detection based on the Background subtraction (MRDB) algorithm that uses YCbCr color space was developed [29]. It applies movement-containing detection to the input. This algorithm has a very fine detection rate and fewer false alarms. An optimized machine learning algorithm called Transparent Open Box (TOB) network that uses data matching was introduced which contributed to high prediction accuracy [30]. An autonomic computing-based integrated framework was introduced for software vulnerability identification and mitigation [31].
An ontological-based approach was developed to solve the Software product line (SPL) [32]. But the time was more. Ontology-based Conditional Random Fields (obCRFs) was introduced to address the object recognition issue [33]. But, the spatial and temporal reliability was not considered. An ontology-based image classification and annotation approach was developed with aid of ontologies to increase the classification accuracy and annotation precision [34,35]. A novel end-to-end three-branch embedding network (TBE-Net) was introduced to extract the global and local region features [36]. New real-time small object detection (RSOD) algorithm was developed to enhance the tiny object detection accuracy [37].
3 Fuzzy Tversky Index Ontology-based Multi-Layer Perceptive Object Detection
Geospatial object detection is a significant and challenging problem when further analyzing object-related information. SDM is widely implemented to extract significant and valuable information from large databases. Spatial data (SD) are acquired from geographical areas. Generally, the use of machine learning algorithms in SDM has increased but accurate spatial object prediction is a still challenging issue. To overcome this issue in spatial data analysis, the proposed FTIO-MPOD technique is introduced. The FTIO-MPOD technique uses ontology-based machine learning approaches that provide successful results with minimum time consumption. In the proposed FTIO-MPOD technique, an ontology-based concept is implemented in the machine learning technique to perform the semantic similarity search for object detection. Ontology is a method of showing the properties of an object area and how they are related, by defining a set of rules. The proposed FTIO-MPOD technique uses fuzzy logic triangular membership function to set a rule for finding the relationship between the data objects in a large dataset. The proposed FTIO-MPOD technique uses a machine learning technique as a multilayer perceptron to detect the spatial data-position characteristics using a large Geospatial dataset based on the set of the feature vector. The ontology-based concept is applied to a multilayer perceptron for object detection. In the proposed FTIO-MPOD technique, the forest fire dataset is considered to analyze the spatial data. Here the object is represented as a burned zone.
Fig. 1 shows the proposed FTIO-MPOD technique diagram for object detection using the ontology-based concept. Initially, the spatial attributes are extracted from the particular area. The attributes with their region are given to the ontology-based concept for detecting the objects based on semantic-based search. The ontology approach measures the semantic similarity between the extracted attributes (i.e. training features) and the constraints defined in the concept (i.e. testing fire attributes). The similarity score is measured based on the Tversky similarity index. Then the ontology-based concept uses the fuzzy logic rule to detect the geographic objects. The proposed FTIO-MPOD technique processes two methods that are explained in the following sections. The first method is the Multilayer Perceptive Deep Neural Learning technique and the second is Triangular Fuzzy Membership Function.
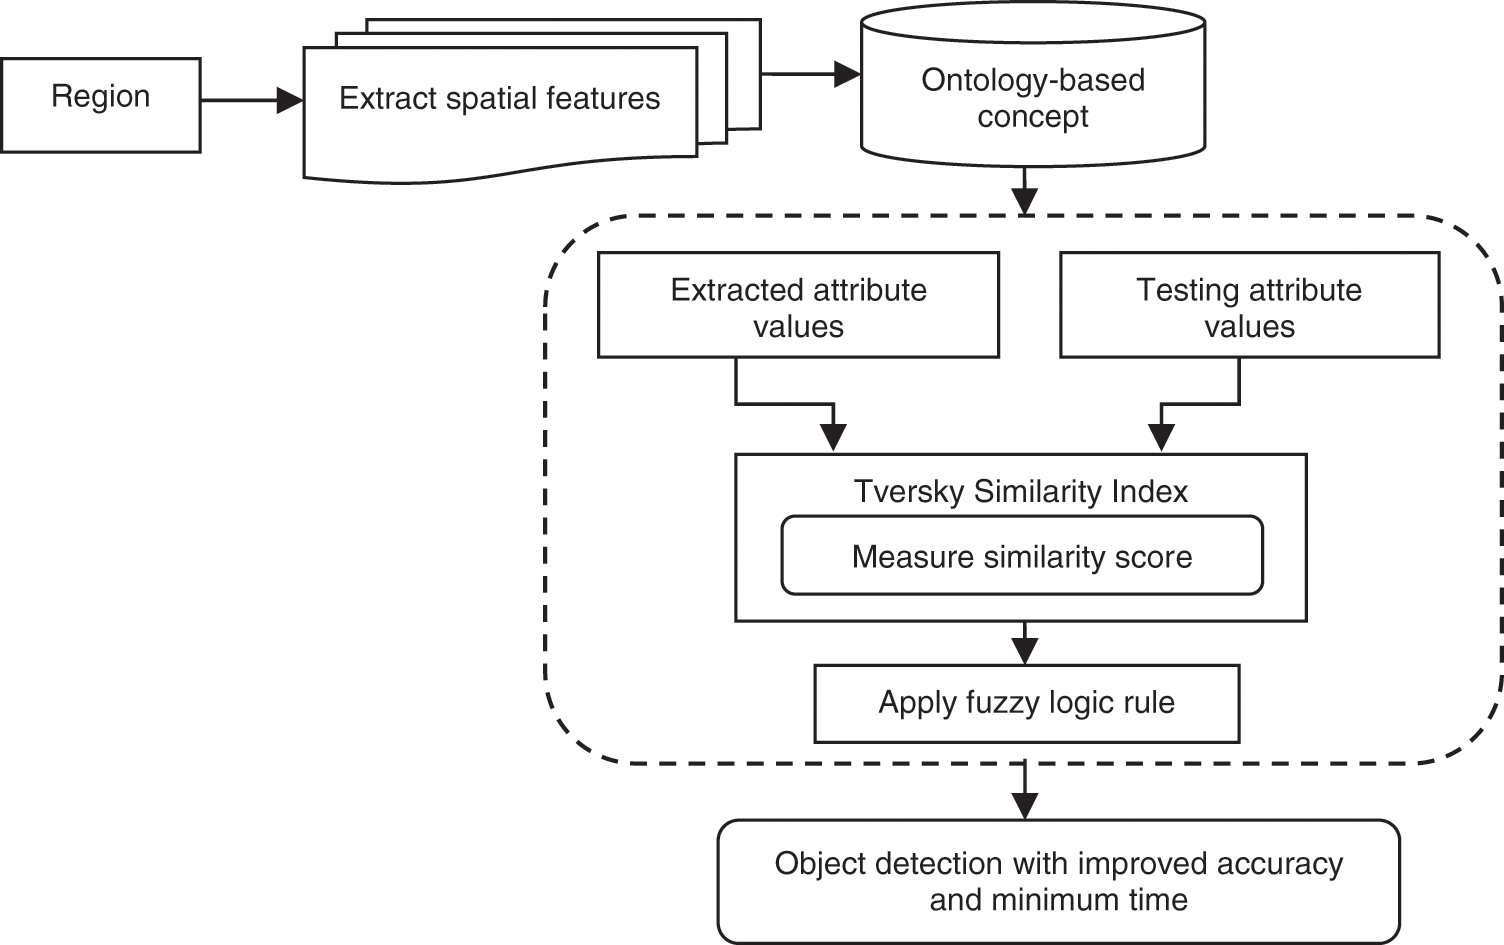
Figure 1: The proposed FTIO-MPOD technique diagram
3.1 Multilayer Perceptive Deep Neural Learning
A Perceptron network that comprises one or more hidden layers is named a Multilayer perceptron network. A multilayer perceptron is a machine learning method for ontology-based object detection along with a set of feature vectors. The multilayer perceptron is the feed-forward neural system with two or more layers such as one input and one output layer with more than one hidden layer of nonlinearly-activating nodes. A feed-forward network made up of fully connected layers is referred to as multi-layer perception. Multilayer perceptrons are feed-forward neural networks combining numerous layers of perceptions. These networks include multiple layers and are fully linked in a feed-forward way. Every node in one layer connects to another node with dissimilar weights. The multilayer perception is employed to create better results and enhance accuracy. Fig. 2 portrays a structural illustration of multilayer perceptive deep neural learning for object detection. In Fig. 2 shown, the neurons like the nodes in one layer are fully linked with the other layer to form an entire network using an arrow symbol.
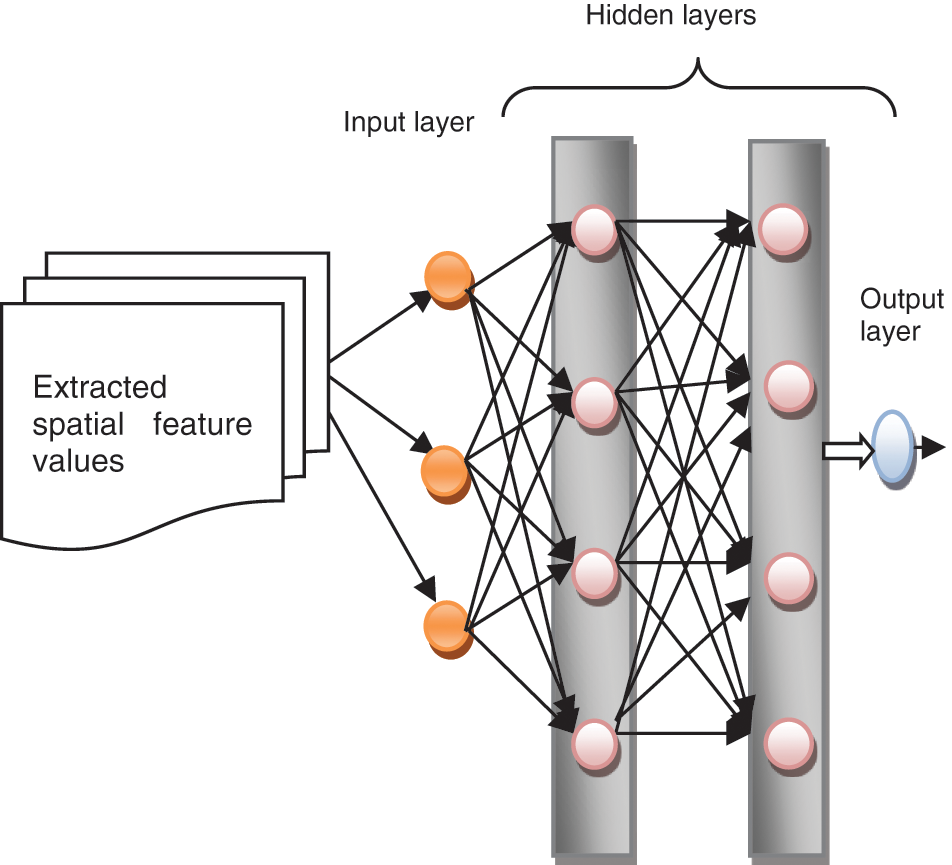
Figure 2: Structure of multilayer deep perceptive multilayer neural learning
Initially, the number of spatial attributes is extracted. Then the input region and the extracted attributes are fed into the input layer. In hidden layer 1, the input is fed into the ontology-based concept where the Tversky similarity index is applied to measure the similarity score among the training attributes and testing attributes. And the fuzzy logic rule is implemented to analyze the similarity score in hidden layer 2 and it returns the output layer. This helps to identify the objects (i.e., burned and non- burned zone) for improving the accuracy and reducing the time. The input layer receives the number of spatial attributes into the network at a time ‘
In the explanation of Eq. (1),
In the explanation of Eq. (2), ‘
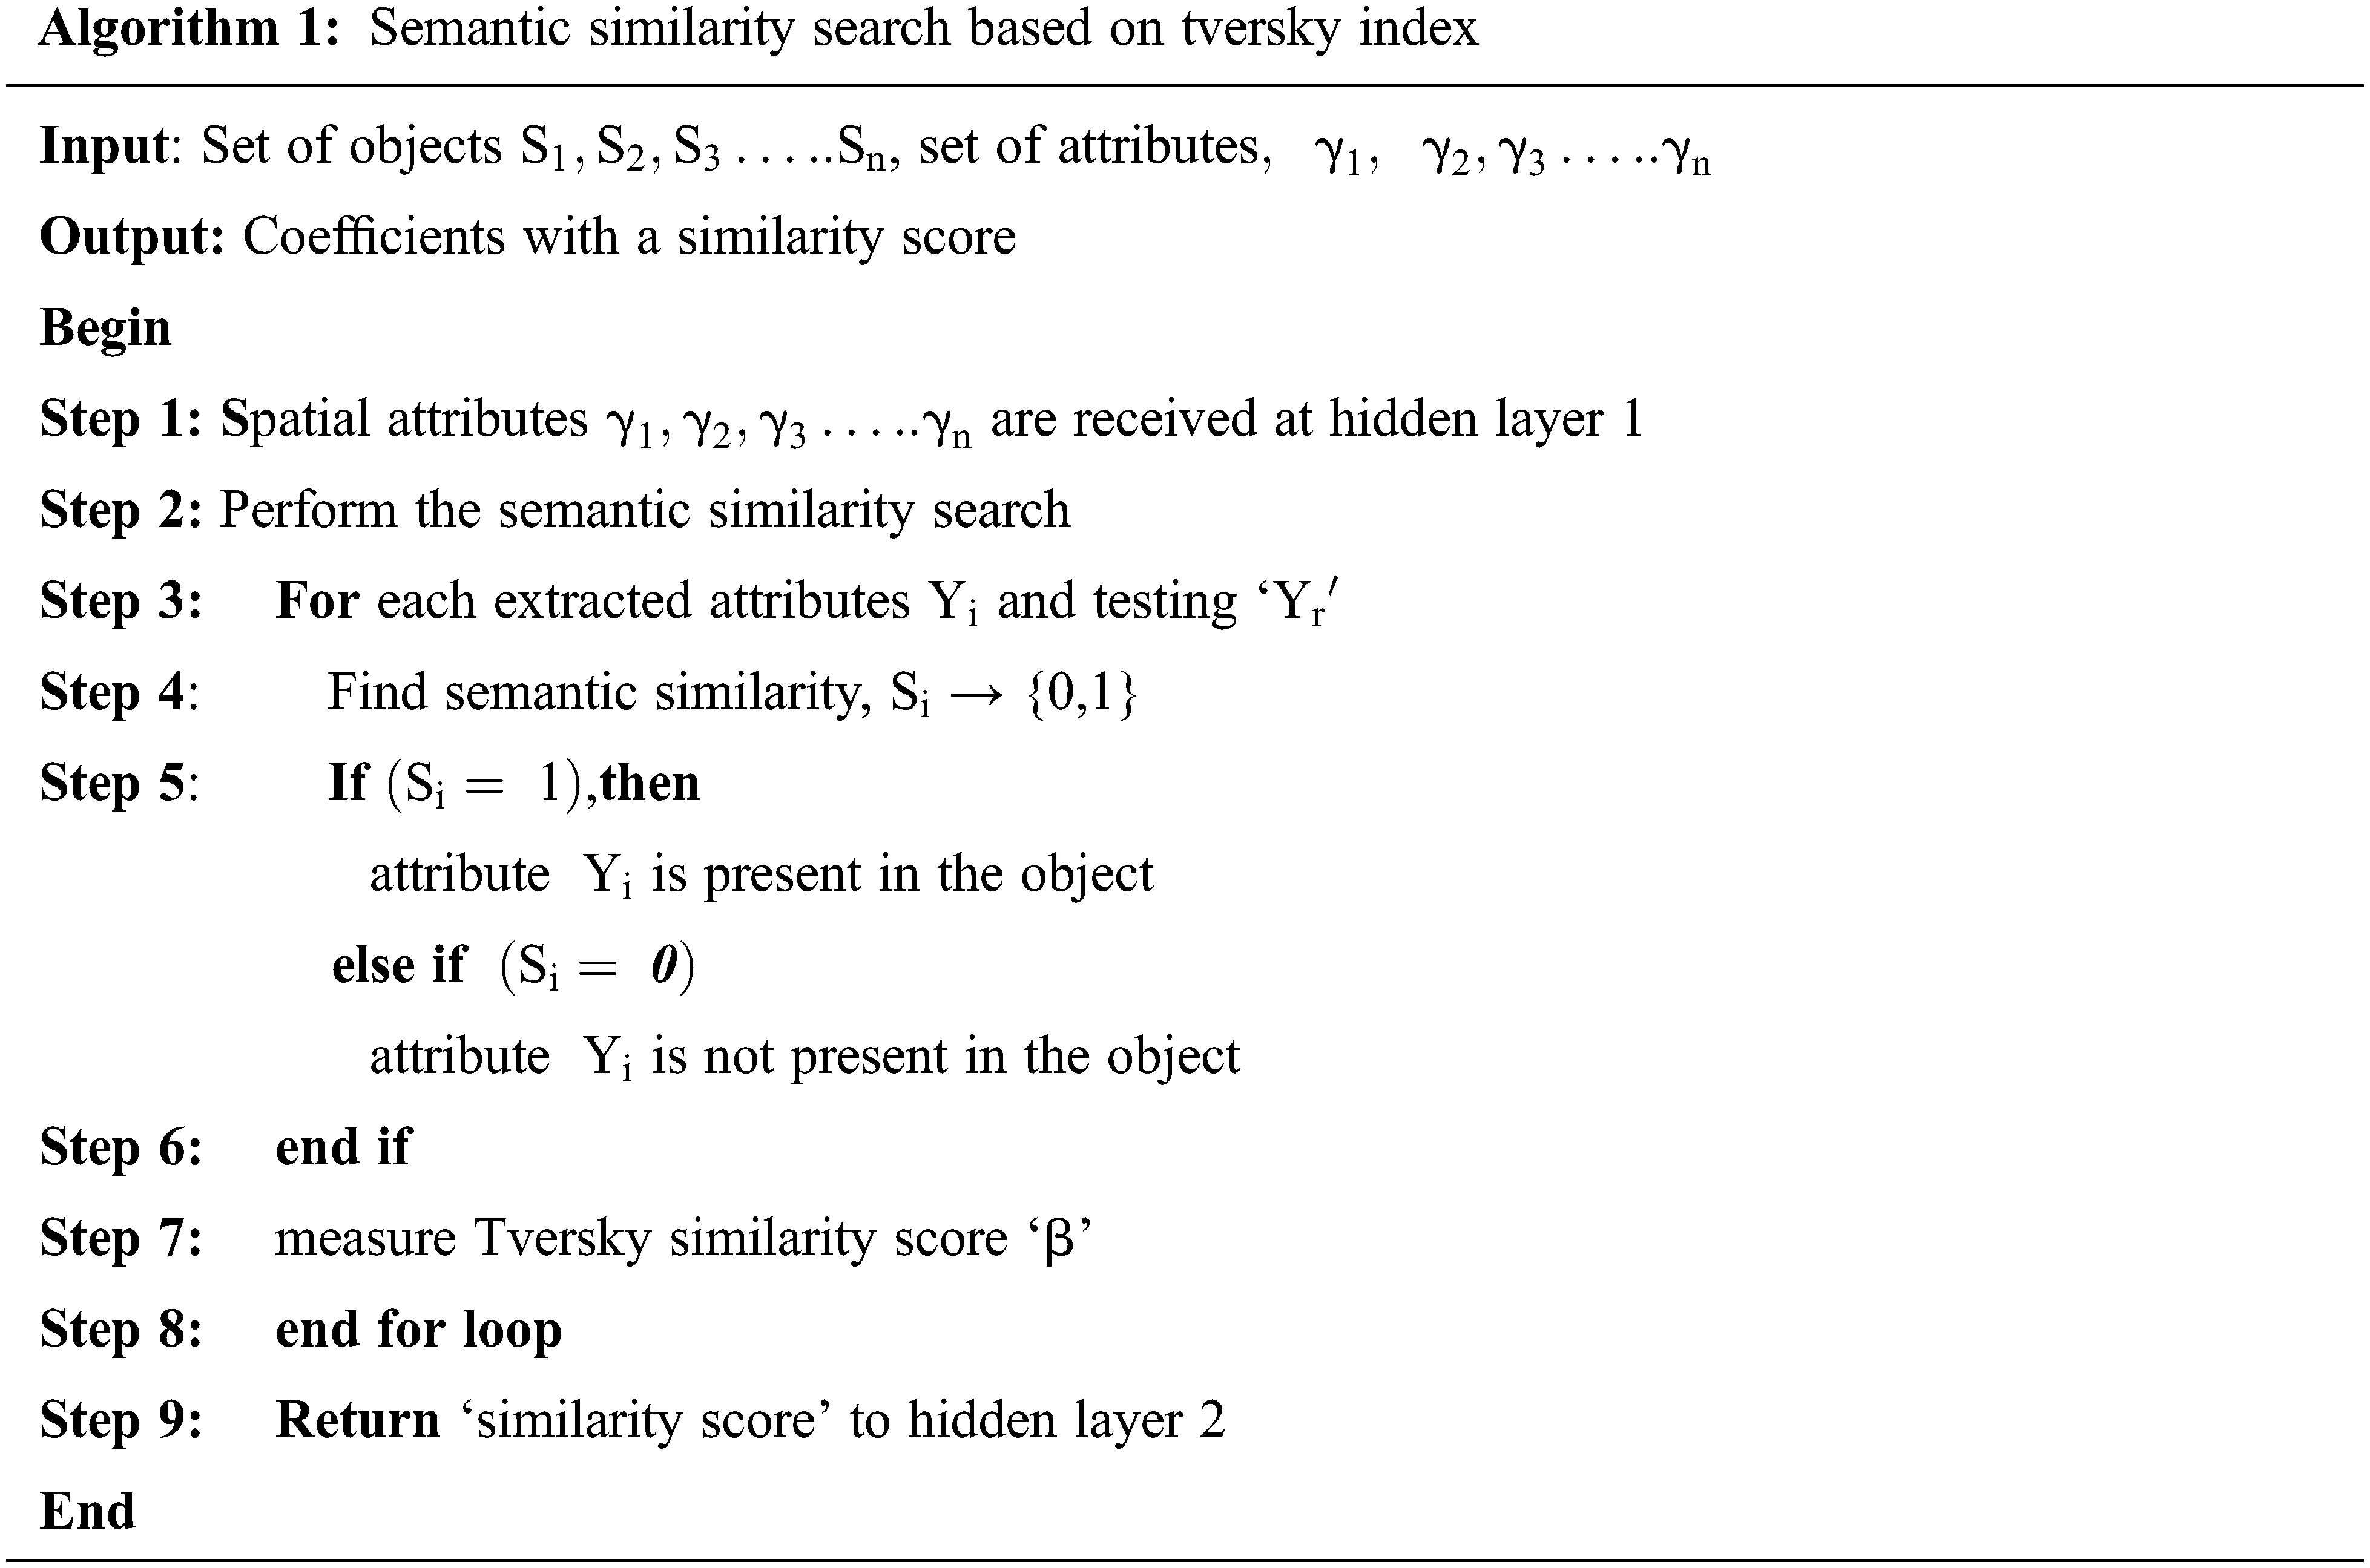
Algorithm 1 describes the process of semantic similarity search based on the Tversky index. The spatial attributes are received at the hidden layer 1 from the input layer. Then the semantic similarity between the training and test attributes is measured. Now the Tversky index is applied to find the similarity coefficient ‘
3.2 Triangular Fuzzy Membership Function
Fuzzy rules are applied in fuzzy logic systems to assume an output dependent on input variables. In real-life applications, the conditions are validated based on the IF-THEN (Fuzzy) rules. Fuzzy rules are used to set the threshold value (i.e., 0.5). The membership function is a method for handling the practical issue. In addition, rules are important in a fuzzy set. Membership functions are assigned to graphically indicate a fuzzy set. Membership functions are used to provide the value between [0,1]. If the value is 0, then it is not a member of the fuzzy set. If the value is 1, it is fully a member of the fuzzy set. The extracted spatial features are sent into the second hidden layer where the fuzzy logic rule is implemented to find the defected object region. The triangular membership process is important for fuzzy logic to validate the similarity score rate between the attributes for identifying the desired object detection (i.e., burned zone) results.
Fig. 3 depicts fuzzy logic triangular membership for estimating the similarity score between the attributes. The ontology-based object detection uses a rule
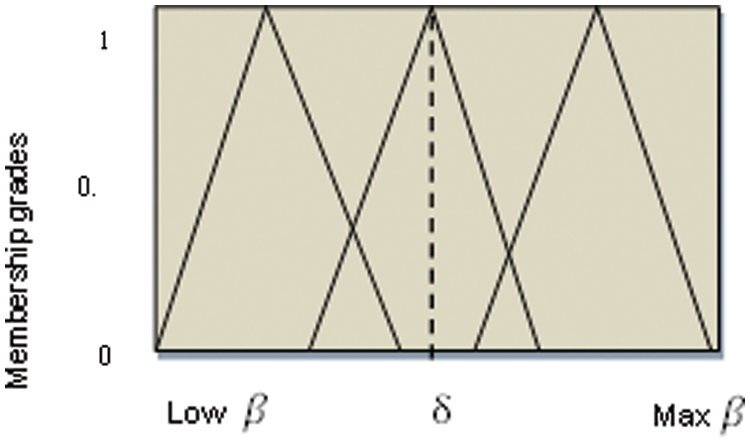
Figure 3: Fuzzy logic triangular membership-based similarity score estimation
The output of the hidden layer at the time
In the explanation of Eq. (3),
In the explanation of Eq. (4),
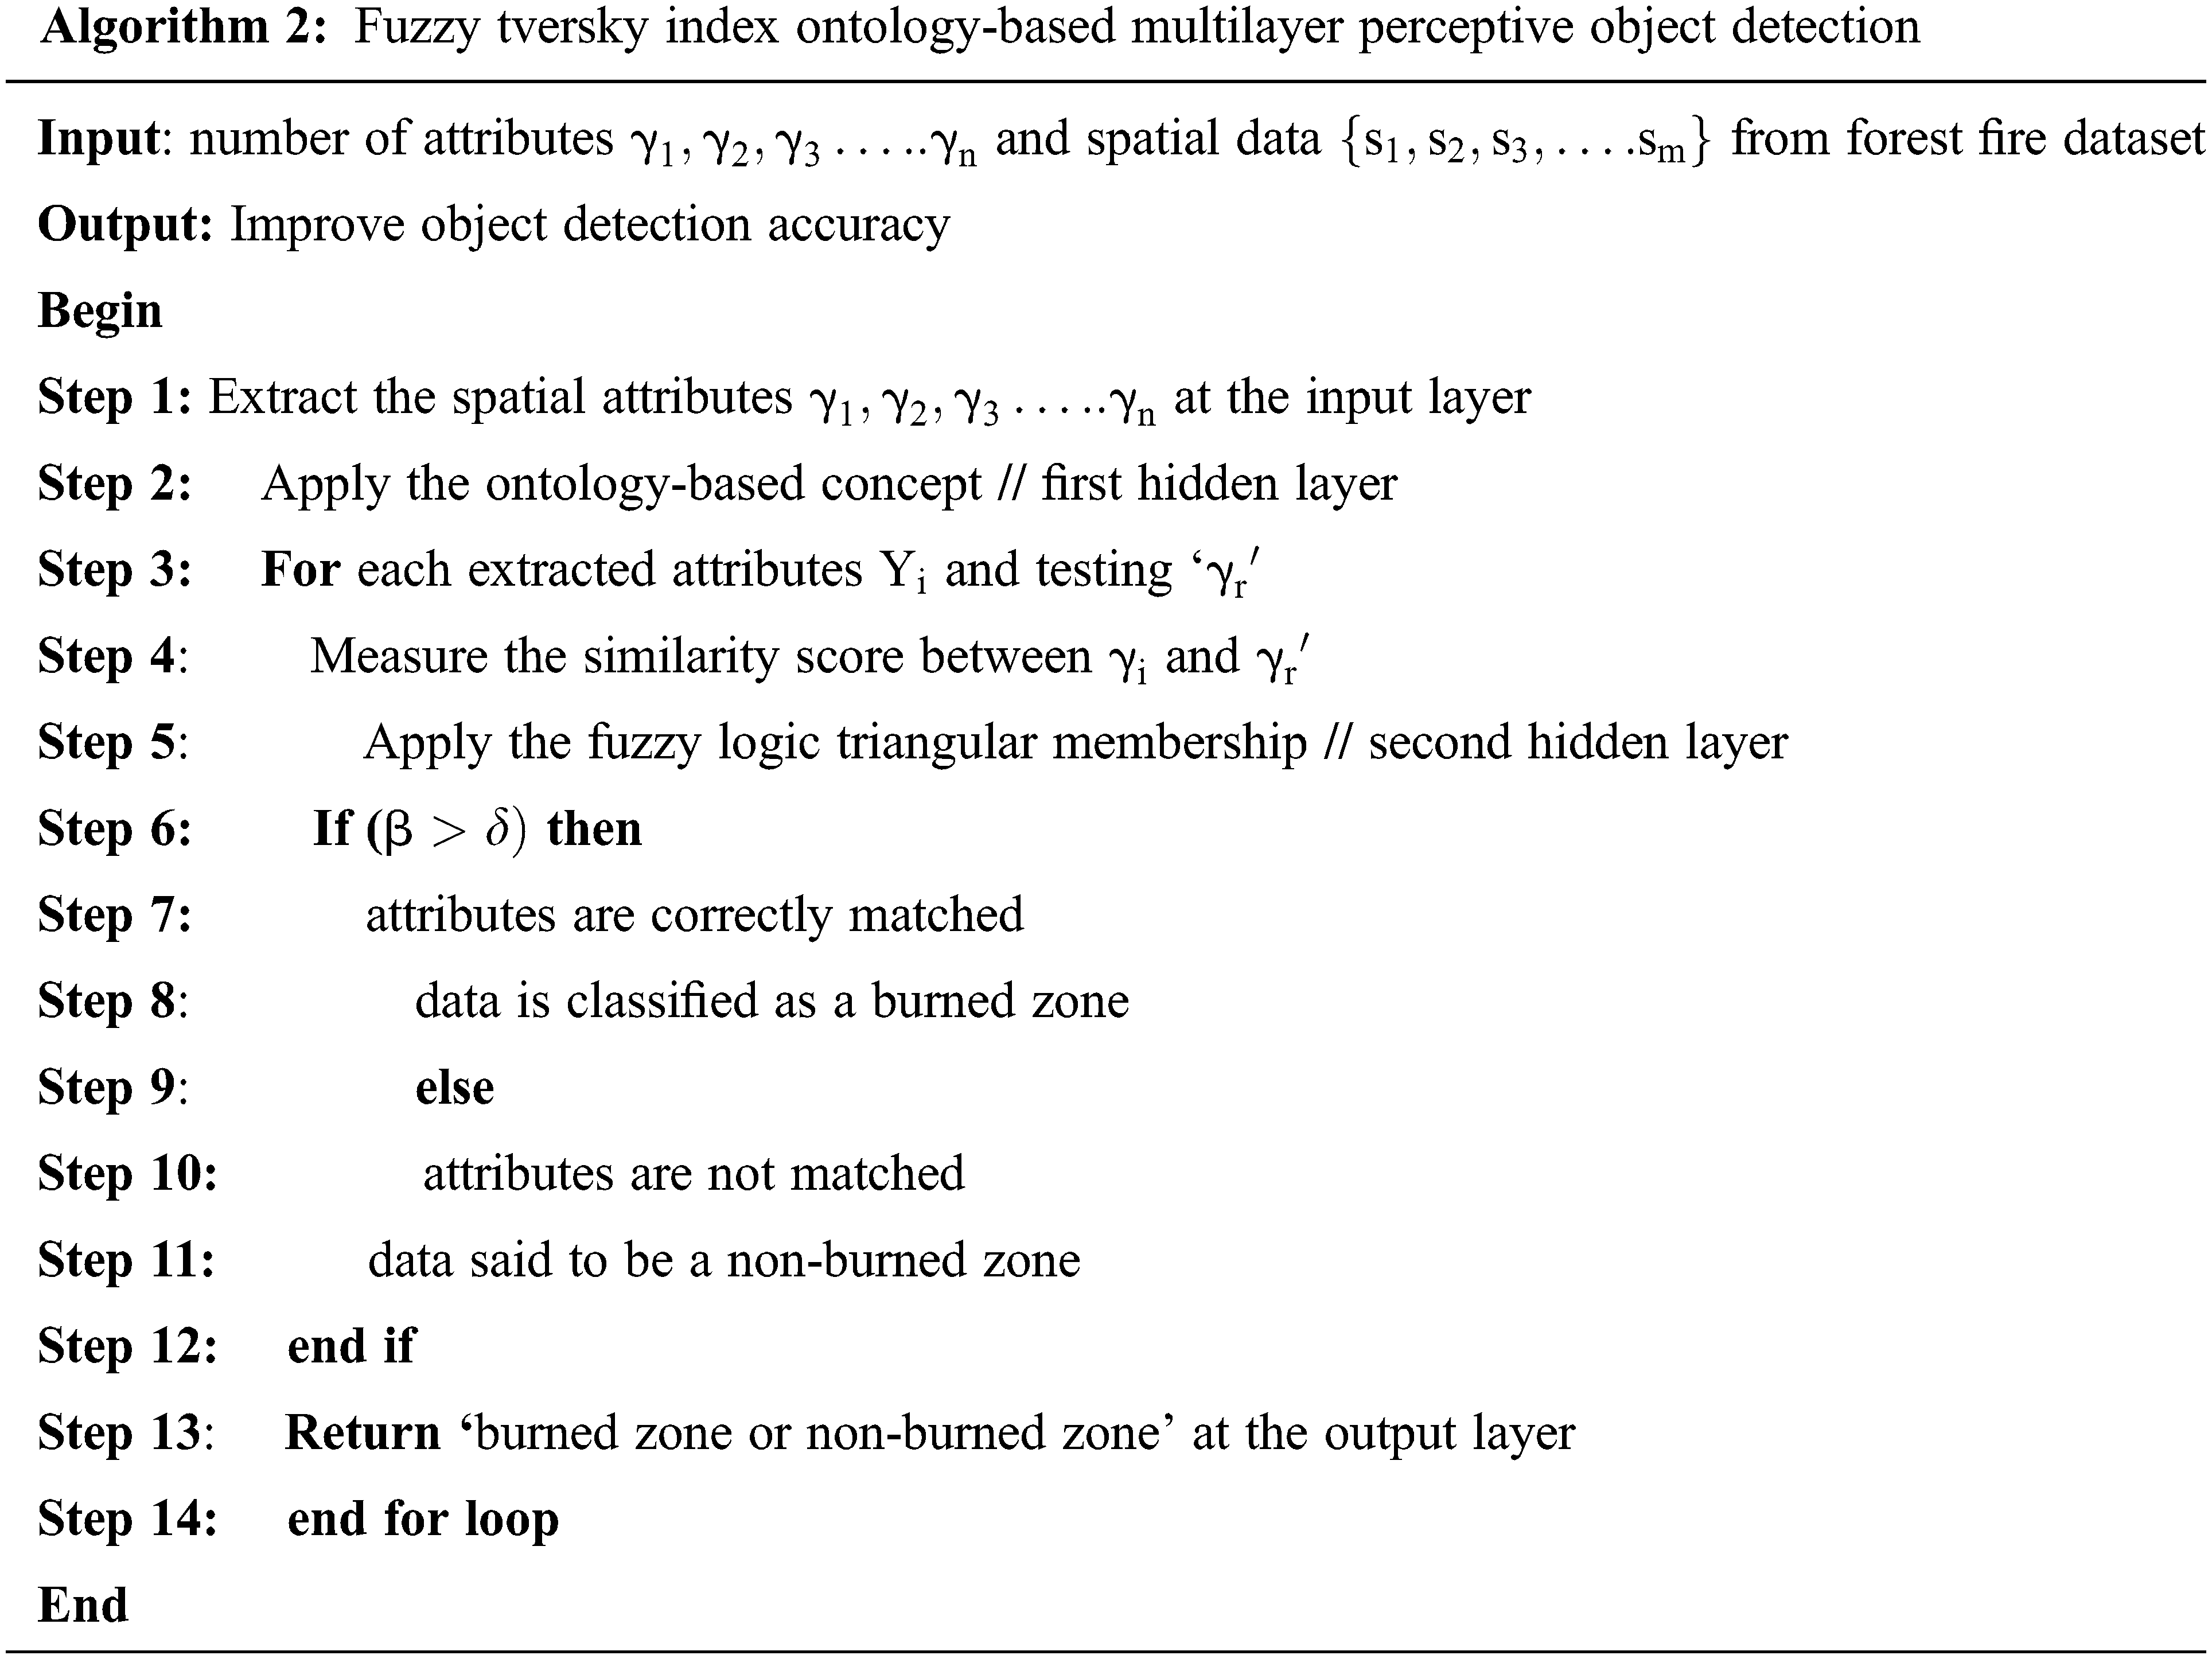
Algorithm 2 provides the step-by-step procedure of multiplayer perceptive ontology-based object detection. At first, in the input layer, the numbers of spatial attributes are extracted from the particular region. These spatial attributes are given as input and the input layer is transmitted into the first hidden layer. An ontology concept is applied in that layer to perform the semantic similarity search between the testing and training attributes using the Tversky index. The similarity score is evaluated between the extracted and testing attributes. The similarity score is shifted into the second hidden layer. In that layer, the fuzzy logic triangular membership function is applied to evaluate the estimated similarity score with the threshold value. If the similarity is higher than the threshold, then the attributes are correctly matched and the data is identified as the burned zone. Otherwise, the attributes are not correctly matched and the data is detected as a non-burned zone at the output layer. As a result, the object is correctly detected with lesser time consumption and higher precision.
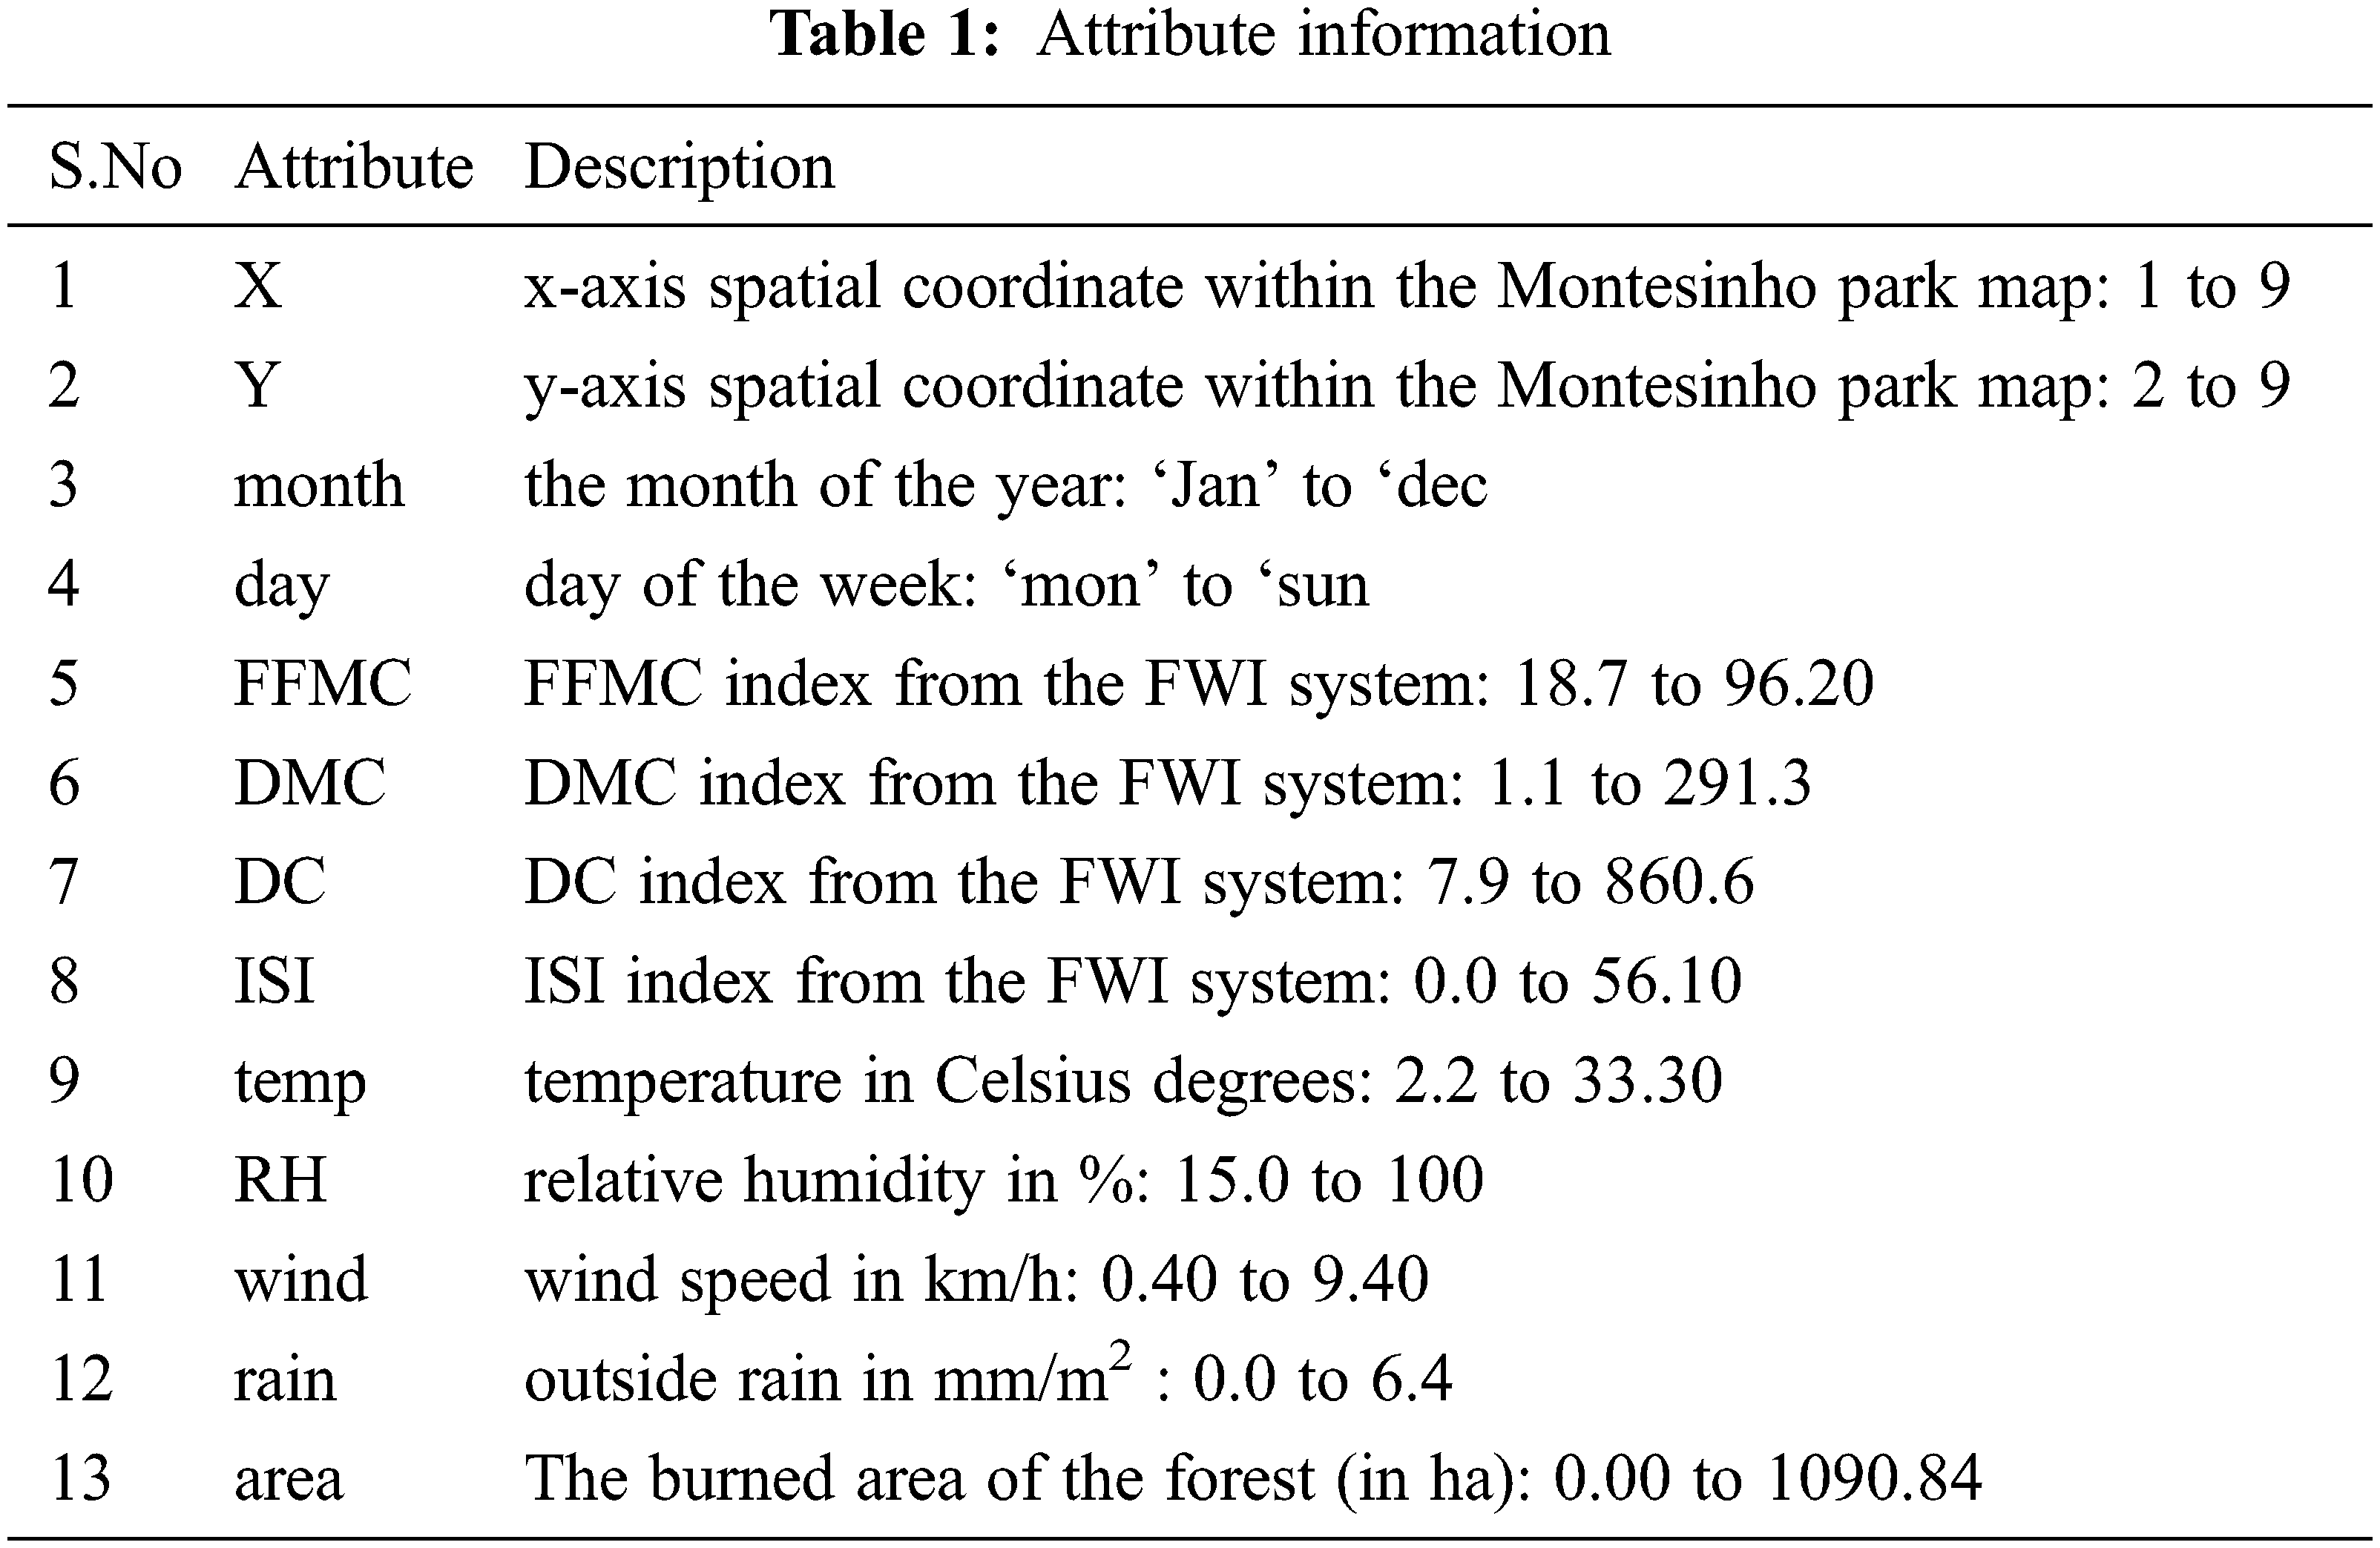
In this section, experimental evaluation of proposed FTIO-MPOD and existing LEDT, IFDS, Ensemble learning methods, and SVM Classifier is implemented using Java language. To perform the spatial object detection, Forest Fires Dataset [35] is taken from the UCI machine learning repository. In the Forest Fires dataset, the main aim is to discover the burned area of forest fires using meteorological data. The dataset comprises 517 instances. The number of spatial data (i.e. instances) as input is gathered from the dataset. The regression is the dataset’s associated task. The dataset characteristics are multivariate and the characteristics of the attribute are real. The dataset includes 13 attributes. The attribute information is listed in Tab. 1. Hence, the proposed technique chooses the Forest Fires dataset to evaluate the experiment.
In this section, the performance of FTIO-MPOD and existing LEDT, IFDS, Ensemble learning method, and SVM Classifier are discussed with different metrics such as classification rate, error rate, precision, and time and space complexity. The performance results are discussed based on the spatial data (i.e., instances) considered in the range from 50–500.
5.1 Impact of Classification Rate
A (CR) Classification Rate is calculated based on the accuracy of object detection. Thus, CR is measured as the ratio of a number of SD is accurately classified to detect the object i.e., burned locality of forest to the total number of SD taken as input. A CR is formulated by given below,
In the explanation of Eq. (5), ‘
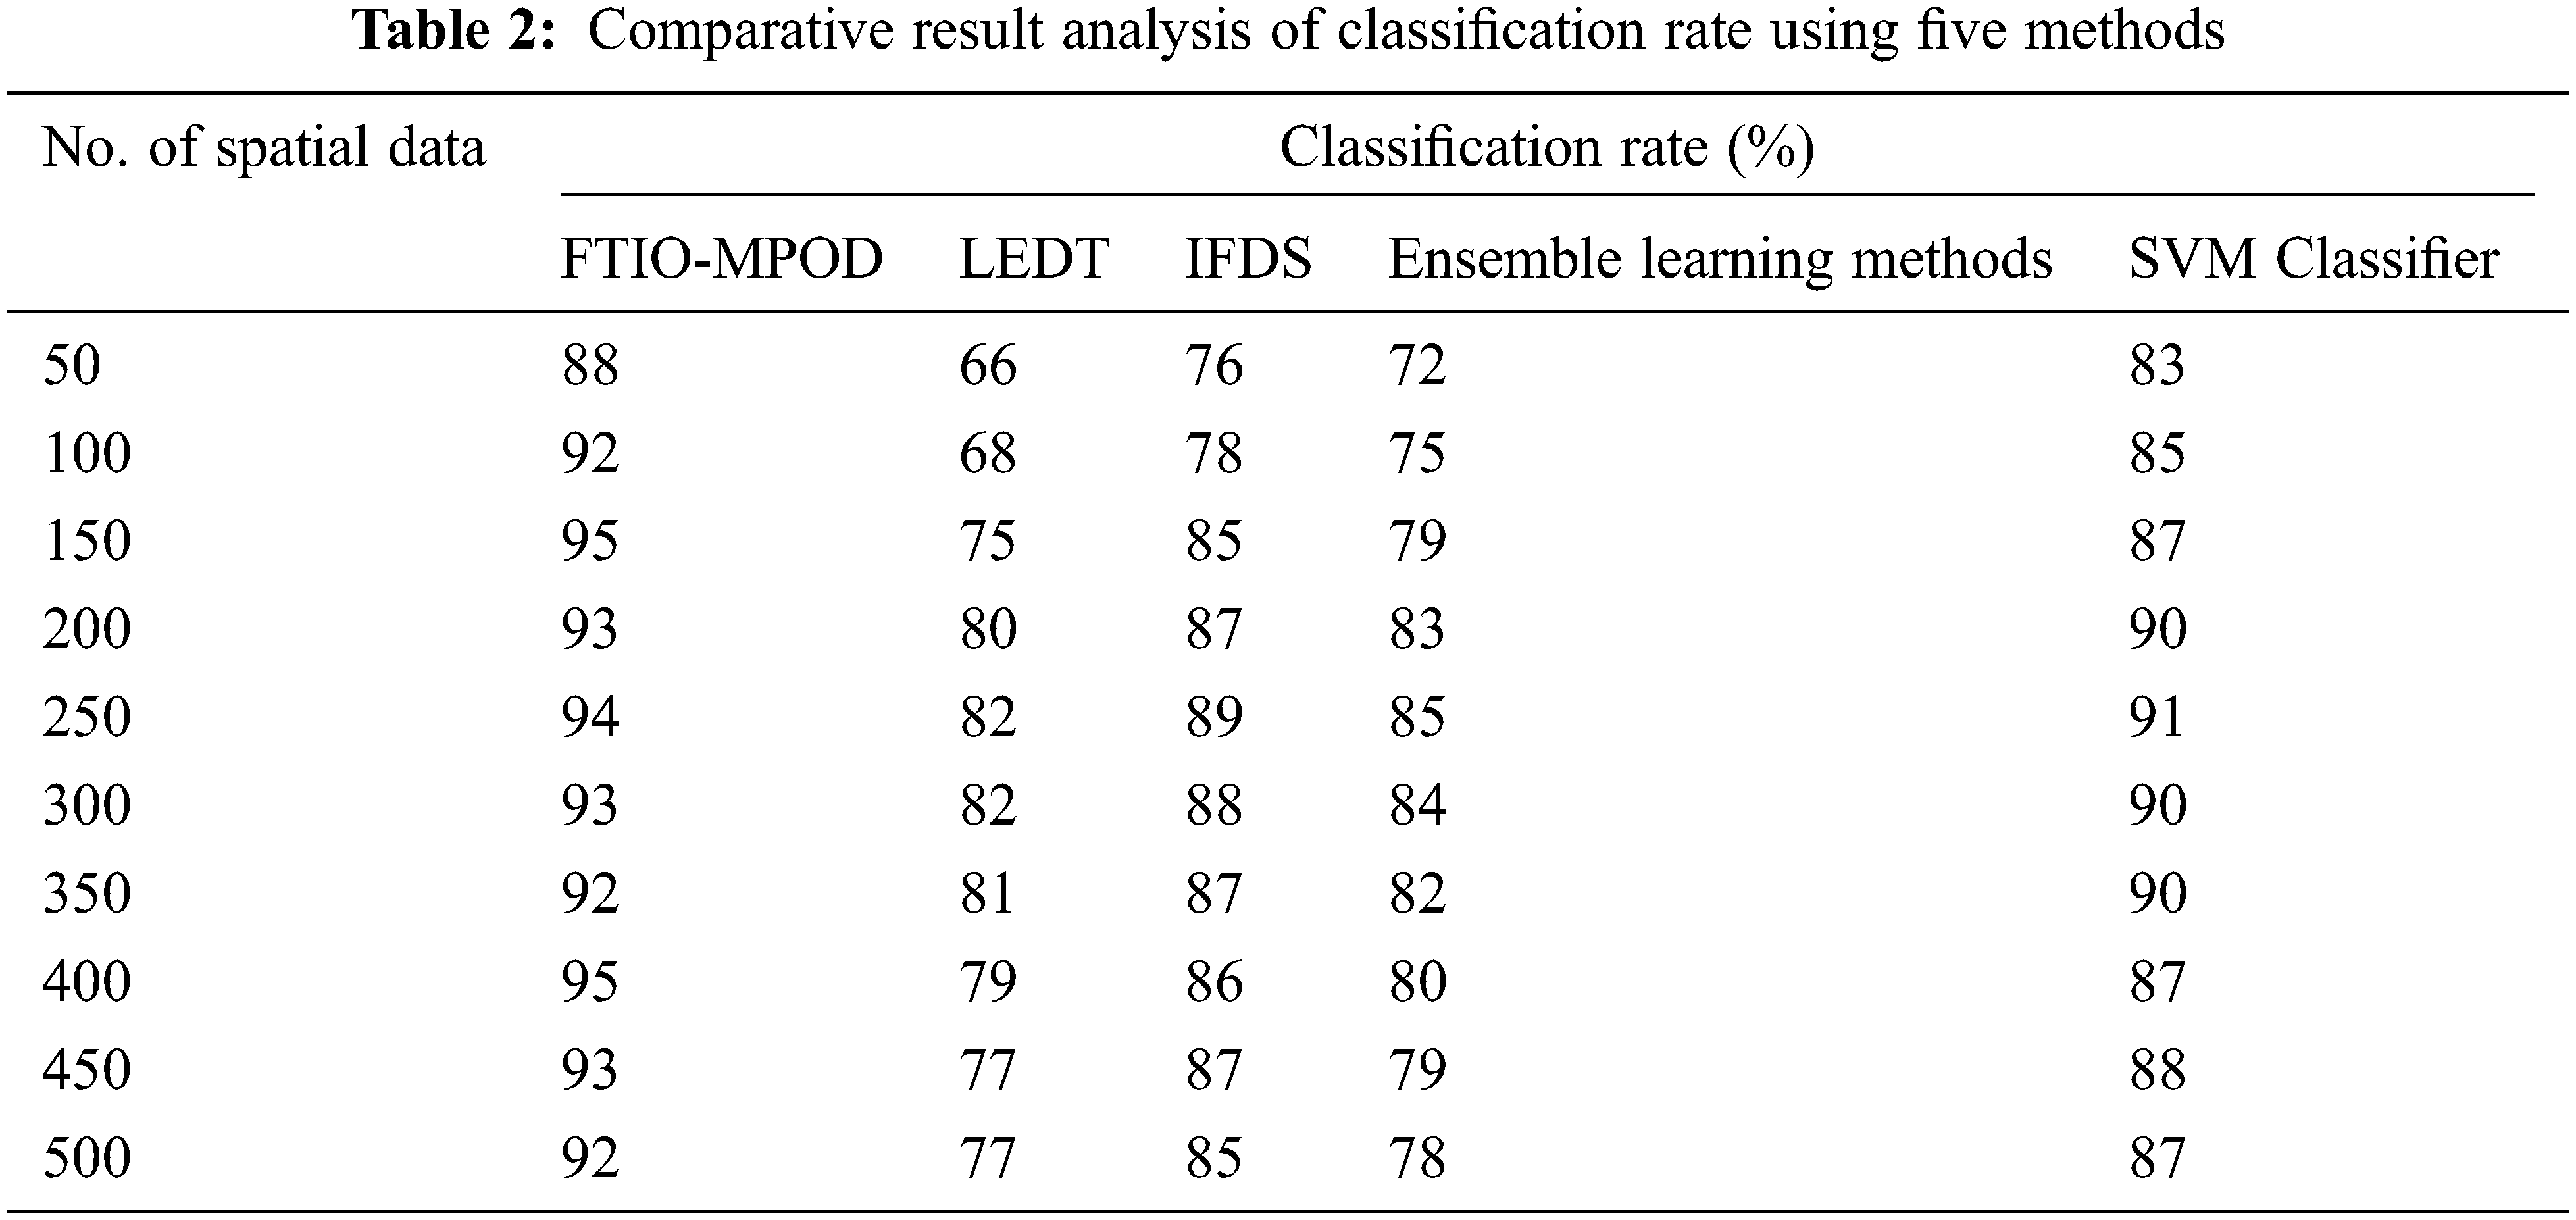
As shown in Tab. 2, the experimental results of classification rate are described with respect to a number of spatial data taken from the dataset in the ranges from 50 to 500. The experimented results indicate that the FTIO-MPOD technique provides better performance in the classification rate than the conventional LEDT, IFDS, Ensemble learning methods, and SVM Classifier respectively. As shown in Tab. 1, ten performance runs are carried out for each method with different input spatial data 50,100,150,200…500. In the first run, 50 spatial data are considered to conduct the experiments and calculate the classification rate. The FTIO-MPOD technique uses the ontology-based multilayer perceptron to classify 44 data out of 50 data and therefore classification rate is 88%. Whereas the LEDT, IFDS, Ensemble learning methods, and SVM Classifier classifies 33 data, 38 data, 36 data, and 42 data out of 50 data. Therefore, the classification rate is 66%, 76%, 72%, and 83% respectively. Finally, the average of ten results indicates that the FTIO-MPOD technique increases the classification rate by 21% when compared to LEDT, 10% when compared to IFDS, 17% when compared to Ensemble learning methods, and 6% when compared to SVM Classifier respectively. This is due to the application of the ontology-based multilayer perceptive object detection technique. The spatial attributes are collected from the forest fire dataset and applied to the ontology concept to measure the semantic similarity search between the testing and training attributes using the Tversky index. Based on the similarity score, the fuzzy logic triangular membership rule is applied to find the burned zone with higher accuracy.
In this work, Error Rate (ER) is determined based on the false positive rate of object detection through spatial data classification Fig. 4. From that, ER is measured as the ratio of a number of SD mistakenly categorized to the total number of SD acquired as input. The ER is calculated as given below,
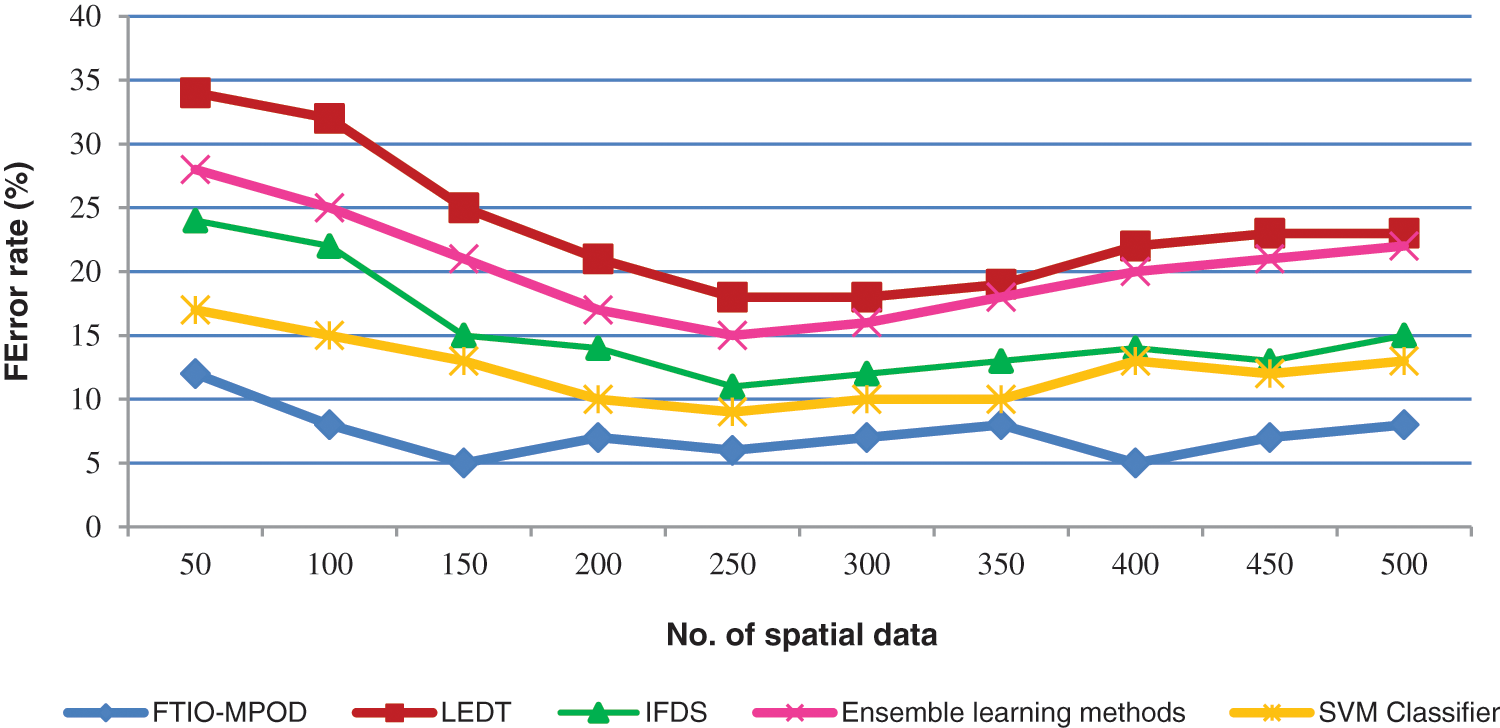
Figure 4: Graphical representation of the error rate
In the explanation of Eq. (6), ‘
Fig. 5 indicates the experimental results of error rate using five different methods namely FTIO-MPOD technique, LEDT, IFDS, Ensemble learning methods, and SVM Classifier. The observed results indicate that the error rate of the five methods is calculated. Let us consider 50 spatial data for calculating the error rate. By applying an FTIO-MPOD, 6 spatial data are incorrectly classified and the error rate is 12%. Similarly, 17, 12, 14, and 8 spatial data are incorrectly classified using LEDT, IFDS, Ensemble learning methods, and SVM Classifier and the error rates are 34%, 24%, 28%, and 17% respectively. The above quantitative measure demonstrates that the FTIO-MPOD technique minimizes the error rate. Finally, the overall evaluation results prove that the error range is significantly decreased via 68%, 51%, 64%, and 39% when compared to the LEDT, IFDS, Ensemble learning methods, and SVM Classifier respectively. The reason is that the FTIO-MPOD technique uses the fuzzy triangular membership function to estimate the similarity score with the threshold value. If the similarity is higher than the threshold, then the burned zone is correctly identified and the incorrect classification at the output layer is reduced.
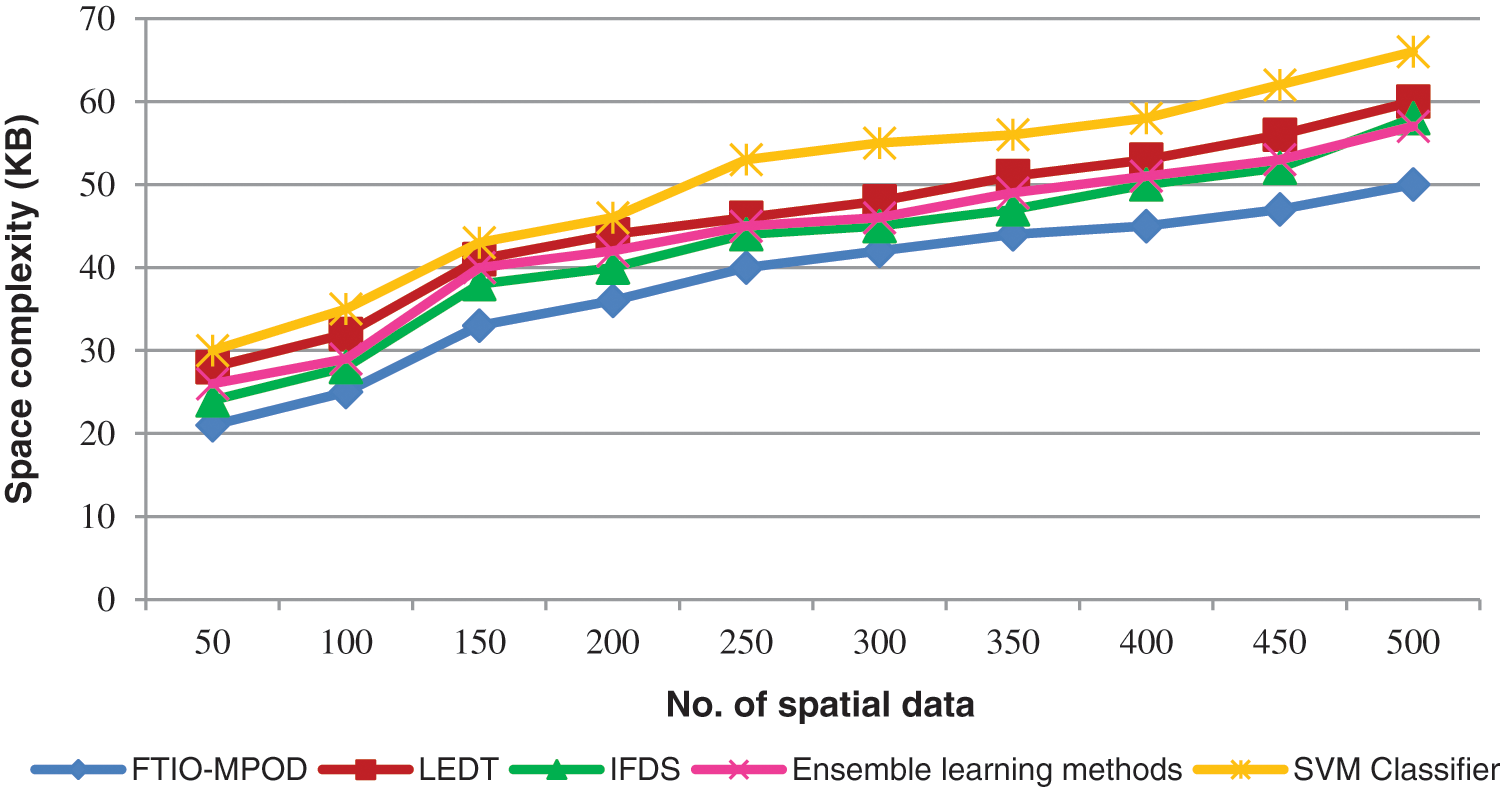
Figure 5: Graphical representation of space complexity
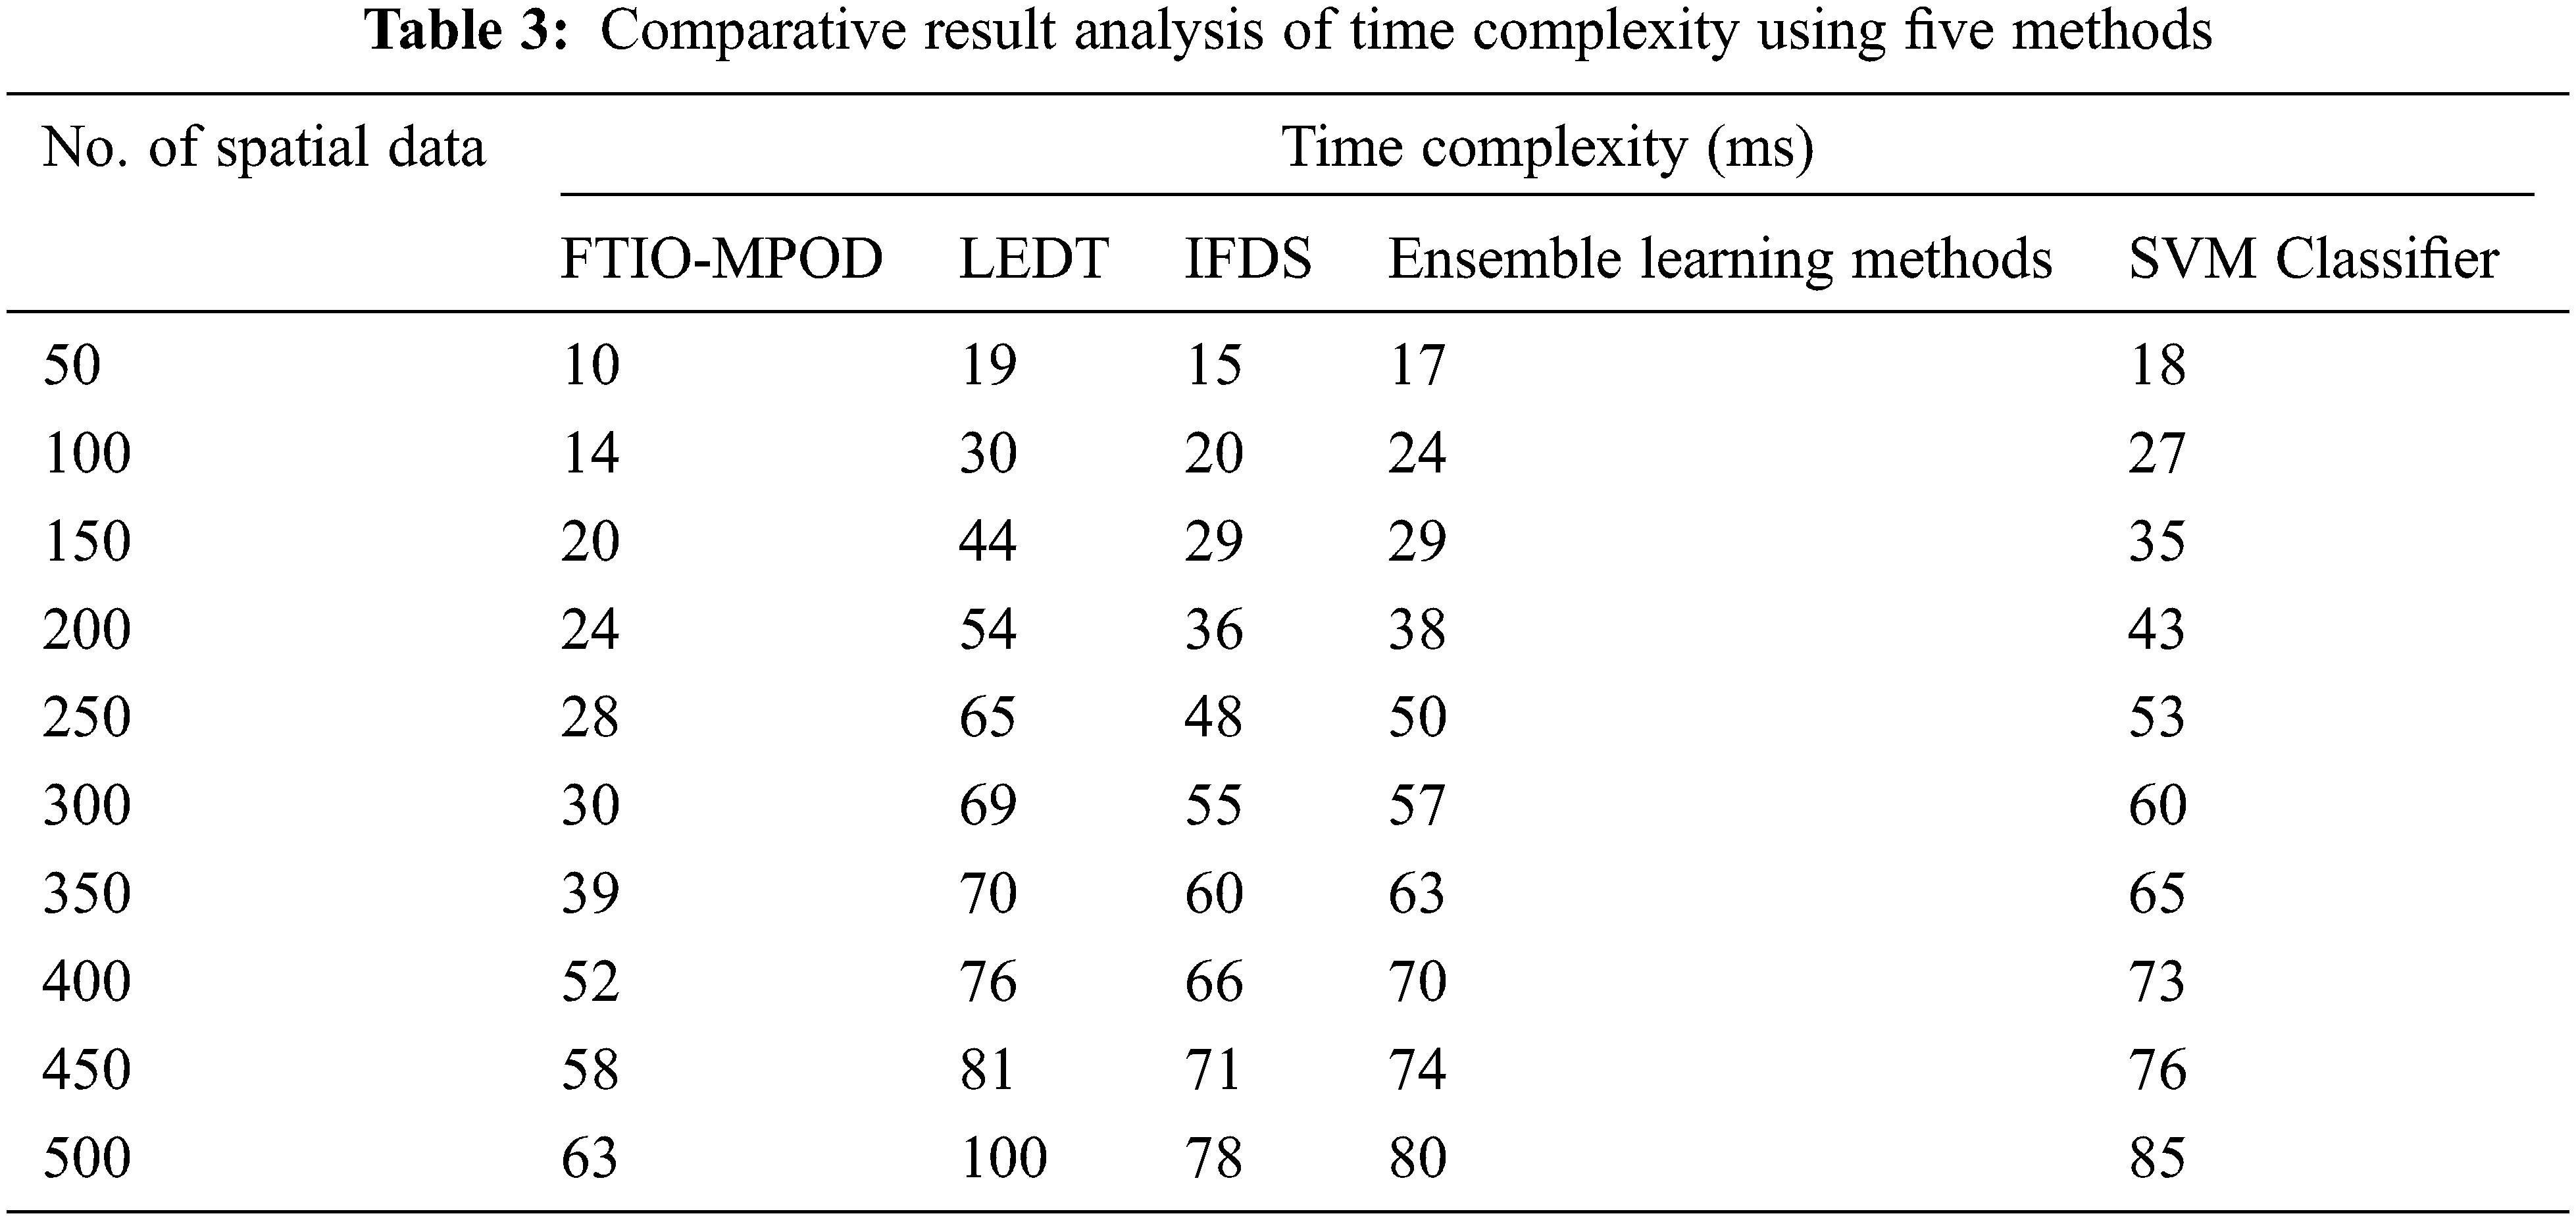
5.3 Impact of Time Complexity (TC)
A (TC) Time complexity is evaluated based on the classification time of spatial data to exactly find the objects. Thus, TC measures the total amount of time taken to classify the SD as burned or non-burned zone. Therefore, the TC is calculated as given below,
In the explanation of Eq. (7), ‘
Tab. 3 describes the performance results of time complexity versus the number of spatial data. An experimental outcome indicates that the time consumption of the FTIO-MPOD is reduced when compared to conventional methods. The experiments are conducted for 50 spatial data, the proposed FTIO-MPOD technique time complexity is
5.4 Impact of Space Complexity
The space complexity measures the total amount of space consumed to store the SD during the object detection process. Therefore, the space complexity time is measured as given below,
In the explanation of Eq. (8), ‘
Fig. 5 illustrates the experimental analysis of the space complexity of SDM with respect to a number of data. The comparative results show that the proposed FTIO-MPOD technique minimizes the space complexity for big data processing compared to other existing algorithms. This is because the FTIO-MPOD technique performs classification-based object detection. The improved performance of FTIO-MPOD is shown using sample calculation. Let us consider the number of data as 50, the amount of storage space consumed by the FTIO-MPOD technique is
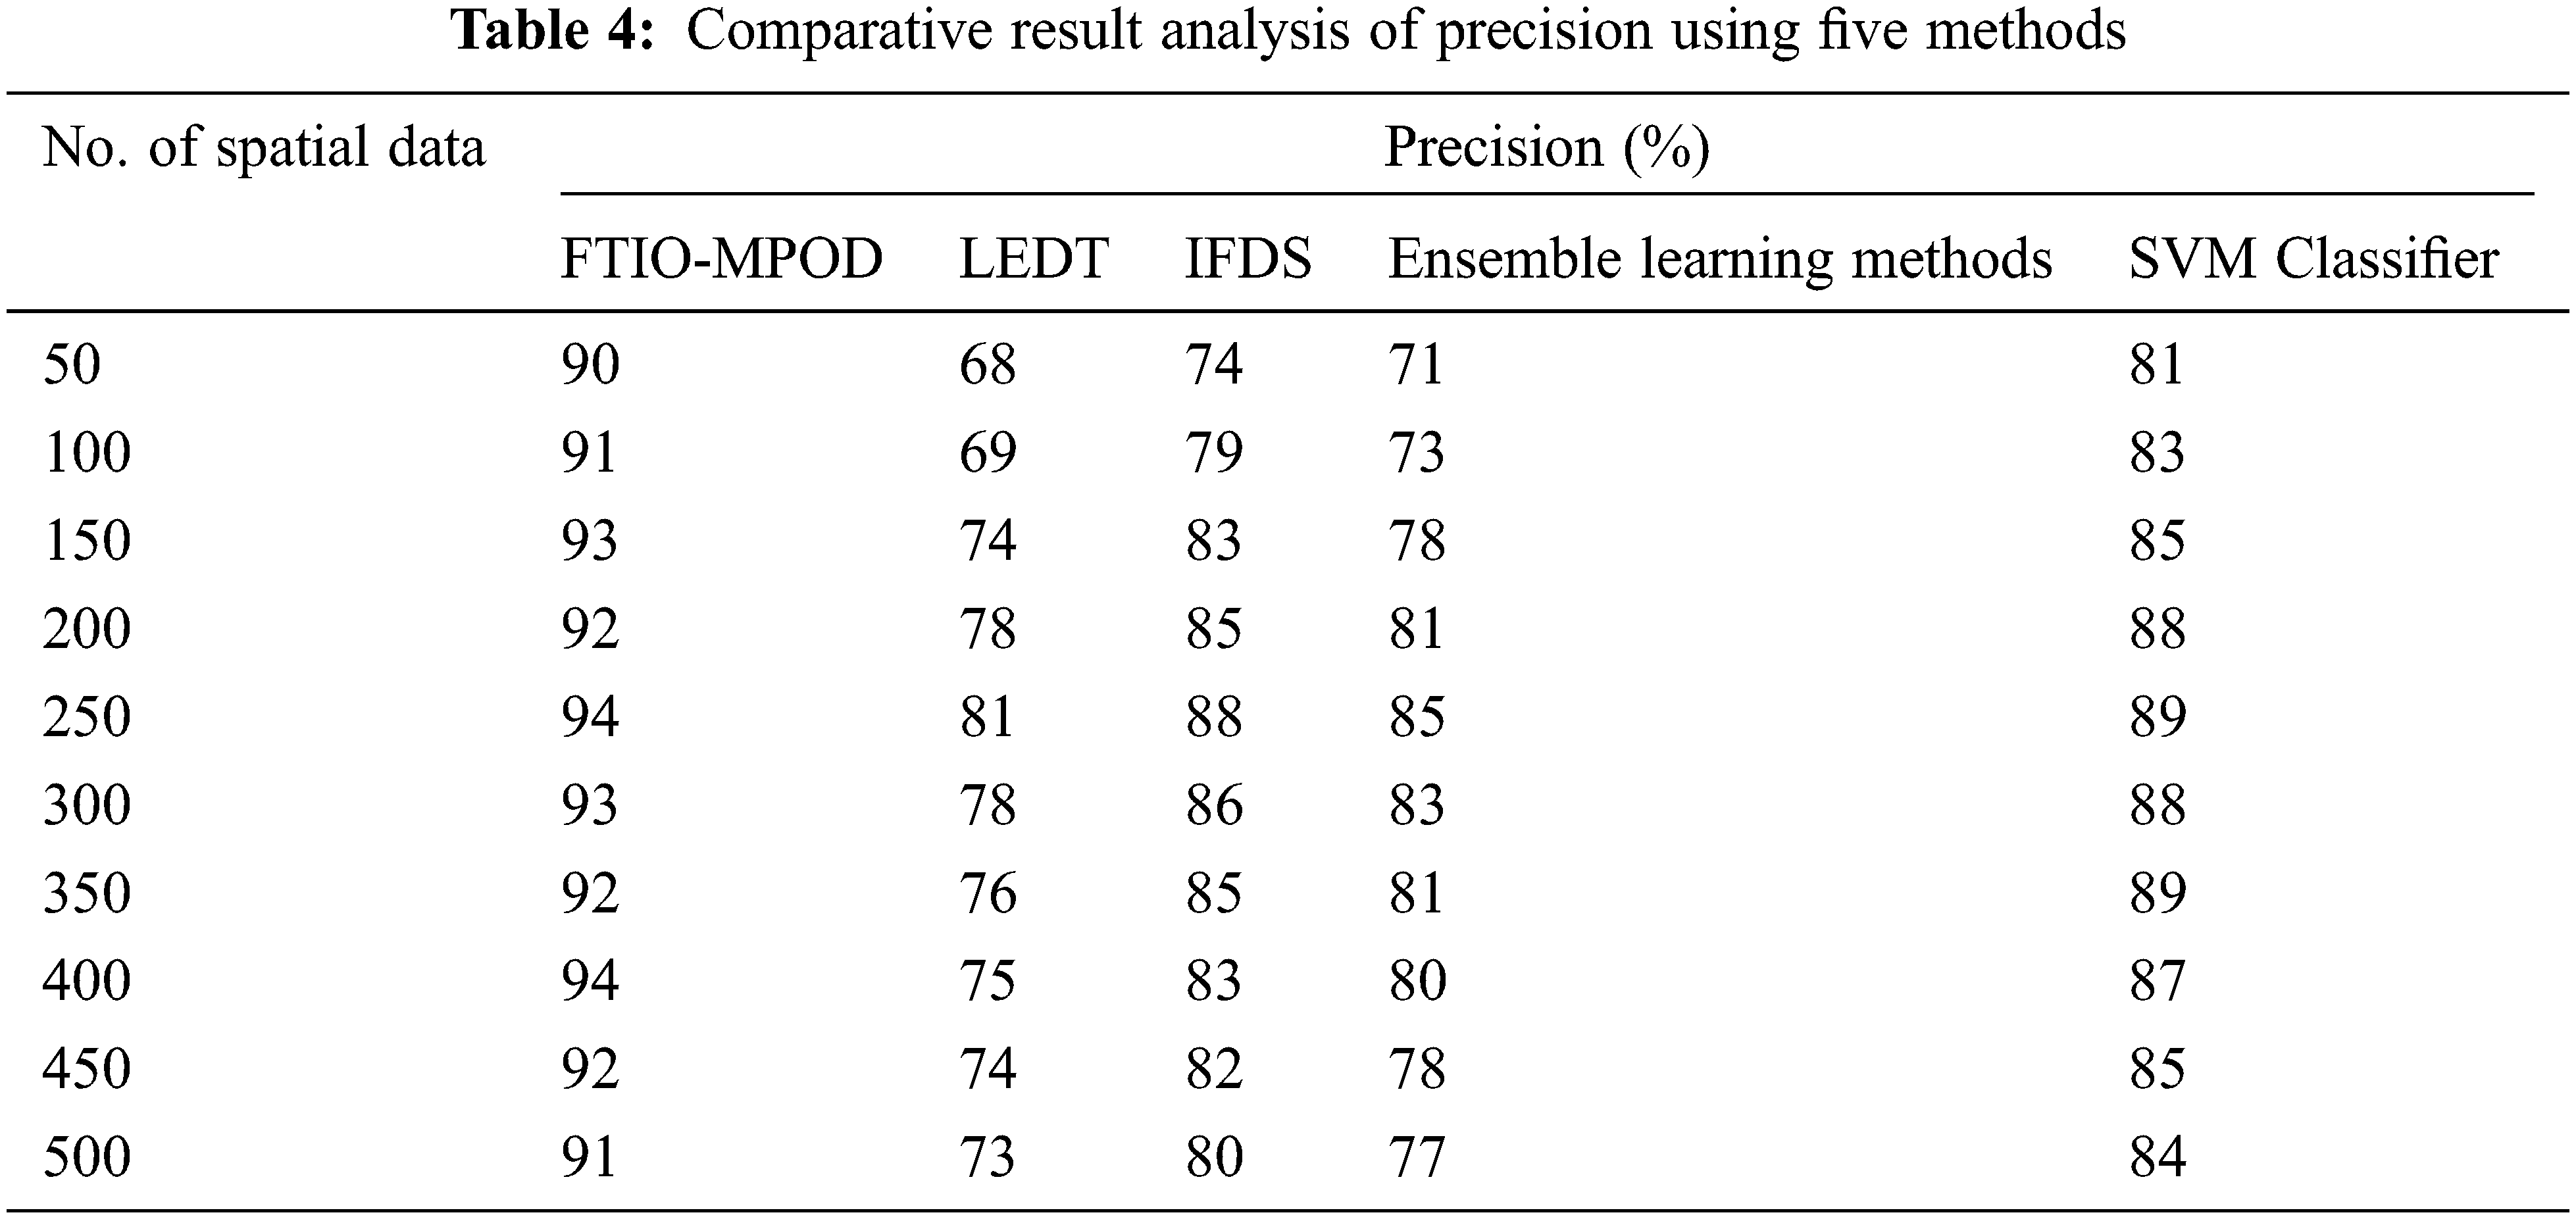
In this work, precision is determined based on spatial data classification. The precision is estimated as given below,
In the explanation of Eq. (9), ‘
Tab. 4 reports the performance analysis of the precision with respect to number of spatial data in ranges from 50 to 500. FTIO-MPOD performs better precision than the other conventional classification technique. This is confirmed through statistical examination. With ‘50’ number of spatial data are considered for experiment and the precision of FTIO-MPOD technique is ‘90 %’, and the precision of LEDT, IFDS, Ensemble learning methods, and SVM Classifier being ‘68%’, ‘74%’, ‘71%’, ‘81%’. Similarly, the remaining runs are performed by the different numbers of spatial data. Precision is improved in the FTIO-MPOD technique by 24%, 12%, 17%, and 7% as compared to state-of-the-art approaches. This is due to the application of the fuzzy logic triangular membership rule is used to estimate the similarity search among the testing and training attributes with aid of the Tversky index. By using the similarity function, the object is discovered with higher precision.
In this paper, a novel technique called the FTIO-MPOD technique is proposed to find the burned zone based on the spatial correlation between the attributes. The aim of the proposed technique is achieved with the aid of the Multilayer Perceptive Neural Learning technique and the Triangular Fuzzy Membership Function for increasing the classification accuracy and reducing the time. The designed FTIO-MPOD Technique correctly categorized the data for spatial data classification as compared to existing methods by the application of the ontology-based multilayer perceptive object detection technique. In addition to that, FTIO-MPOD Technique observes a lesser amount of time to categorize the spatial data as compared to conventional works with the help of the Tversky similarity index. Moreover, FTIO-MPOD Technique reduces the incorrectly classified data for proficient SDM than the state-of-the-art methods by using the fuzzy triangular membership function. The observed results show that the burned locality of forest fire is accurately detected with minimum time. Experimental evaluation is conducted by using Forest Fires Dataset to measure the performance of the FTIO-MPOD technique and existing methods with different metrics such as classification rate, error rate, precision, time complexity, and space complexity. The quantitatively validated result shows that the proposed FTIO-MPOD technique considerably increases the object detection performance with an enhancement of classification rate and minimization of time and space complexity than the conventional methods. The proposed work has successfully performed spatial data mining for determining the objects. But, it failed to extract the more interesting patterns with minimum computation time by using the classification process. Owing to this, the performance of forest fire detection is minimized. In the future, the proposed technique is further extended to extract the interesting pattern in accurate manner with lesser time.
Acknowledgement: The authors with a deep sense of gratitude would thank the supervisor for his guidance and constant support rendered during this research.
Funding Statement: The authors received no specific funding for this study.
Conflicts of Interest: The authors declare that they have no conflicts of interest to report regarding the present study.
1. I. Sebari and D. C. He, “Automatic fuzzy object-based analysis of VHSR images for urban objects extraction,” ISPRS Journal of Photogrammetry and Remote Sensing, vol. 79, no. 3–4, pp. 171–184, 2013. [Google Scholar]
2. S. Paul and D. N. Kumar, “Spectral-spatial classification of hyperspectral data with mutual information based segmented stacked autoencoder approach,” ISPRS Journal of Photogrammetry and Remote Sensing, vol. 138, pp. 265–280, 2018. [Google Scholar]
3. T. A. Perkins, I. Rodriguez-Barraquer, C. Manore, A. S. Siraj, G. España et al., “Heterogeneous local dynamics revealed by classification analysis of spatially disaggregated time series data,” Epidemics, vol. 29, pp. 100357, 2019. [Google Scholar]
4. L. Lin, Y. Meng, A. Yue, Y. Yuan, X. Liu et al., “A spatio-temporal model for forest fire detection using HJ-IRS satellite data,” Remote Sensing, vol. 8, no. 5, pp. 403, 2016. [Google Scholar]
5. S. Ganapathi Subramanian and M. Crowley, “Using spatial reinforcement learning to build forest wildfire dynamics models from satellite images,” Frontiers in ICT, vol. 5, pp. 6, 2018. [Google Scholar]
6. C. Geiß, P. A. Pelizari, H. Schrade, A. Brenning and H. Taubenböck, “On the effect of spatially non-disjoint training and test samples on estimated model generalization capabilities in supervised classification with spatial features,” IEEE Geoscience and Remote Sensing Letters, vol. 14, no. 11, pp. 2008–2012, 2017. [Google Scholar]
7. T. Hengl, M. Nussbaum, M. N. Wright, G. B. Heuvelink and B. Gräler, “Random forest as a generic framework for predictive modeling of spatial and spatio-temporal variables,” PeerJ, vol. 6, no. 8, pp. e5518, 2018. [Google Scholar]
8. E. Jang, Y. Kang, J. Im, D. Lee, J. Yoon et al., “Detection and monitoring of forest fires using himawari-8 geostationary satellite data in South Korea,” Remote Sensing, vol. 11, no. 3, pp. 271, 2019. [Google Scholar]
9. L. Dreiziene and K. Ducinskas, “Comparison of spatial linear mixed models for ecological data based on the correct classification rates,” Spatial Statistics, vol. 35, no. 4, pp. 1–14, 2020. [Google Scholar]
10. P. Sinha, A. E. Gaughan, F. R. Stevens, J. J. Nieves, A. Sorichetta et al., “Assessing the spatial sensitivity of a random forest model: Application in gridded population modeling,” Computers Environment and Urban Systems, vol. 75, no. 2, pp. 132–145, 2019. [Google Scholar]
11. X. Zhang, G. J. He, Z. M. Zhang, Y. Peng and T. F. Long, “Spectral-spatial multi-feature classification of remote sensing big data based on a random forest classifier for land cover mapping,” Cluster Computing, vol. 20, no. 3, pp. 2311–2321, 2017. [Google Scholar]
12. Y. Xie and M. Peng, “Forest fire forecasting using ensemble learning approaches,” Neural Computing and Applications, vol. 31, no. 9, pp. 4541–4550, 2019. [Google Scholar]
13. M. S. Tehrany, S. Jones, F. Shabani, F. Martínez-Álvarez and D. T. Bui, “A novel ensemble modeling approach for the spatial prediction of tropical forest fire susceptibility using LogitBoost machine learning classifier and multi-source geospatial data,” Theoretical and Applied Climatology, vol. 137, no. 1, pp. 637–653, 2019. [Google Scholar]
14. M. M. Müller, L. Vilà-Vilardell and H. Vacik, “Towards an integrated forest fire danger assessment system for the European alps,” Ecological Informatics, vol. 60, no. 42, pp. 101151, 2020. [Google Scholar]
15. G. Zhang, M. Wang and K. Liu, “Forest fire susceptibility modeling using a convolutional neural network for Yunnan province of China,” International Journal of Disaster Risk Science, vol. 10, no. 3, pp. 386–403, 2019. [Google Scholar]
16. S. Ren, K. He, R. Girshick, X. Zhang and J. Sun, “Object detection networks on convolutional feature maps,” IEEE Transactions on Pattern Analysis and Machine Intelligence, vol. 39, no. 7, pp. 1476–1481, 2016. [Google Scholar]
17. Y. Peng and Y. Wang, “Real-time forest smoke detection using hand-designed features and deep learning,” Computers and Electronics in Agriculture, vol. 167, pp. 105029, 2019. [Google Scholar]
18. K. Makantasis, K. Karantzalos, A. Doulamis and K. Loupos, “Deep learning-based man-made object detection from hyperspectral data,” in Proc. Int. Symp. on Visual Computing, Las Vegas, NV, USA, 9474, pp. 717–727, 2015. [Google Scholar]
19. R. Vohra and K. C. Tiwari, “Spatial shape feature descriptors in classification of engineered objects using high spatial resolution remote sensing data,” Evolving Systems, vol. 11, no. 4, pp. 647–660, 2020. [Google Scholar]
20. A. K. Wijayanto, O. Sani, N. D. Kartika and Y. Herdiyeni, “Classification model for forest fire hotspot occurrences prediction using ANFIS algorithm,” in Proc. IOP Conf. Series: Earth and Environmental Science, Bogor, Indonesia, pp. 012059, 2017. [Google Scholar]
21. Z. Xie, W. Song, R. Ba, X. Li and L. Xia, “A spatiotemporal contextual model for forest fire detection using himawari-8 satellite data,” Remote Sensing, vol. 10, no. 12, pp. 1992, 2018. [Google Scholar]
22. Z. Lin, F. Chen, Z. Niu, B. Li, B. Yu et al., “An active fire detection algorithm based on multi-temporal fengyun-3C VIRR data,” Remote Sensing of Environment, vol. 211, no. 18, pp. 376–387, 2018. [Google Scholar]
23. P. K. Srivastava, G. P. Petropoulos, M. Gupta, S. K. Singh, T. Islam et al., “Deriving forest fire probability maps from the fusion of visible/infrared satellite data and geospatial data mining,” Modeling Earth Systems and Environment, vol. 5, no. 2, pp. 627–643, 2019. [Google Scholar]
24. C. Zhang, D. Selch, Z. Xie, C. Roberts, H. Cooper et al., “Object-based benthic habitat mapping in the florida keys from hyperspectral imagery,” Estuarine Coastal and Shelf Science, vol. 134, pp. 88–97, 2013. [Google Scholar]
25. F. C. Eugenio, A. R. Dos Santos, N. C. Fiedler, G. A. Ribeiro, A. G. da Silva et al., “GIS applied to location of fires detection towers in domain area of tropical forest,” Science of the Total Environment, vol. 562, no. 2, pp. 542–549, 2016. [Google Scholar]
26. H. R. Pourghasemi, A. Gayen, R. Lasaponara and J. P. Tiefenbacher, “Application of learning vector quantization and different machine learning techniques to assessing forest fire influence factors and spatial modelling,” Environmental Research, vol. 184, no. 18, pp. 109321, 2020. [Google Scholar]
27. Z. Q. Zhao, P. Zheng, S. T. Xu and X. Wu, “Object detection with deep learning: A review,” IEEE Transactions on Neural Networks and Learning Systems, vol. 30, no. 11, pp. 3212–3232, 2019. [Google Scholar]
28. A. Koltunov, S. L. Ustin, B. Quayle, B. Schwind, V. G. Ambrosia et al., “The development and first validation of the GOES early fire detection algorithm,” Remote Sensing of Environment, vol. 184, no. 1–2, pp. 436–453, 2016. [Google Scholar]
29. M. A. Mahmoud and H. Ren, “Forest fire detection using a rule-based image processing algorithm and temporal variation,” Mathematical Problems in Engineering, vol. 2018, no. 7, pp. 1–8, 2018. [Google Scholar]
30. D. A. Wood, “Prediction and data mining of burned areas of forest fires: Optimized data matching and mining algorithm provides valuable insight,” Artificial Intelligence in Agriculture, vol. 5, no. 2, pp. 24–42, 2021. [Google Scholar]
31. M. Kumar and A. Sharma, “An integrated framework for software vulnerability detection, analysis and mitigation: An autonomic system,” Sādhanā, vol. 42, no. 9, pp. 1481–1493, 2017. [Google Scholar]
32. M. Bhushan and S. Goel, “Improving software product line using an ontological approach,” Sādhanā, vol. 41, no. 12, pp. 1381–1391, 2016. [Google Scholar]
33. J. R. Ruiz-Sarmiento, C. Galindo, J. Monroy, F. A. Moreno and J. Gonzalez-Jimenez, “Ontology-based conditional random fields for object recognition,” Knowledge-Based Systems, vol. 168, no. 1, pp. 100–108, 2019. [Google Scholar]
34. J. Filali, H. B. Zghal and J. Martinet, “Ontology-based image classification and annotation,” International Journal of Pattern Recognition and Artificial Intelligence, vol. 34, no. 11, pp. 2040002, 2020. [Google Scholar]
35. P. Cortez and A. Morais, “Forest fires dataset UCI machine learning repository,” 2007. [Online]. Available: https://archive.ics.uci.edu/ml/datasets/forest+fires. [Google Scholar]
36. W. Sun, G. Z. Dai, X. R. Zhang, X. Z. He and X. Chen, “TBE-Net: A three-branch embedding network with part-aware ability and feature complementary learning for vehicle re-identification,” IEEE Transactions on Intelligent Transportation Systems, vol. 99, pp. 1–13, 2021. [Google Scholar]
37. W. Sun, L. Dai, X. R. Zhang, P. S. Chang and X. Z. He, “RSOD: Real-time Small object detection algorithm in UAV-based traffic monitoring,” Applied Intelligence, vol. 92, no. 6, pp. 1–16, 2021. [Google Scholar]
 | This work is licensed under a Creative Commons Attribution 4.0 International License, which permits unrestricted use, distribution, and reproduction in any medium, provided the original work is properly cited. |