DOI:10.32604/csse.2023.028451
| Computer Systems Science & Engineering DOI:10.32604/csse.2023.028451 | |
| Article |
Prediction Model for a Good Learning Environment Using an Ensemble Approach
1Department of Computer Science and Engineering, Rajalakshmi Institute of Technology, Chennai, Tamil Nadu, India
2Department of Computer Science and Engineering, Rajalakshmi Engineering College, Chennai, Tamil Nadu, India
*Corresponding Author: S. Subha. Email: subhas.phd@rediffmail.com
Received: 10 February 2022; Accepted: 17 March 2022
Abstract: This paper presents an efficient prediction model for a good learning environment using Random Forest (RF) classifier. It consists of a series of modules; data preprocessing, data normalization, data split and finally classification or prediction by the RF classifier. The preprocessed data is normalized using min-max normalization often used before model fitting. As the input data or variables are measured at different scales, it is necessary to normalize them to contribute equally to the model fitting. Then, the RF classifier is employed for course selection which is an ensemble learning method and k-fold cross-validation (k = 10) is used to validate the model. The proposed Prediction Model for Course Selection (PMCS) system is considered a multi-class problem that predicts the course for a particular learner with three complexity levels, namely low, medium and high. It is operated under two modes; locally and globally. The former considers the gender of the learner and the later does not consider the gender of the learner. The database comprises the learner opinions from 75 males and 75 females per category (low, medium and high). Thus the system uses a total of 450 samples to evaluate the performance of the PMCS system. Results show that the system’s performance, while using locally i.e., gender-wise has slightly higher performance than the global system. The RF classifier with 75 decision trees in the global system provides an average accuracy of 97.6%, whereas in the local system it is 97% (male) and 97.6% (female). The overall performance of the RF classifier with 75 trees is better than 25, 50 and 100 decision trees in both local and global systems.
Keywords: Machine learning; ensemble learning; random forest; data mining; prediction system
Information access becomes easier nowadays due to adopting new technologies in the World Wide Web. There is a drastic growth in the number of online users in many domains such as online shopping, e-learning, health care, telemarketing and retail industries. Data mining is considered an active way to analyze the data received from the community. Also, the predictive analysis can be done using different information collected from the users and their browsing histories. The problem can be narrowed down using machine learning, which can minimize the challenges for a particular problem.
E-learning provides a quality educational experience so that it reduces almost half of the learning time compared to traditional learning. It becomes an effective tool in the learning process which is followed in many colleges and universities across the globe [1]. For example, the University of Maryland, Baltimore County, uses a learning analytics tool from the Blackboard learning content management system [2]. It helps them to track the progress of the learner. But in web-based systems, there is a lack of face-to-face interaction among the users and course drop, which is a significant challenge, identified and has to be dealt with seriously. By making the students to attend the registered course with at most interest and involvement can overcome this challenge. This also enables them to participate in the assessment on time with perfection and finally, they can turn over to write the exams.
The learners can choose more than one course in a particular period, learning with more zeal. Three discrete learning styles, auditory, visual, and kinesthetic, can be accommodated together in a single e-learning environment. Multiple analysis tools analyze the students’ performance and progress in different ways. There are three major categories; massive open online course, corporate open online course, and small private open course. The massive available online course is predominantly used by all kinds of people simultaneously. Machine learning algorithms are used to implement user tasks and get efficient results. They are categorized as supervised learning, unsupervised learning, and reinforcement learning. These algorithms are performed without human intervention. These are the programs that can learn from data, and they can do a lot of improvisations from experience.
Supervised machine learning infers a function from the labeled training data, and the inputs and outputs are well defined. It builds a model so that the class labels for unseen instances are correctly determined. The best-suited example for supervised learning is the Random Forest (RF) algorithm, in which the ensemble technique is used. In this technique, the predictions of multiple machine learning models are combined to produce a more accurate prediction on a new sample.
One of the renowned platforms is Moodle, and it has become a part of the teaching process in the majority of institutions. It makes a significant impact on the learners’ performance. Learners having lower grades in high school are improving to the next better level. Their level will increase if they have good interaction with the learning management system. Measures for predicting the students’ performance are taken to achieve high prediction accuracy [3]. Also, the trained models are obtained initially, and then the metrics such as accuracy and kappa values of the models are compared in [4]. Machine learning algorithms are used in this work to predict low-engagement students and help them predict course selection.
The attributes obtained from different sources can be quantified by constructing the attribute matrix and using performance-related and non-performance-related attributes. The performance model can be designed [5], and it can be used for further analysis. The backpropagation neural network method is suggested to assess the learners’ performance or attributes using their prior knowledge. In addition to the characteristics of the learners, it is recommended that the adaptation of the course by the students has been determined by an e-learning system that uses long short-term memory and RF classification [6]. There are some essential measures to be considered in online education. After completing the assessment, A student has to fill out an online assessment form. From the students’ inputs, the faculty can identify several strategies to increase students’ motivation [7]. Students’ progress can also be compared by taking exam questions derived from lectures having many in-class questions [8]. Opinions are also collected from the students related to the use of clickers and the effect of the frequency of clicker use on student performance.
Many kinds of classifiers such as Naive Bayes, Decision Trees-J48, and RF are used to progress the excellence of student data by eliminating noisy data at the initial stage and consequently getting good prediction inaccuracy [9]. The systems’ accuracy, verification, and validation can be done in the performance analysis phase. If there is randomness at both the ends, namely data level and model level, it is suggested by Guns and Rousseau [4] that the RF algorithm will yield accurate and robust results. It is mentioned that Moodle is available in 126 languages, and it is relatively easy to navigate. Different plug-ins that manage authentication for Moodle are briefly discussed [10]. Though some users have common interests, it is revealed that some predictions cannot be proposed to those users [11]. It depends upon the learners’ goals, history, and learning style. Data will be enormous and of varied types and can be collected from the institutions if a management system is practiced. Big data is a renowned field that uses effective analysis and the consumption of data to improve the quality of online education [12].
A live example of using an E-learning platform at the University of Catania is taken for analysis in [13]. Learning analytics is considered the important measure for implementing online education, as it extracts information about students’ learning interactions and returns them to teachers. Organizations that use Learning Management System (LMS) must evaluate e-learning projects and analyze the characteristics of LMSs [14]. It is important to get users’ opinions before developing an e-learning system and building an evaluation based on them. But in the case of e-learning blogs, it isn’t easy to apply opinion mining to get users’ opinions [15]. Blended learning is implemented with the Moodle at the Faculty of Administration, University of Ljubljana, but only a limited data set is used [16]. A survey was conducted on 150 students at RGUKT Nuzvid through the Moodle Platform, where they offered blended courses. Moodle generates the activity log files, and they are collected after the course. The model accuracy obtained was 62% [17].
This work presents an ensemble approach-based prediction model for a good learning environment. It uses the ensemble approach to achieve the highest performance by combing the predictions of the RF classifier with a predefined number of trees. Hence, the system is a hybrid system that uses the learner’s opinions for making a good learning environment. The rest of the paper is as follows: The design of the Prediction Model for Course Selection (PMCS) system is discussed in Section 2 with its modules such as data preprocessing, data normalization, data split, and classification modules. Also, the experimental setup and database creation are discussed briefly. Section 3 discusses the results of the PMCS system designed in Section 2 using 450 samples. Finally, the conclusion is made in Section 4.
This section discusses the proposed PMCS system using the RF classifier. It consists of four modules; Data Preprocessing (DP) module, Data Normalization (DN) module, Data Splitting (DS) module and prediction module for course selection. Fig. 1 shows the workflow of the proposed PMCS system using the RF classifier.
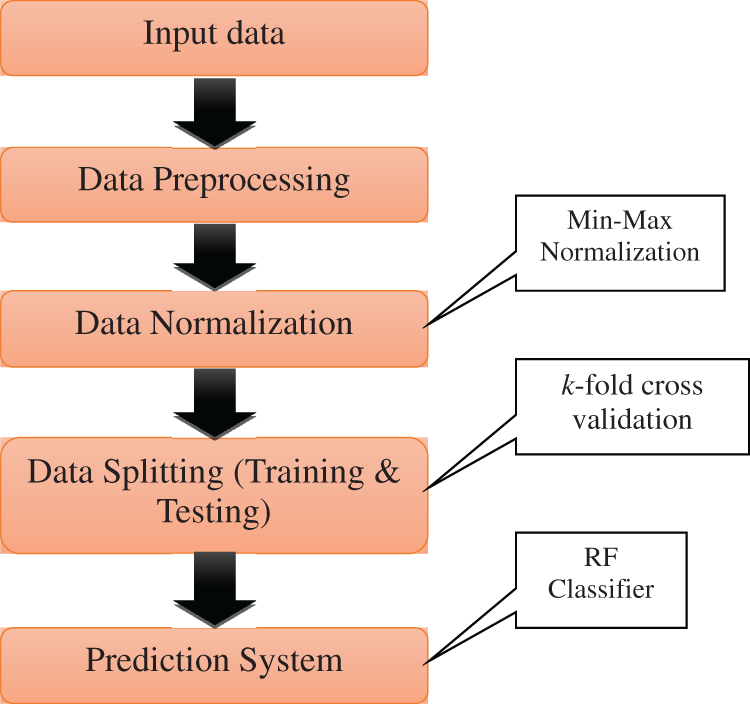
Figure 1: Work flow of the proposed PMCS system using the RF classifier
The sample data set comprising various attributes such as student id, gender, course module, durations, number of clicks etc., are taken as inputs to the proposed PMCS system. Samples from the Moodle LMS are selected randomly and formed as a database for this study. Tab. 1 shows the inputs to the system.

The users with authenticated login credentials can access the e-learning platform in the Moodle LMS. The architecture diagram of Moodle LMS is depicted in Fig. 2.
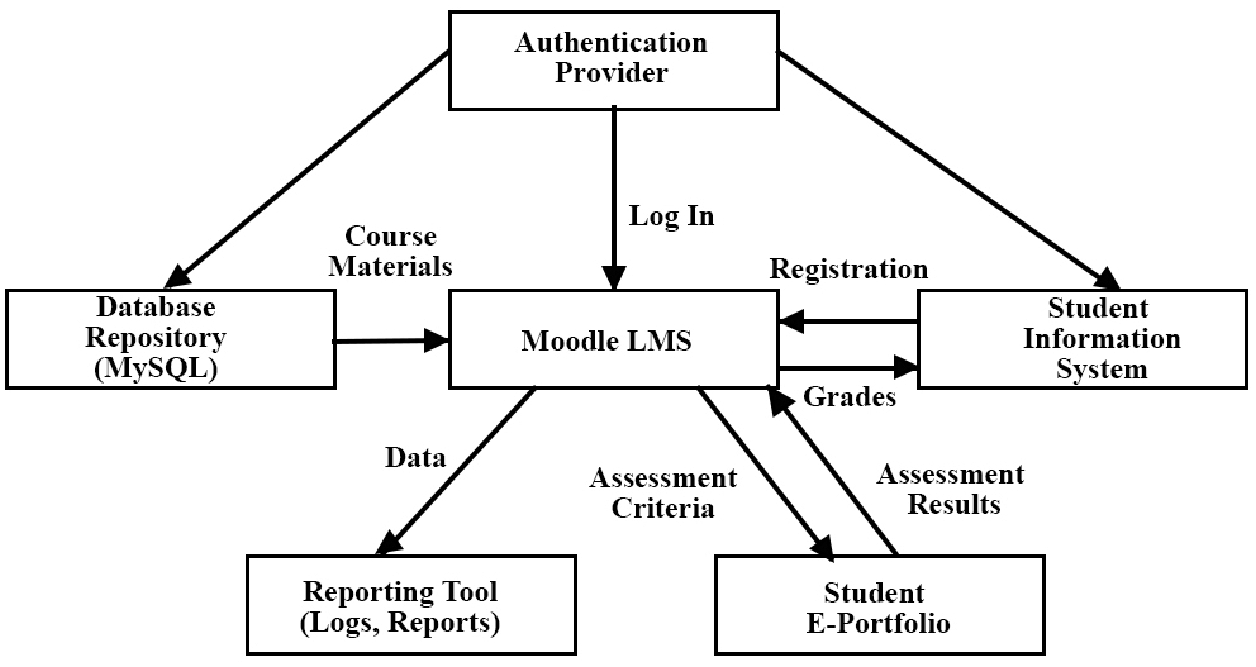
Figure 2: Architecture diagram of moodle LMS
An information system is used in the LMS to maintain all students’ registration and the grade details. Similarly, assessment results can be generated from the student’s e-portfolio after completing their assessments. Data can be stored in logs and reports can be generated using reporting tools. User Interface can be accessed through logging in, checking for the courses, selecting courses and their progress.
In the field of data analytics, the input data is preprocessed at first. In the DP module, the string values are converted into numerical values and then in the DN module they are normalized. After normalization, the range of input data is between 0 and 1. DN is often used before model fitting. As the input data or variables are measured at different scales, it is necessary to normalize them to contribute equally to the model fitting. It also increases the overall system performance. This study uses min-max normalization to normalize the preprocessed data which is defined in Eq. (1).
where min(x) and max(x) is the minimum and maximum value in the particular data.
For any prediction or classification system, the classifier model should be trained with the input data before used for making any decision. To split the input data, k-fold cross validation is employed in the DS module. In this study, the input data is split into k-folds. The main disadvantage of the random split is that there is no optimal split percentage. It should be selected based on the objectives of the system. Also, all the samples are not tested using the random split approach. Fig. 3 shows the 5-fold cross validation system.
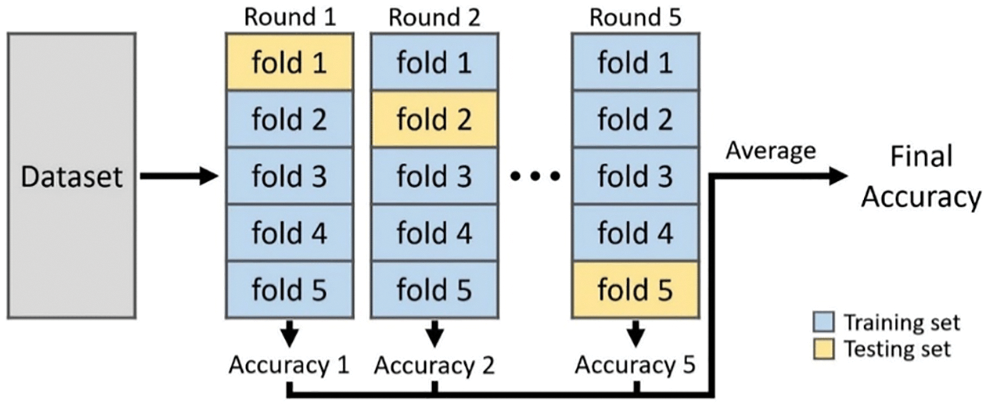
Figure 3: Cross-validation system
To make the cross-validation system, the whole dataset is divided into k-folds so that each fold has a predefined number of samples from each class. Then, the samples from one of the fold are tested in each round with the RF classifier, which is trained with the samples from the remaining folds. Hence, for k-fold cross-validation, the final accuracy is the average accuracy obtained from the accuracy of each round. Thus, the proposed PMCS system uses all samples for training the model and testing the model.
RF is a supervised learning algorithm, popularly meant for classification and regression. Fig. 4 depicts the pictorial representation of the structure of RF algorithm. The decision tree algorithm will originate with certain set of rules if the training dataset with targets and features is given.

Figure 4: Structure of the RF algorithm
If the data mining task is classification, then the classification trees are a good choice for making decision. The discriminatory rules that are generated by any single tree can be understood. These trees are generated using the binary recursive partitioning approach. It is an iterative process that splits the data into partitions and again the branches are partitioned further. Various classification or decision trees are employed in this study and are called RFs. On a particular object, many classification trees are built and each tree casting a “vote”. The testing object is classified based on the number of votes it received from each of the trees.
The main reasons why RF classifier is used in the proposed PMCS system are as follows:
• Easy to handle more number of attributes (thousands of inputs).
• Once the model is generated, it can be saved and used for future use.
• It can also be used for outlier detection and can handle unlabeled data.
• It can be extended for unsupervised clustering.
• The estimation about the variables which are more important for a particular classification can be possible.
Once the RF is built for a particular classification task, the testing sample can be classified using different number of trees that involves for the voting process. The voting process allows the learners to know the confident level of the RF for a particular attribute. A good attribute that is worth inspecting for a classification task is identified based on the number of votes obtained by that attribute.
2.5 Experimental Setup and Database Creation
The Moodle LMS is employed to generate the database for the proposed PMCS system. In the given data set, the percentage level of the courses selected by various students is taken as the initial performance measure which is shown in Fig. 5.

Figure 5: Distribution of courses
The course duration, date of joining, date of submission of assessment and the number of days viewed are considered as the important parameters for the courses to be chosen by the student in an efficient manner. If the learning material is well organized and in the understandable form then the particular course can be selected by more number of students irrespective of the complexity level.
Five different courses were chosen by the students. After the selection of course, students were asked to choose the assessment criteria, from which the performance of the students can be easily tracked and monitored. Two assessment criteria, namely Quiz and Assignment are taken into account and the student can choose one from the two. The date of submission of the assignment or quiz by the student reveals the involvement of the students attending the particular course. A warning message will be sent to the students those who are submitting the assignment or quiz beyond the deadline. It is found that, many students intend to take online quiz (66.4%) instead of writing assignments (33.6%).
During the course, the number of clicks made by a particular user for a given subject will be monitored in a regular manner, so that the involvement of the students can be easily analyzed. If a student does not view the course material on a particular day, he or she will be reminded on the next day about the progress of the course. Students will be repeatedly insisted to view the course on a daily basis. The probability of getting passed in each assessment purely depends on the clicks made by the user and the number of days viewed. If a person views the course daily, he manages to pass in the assessment. If a student is scoring very minimal marks, he will be motivated to view the course content frequently by increasing the number of clicks. The total number of clicks attempted by a student will be monitored continuously. If a student does not show interest in viewing the online materials, various steps have to be taken to keep them motivated and to make them interactive during the sessions. Fig. 6 shows the course wise distribution of clicks by the learners.

Figure 6: Course-wise distribution of clicks
One of the important parameters taken for the performance analysis is the date-wise progress of the students. In order to improve the performance levels of learner, they can recollect and check the solutions for the quiz or assignment already submitted. This shows their level of involvement. The total number of students attending either the quiz or the assignment on a particular day will be analyzed. Based on this factor, the academic progress of the students can be tracked easily. The student data model is given for both the odd and the even semester courses of a particular academic year. The sample dataset collected from the LMS is shown in Tab. 2.

This section discusses the performance of the proposed PMCS system using the RF classifier. The database comprises 75 male and 75 female learners per category (low, medium and high). Thus the system uses a total of 450 samples to evaluate the performance of the system. The performance of the system is evaluated using the following metrics;
• Precision: It is defined as the number of positive class predictions that actually belong to the positive class which is given in Eq. (2).
• Recall: It is defined as the number of positive class predictions made out of all positive class which is given in Eq. (3). The resulting value lies between 0% and 100%, where 0% denotes no recall and 100% denotes full or perfect recall.
• F-Measure: It is also termed as F1-score provides a way to combine both precision and recall into a single measure. It gives the average classification performance of the PMCS system. Also, it gives the harmonic mean of sensitivity and precision. It is defined in Eq. (4).
The performance of the system is evaluated in two ways; locally and globally. The former considers the gender of the learner and the later does not consider the gender of the learner. Thus, the proposed system is evaluated for male and female learners separately. The whole samples including male and female are given as inputs to the global system. Also, the performance of the system is analyzed by varying the number of trees in the RF classifier from 25 to 100 in multiples of 25. The confusion matrices obtained for male learners are shown in Fig. 7.

Figure 7: Confusion matrices-gender wise (male)
It can be seen from Fig. 7 that the performance of the PMCS system increases while increasing the number of decision trees in the RF classifier. It is noted that the maximum performance is obtained by the RF classifier with 75 trees. The precision for the three classes are 97.3% (low) and 98% (medium and high) and the obtained recall measures are 96% (low), 97.3% (medium) and 93.3% (high).
The same sets of experiments are repeated for the samples obtained from the female learners and the confusion matrices are shown in Fig. 8. It can be seen from Fig. 8 that a slight performance improvement is achieved when using the samples from the female learners than male learners. The precision for the three classes are 98% (low and medium) and 98.7% (high) and the obtained recall measures are 97.3% (low and medium) and 94.7% (high).

Figure 8: Confusion matrices-gender wise (female)
From the confusion matrix of the proposed PMCS system gender-wise in Figs. 7 and 8, the performance of the system is summarized in Tab. 3.

Fig. 9 shows the confusion matrices obtained for different number of trees by the global system where the samples from male and female learners are combined and given as inputs to the proposed PMCS system.

Figure 9: Confusion matrices-Global system
It can be seen from Fig. 9 that the RF classifier with 75 decision trees provides more promising results than others. The average accuracy of the system with 75 trees is 97.6% whereas it is 87.6% (25 trees), 96.1% (50 trees) and 94.5% (100 trees). The precision of the global system resembles the performance of the local system using samples from female learners and slight changes in recall rate for low and high classes are noticed. The performance of the system which does not consider the gender is summarized in Tab. 4 and Fig. 10 shows the performances of the proposed PMCS system using different decision trees in the RF.


Figure 10: Performances of the proposed PMCS system for different decision trees in the RF
In this study, an efficient PMCS system using the RF classifier is presented. It is designed with four important modules; data preprocessing (data type conversion), data normalization (min-max technique), data split (k-fold cross validation) and classification (RF module). Then, the system is operated under two modes based on the input samples. At first, the system performance is evaluated using gender-wise samples independently as a local process and then all samples from males and females are combined and tested as a global process. The system is also tested by changing the number of decision trees in the RF classifier from 25 to 100 in multiples of 25. Results show that the RF classifier with 75 decision trees provides promising results than others in both local and global systems. The average accuracy of the global system with 75 trees is 97.6%, whereas it is 87.6% (25 trees), 96.1% (50 trees), and 94.5% (100 trees). Also, it is noted that the performance of local system using the samples from female learners resembles the global system and is higher than the performance of the local system using male samples. The main limitation of the PMCS system is the use of a small population size. In future, the performance of the PMCS system will be analyzed using large population size. A well-defined recommendation system for the selection of courses by the different levels of students will be modeled in the upcoming work.
Funding Statement: The authors received no specific funding for this study.
Conflicts of Interest: The authors declare that they have no conflicts of interest to report regarding the present study.
1. M. S. Abou El-Seoud, I. A. Taj-Eddin, N. Seddiek, M. M. El-Khouly and A. Nosseir, “E-Learning and students motivation: A research study on the effect of e-learning on higher education,” International Journal of Emerging Technologies in Learning, vol. 9, no. 4, pp. 20–26, 2014. [Google Scholar]
2. B. D. Uhler and J. E. Hurn, “Using learning analytics to predict (and improve) student success: A faculty perspective,” Journal of Interactive Online Learning, vol. 12, no. 1, pp. 17–26, 2013. [Google Scholar]
3. Y. Abubakar and N. B. H. Ahmad, “Prediction of students’ performance in e-learning environment using random forest,” International Journal of Innovative Computing, vol. 7, no. 2, pp. 1–5, 2017. [Google Scholar]
4. M. Hussain, W. Zhu, W. Zhang and S. M. R. Abidi, “Student engagement predictions in an e-learning system and their impact on student course assessment scores,” Computational Intelligence and Neuroscience, vol. 2018, pp. 1–21, 2018. [Google Scholar]
5. F. Yang and F. W. B. Li, “Study on student performance estimation, student progress analysis, and student potential prediction based on data mining,” Computers & Education, vol. 123, pp. 97–108, 2018. [Google Scholar]
6. A. Harish, M. Abdullah and B. T. Shobana, “Modelling an adaptive e-learning system using LSTM and random forest classification,” in IEEE Conf. on e-Learning, e-Management and e-Services, Langkawi, Malaysia, pp. 29–34, 2018. [Google Scholar]
7. R. W. Preszler, A. Dawe, C. B. Shuster and M. Shuster, “Assessment of the effects of student response systems on student learning and attitudes over a broad range of biology courses,” CBE—Life Sciences Education, vol. 6, no. 1, pp. 29–41, 2007. [Google Scholar]
8. T. Mahboob, S. Irfan and A. Karamat, “A machine learning approach for student assessment in E-learning using quinlan’s C4.5, naive Bayes and random forest algorithms,” in 19th Int. Multi-Topic Conf., Islamabad, Pakistan, pp. 1–8, 2016. [Google Scholar]
9. R. Guns and R. Rousseau, “Recommending research collaborations using link prediction and random forest classifiers,” Scientometrics, vol. 101, no. 2, pp. 1461–1473, 2014. [Google Scholar]
10. S. Kumar, A. K. Gankotiya and K. Dutta, “A comparative study of MOODLE with other e-learning systems,” in 3rd Int. Conf. on Electronics Computer Technology, Kanyakumari, India, pp. 414–418, 2011. [Google Scholar]
11. K. Chaudhary and N. Gupta, “Recommendation for learners in e-learning system,” in Int. Conf. on Next Generation Computing and Information Systems, Jammu, India, pp. 58–63, 2017. [Google Scholar]
12. W. Zhang and S. Qin, “A brief analysis of the key technologies and applications of educational data mining on online learning platform,” in IEEE 3rd Int. Conf. on Big Data Analysis, pp. 83–86, 2018. [Google Scholar]
13. V. Carchiolo, A. Longheu, M. Previti and G. Fichera, “Monitoring student’s activities in CS courses,” in 15th RoEduNet Conf.: Networking in Education and Research, Bucharest, Romania, pp. 1–6, 2016. [Google Scholar]
14. D. Ülker and Y. Yılmaz, “Learning management systems and comparison of open source learning management systems and proprietary learning management systems,” Journal of Systems Integration, vol. 7, no. 2, pp. 18–24, 2016. [Google Scholar]
15. Z. Kechaou, M. B. Ammar and A. Alimi, “Improving e-learning with sentiment analysis of users opinions,” in IEEE Global Engineering Education Conf., Amman, Jordan, pp. 1032–1038, 2011. [Google Scholar]
16. N. Tomaževič, L. Umek, D. Keržič and A. Aristovnik, “Analysis of selected aspects of students’ performance and satisfaction in a moodle-based e-learning system environment,” Eurasia Journal of Mathematics, Science and Technology Education, vol. 11, no. 6, pp. 1495–1505, 2015. [Google Scholar]
17. K. K. Singh, U. Kumar and K. Anurupam, “Activity based students’ performance measure using moodle log files,” International Journal of Research in Advent Technology, vol. 7, no. 7, pp. 1–3, 2019. [Google Scholar]
 | This work is licensed under a Creative Commons Attribution 4.0 International License, which permits unrestricted use, distribution, and reproduction in any medium, provided the original work is properly cited. |