DOI:10.32604/csse.2023.028898
| Computer Systems Science & Engineering DOI:10.32604/csse.2023.028898 | |
| Article |
Deep Learning-Based Model for Defect Detection and Localization on Photovoltaic Panels
1Department of Computational Intelligence, SRM Institute of Science and Technology, Chengalpattu, 603203, India
2Department of Electrical Engineering, SRM Institute of Science and Technology, Chengalpattu, 603203, India
*Corresponding Author: S. Prabhakaran. Email: sbaprabhu@gmail.com
Received: 21 February 2022; Accepted: 12 April 2022
Abstract: The Problem of Photovoltaic (PV) defects detection and classification has been well studied. Several techniques exist in identifying the defects and localizing them in PV panels that use various features, but suffer to achieve higher performance. An efficient Real-Time Multi Variant Deep learning Model (RMVDM) is presented in this article to handle this issue. The method considers different defects like a spotlight, crack, dust, and micro-cracks to detect the defects as well as localizes the defects. The image data set given has been preprocessed by applying the Region-Based Histogram Approximation (RHA) algorithm. The preprocessed images are applied with Gray Scale Quantization Algorithm (GSQA) to extract the features. Extracted features are trained with a Multi Variant Deep learning model where the model trained with a number of layers belongs to different classes of neurons. Each class neuron has been designed to measure Defect Class Support (DCS). At the test phase, the input image has been applied with different operations, and the features extracted passed through the model trained. The output layer returns a number of DCS values using which the method identifies the class of defect and localizes the defect in the image. Further, the method uses the Higher-Order Texture Localization (HOTL) technique in localizing the defect. The proposed model produces efficient results with around 97% in defect detection and localization with higher accuracy and less time complexity.
Keywords: Photovoltaic systems; deep learning; defect detection; classification; localization
The use of electrical and electronic devices is increased to a higher extent in the last decade itself. Such growth in electronic devices directly impacts the usage and requirement of electric power. However, the source of electric power like coal, water, and thermal are becoming scarce and human society cannot depend on them for a long time. Because, the popular countries like china is already facing power scarcity and looks for the alternate power from wind, atomic and other sources. In this line, solar energy is the alternate source that has no scarcity and would be available throughout the year for the long term. The PV systems are one which is designed to generate power supply from solar energy.
The PV systems are designed with a number of solar panels assigned in a grid manner which contains a panel at the top to absorb the sunlight which has been connected with different devices and components like solar cells, diodes, and so on which has been converted into direct current. The direct current generated has been passed through the silicon diode and stored in the battery storage like an inverter. The inverter converts the direct current and returns an alternate current to the other devices. The performance of such a PV system is depending on the functioning of different components of the PV system. In order to achieve higher power regulation, the functioning of each component of the PV system must be monitored and maintained.
The output power from the PV system gets reduced because of several reasons like hotspots due to sunlight, dust deposit in the panel, failure of the battery, damage of panel, and so on. It is necessary to identify the conditions of the panel to maintain the power regulation from the system. Monitoring the conditions of the panel physically is not possible because the PV systems are deployed in acres where the human cannot visit each panel. As the panel comes with a thin size, it is not possible to move or walk over the panel and look for the defects. To perform this, image processing and deep learning techniques can be used in identifying the defects in the solar panel.
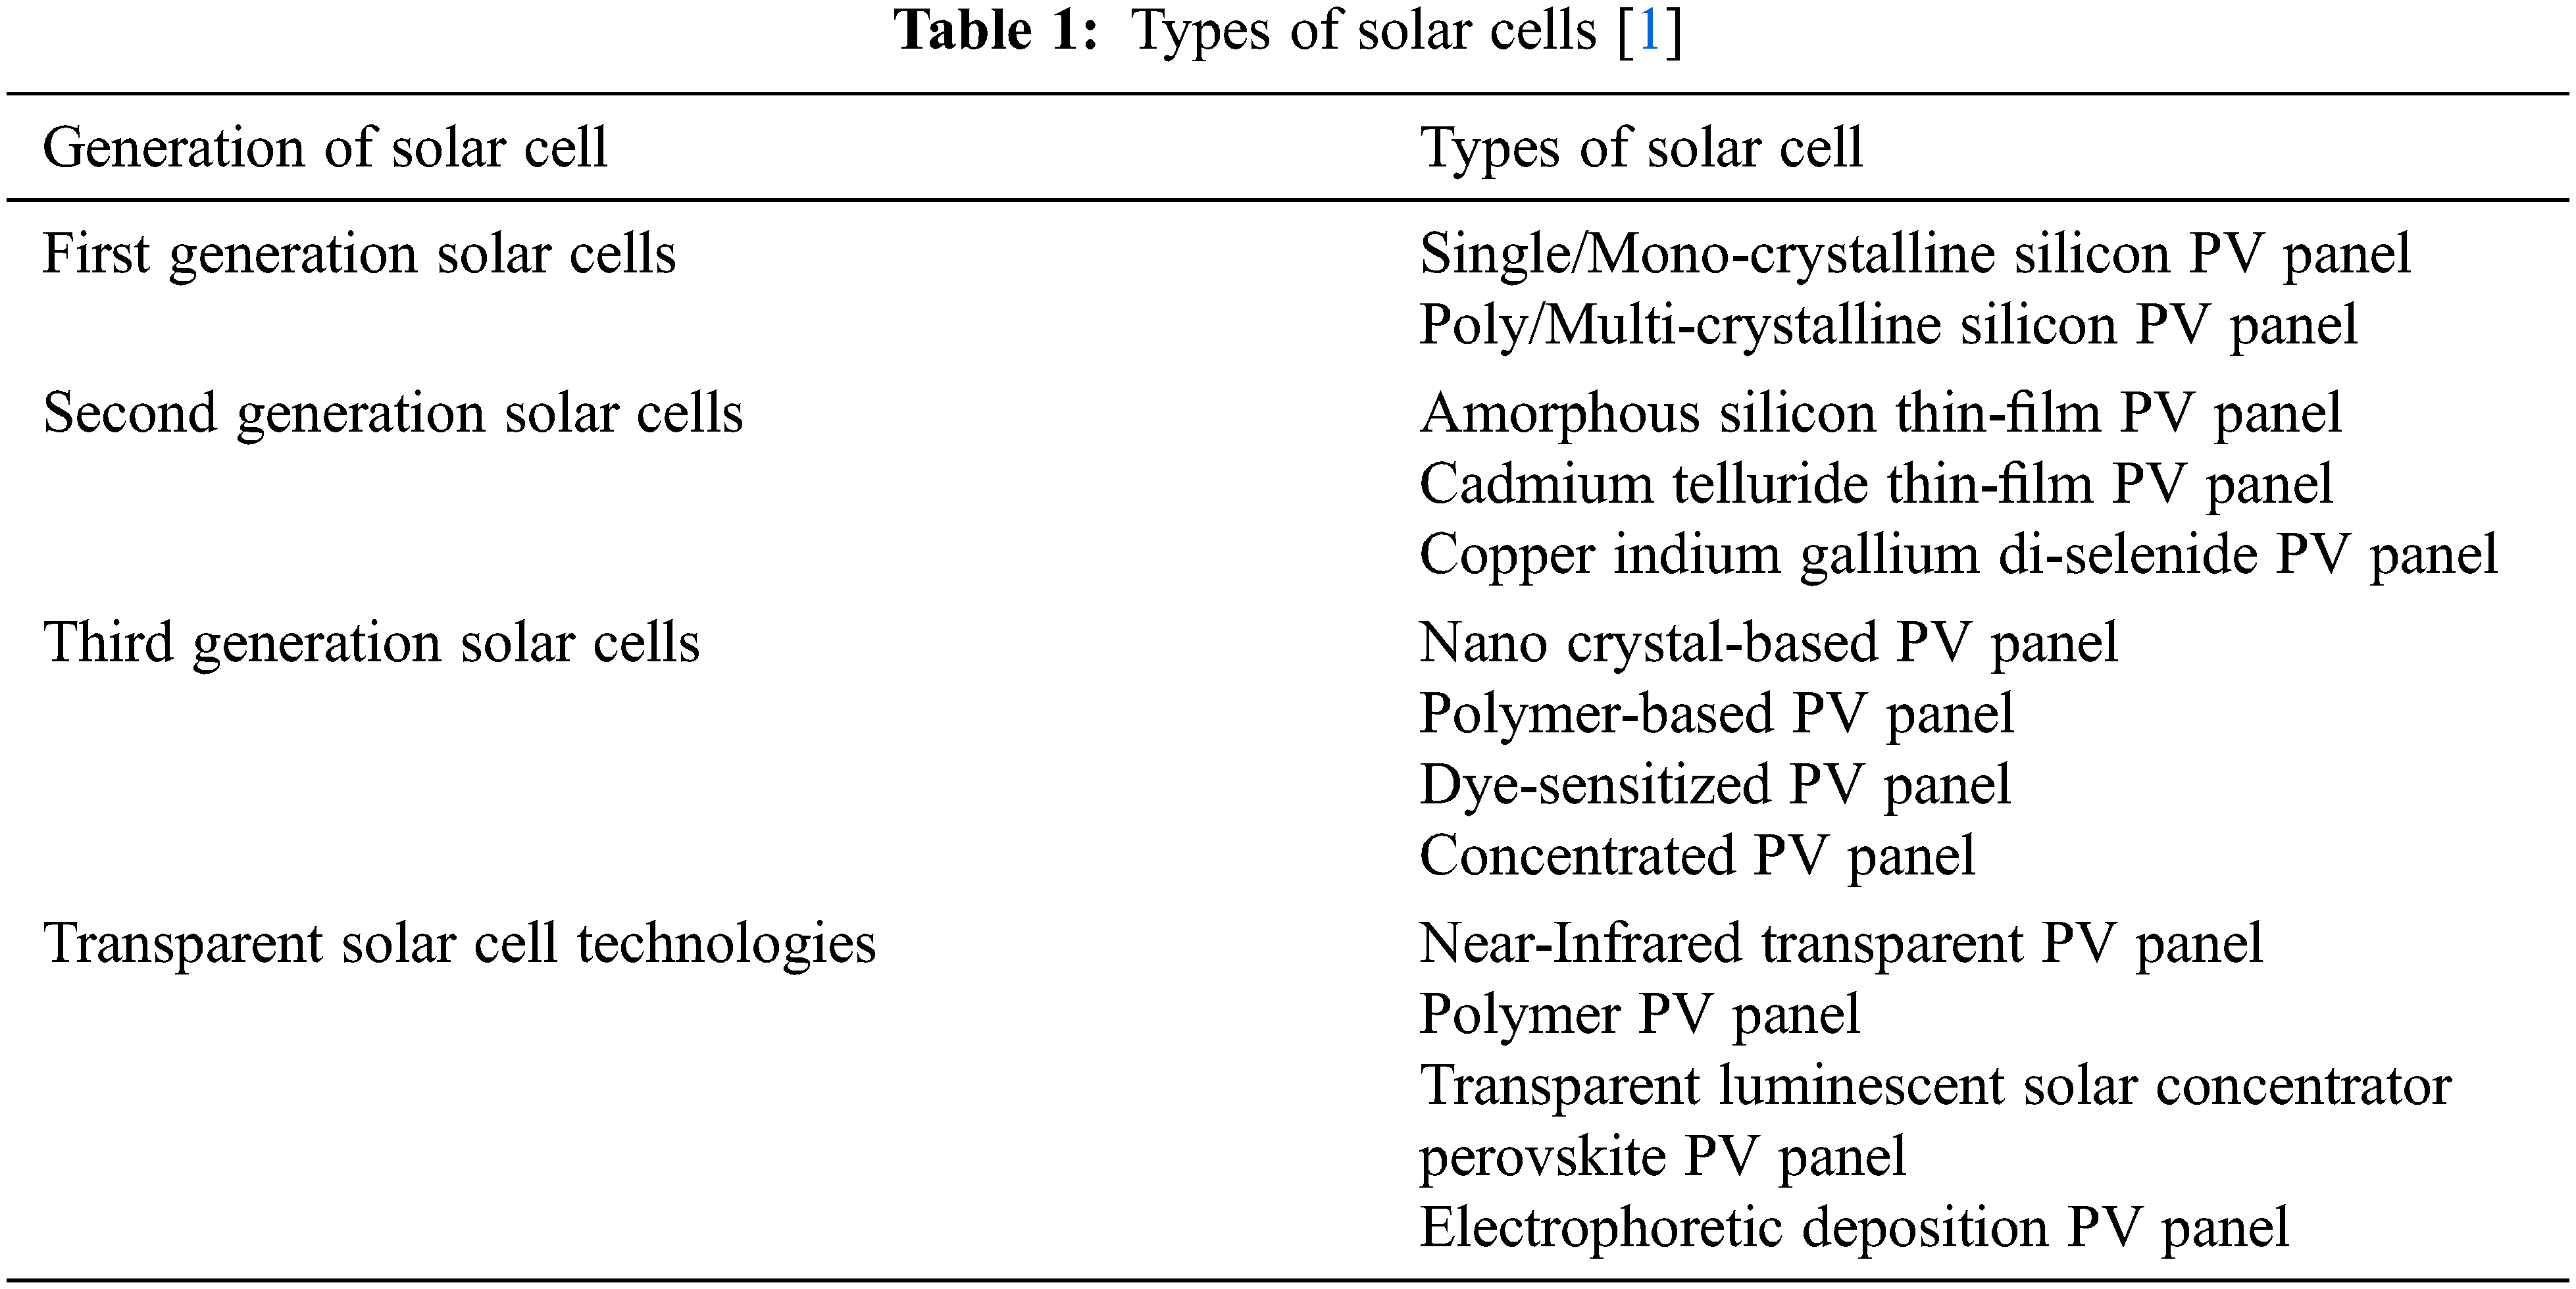
By applying image processing techniques over the luminescent ariel images, the presence of dust, erosion, crack, sunlight effect, and other damages can be identified. There exist different image processing techniques available to identify the defects by classifying the images using K-Means, Support Vector Machine, Neural Networks, and so on. However, each of them has its benefits and demerits. But, the deep learning models can be used in this problem because of the support of identifying micro-crack and works by training huge samples of data and supports a variety of problems. Also, localization is very much needed in this problem because when the solar system has been deployed in huge acres, then identifying the defect itself is not enough, and need to localize which panel gets defected to replace them. The problem of defect detection and localization can be handled with the support of deep learning approaches. The deep learning models are capable of learning all the features with higher dimension and takes only limited time in training as well as testing. By considering all these, in this article, an efficient RMVDM is presented. The model applies the RHA algorithm in preprocessing the images and the features of the images are extracted using GSQA. Further, the method trains the model with a deep neural network to perform defect detection and localize the defect in the given image. The method applies HOTL towards localizing the defect. The detailed approach is presented in the next section. The different types of solar panels are discussed in Tab. 1 below.
A convolutional neural network (CNN) presented in [2], is used for our deep learning network. To perform the input and output operation the CNN consists of three important layers: (1) convolution layer, (2) activation layer, and (3) pooling layer. The neurons of a deep neural network can connect to other neurons, achieving image processing, object detection, classification, and segmentation. In CNN, the raw images are preprocessed with image processing techniques and then the classifier is trained by transfer learning.
A number of approaches of defect detection and classification are discussed in the literature and this section details different approaches related to the problem. An automatic defect detection system is prescribed in [3], applying a Simple Linear Iterative Clustering scheme in thermal images of solar systems to detect hotspots and generate real-time alerts. Towards detecting the cracks and micro-cracks in solar panels the Halcon-based approach deep learning approach [4] and Bluetooth-based inspection system [5] are presented. The system gets updated with the dynamic images with the support of Bluetooth of android devices. The sensors are attached to the panel and update the defects to the system with the use of Bluetooth.
To detect defects on residential solar panels the UV Fluorescence image-based approach is presented in [6], which detects hotspots, cracked cells, junction box defects, and erosion defects. To support the detection in outdoor environments conditions, a novel approach is presented in [7], which uses thermal images captured that find the region of interest from the images to produce effective results.
An infrared image has been used in the detection of defects in PV cells and panels in [8,9], which use Time-Resolved Thermography and Synchronized Thermography (ST) schemes in identifying the Region of Interest in outdoor environments. In [10], the image processing techniques were used to detect the damages in the panel and count them accordingly. These defects are caused by various weather conditions like cold, heat, hail, and rain. A transfer learning approach is presented in [11,12] towards the detection of a defect in the solar surface panel, which combines the result of transfer learning with AlexNet CNN. Applying a data processing scheme to thermal images [13,14] for background subtraction, and applying discrete Fourier transform and histogram equalization scheme to enhance the quality of the image. Towards localizing the defect in PV panels and cells, ST has been used in [15]. The method computes the geometric areas of PV cells and energy production in the detection of defects.
A support vector machine (SVM) based defect detection scheme is presented in [16], which uses Electroluminescence (EL) images that classifies the images by extracting features from the image. An adaptive neuro-fuzzy system is presented in [17–19], towards the detection of defects and elimination of defects in PV systems, which performs aging analysis on different panels and collects different behaviors in identifying the defects. A Particle Swarm Optimization (PSO) based crack detection scheme is presented in [20], which uses image processing schemes to detect the cracks in the panel. The PSO scheme is used in detecting the edges of cells extracts cracks, bus bars in classifying the defect with fuzzy logic. A machine vision-based approach is presented in [21], towards the detection of micro-cracks. The method uses EL images and applies bias voltage in capturing the photons which have been increased for the brightness to support the detection of defects. A UAV infrared measurement scheme is presented for the detection of thermal anomalies in [22], which applies the visual field to the PV plant.
A behavior-based approach is presented in [23] to detect the defects in panels that monitor and measure the current at different voltage levels. Using the voltage obtained forward-biased non-illuminated PV cells are measured using thermography. According to the maps generated on temperature, the presence of defects has been detected. A CNN-based deep learning method YOLO [24,25] uses drones to detect the snowy layers in solar panels. This method segments the panel images and evaluates the PV images with the use of the existing network to detect the defects.
An efficient transfer deep learning model is presented in [26], which uses infrared images to train the network and to detect the normal and defective panels. A CNN-based automatic cell segmentation algorithm is presented in [27], which uses high-resolution EL images. The method uses an automatic segmentation scheme to extract cells from the image and classify them using the CNN network. The method uses probabilistic Hough transform to identify the gridlines of panel and bus bars. Also, the method uses a cell-based defect identification scheme using deep learning. The method uses K-means clustering in grouping the images. A PV hotspot detection model is presented in [28], which uses a machine-learning algorithm. The method generates color image descriptors from the thermography images by dividing non-overlapping regions. Further, color descriptors are used in generating the features in training the machine learning network towards classification.
A deep learning-based supervision scheme is presented in [29], which adapts CNN to find the defects. The method extracts the features with pre-trained architecture Vgg16; the suggested solution added a full-connected layer and an SVM decision layer to classify the defects. An image processing approach is presented in [30], which finds the defects in surface control and defects in the panel. A light CNN-based approach is presented in [31], to detect the defect in EL images. Similarly, a CNN model is presented in [32], towards detecting the defects in PV panels. The method combines various machine learning algorithms in detecting the defects. CNN-based architectures such as ResNet50 and ImageNet are used for feature extraction by applying feature maps to global branches, local branches, and complementary branches. The feature learning is done by a feature map. To learn the local region features, the L-ATT module is used [33]. After the feature extraction, the object detection is done by YOLOv3 architecture with the help of an Unmanned Aerial Vehicle (UAV) [34].
The proposed model fetches the PV images obtained from the data set. Such images are preprocessed by applying the RHA algorithm which finds the noisy pixels and approximates them to perform noise removal. Further, the preprocessed images are used in extracting the features with GSQA. The GSQA algorithm extracts not just gray features but also extracts different features like distribution, texture, contrast features. Such features extracted are used in training the deep learning network where the network is constructed with K number of layers and each intermediate layer denotes the process of detecting defects towards a specific class. The neurons are designed to estimates the value of DCS towards various classes of defects. Finally, a single class has been selected to perform classification and localize the defect accordingly. Towards localization, the method uses the HOTL technique in localizing the defect. The architecture of the proposed RMVDM has been presented in Fig. 1 where the functional components of the model are detailed in this section.
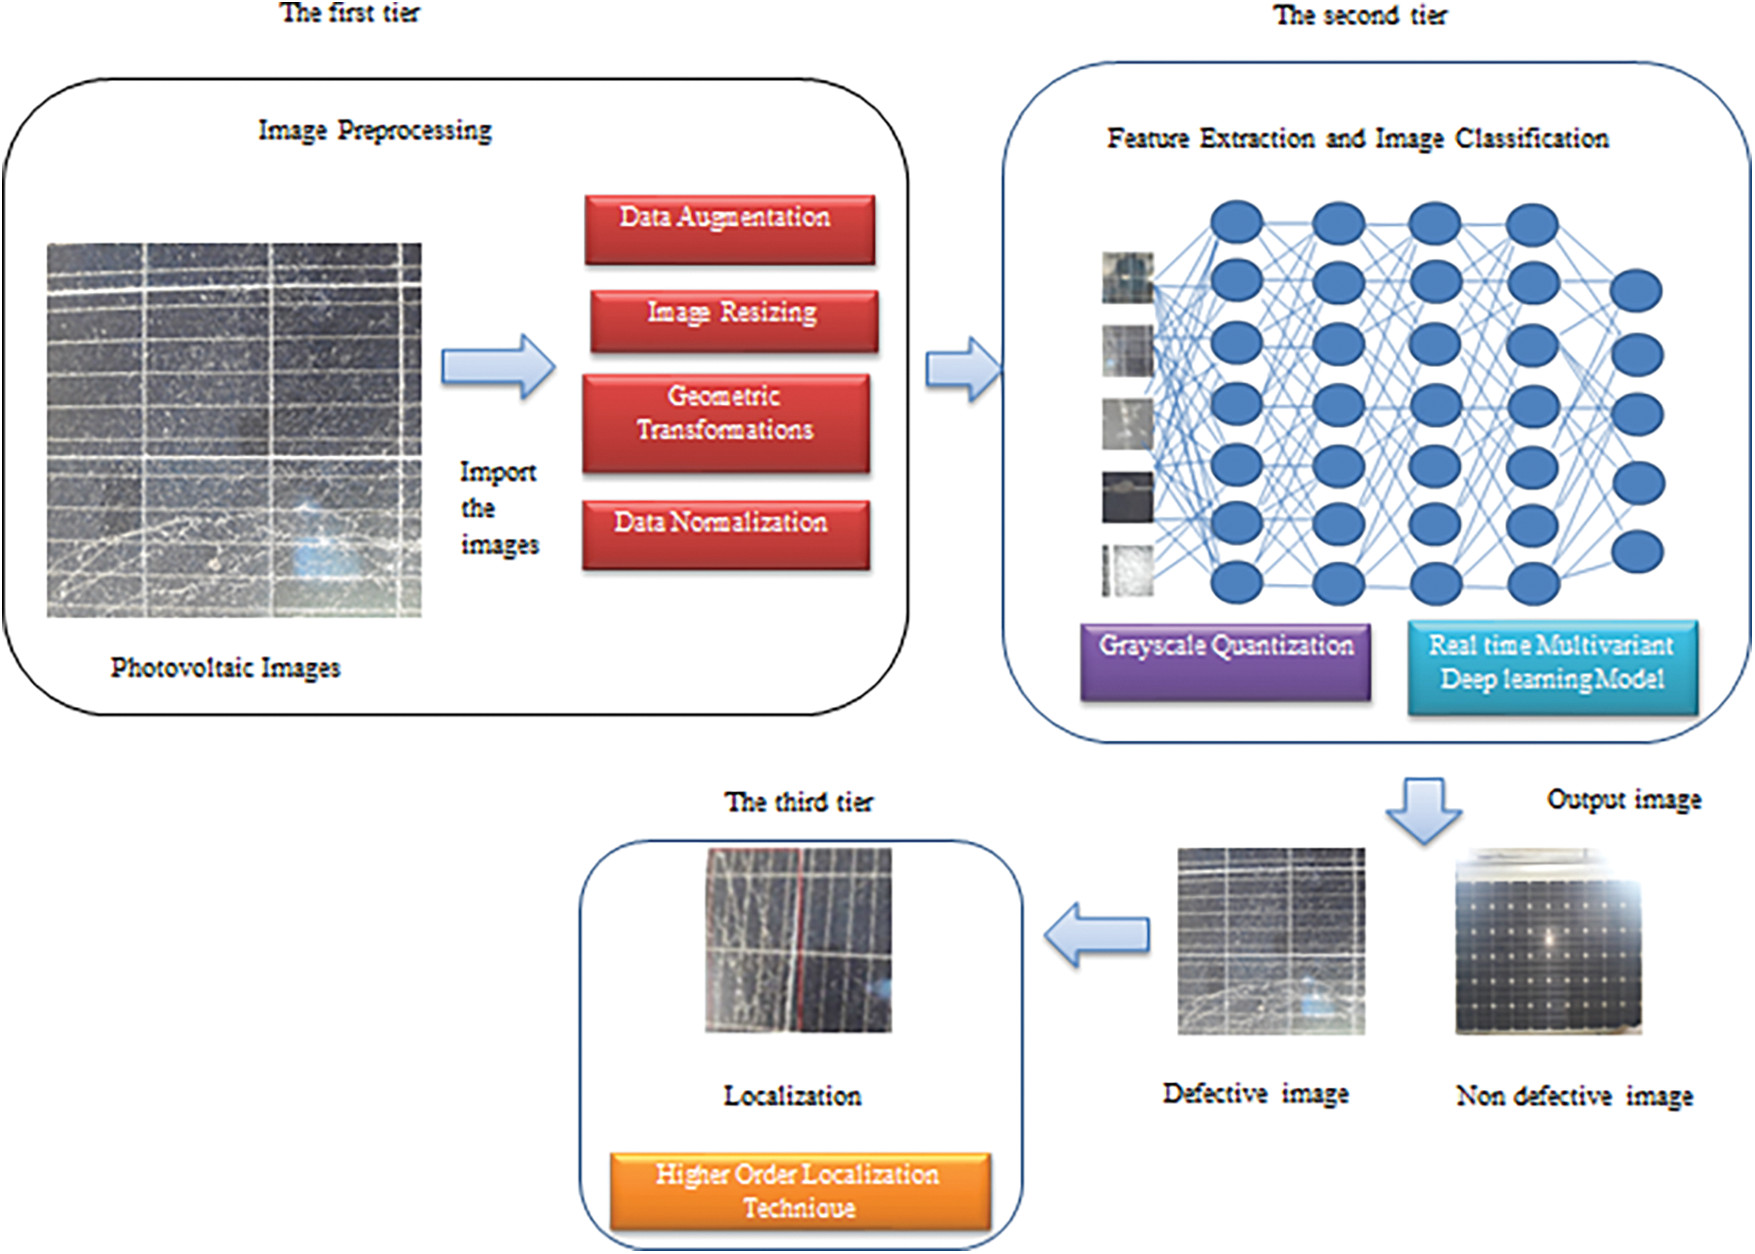
Figure 1: Architecture of proposed RMVDM model
3.1 Regional Histogram Approximation
The data set given for preprocessing contains a number of PV images. The images would have been captured through different devices and contain noise features. The noise features in the image need to be normalized to improve the quality of the images. To perform this, the model uses the RHA algorithm. The method generates a number of regions of interest with the size of 3 and 5. To do this, the method generates a sub-window according to the size of 3 and 5 for each of the pixels. For the window is generated, the method generates a histogram of pixel values on grayscale. Further, the least gray value has been identified and the pixel value of the current pixel is identified. If the number of histogram values is close to the current pixel value then the method computes the mean value of the selected histogram subset and adjusts the current pixel value with the mean measured. Otherwise, it has been left to identify the texture values of different defects that appear in the image given. The preprocessing algorithm eliminates the noise from the PV image according to the approximated values of histograms generated at different regional images. The preprocessed image has been used to extract the features for defect detection.
3.2 Gray Scale Quantization Algorithm
The GSQA has been designed to extract the required features from the PV image. To handle this, the preprocessed image has been applied with the sobel edge detection algorithm. According to the detected edges, the panel texture features are extracted. To perform this, the edge detected image has been converted into a binary image and applies morphological operation. According to the morphological result, the panel texture has been removed from the input grayscale image. With the subtracted image, the method applies grayscale quantization which segments the rest of the features according to grayscale values. With the segmented image, the method extract different features like texture, mean gray variance, and contrast values. The texture is extracted from the binary image generated and to extract the gray variance, it measures the mean gray value of panel feature segment and means a gray value of defect segment generated. By computing the variance between the two values, the mean gray variance has been computed. Similarly, the contrast value of the texture is measured by computing the mean value of the histogram of texture generated. The feature from the PV image has been extracted by computing different measures and the method extracts the texture of the defect, extracts the mean gray variance, and means contrast variance to support classification.
3.3 Real-time Multi Variant Deep learning Model
The proposed RMVDM reads the test image and applies it to preprocess with the RHA algorithm. Further, the extracted features are tested with the network trained where each layer neuron estimates different defect class support values. The neuron computes Sunlight Defect Class Support (SDCS), Crack Defect Class Support (CDCS), Erosion Defect Class Support (EDCS), and Deposit Defect Class Support (DDCS). The neurons at the output layer return different support measures. The support measures generated have been used to measure the Defect Class Weight (DCW) and based on that the defect class has been identified. The algorithm for the RMVDM is given in Algorithm 3.
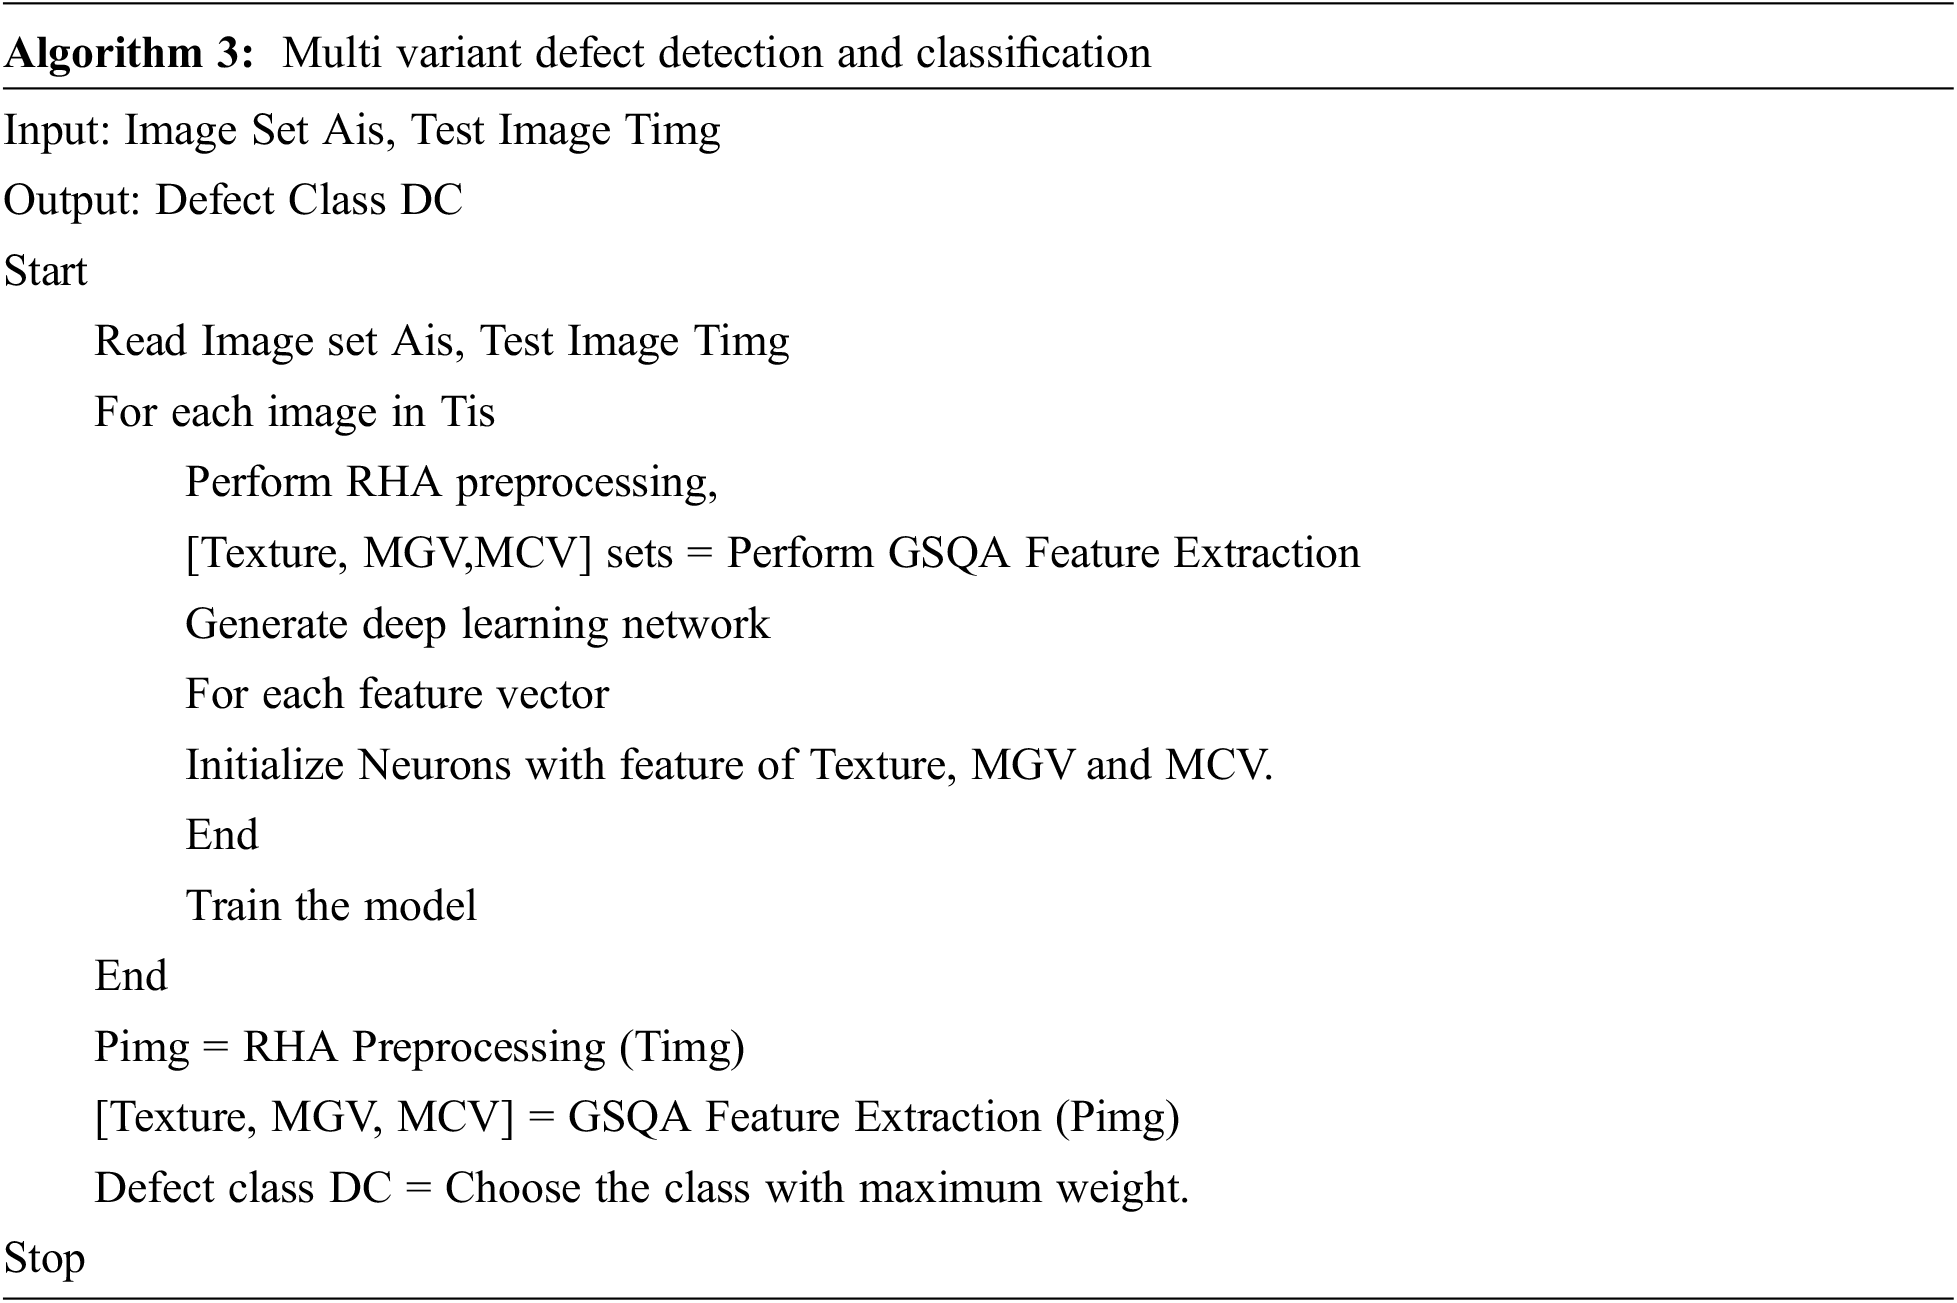
The above algorithm computes different defect class weights and finally, a single class with a higher defect class weight is selected as result.
3.4 Higher-Order Location Technique
The proposed HOLT approach identifies a set of textures and measures the different defect support measures for various classes. For each texture, the method collects a set of support measures. According to the factor measured, the method selects the texture which has a higher weight measure. Such selected texture has been marked and localized to produce the result. The HOLT algorithm is given in Algorithm 4.
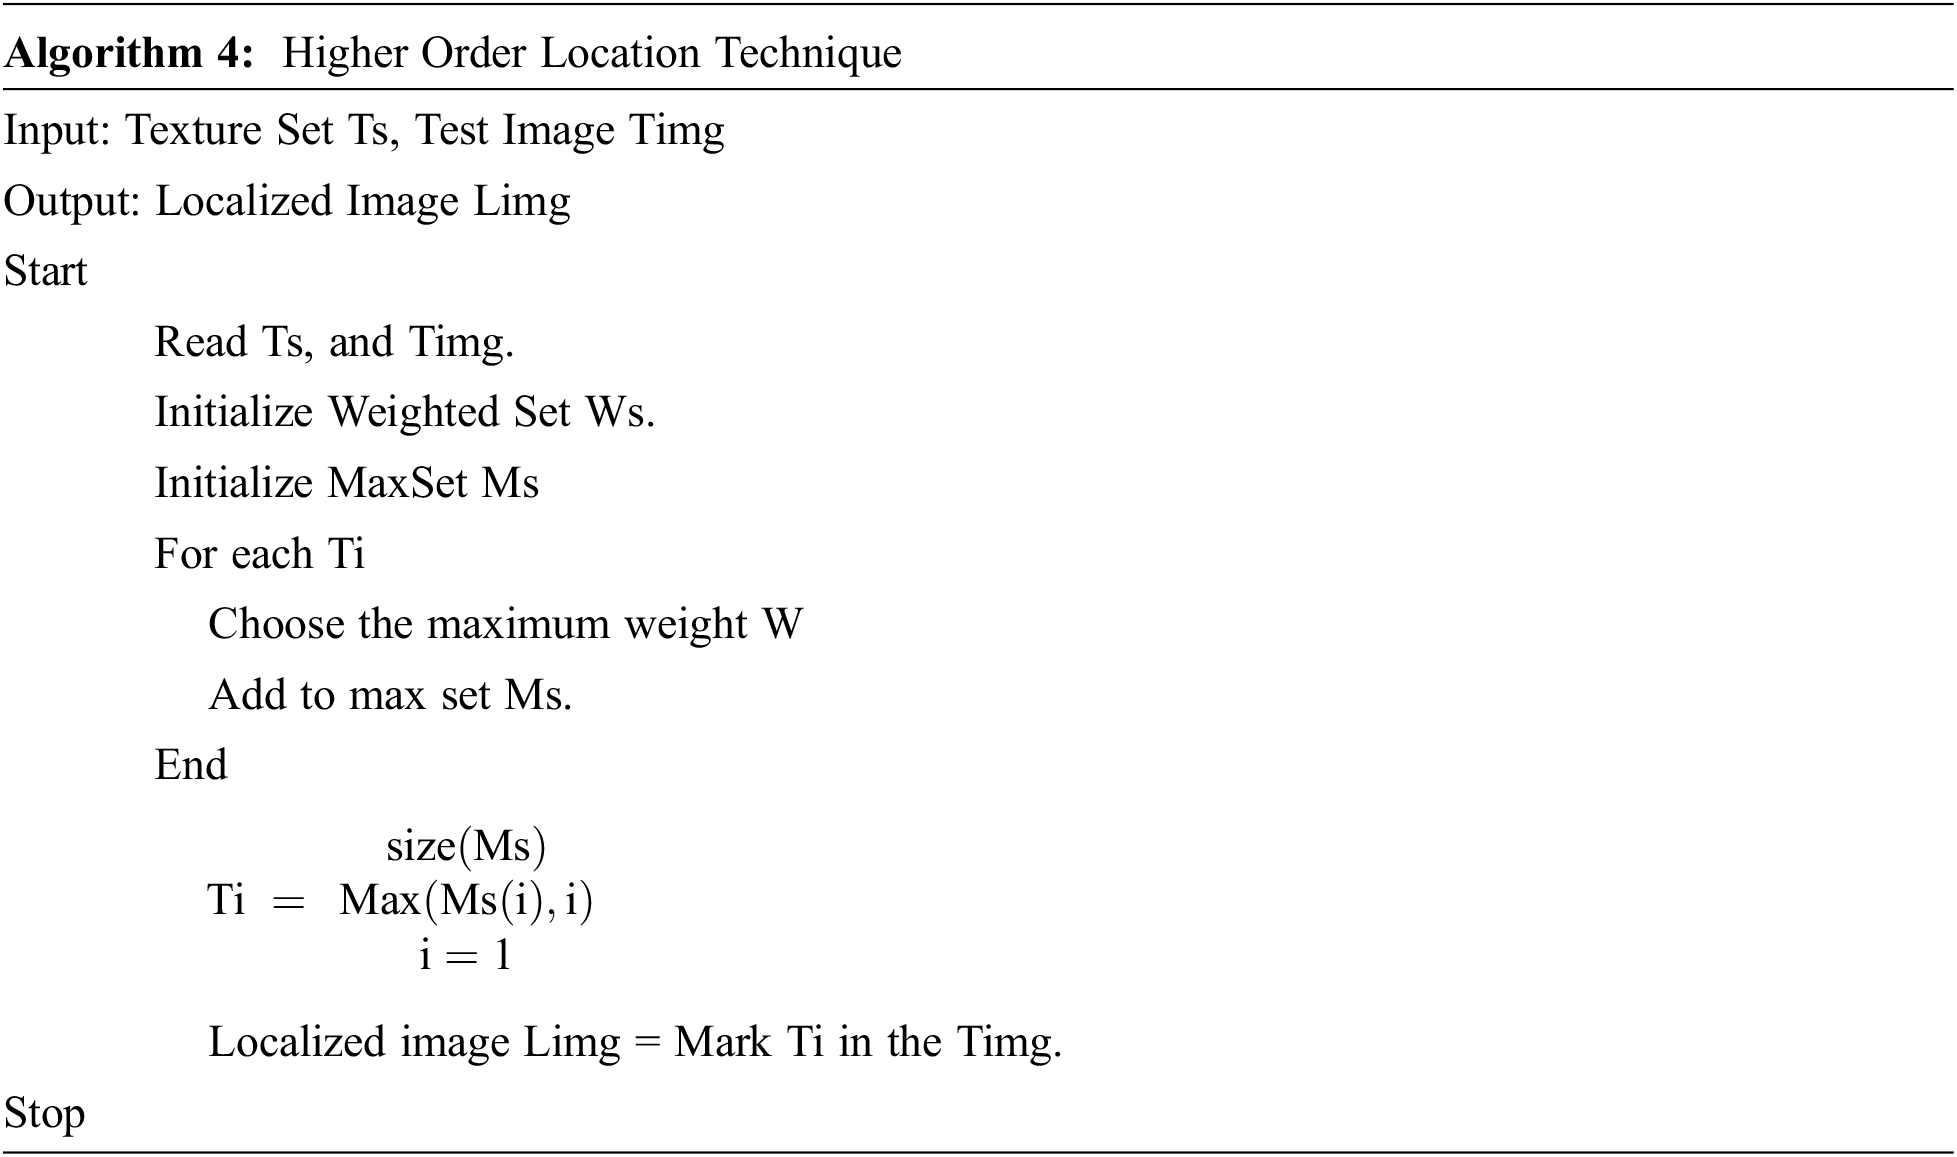
The above-discussed algorithm represents how the localization is performed to represent the location of the texture in the image given.
The training process involves several operations of the model. The proposed deep learning model has been trained by extracting different features from the PV image data set given. To perform this method preprocess each of the PV images from the data set and enhance the quality of the image by applying the RHA algorithm. Further, the image has been applied with a gray quantization algorithm which extracts different features like texture, gray variance, and contrast variance. Once the features of each image have been extracted, then the method generates the deep learning network by constructing a number of layers with many neurons. The method initializes the input layer neurons with the feature extracted and constructs the ‘I’ number of the intermediate layer where the neurons of the layer are designed to measure different DCS values towards a specific defect class. At the training phase, the features extracted from the images have been given to the model and trained. At last, the output layer is designed to return the ‘I’ number of output as DCS.
The hotspot defect located in the solar panel has been pictured in Fig. 2. The presence of micro-crack in PV panels has been noticed in Fig. 3. The effect of erosion effect is presented in Fig. 4. The sample dust defect present in the solar panel has been displayed in Fig. 5. These images have been localized by computing the values of SDCS, CDCS, EDCS, and DDCS.
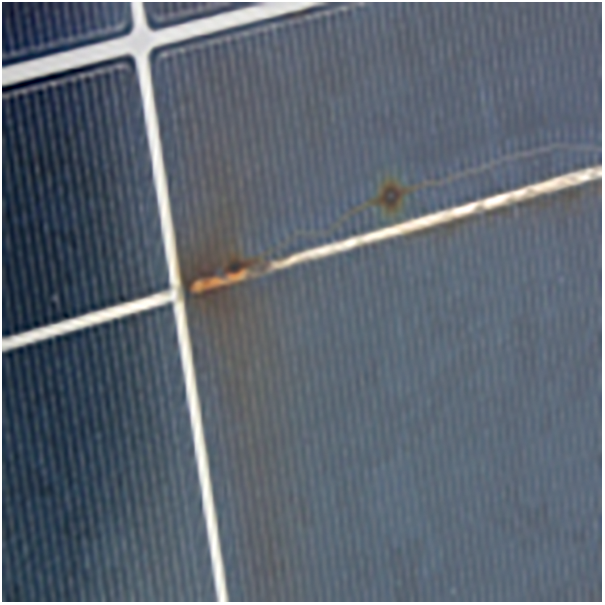
Figure 2: Hotspots
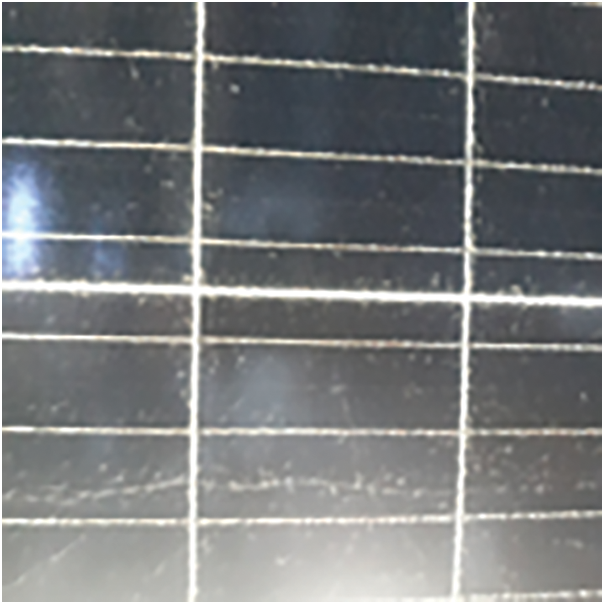
Figure 3: Micro cracks
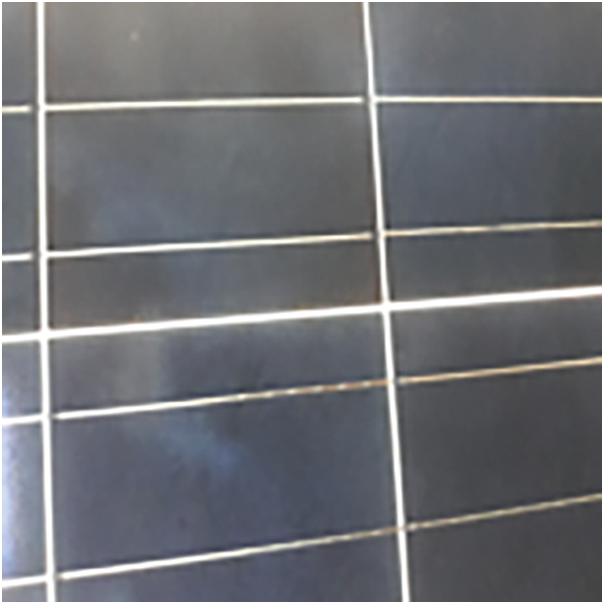
Figure 4: Erosion
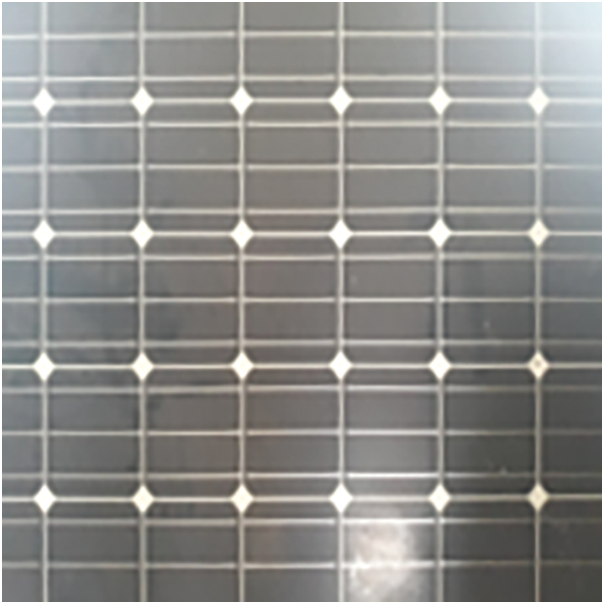
Figure 5: Dust deposition
4.1 Sunlight Defect Class Support (SDCS)
The sunlight defect class support is the measure that represents the possession of texture to be classified towards the sunlight defect. It has been measured based on the gray mean-variance Gmv(T) value measured for the given input image and the set of gray mean-variance (Gmvs) values of trained images. Then the value of SDCS is measured in (1) as follows:
4.2 Crack Defect Class Support (CDCS)
The crack defect class support is the measure representing the image’s support towards the crack class. It has been measured based on the location parameters. To perform this, the method initially maps the texture on the location map. According to the pixel locations, the method computes the average max distance for different pixels of the texture. According to that, the method computes the value of CDCS.
First, the texture T given has been mapped to the location map (Lmap). According to the location map, for each pixel of T, the method computes the distance to identify the max distance. Finally, the max distance is selected for each pixel to compute the average max distance. Finally, using the average max distance the method computes the value of CDCS is mentioned in (2) as follows.
Compute max distance of Ti is measured as MaxDist (T(i)) = Max(LmapDist)
Similarly, for each pixel T(k) from the texture T, the method computes the LmapDist and computes MaxDist values. Now according to the values MaxDist values of all the pixels, the method chooses the most maximum distance value to compute the value of CDCS.
To perform this, the most maximum values are measured in (3) and (4) as follows.
Computed value of CDCS has been used to perform defect detection and classification.
4.3 Erosion Defect Class Support (EDCS)
The erosion defect class support is the measure that represents the image fitness to be classified towards erosion defect. It has been measured based on the variation of gray pixels with less intensity. The value of EDCS is measured according to the variance in less intensity gray pixels. The pixels with less intensity are selected and variation is measured between them. To perform this, first, the pixels sets with less intensity are identified in (5)–(7) as follows:
4.4 Deposit Defect Class Support (DDCS)
The deposit defect class support is the measure that represents the fitness of the PV image to be classified towards the deposit of dust particles. It has been measured according to the contrast features of the texture region extracted. The value of DDCS is measured by computing the mean contrast variance in the panel and the texture considered. To perform this, the method first measures the mean contrast of the panel and mean contrast of the texture considered. Using these values, the method computes the DDCS value as follows in (8): The estimated value of DDCS has been used to perform defect detection and classification.
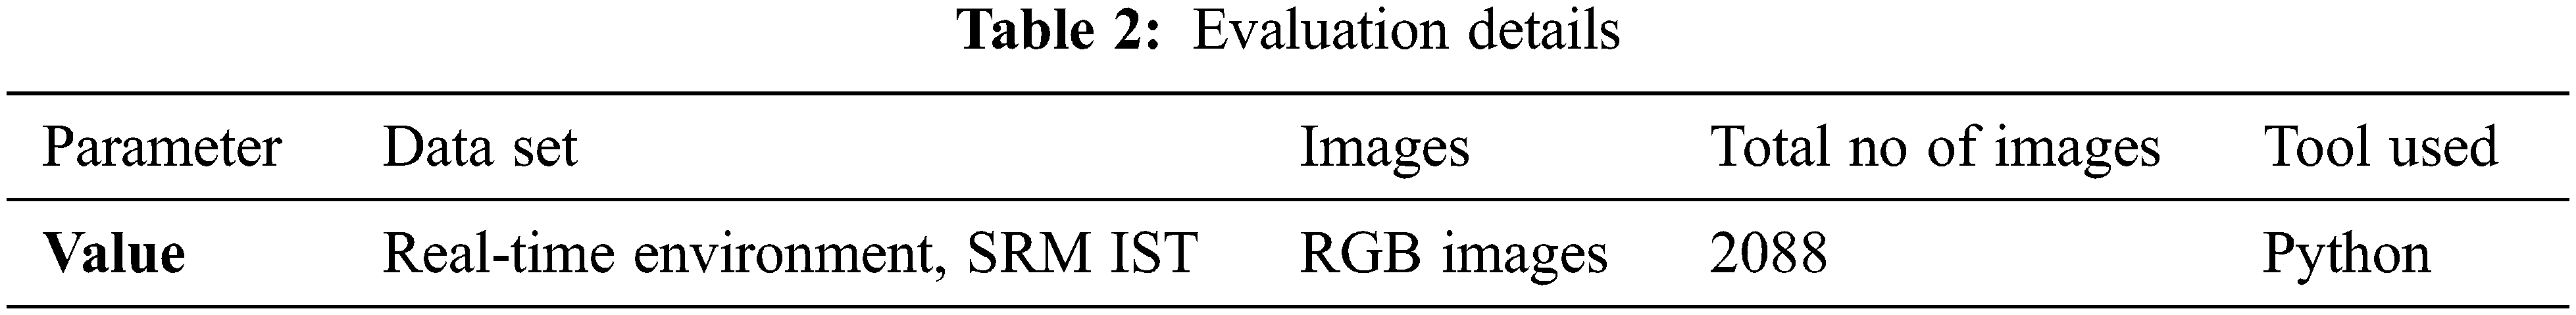
The proposed RMVDM based PV defect detection and classification system has been implemented using Python and evaluated with different data set. The method has been evaluated for its performance using real-time PV images installed in SRM Institute of Science and Technology. The results obtained have been compared with the results of other approaches. The details of evaluation being used to evaluate the performance of the proposed model are presented in Tab. 2. The proposed method has been analyzed for the performance under various performance metrics and compared with the results of other approaches.
Fortunately, the model derived from the RMVDM architecture works admirably on our image dataset utilized to train the models. This method offered preliminary validation that deep learning could be utilized to tackle the problem and was an acceptable method to take. The learning algorithms successfully classified all of the photos in the test set as normal or faulty.
The value of accuracy and loss produced by the proposed model has been measured and presented in Fig. 6 and the accuracy value and loss value of conventional classifiers are depicted in Figs. 7–9. The proposed model improves the accuracy and reduces the loss ratio.
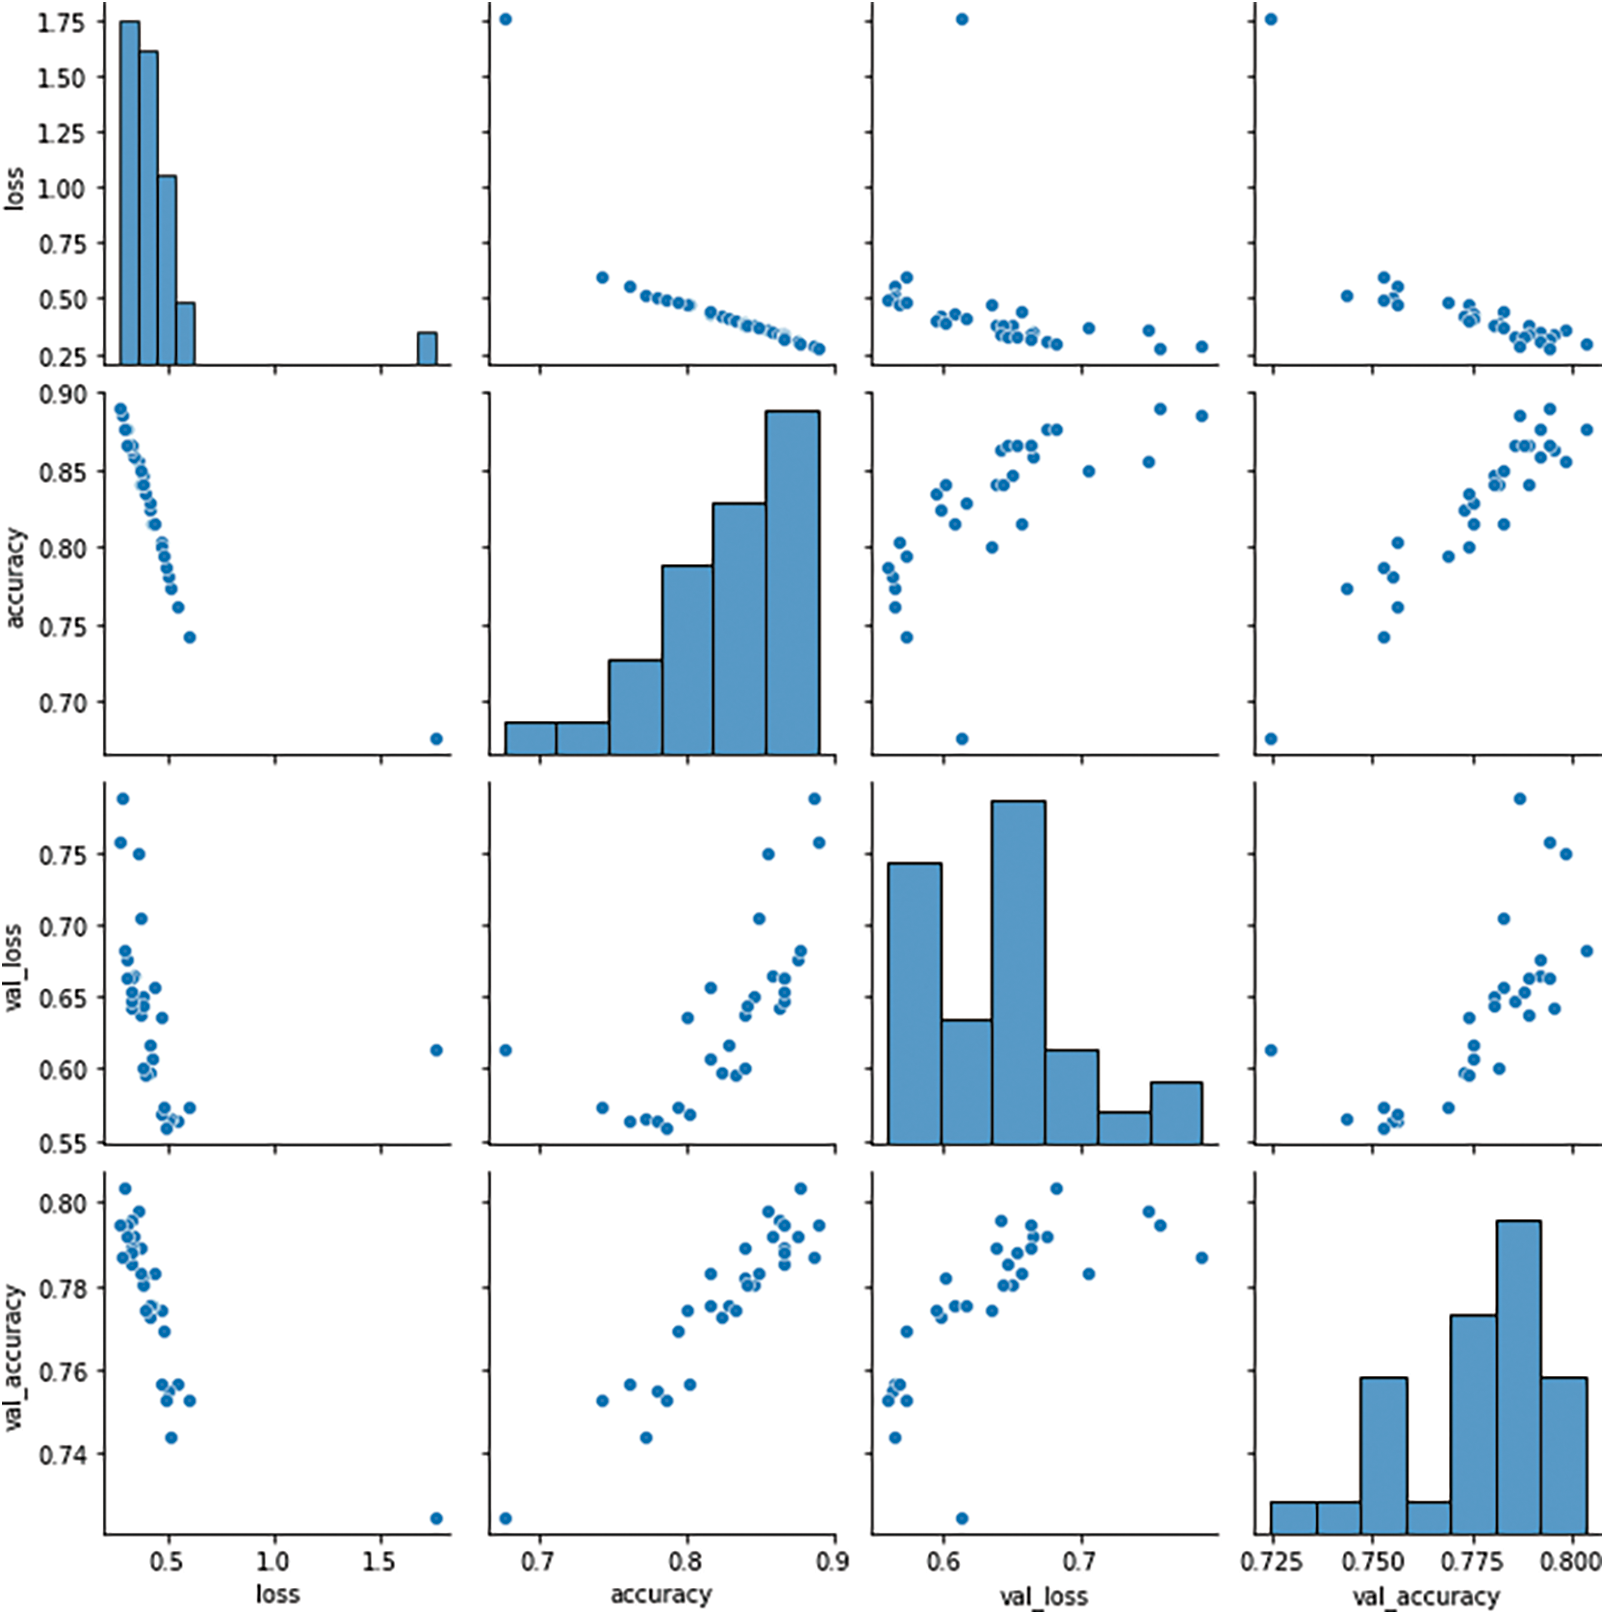
Figure 6: Analysis on accuracy and loss
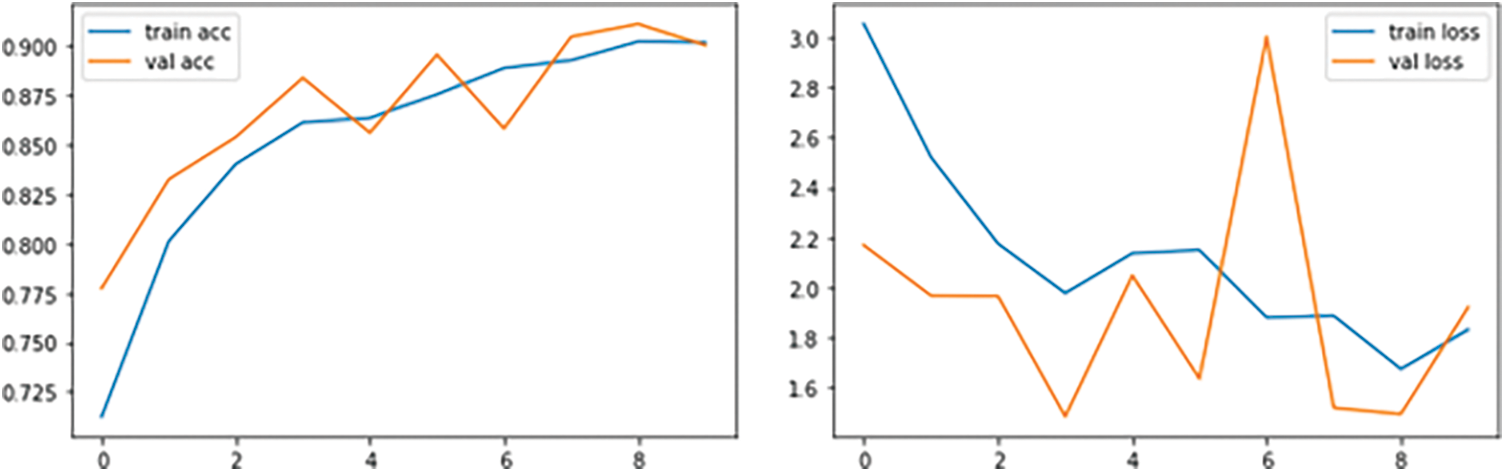
Figure 7: Accuracy and loss value of SVM
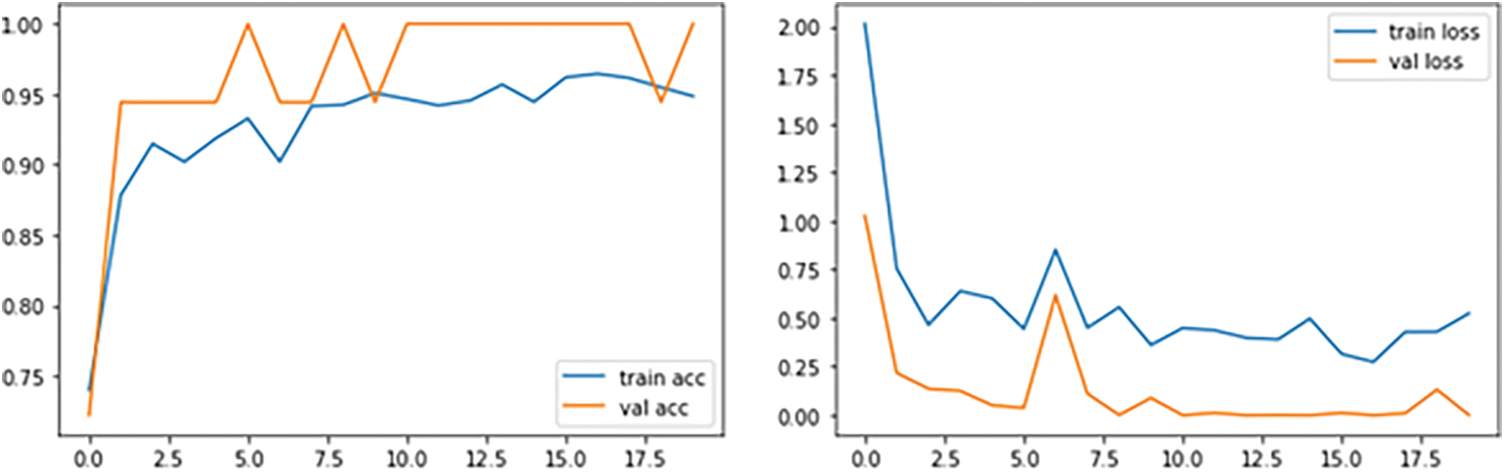
Figure 8: Accuracy and loss value of RMVDM
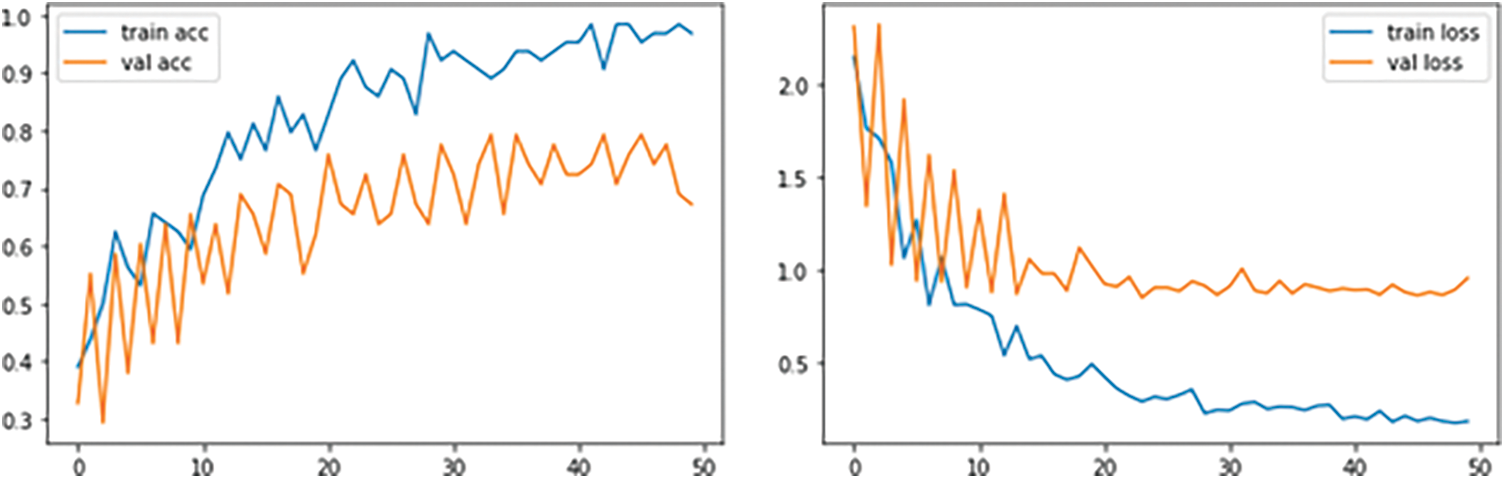
Figure 9: Accuracy and loss value of CNN
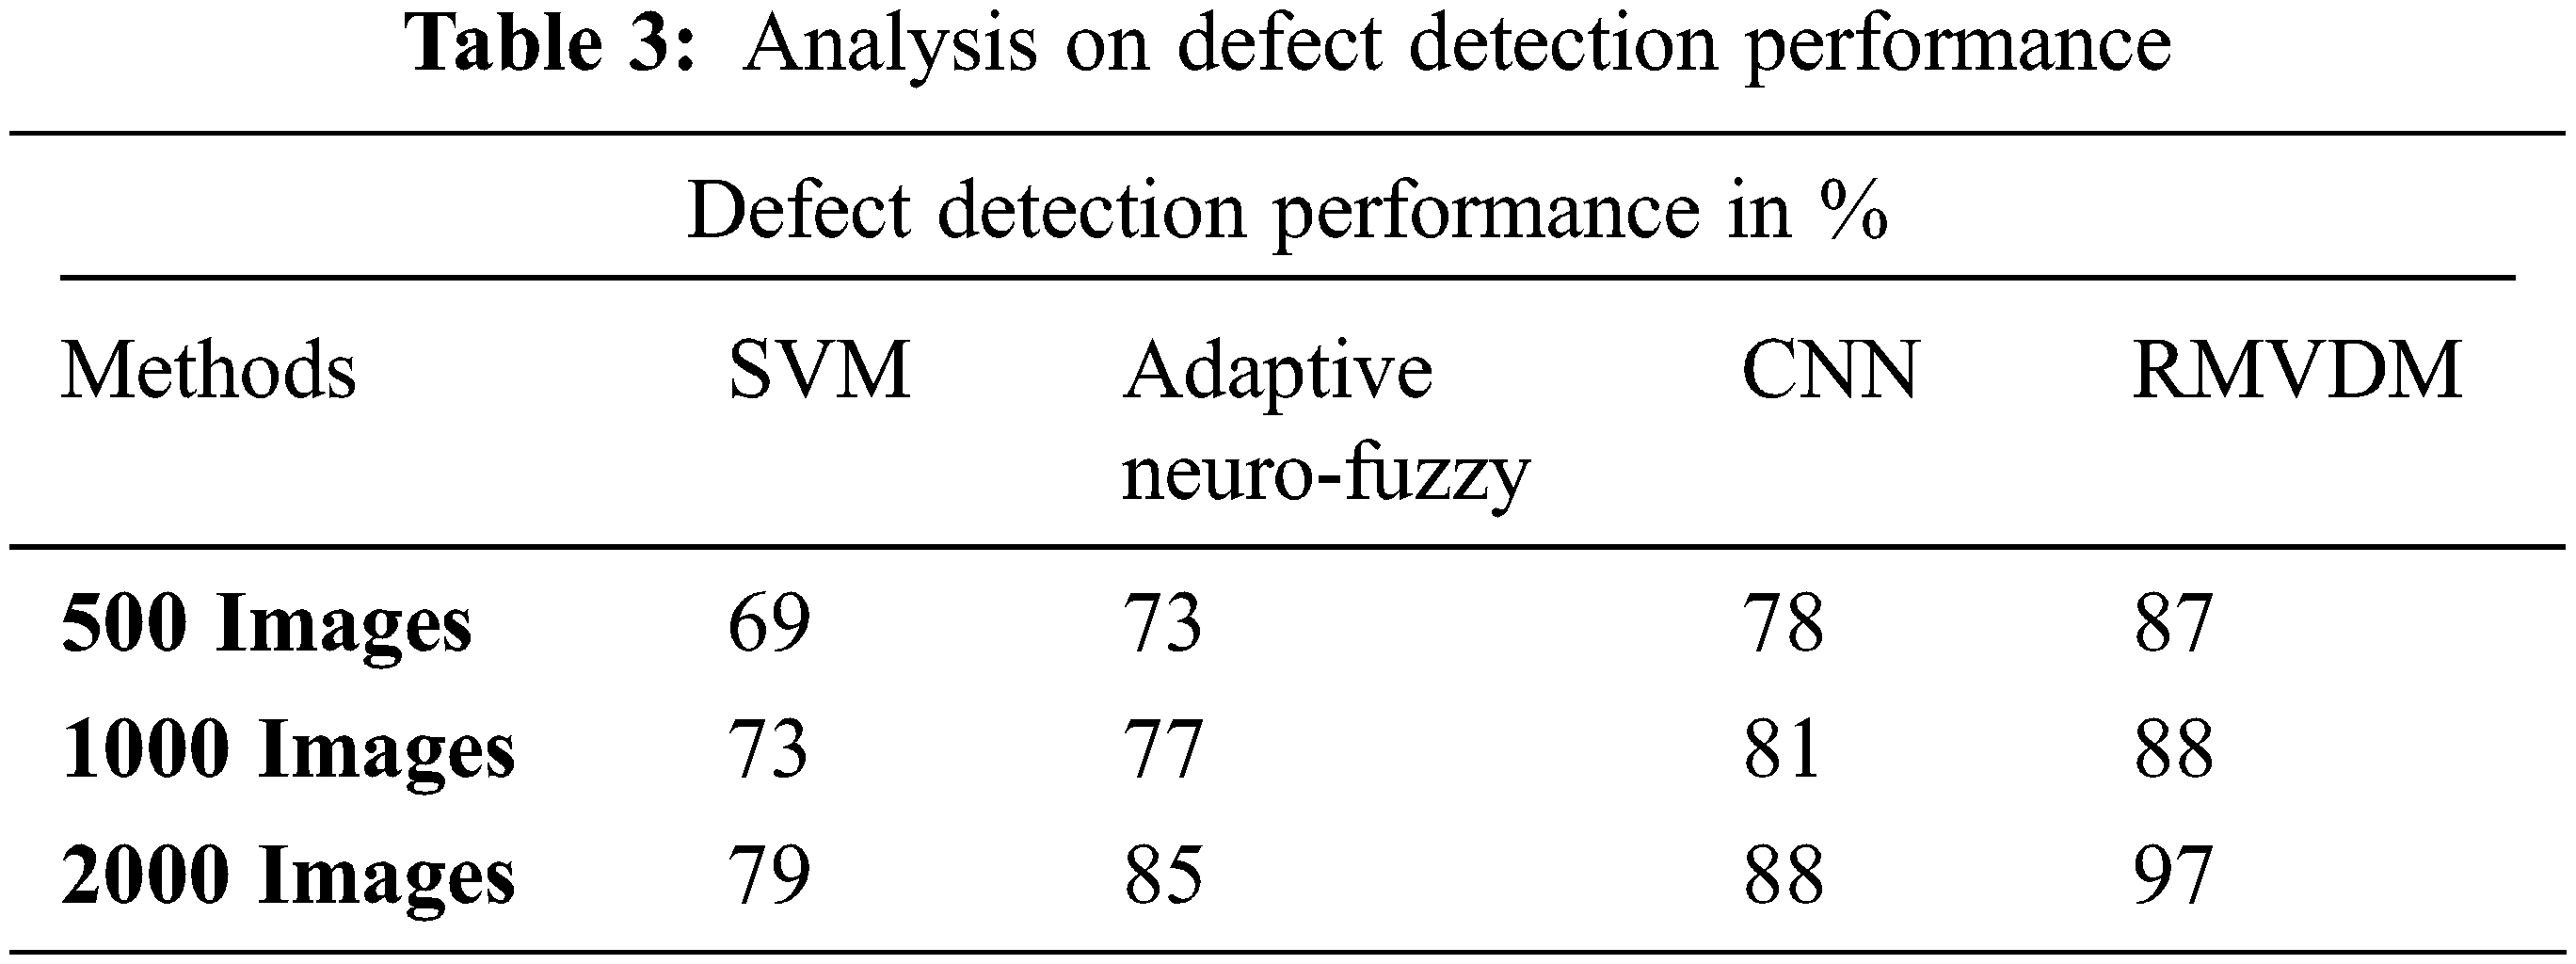
The performance of different approaches in defect detection and classification are measured with different no of images in each class present in Tab. 3. The proposed RMVDM model has produced higher detection accuracy in the ratio 87%, 93%, and 97% in all the cases. The proposed approach produces higher detection accuracy than other approaches.
In Fig. 10 the accuracy of detecting the defect in PV images is measured for different methods in the presence of a different number of images. In each class, the proposed RMVDM model has produced higher accuracy in detection than other approaches.
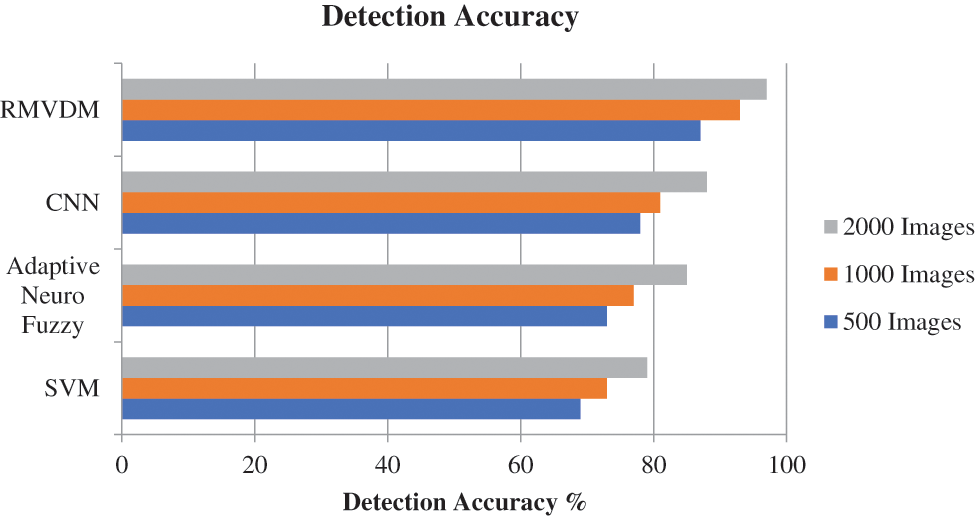
Figure 10: Analysis of defect detection accuracy
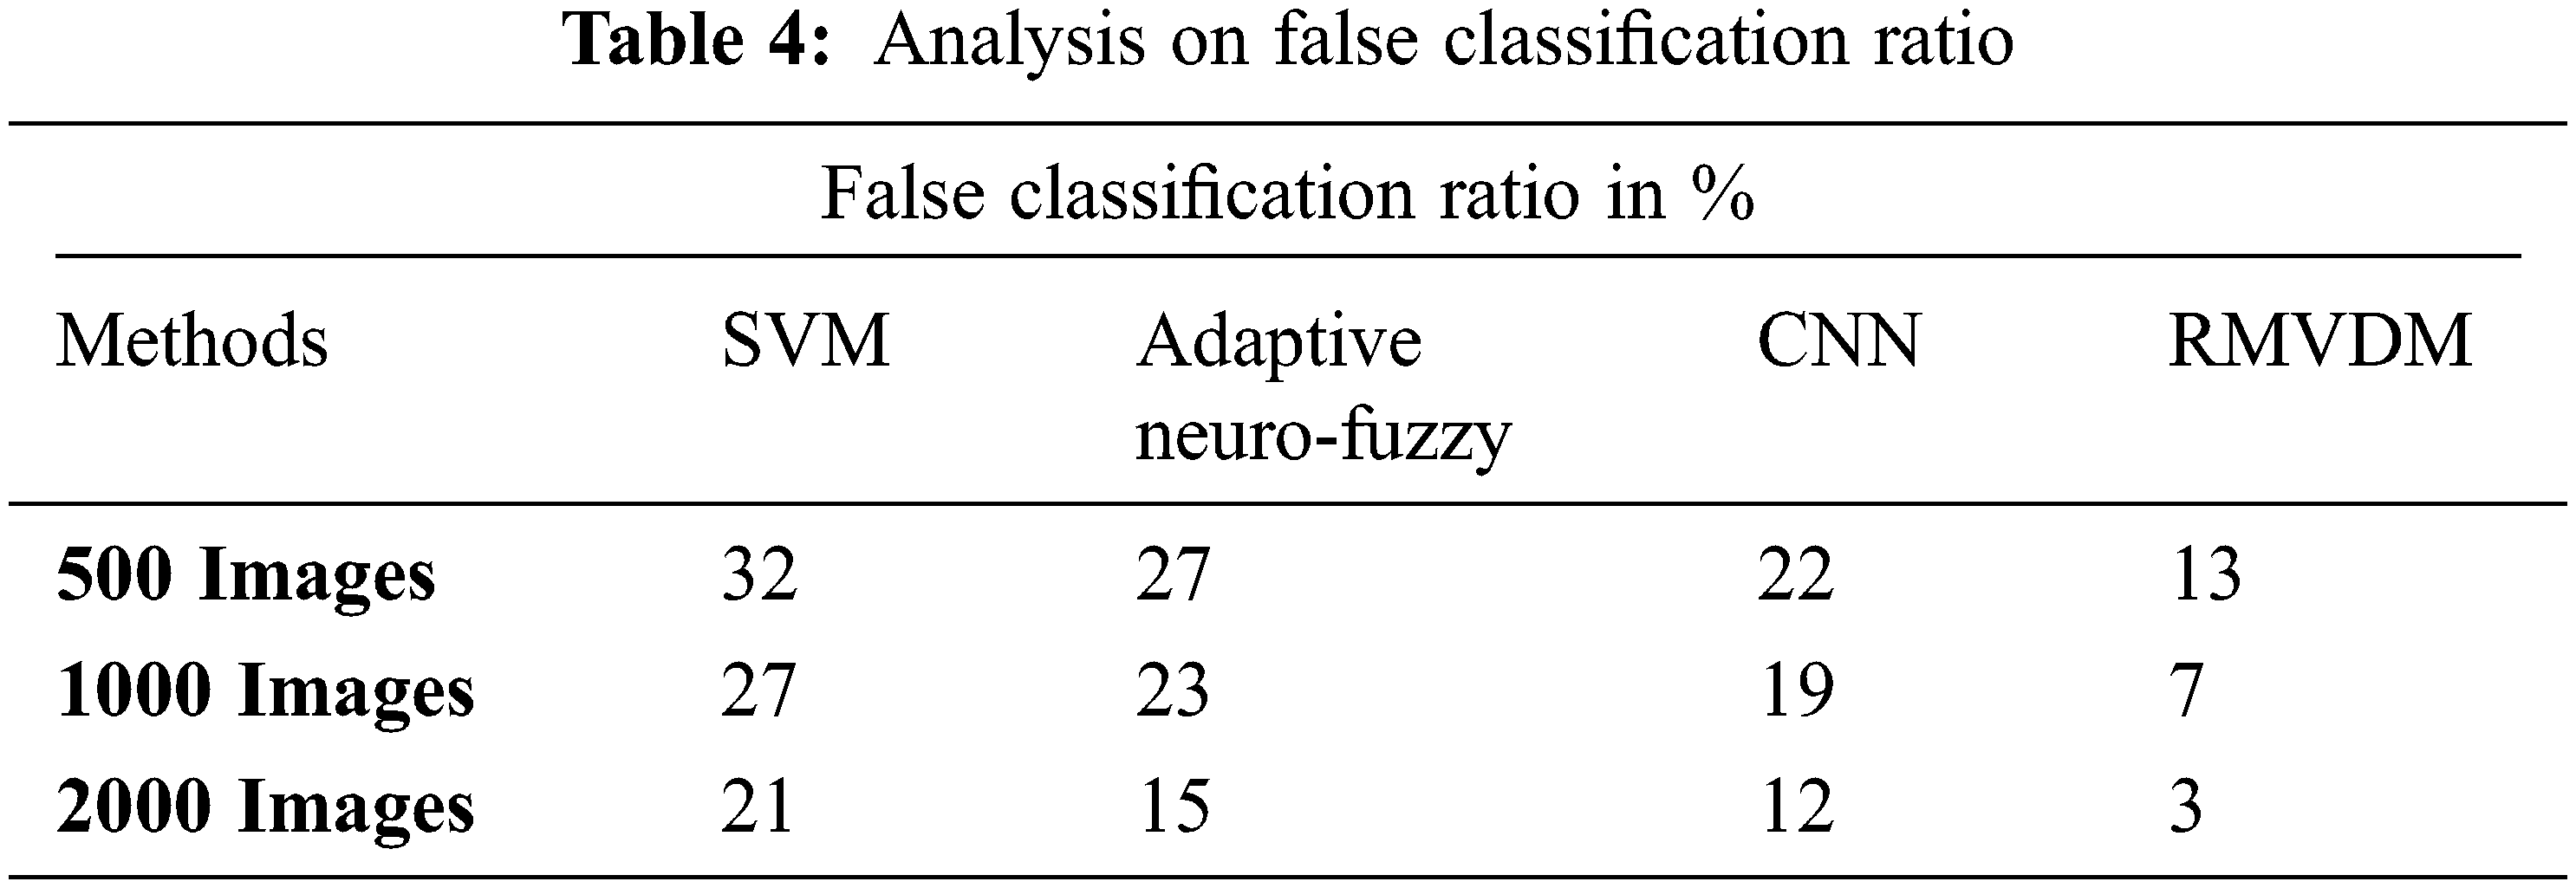
The ratio of false classification produced by different methods is measured and presented in Tab. 4. The proposed RMVDM model has produced less false ratio compared to other approaches.
The ratio of false classification produced by different approaches is measured and presented in Fig. 11. The proposed RMVDM model has produced less false ratio compared to other approaches in all the cases.
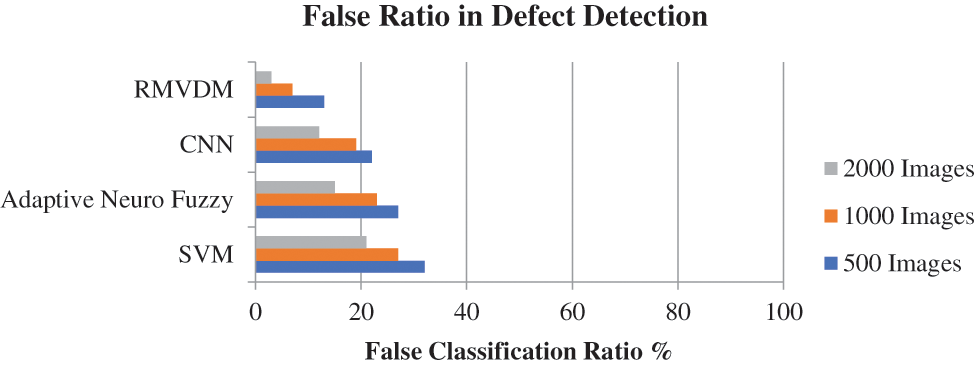
Figure 11: Analysis on false classification ratio
The time complexity introduced by different methods in detecting the defect on PV image has been measured and compared in Tab. 5. The proposed RMVDA approach has produced less time complexity in all the cases.
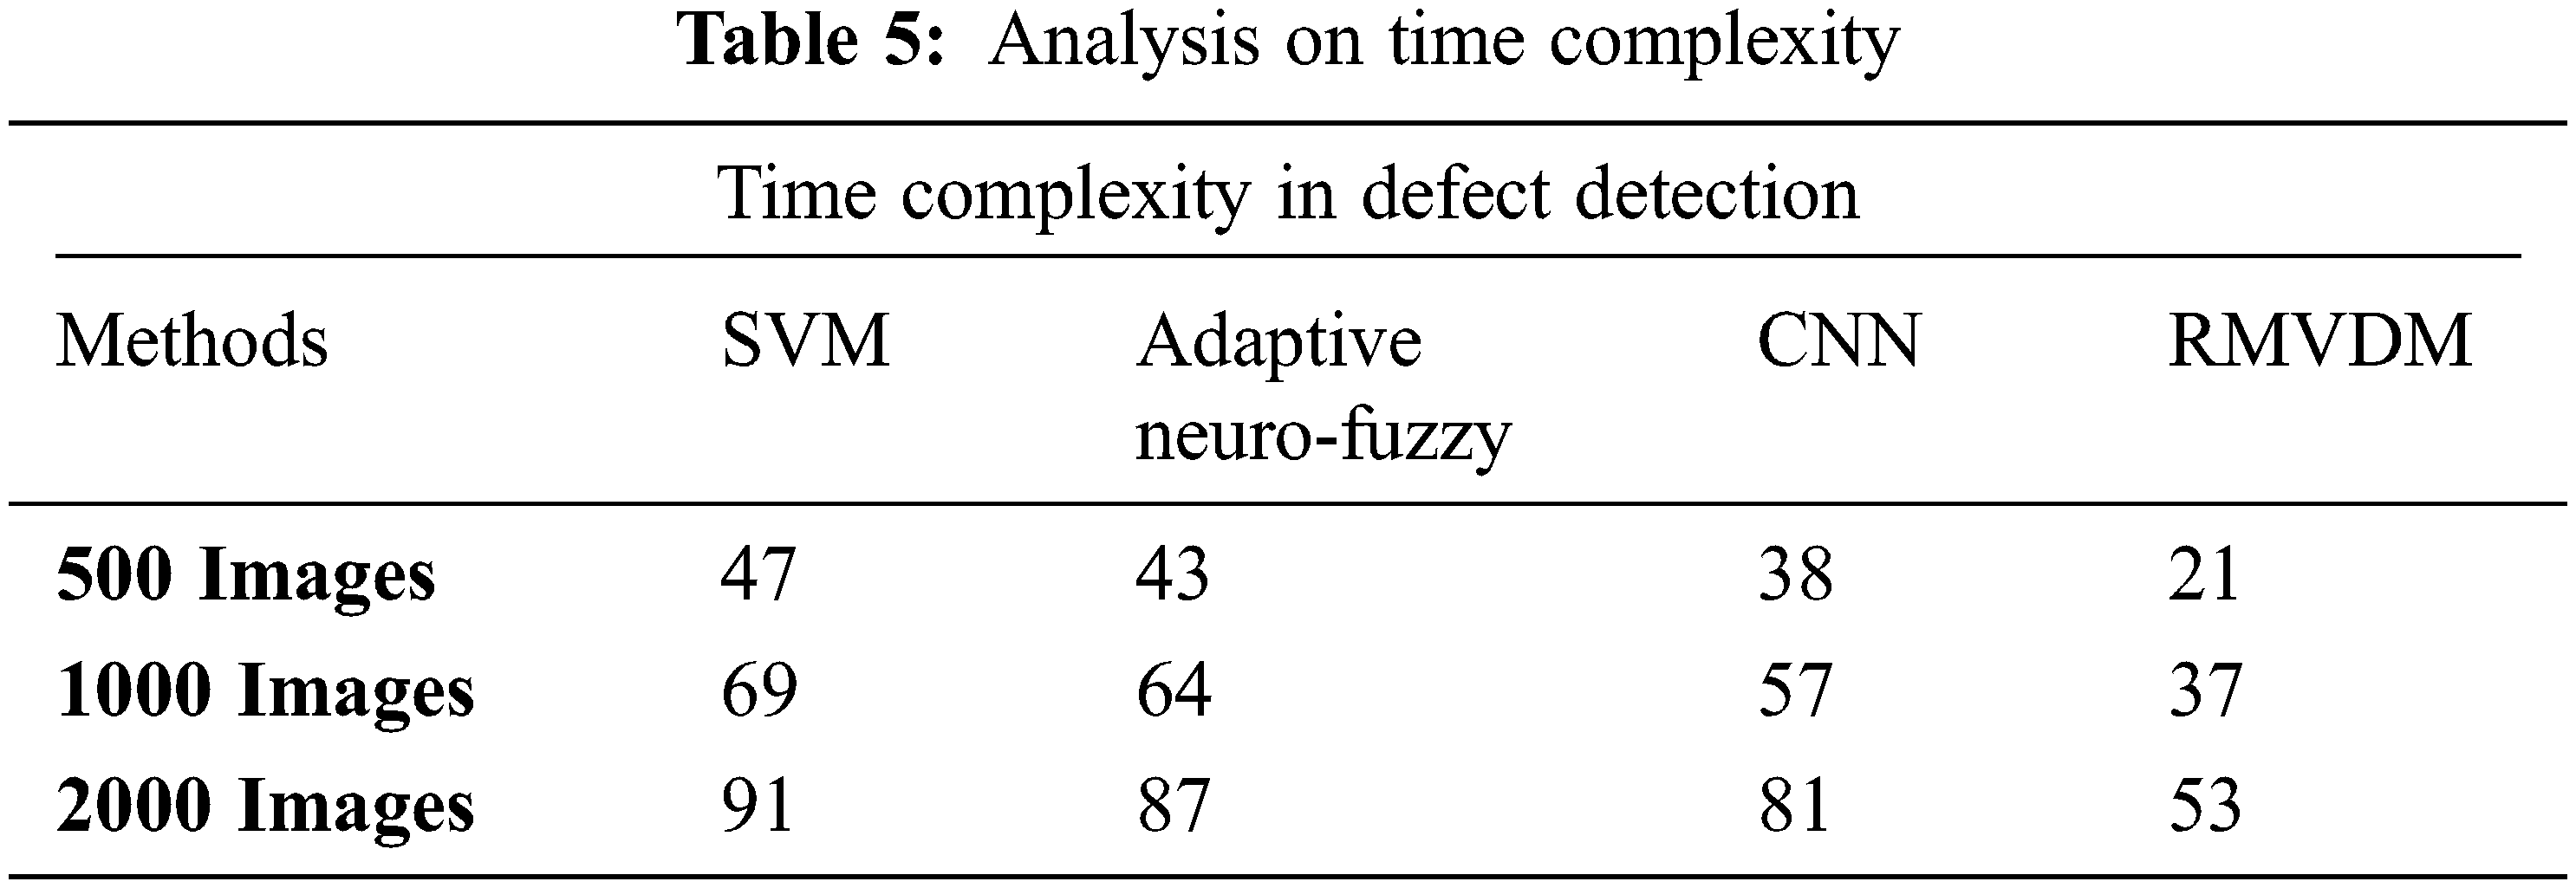
The value of time complexity introduced by various methods is measured in Fig. 12. However, the proposed approach produced less time classification in all the test cases than other methods.
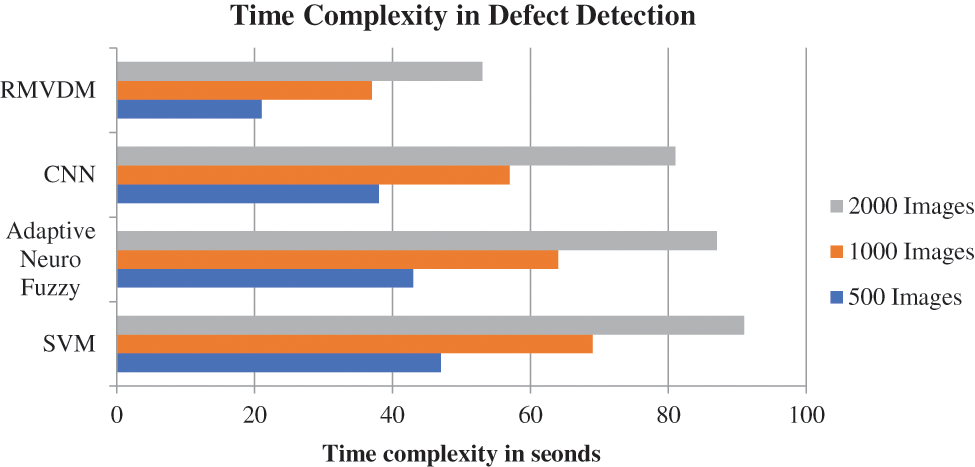
Figure 12: Analysis of time complexity
The performance of different approaches in localization is measured with different no of images in each class presented in Tab. 6. The proposed RMVDM model has produced higher localization accuracy in the ratio 85%, 91%, and 95% in all the cases. The proposed approach produces higher localization accuracy than other approaches.
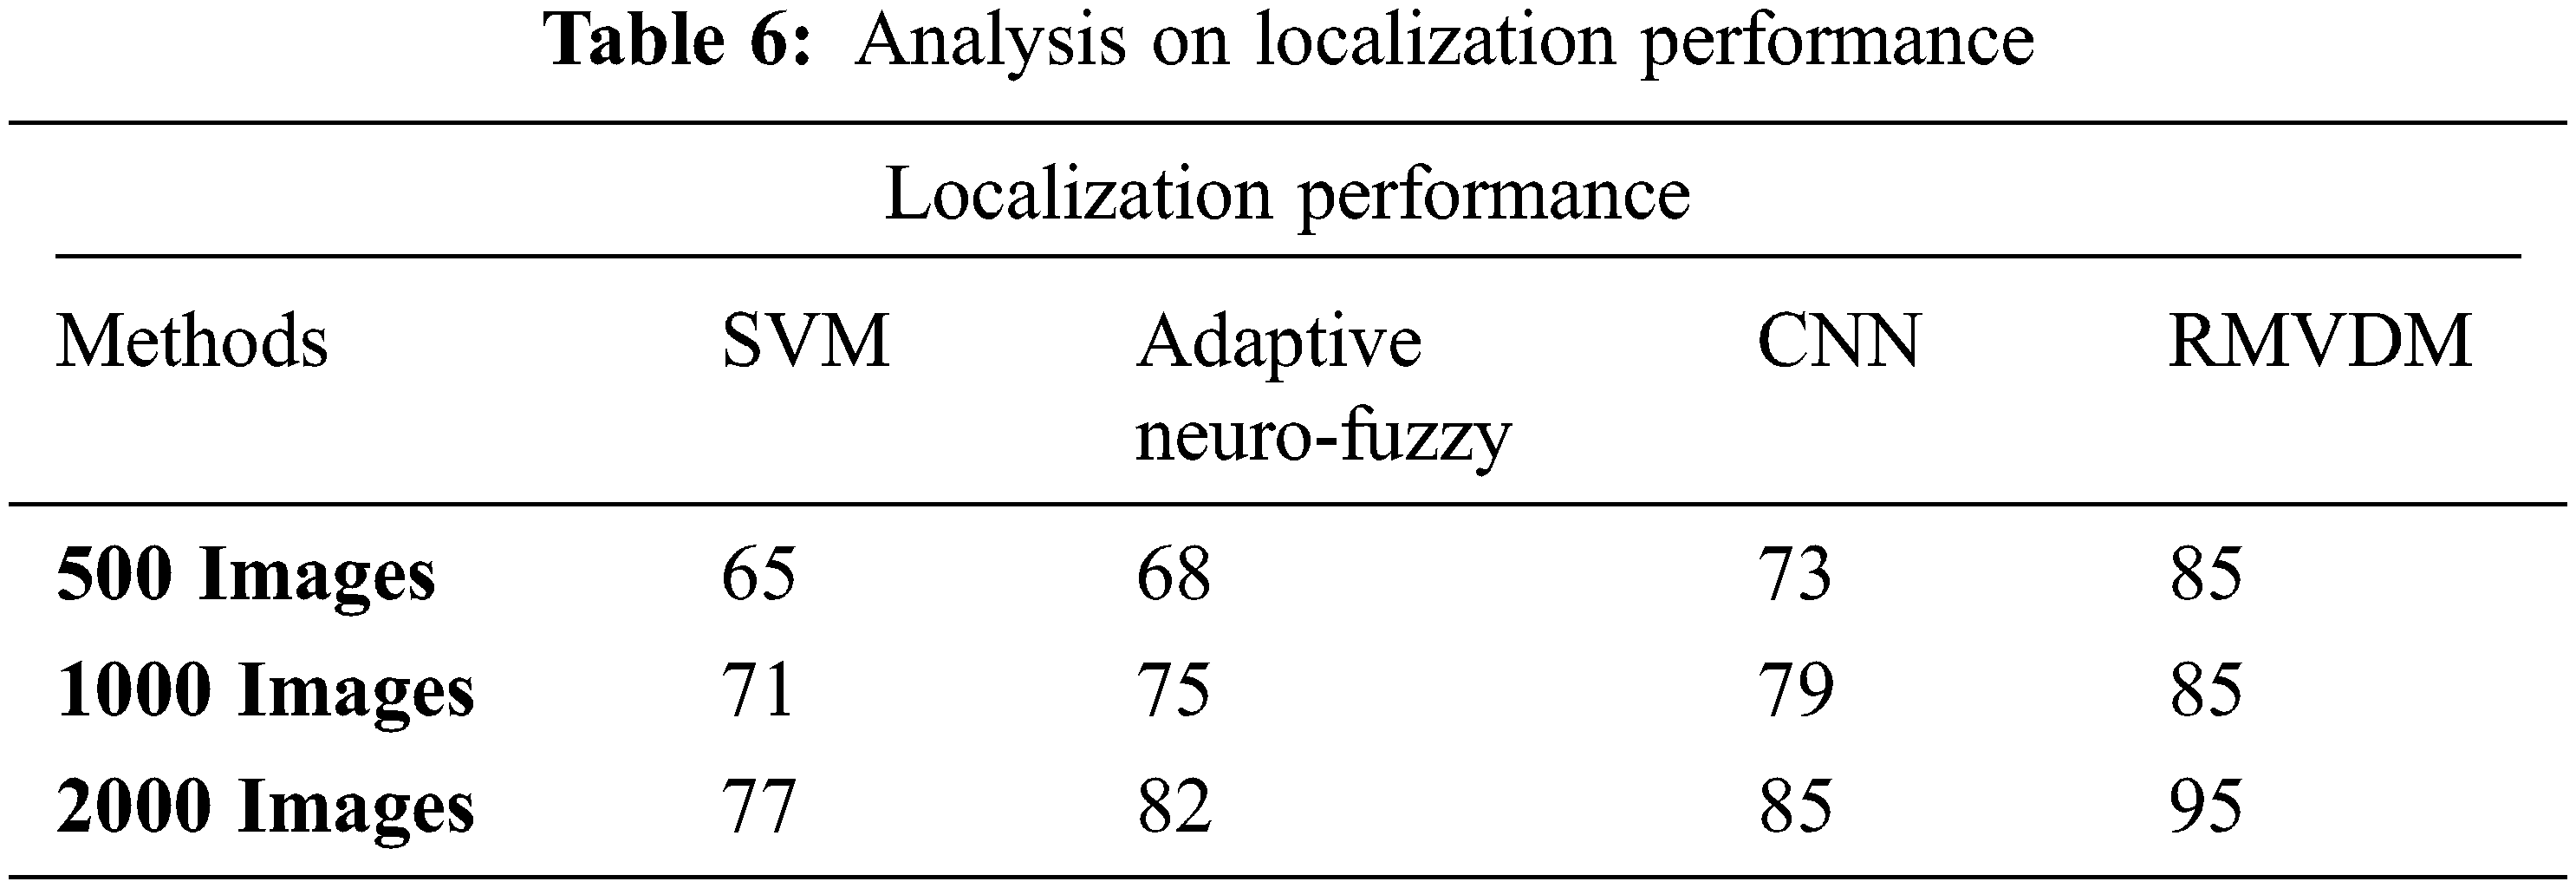
Previously, the operator must physically inspect the precise position of each defect to the specific PV module. Certain photos were not successfully processed by the existing algorithm. The suggested HOLT method can produce cutting-edge results when it comes to detecting, classifying, and localizing defects. Furthermore, localizing the defects in the PV panels is done for the first time. In this proposed HOLT method, each fault’s latitude and longitude may be retrieved automatically.
The accuracy of localizing the defect in PV images is measured in Fig. 13 for different methods in the presence of a different number of images. In each class, the proposed RMVDM model has produced higher accuracy in localization than other approaches.
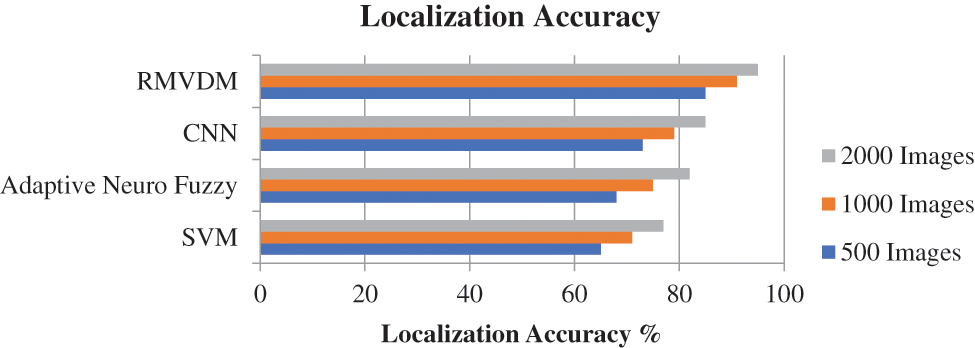
Figure 13: Analysis on localization accuracy
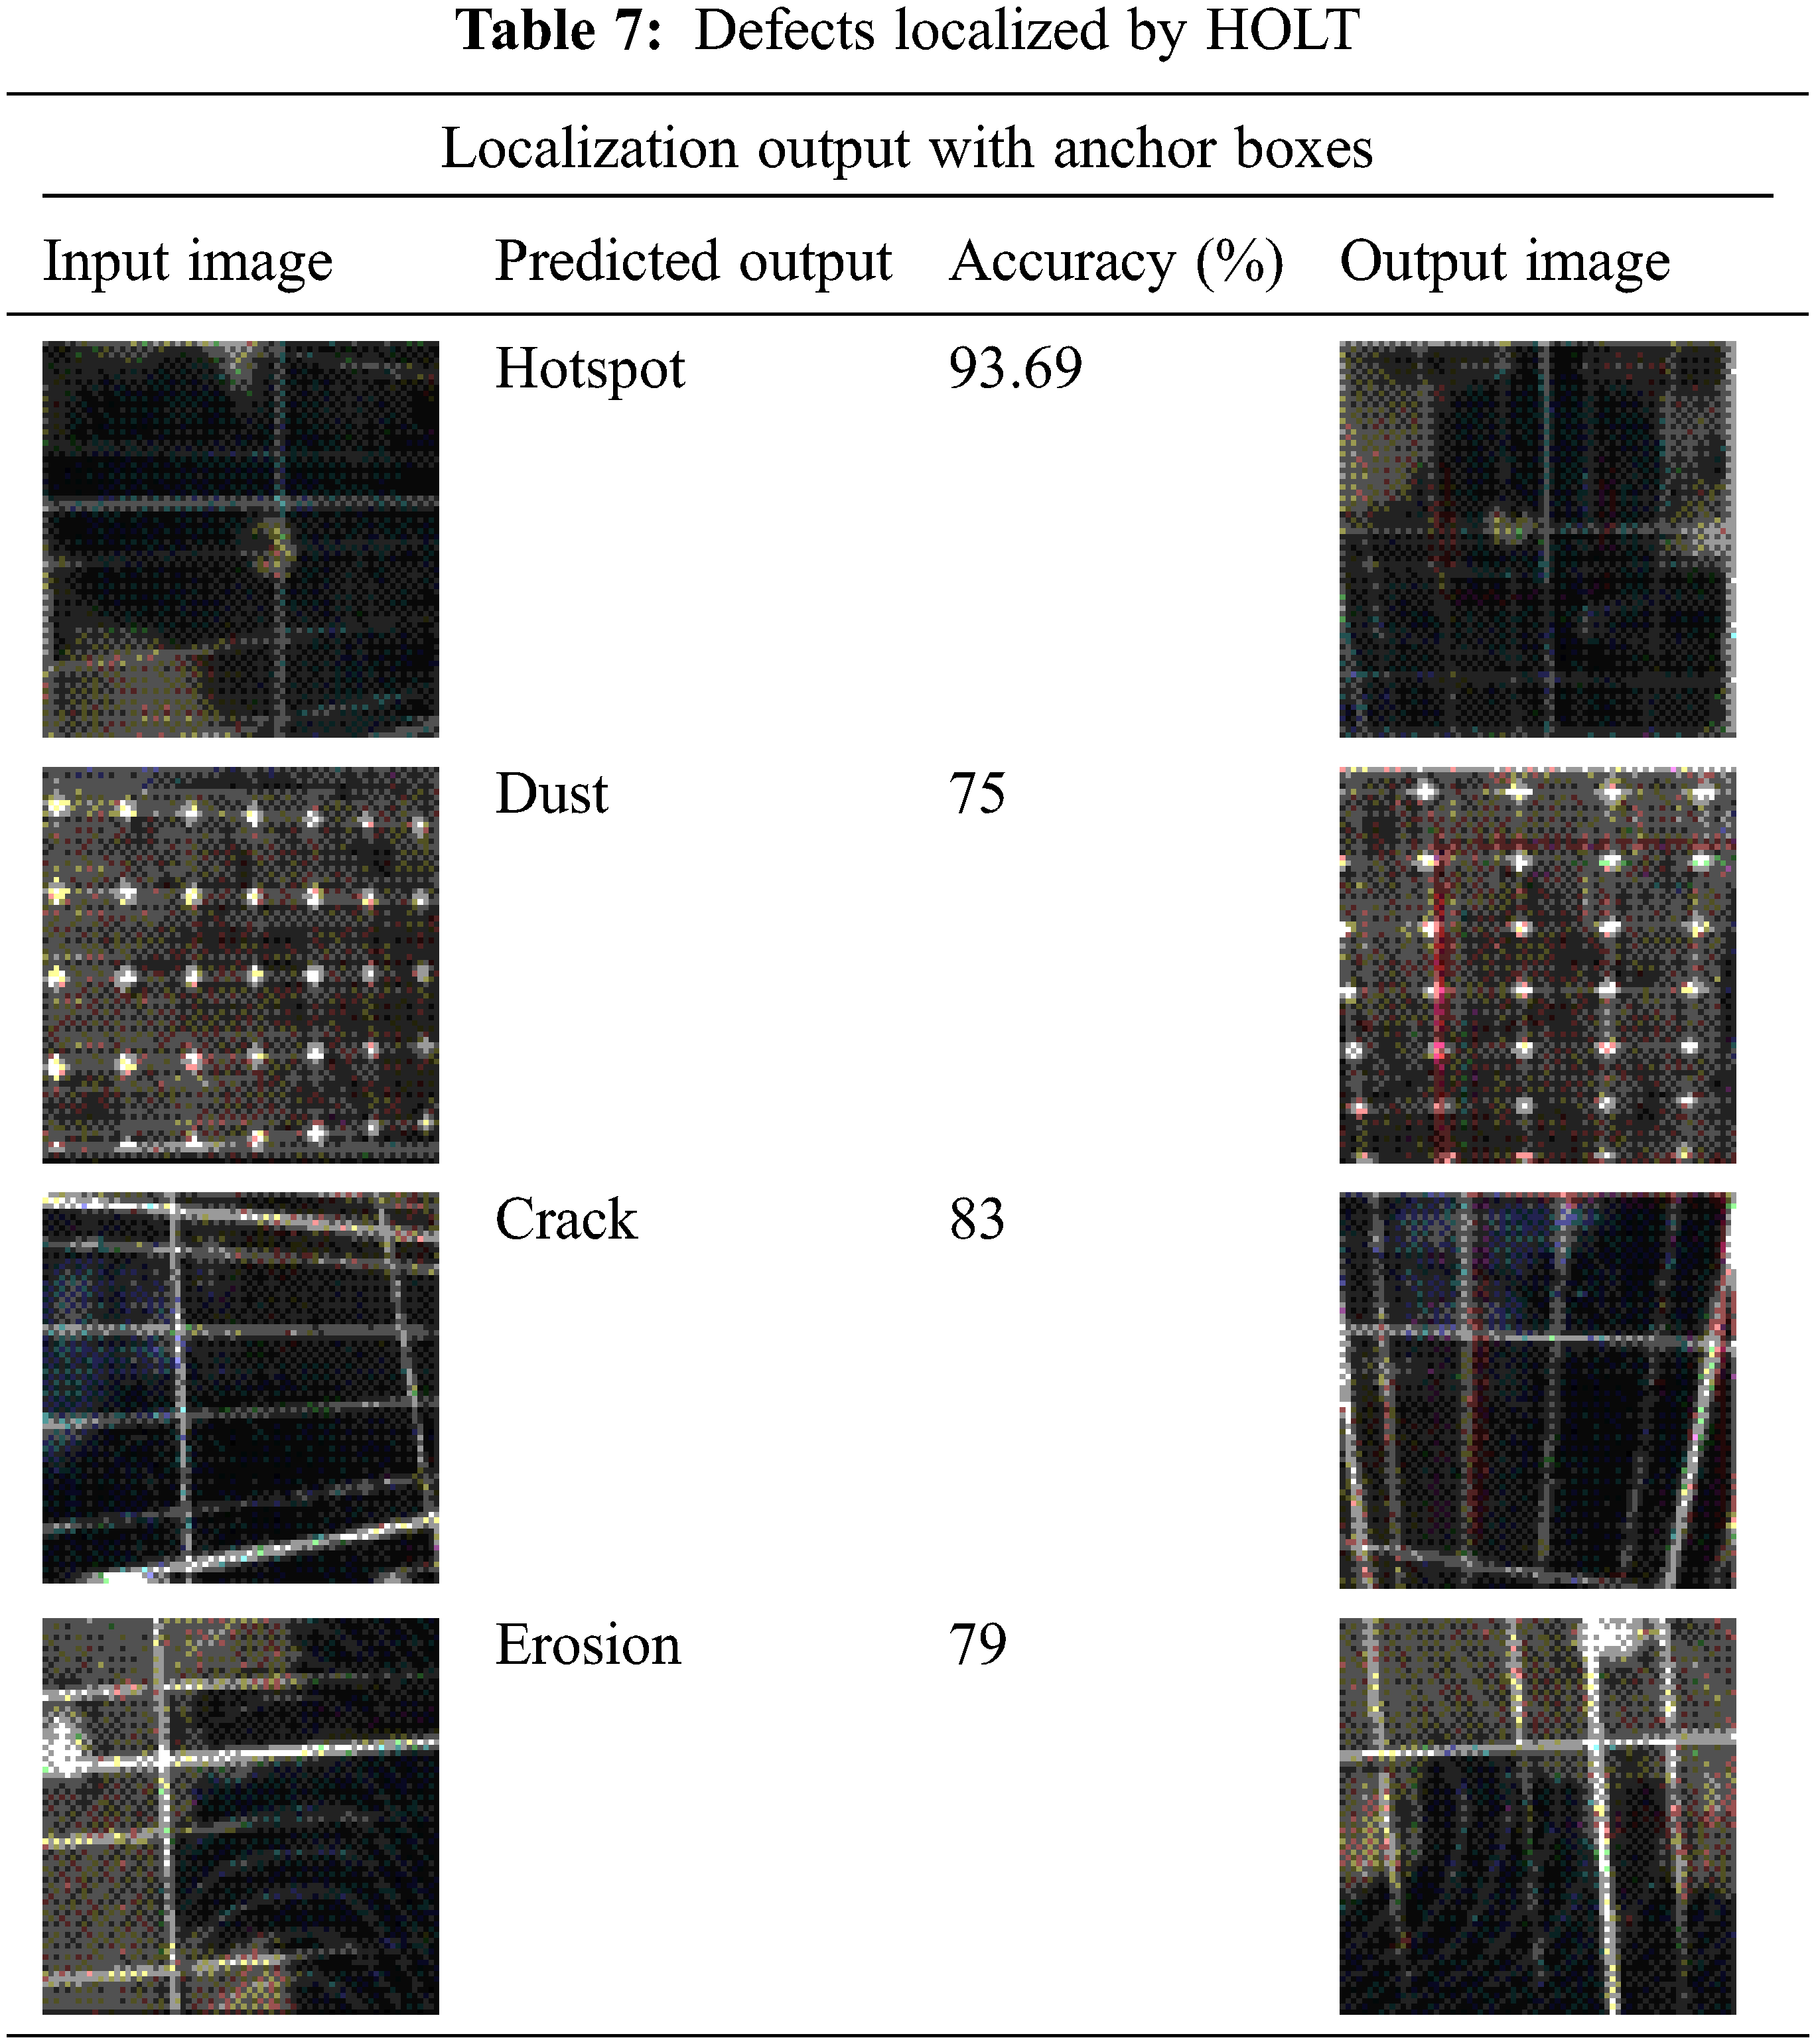
A ground truth bounding box and a forecasted bounding box are required when assessing an algorithm in the context of object detection. Detection can be classed as accurate or wrong based on a provided threshold. The identified faults are displayed in Tab. 7 which depicts a qualitative view of the results presented in the preceding sections. Because the computed error after correcting the perspective of all the detected PV panels is minor, the image has also been classed as accurate.
This paper presented a novel RMVDM, HOLT towards defect detection, classification, and localization on PV images. The method applies RHA preprocessing in the images to improve the quality. Further, the method that applies GSQA is extracting features. The network has been trained the feature extracted to compute SDCS, EDCS, CDCS, DDCS measures. Using these values, the method performs detection of a defect as well as localizing the defect. The proposed RMVDM, HOLT model has produced defect detection accuracy up to 97.6%. In the future, the problem of defect localization can be approached by considering time variant images of solar panels to improve higher performance.
Acknowledgement: I would like to express my gratitude to my supervisor, Dr.R.Annie Uthra, and also thank Dr.J.Preetha Roslyn, who guided me throughout this research.
Funding Statement: The authors received no specific funding for this study
Conflicts of Interest: The authors declare that they have no conflicts of interest to report regarding the present study.
1. C. S. Durganjali, S. Bethanabhotla, S. Kasina and S. Radhika, “Recent developments and future advancements in solar panels technology,” Journal of Physics: Conference Series, vol. 1495, no. 1, pp. 012018, 2020. [Google Scholar]
2. K. Yu, L. Tan, L. Lin, X. Cheng, Z. Yi et al., “Deep-learning-empowered breast cancer auxiliary diagnosis for 5GB remote e-health,” IEEE Wireless Communications, vol. 28, no. 3, pp. 54–61, 2021. [Google Scholar]
3. M. Alsafasfeh, I. A. Qader and B. Bazuin, “Fault detection in photovoltaic system using SLIC and thermal images,” in IEEE 8th Int. Conf. on Information Technology (ICIT), Amman, Jordan, pp. 672–676, 2017. [Google Scholar]
4. G. Yao and X. Wu, “Halcon-based solar panel crack detection,” in IEEE 2nd World Conf. on Mechanical Engineering and Intelligent Manufacturing (WCMEIM), Shanghai, China, pp. 733–736, 2019. [Google Scholar]
5. N. Padmavathi and A. Chilambuchelvan, “Fault detection and identification of solar panels using bluetooth,” in IEEE Int. Conf. on Energy, Communication, Data Analytics and Soft Computing (ICECDS), Chennai, India, pp. 3420–3426, 2017. [Google Scholar]
6. G. M. Andrew and P. Knodle, “UV fluorescence for defect detection in residential solar panel system,” in IEEE 48th Photovoltaic Specialists Conf. (PVSC), Fort Lauderdale, FL, USA, pp. 2575–2579, 2021. [Google Scholar]
7. C. Schuss, K. Remes, K. Leppänen, B. Eichberger and T. Fabritius, “Thermography of photovoltaic panels and defect detection under outdoor environmental conditions,” in IEEE Int. Instrumentation and Measurement Technology Conf. (I2MTC), Glasgow, United Kingdom, pp. 1–6, 2021. [Google Scholar]
8. C. Schuss, K. Remes, K. Leppänen, J. Saarela, T. Fabritius et al., “Detecting defects in photovoltaic cells and panels with the help of time-resolved thermography under outdoor environmental conditions,” in 2020 IEEE Int. Instrumentation and Measurement Technology Conf. (I2MTC), Dubrovnik, Croatia, pp. 1–6, 2020. [Google Scholar]
9. A. El-Amiri, A. Saifi, A. Obbadi, Y. Errami, S. Sahnoun et al., Defects detection in bi-facial photovoltaic modules PV using pulsed thermography. In: Renewable Energies, Power Systems & Green Inclusive Economy (REPS-GIE). IEEE, Casablanca, Morocco, pp. 1–6, 2018. [Google Scholar]
10. A. V. Patel, L. McLauchlan and M. Mehrubeoglu, “Defect detection in PV arrays using image processing,” in IEEE Int. Conf. on Computational Science and Computational Intelligence (CSCI), Las Vegas, NV, USA, pp. 1653–1657, 2020. [Google Scholar]
11. I. Zyout and A. Oatawneh, “Detection of PV solar panel surface defects using transfer learning of the deep convolutional neural networks,” in Advances in Science and Engineering Technology Int. Conf. (ASET), Dubai, United Arab Emirates, IEEE, pp. 1–4, 2020. [Google Scholar]
12. X. Li, W. Li, Q. Yang, W. Yan and A. Y. Zomaya, “Building an online defect detection system for large-scale photovoltaic plants,” in Proc. of the 6th ACM Int. Conf. on Systems for Energy-Efficient Buildings, Cities, and Transportation, ACM, New York, NY, USA, pp. 253–262, 2019. [Google Scholar]
13. X. Guo and J. Cai, “Optical stepped thermography of defects in photovoltaic panels,” IEEE Sensors Journal, vol. 21, no. 1, pp. 490–497, 2021. [Google Scholar]
14. K. Natarajan, B. P. Kumar and V. S. Kumar, “Fault detection of solar PV system using SVM and thermal image processing,” International Journal of Renewable Energy Research, vol. 10, no. 2, pp. 967–977, 2020. [Google Scholar]
15. C. Schuss, K. Remes, K. Leppänen, J. Saarela, T. Fabritius et al., “Estimating the impact of defects in photovoltaic cells and panels,” in IEEE Int. Instrumentation and Measurement Technology Conf. Proc., Taipei, Taiwan, pp. 1–6, 2016. [Google Scholar]
16. R. O. S. Juan and J. Kim, “Photovoltaic cell defect detection model based-on extracted electroluminescence images using SVM classifier,” in 2020 Int. Conf. on Artificial Intelligence in Information and Communication (ICAIIC), Fukuoka, Japan, pp. 578–582, 2020. [Google Scholar]
17. M. M. Mansouri, S. Hadjeri and M. Brahami, “New method of detection, identification, and elimination of photovoltaic system faults in real time based on the adaptive neuro-fuzzy system,” IEEE Journal of Photovoltaics, vol. 11, no. 3, pp. 797–805, 2021. [Google Scholar]
18. S. Chen, S. Shan, L. Xie, H. Wei and J. Zhang, “A deep two-stage scheme for polycrystalline micro-crack detection,” in Proc. of the 2020 Int. Conf. on Pattern Recognition and Intelligent Systems, Athens, Greece, pp. 1–5, 2020. [Google Scholar]
19. I. Zyout and A. Oatawneh, “Detection of PV solar panel surface defects using transfer learning of the deep convolutional neural networks,” in Advances in Science and Engineering Technology Int. Conf. (ASET), IEEE, Dubai, United Arab Emirates, pp. 1–4, 2020. [Google Scholar]
20. A. H. Aghamohammadi, A. S. Prabuwono, S. Sahran and M. Mogharrebi, “Solar cell panel crack detection using particle swarm optimization algorithm,” in 2011 Int. Conf. on Pattern Analysis and Intelligence Robotics, IEEE, Kuala Lumpur, Malaysia, pp. 160–164, 2011. [Google Scholar]
21. P. Xu, W. Zhou and M. Fei, “Detection methods for micro-cracked defects of photovoltaic modules based on machine vision,” in IEEE 3rd Int. Conf. on Cloud Computing and Intelligence Systems, Shenzhen, pp. 609–613, 2014. [Google Scholar]
22. P. Addabbo, A. Angrisano, M. L. Bernardi, G. Gagliarde, A. Mennella et al., “A UAV infrared measurement approach for defect detection in photovoltaic plants,” in IEEE Int. Workshop on Metrology for AeroSpace (MetroAeroSpace), pp. 345–350, 2017. [Google Scholar]
23. C. Schuss, K. Leppänen, K. Remes, J. Saarela, T. Fabritius et al., “Detecting defects in photovoltaic cells and panels and evaluating the impact on output performances,” IEEE Transactions on Instrumentation and Measurement, vol. 65, no. 5, pp. 1108–1119, 2016. [Google Scholar]
24. O. Ozturk, B. Hangun and O. Eyecioglu, “Detecting snow layer on solar panels using deep learning,” in 10th Int. Conf. on Renewable Energy Research and Application (ICRERA), IEEE, Istanbul, Turkey, pp. 434–438, 2021. [Google Scholar]
25. A. Greco, C. Pironti, A. Saggese, M. Vento and V. Vigilante, “A deep learning based approach for detecting panels in photovoltaic plants,” in Proc. of the 3rd Int. Conf. on Applications of Intelligent Systems, Las Palmas de Gran Canaria, Spain, pp. 1–7, 2020. [Google Scholar]
26. M. W. Akram, G. Li, Y. Jin, X. Chen, C. Zhu et al., “Automatic detection of photovoltaic module defects in infrared images with isolated and develop-model transfer deep learning,” Solar Energy, vol. 198, pp. 175–186, 2020. [Google Scholar]
27. H. H. Lin, H. K. Dandage, K. M. Lin, Y. T. Lin and Y. J. Chen, “Efficient cell segmentation from electroluminescent images of single-crystalline silicon photovoltaic modules and cell-based defect identification using deep learning with pseudo-colorization,” Sensors, vol. 21, no. 13, pp. 4292, 2021. [Google Scholar]
28. M. U. Ali, S. Saleem, H. Masood, K. D. Kallu, M. Masud et al., “Early hotspot detection in photovoltaic modules using color image descriptors: An infrared thermography study,” International Journal of Energy Research, vol. 46, no. 2, pp. 774–785, 2021. [Google Scholar]
29. X. Li, Q. Yang, W. Yan and Z. Chen, “Intelligent fault pattern recognition of aerial photovoltaic module images based on deep learning technique,” Systemics Cybernetics and Informatics, vol. 16, no. 2, pp. 67–71, 2018. [Google Scholar]
30. W. Slimani, “Defect detection by automatic control in the photovoltaic panel manufacturing process,” Journal of Mechanical Engineering Research and Developments, vol. 44, no. 5, pp. 258–262, 2021. [Google Scholar]
31. M. W. Akram, G. Li, Y. Jin, X. Chen, C. Zhu et al., “CNN based automatic detection of photovoltaic cell defects in electroluminescence images,” Energy, vol. 189, no. 12, pp. 116319, 2019. [Google Scholar]
32. P. Warren, H. Ali, H. Ebrahimi and R. Ghosh, “Rapid defect detection and classification in images using convolutional neural networks,” Turbo Expo: Power for Land, Sea, and Air, ASME, vol. 84966, pp. V004T05A013, 2021. [Google Scholar]
33. W. Sun, G. Z. Dai, X. R. Zhang, X. Z. He and X. Chen, “TBE-net: A three-branch embedding network with part-aware ability and feature complementary learning for vehicle re-identification,” IEEE Transactions on Intelligent Transportation Systems, pp. 1–13, 2021. https://dx.doi.org/10.1109/TITS.2021.3130403. [Google Scholar]
34. W. Sun, L. Dai, X. R. Zhang, P. S. Chang and X. Z. He, “RSOD: Real-time small object detection algorithm in UAV-based traffic monitoring,” Applied Intelligence, vol. 92, no. 6, pp. 1–16, 2021. [Google Scholar]
 | This work is licensed under a Creative Commons Attribution 4.0 International License, which permits unrestricted use, distribution, and reproduction in any medium, provided the original work is properly cited. |