DOI:10.32604/csse.2023.029254
| Computer Systems Science & Engineering DOI:10.32604/csse.2023.029254 | |
| Article |
SA-MSVM: Hybrid Heuristic Algorithm-based Feature Selection for Sentiment Analysis in Twitter
1Department of Computer science and Engineering, Sri Ranganathar Institute of Engineering and Technology, Coimbatore, Tamilnadu, 641009, India
2Department of Information and Technology, PSNA College of Engineering and Technology, Dindigul, Tamilnadu, 624622, India
*Corresponding Author: C. P. Thamil Selvi. Email: thamilselviphd123@gmail.com
Received: 28 February 2022; Accepted: 01 April 2022
Abstract: One of the drastically growing and emerging research areas used in most information technology industries is Bigdata analytics. Bigdata is created from social websites like Facebook, WhatsApp, Twitter, etc. Opinions about products, persons, initiatives, political issues, research achievements, and entertainment are discussed on social websites. The unique data analytics method cannot be applied to various social websites since the data formats are different. Several approaches, techniques, and tools have been used for big data analytics, opinion mining, or sentiment analysis, but the accuracy is yet to be improved. The proposed work is motivated to do sentiment analysis on Twitter data for cloth products using Simulated Annealing incorporated with the Multiclass Support Vector Machine (SA-MSVM) approach. SA-MSVM is a hybrid heuristic approach for selecting and classifying text-based sentimental words following the Natural Language Processing (NLP) process applied on tweets extracted from the Twitter dataset. A simulated annealing algorithm searches for relevant features and selects and identifies sentimental terms that customers criticize. SA-MSVM is implemented, experimented with MATLAB, and the results are verified. The results concluded that SA-MSVM has more potential in sentiment analysis and classification than the existing Support Vector Machine (SVM) approach. SA-MSVM has obtained 96.34% accuracy in classifying the product review compared with the existing systems.
Keywords: Bigdata analytics; Twitter dataset for cloth product; heuristic approaches; sentiment analysis; feature selection; classification
Text mining is a significant process used for analyzing text-based structured or unstructured data. It can also convert the unstructured data into a structured one for future text processes [1]. Customer reviews are considered a powerful insight is acting as a great source of customer opinions. In e-commerce, the existing customer’s review plays a vital role in improving businesses. Positive reviews can recommend a particular product. The new customers always verify the existing customer’s opinion about a product and select it.
Social media helps the contemporary world to have effective and efficient communication [2]. The entire social media platforms, such as Twitter, Facebook, WhatsApp, Instagram, etc., have almost become indispensable components of life. These social media platforms help the public to share secret and general messages. Some of these communications may be formal and informal. Informal communications do not need proper grammar [3], but the communication may be in some emotional symbols, pictures, abbreviations, and acronyms. Informal communications convey the mood and sentiment of the people involved. Continuous analysis of these communications across social media platforms provides sensitive information regarding the pattern to discuss people’s behavior, ideas, opinions, and significance. Two significant concepts, namely sentiment analysis, also called opinion mining and Natural Language Processing (NLP), play a pivotal role in understanding and decoding the person’s emotional state through social media.
The sentimental analysis is also termed emotional intelligence (EI) or Opinion Mining. It is defined as the process of correlating and collecting valuable information from highly unorganized and highly unstructured text or media content. That is available across the social media platform and other online chat messengers such as WhatsApp, Twitter, Facebook, and online blogs. Sentiment analysis uses a set of predefined rules used to analyze the contents available across online Twitter chats. Furthermore, there is a case where highly sophisticated machine learning principles and approaches are used instead of the predefined rules. This sentimental analysis is highly instrumental in classifying whether the person communicates positively or negatively and conveys the person’s state of mind in the chat discussions. The primary reason for using sentimental analysis in social media data is to obtain customer opinions about various online shopping products. It helps understand user needs, expectations in new products, and innovative ideas and voice a public statement regarding government policies and procedures.
It is essential to deploy NLP, one of the many sub-disciplines under Artificial Intelligence (AI), to perform better sentiment analysis. NLP plays a significant role in aiding computer systems to understand and decode the contents discussed during a chat discussion. NLP enables systems to understand the multilingual conversations happening across the chat transcripts. Thus, NLP can be considered the backbone of sentimental analysis or opinion mining. Another area where NLP finds significance is helping smart devices such as google talk and intelligent search engines to understand and interpret the user’s conversation. The system decodes the user request and caters to the same.
NLP can deploy several machine learning approaches and classifiers to classify and interpret different data types. One such machine learning classifier predominately used across NLP is Support Vector Machine (SVM). Classification approaches can be supervised, unsupervised, or semi-supervised. Support Vector Machine is a supervised machine learning classifier that performs useful data classification and analysis. SVM is a supervised machine learning algorithm because the categories for the sort of data are clearly defined. The model is trained to classify the data based on the defined classes and fit the given data into the predefined categories. It must be noted that SVM can perform both linear and nonlinear data classification, performs both binary and multiclass variety. A binary classification involves classifying the data into two different classes or buckets. However, Twitter data for cloth products are multi-dimensional, and hence binary SVM cannot suit the need for sentiment analysis using Twitter data for cloth products. In such a case, multiple classes must describe people’s different states and mindsets. Hence Multiclass Support Vector Machines are deployed for sentimental analysis across social media platforms such as Twitter.
Another essential aspect that needs to be considered while performing the sentimental analysis is how fast the data can be searched in the Twitter text to extract clues indicating mood and behavior . Faster searching strategies promote efficient processing and, in turn, enhance the performance of the overall sentimental analysis. Several searching strategies are adopted to improve the searching aspect of research. The proposed approach uses Simulated Annealing to perform faster searches and enable better opinion mining. The Simulated Annealing algorithm is one of the meta-heuristics and probabilistic methods that optimize the results. This search strategy comes in handy when the data is discrete. The simulation is carried out by a series of kinetic equations for probability density functions, or it may also be a sampling carried out using any stochastic method. The proposed approach uses a hybrid system that uses the Multiclass Support Vector Machine (MSVM) to classify different opinions and sentiments shared across social media data such as Twitter data for cloth products and the Simulated Annealing approach efficiently searching. For accomplishing this, the Twitter data for cloth products are initially imported and then subjected to preprocessing to remove unwanted contents such as redundant and duplicated data, erroneous data, and unwanted punctuations. It is followed by extracting the essential features that effectively transcripts the user’s mood who is conversing. Simulated Annealing is used in this stage to speed up the processing. A semantic word dictionary is trained to distinguish and classify the data according to its different moods. The final stage comprises the Multiclass Support Vector Machine classifier to classify the different sentiments conveyed during the Twitter conversations.
The contribution of this work is to develop a helpful data preprocessing method for unwanted content removal and filtering only relevant text. Also, efficient feature extraction and feature selection are promoted through the usage of Simulated Annealing. Finally, the Multiclass Support Vector Machine classifier is deployed to facilitate an efficient and effective multiclass classification of different types of sentiments. It aims to analyze customer reviews using text mining using the following methods: Exploratory analysis of text data and Classification Models. The first method analyses the reviews where it impacts the customer opinion recommend the product. The model is created based on the reviews used for predicting positive or negative opinions. The proposed work mine the text recommending a product based on customer opinion. The rest of the paper is organized as follows: Section 2 presents a literature review, limitations of the existing works, section 3 discusses the proposed approach with various stages, section 4 presents the experimental results and discussion, and section 5 concludes the proposed work.
Several social media platforms such as Twitter, Instagram, Facebook, and WhatsApp have ruled the communication world. Hence, it is understandable that the data that resides across these social media provide highly significant information regarding the people’s perception, sentiment, and mood over any products, shops, innovative ideas, and policies. Several works have been carried out to analyze the Twitter contents and the Twitter data for cloth products. An ensemble classifier is proposed in [4], where it analyzed the Twitter data and provided insightful information regarding the twitter contents. Convolution Neural Network (CNN) based architecture has been implemented in [5] to analyze the Twitter data and extract its sentiments. This approach yielded a high degree of accuracy in classifying Twitter data. A metaheuristic method that uses K means and cuckoo search to perform useful sentimental analysis over Twitter data is proposed [6]. A deep learning-based sentiment analysis model to process Twitter data and extract the sentiments in [7]. The classifier used to develop this model as Convolution Neural Network (CNN) analyzed the Twitter data and predicted the user behavioral information.
Processing plays a significant role before enhancing the effectiveness of sensory analysis. An exhaustive study of various preprocessing techniques has been performed in [8] that have been used to perform preprocessing on Twitter data. A domain transferable sentiment analysis for the Twitter-specific lexicon analysis method is implemented and evaluated [9]. Authors of [10] have proposed a semantic sentiment representation of words called SentiCircle that captured the contextual semantics of words from their co-occurrences. By comparing the methodology discussed in [11], authors in [12] developed a unique preprocessing model that binds the slang words associated with the co-existing words for sentiment translation over the slang words. A multi-level sentiment analysis combined with the neural network is proposed in [13] to analyze Twitter data. An ontological derived model for sentiment analysis is implemented in [14] to analyze Twitter data. This literature survey makes it easy to understand that Twitter data contents provide useful insights about any topic under discussion and convey people’s opinions.
The data residing in social media such as Twitter and WhatsApp are highly unstructured and unconventional. Here, the people’s comments, discussions, and moods are not efficiently grasped and computed by the existing methods. In this context, the significance of the NLP in structuring these highly complex unstructured data is underlined. It is a significant factor that reduces sentimental analysis systems’ performance. Another essential aspect is a quick search solution to spot the vital words covering people’s moods and sentiment over Twitter data.
Hence, human sentiments and emotions are highly fluctuated and cannot be fully captured with the help of a simple binary Support Vector Machine. Accordingly, this proposed approach is motivated by using the Multiclass Support Vector Machine classifier (MSVM) to capture and classify different sentiments and emotions based on Twitter tweets. If the quantity of sentiments increases, then the number of categories to be used for classification also increases and this, in turn, increases the complexity of the sentimental analysis model. In addition, it ensures that classification accuracy does not take a hit as the number of classes increases. It is also imperative that the searching speed has a pivotal role in determining the overall efficiency of the opinion mining system. A Simulated Annealing strategy has been used to enhance the search method to select the best words in the text that depict people’s sentiment. Thus, the proposed work is a hybrid approach that uses both MSVM and Simulated Annealing strategy in sync to reap the benefits of multiclass analysis and faster-searching solutions. MSVM is one of the popular machine learning algorithms which provides multi classes based classified data.
This work is aimed to develop a hybrid machine learning model that uses the MSVM classifier to capture and classify the different sentiments by analyzing the Twitter data. This approach is tied up with the concept of Simulated Annealing to enhance the process of classification performance of the overall system without compromising the classification accuracy. The proposed SA-MSVM comprises six stages: input data, preprocessing, creating DTM and TDM, exploring the text analysis process, learning, and feature extraction. Classifying the data by MSVM is illustrated in Fig. 1.
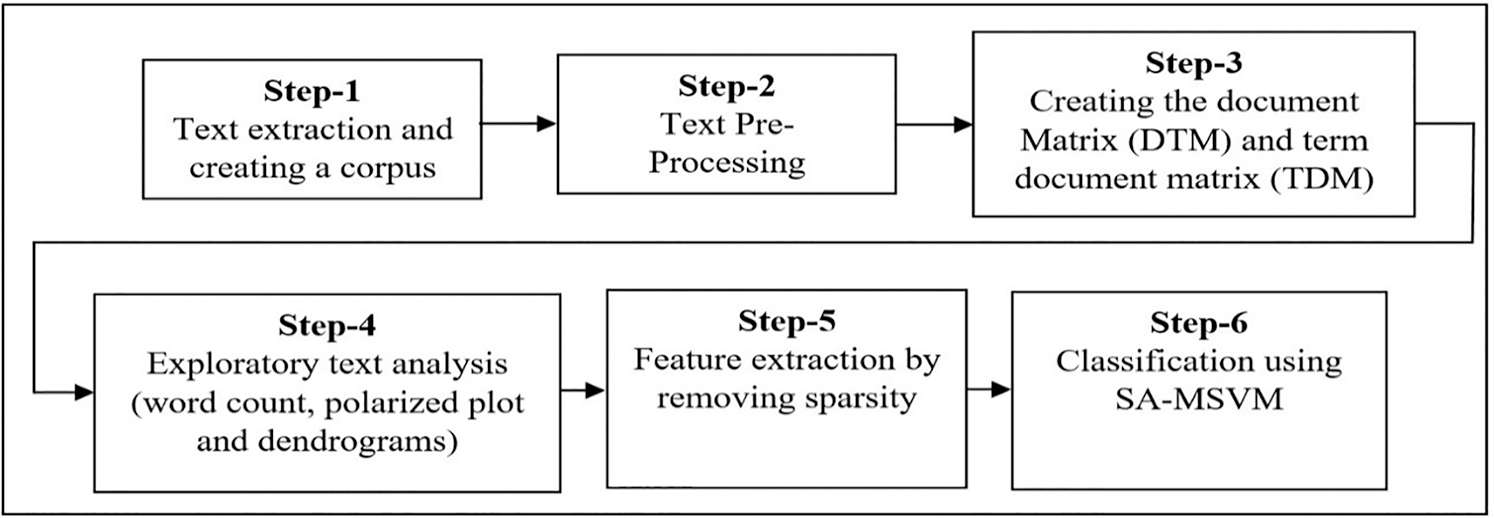
Figure 1: Overall flow of SA-MSVM
Stage-1
In the first stage, a corpus is created by text extraction. Initially, the packages required are loaded in the R-environment with working directories and the CSV files. The customer reviews of various products are stored in the variable Review-Text. Using the term “matrix package,” the corpus is created by passing a source object (“Vector Source”) to the corpus method, and then the Review-Text is transformed into a corpus.
Stage-2
Text Pre-processing is a method of converting the text to a data frame using the “bag-of-words” approach. They are represented as Document Term Matrix (DTM). Then the DTM is cleaned into relevant words. The most common preprocessing steps are as follows:
• If there are two exact words with uppercase and lowercase letters (pink and Pink), they will be converted to lowercase (Pink).
• They are removing punctuation.
• They are removing stop words.
The stemming process eliminates the lemma’s existing affixes, suffixes, and prefixes. Here the SNOWBALLS package is used for document stemming. For instance, the words “processed,” “Processing,” and “processor” are identified and reduced to “process” by the stemming process. It is ensured that all root words are available in the DTM, and TDM is also in the document. Now the cleaned text corpus with the core words. Then it calculates the word frequency to do mining. From Fig. 2 below, it is identified that the words “love,” “fit,” “size” are some of the words frequently used in the review text. For example, some of the words like “love,” “fit,” and “size” represent the positive comments about the clothes the customer experienced. Based on their experience, positive comments are posted on the social website. The new customer looks into the number of positive comments. They will buy clothes. It is called recommending the product. Any business executed based on customer comments is called a recommendation system.
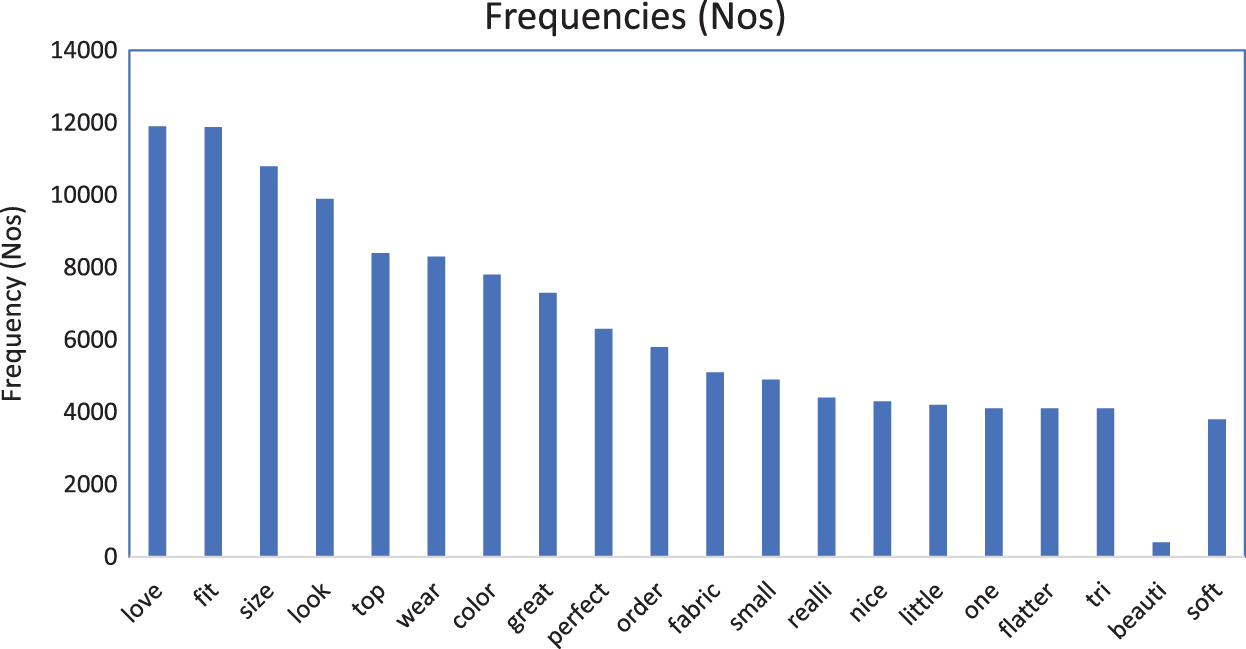
Figure 2: Word frequency in the corpus
Stage-3:In stage-3, the frequency of positive and negative words is calculated while preprocessing. It helps to avoid duplicates or redundancy of data. During, the DTM & TDM are created from the preprocessed corpus. DTM is a data matrix that portrays the frequently used words available in the documents. The TDM is a transpose matrix of DTM used for language analysis. The DTM/TDM is changed into a simple matrix for analyzing the information. It is also used to visualize the text.
Stage-4:Analysing the dataset starts with exploring the texts in the corpus. In this stage, the exploratory text analytical method is applied. The customer comments or opinion has a more significant number of words that explain their experience on the clothes, service, cost, delivery, and other information positively related to the clothing e-commerce business. The input can also be a set of the color palette to represent the difference between the more and lesser frequent words.
One of these proposed work’s main objectives is to identify the keyword differences between the recommended and non-recommended products. On this basis, 2-corpuses are created for two different recommendations, such as “yes” or “no.” This preprocessing method is applied iteratively to identify the differences between the corpora. Based on the positive comments, the total customer responses are analyzed, and the frequency of observations is calculated. The frequency of words, which is recommending and non-recommending comment words, is counted from the experiment, shown in Fig. 3.
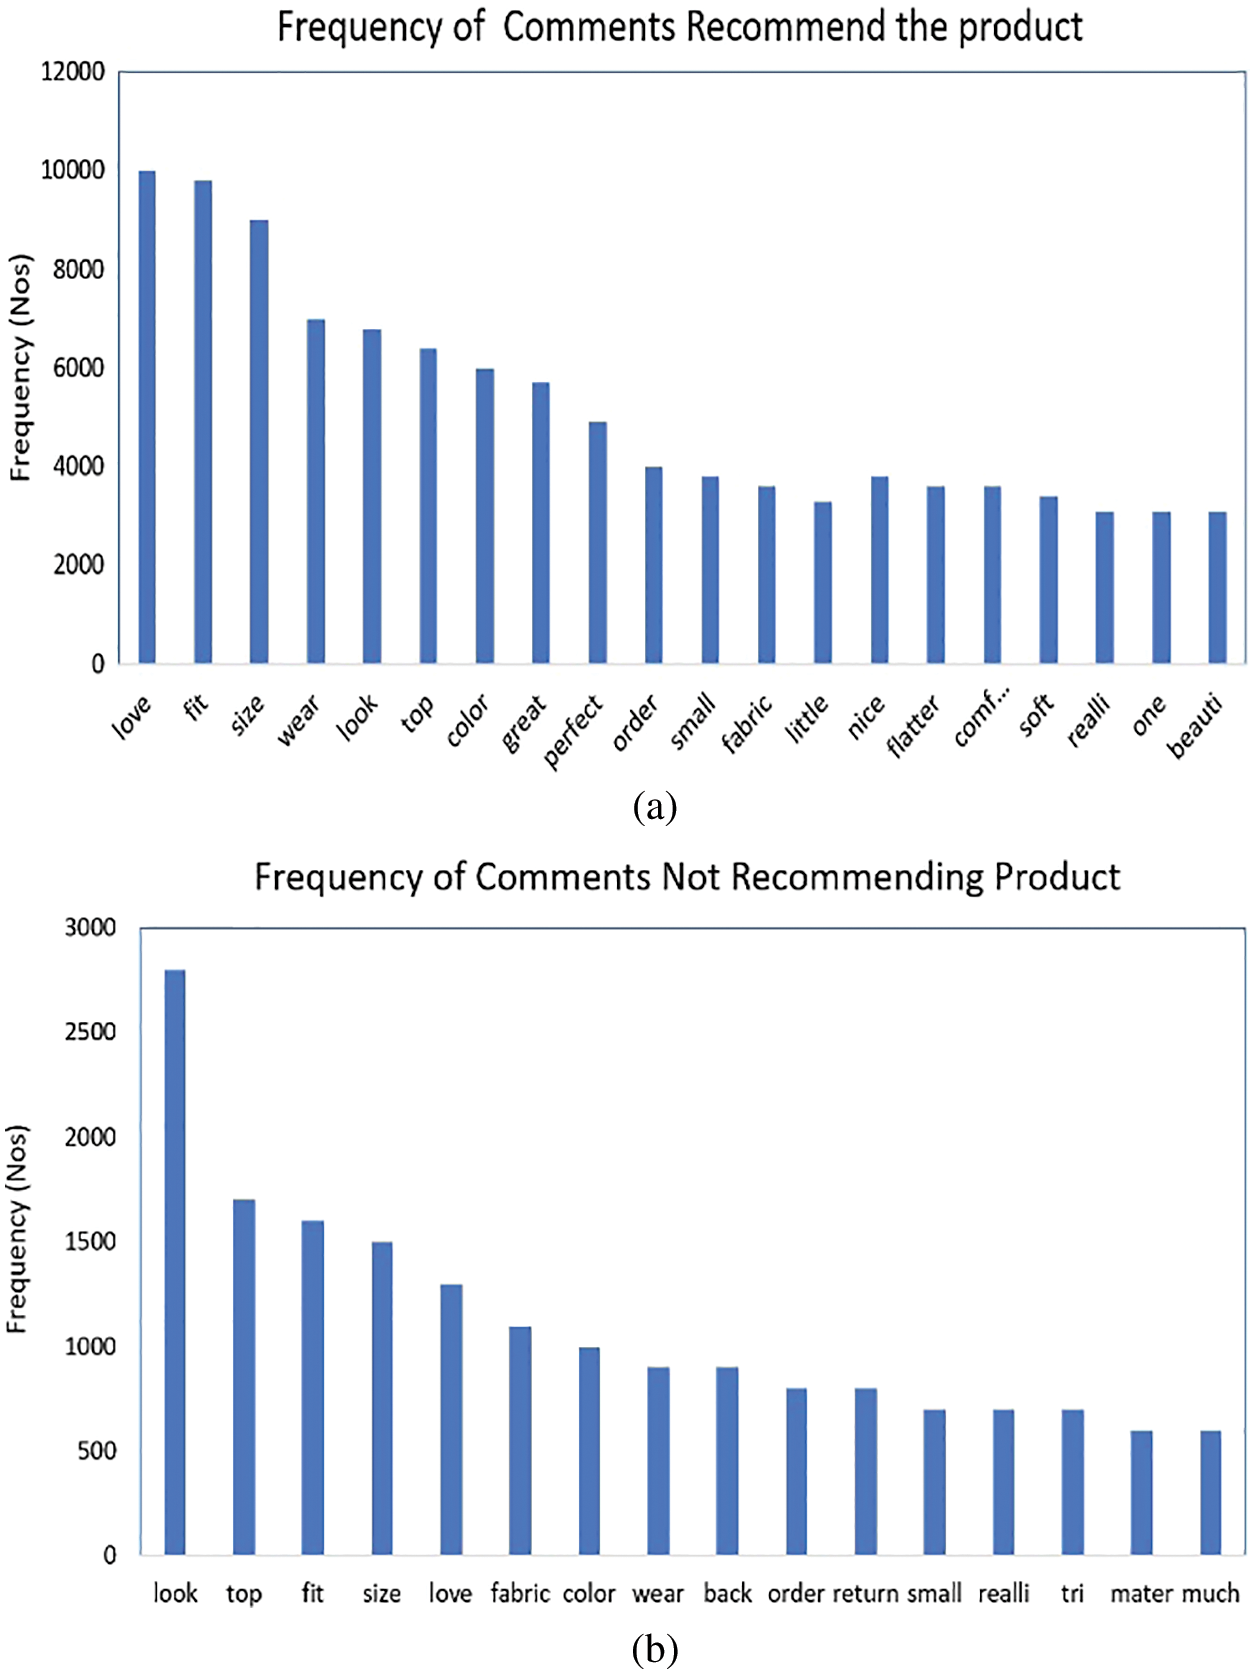
Figure 3: (a) Frequently used words for recommending a product, (b) Often used words for non-recommend a product
The frequency of words used in recommending and non-recommending of any products are illustrated in Figs. 3a and 3b and showed that more than 80% of the customer comments are recommended for online cloth purchase, and the remaining less than 20% of the customer commends not recommending for online cloth purchase.
Based on the corpora, yes and no, the entire dataset is clustered, then the nonclustered words (different clustered words) are identified quickly. This clustering process is very much helpful to classify the recommended and non-recommended products efficiently. For instance, If a customer’s opinion is “unhappy,” it is shown that the customer dislikes the product in terms of fabric, cost, quality, and product delivery. Thus, any e-commerce products need to analyze the same factors. A PLOTRIX package is loaded to identify the difference in frequencies of common words in which a matrix is created using a subset of common words from both classes. This matrix is then added with a column for each word’s absolute difference, and the plot is made.
Here the proportion of Yes to No is not balanced in the given dataset. Most people (82%) have recommended the product. So, the absolute percentage between the 2-groups is more useful in such an imbalanced dataset. Clustering on the text is a dimensionality reduction used to group the words based on the frequency distance. It is calculated using dendrograms and shows how the words are grouped, and the cluster indicates the set of frequently used words. The correlation between the two words in a DTM or TDM is calculated using word association to obtain the frequently used words. This example analyzes the correlation between “fit” and the different words. The association between the standard terms and “fit” is obtained and verified. The correlation is that the number of “fit” associated with the other words increases drastically from 0.05% to 0.20%. It is also obtained both the positive and negative aspects of the products. Here the word “fit” has a high association with the words “perfect” and “size.” Also, it signifies the optimistic aspect of the product. The word associated with “loose” represents the product’s negative aspects. So far, we have analyzed unigram based, which are based on single words. N-grams is a method in text mining based on the analysis of multiple words where N is the number of words. Now bigram and trigram are created to perform some exploratory research as shown in Fig. 4.

Figure 4: Clustering based on “Yes” and “No”
The N-grams also include the analysis of unigrams, i.e., by exploring bi-grams and trigrams, the unigrams are analyzed. The best bi-gram and trigrams are given in the following Tabs. 1 and 2, respectively. Finally, it is verified how the N-grams vary for the recommended and not recommended products.


Stage-5:The feature extraction by removing sparsity is carried out in this stage. Feature learning and extraction are referred to from [15]. In DTM, there will be several columns representing unigrams, bigram, and trigram. The number of columns will be equal to the unique word count in the corpus. The column count will be zero if there are non-frequent terms. The columns with zero values are known as sparsity. Based on the customer review, specific classification algorithms predict customer recommended products based on the predictor variable (review text variable).
Tokenisation is replacing the text with distinct pieces of code using bag-of-words. After completing all the preprocessing procedures, tokenization is done. After that, a data frame is constructed with rows and columns. Each row represents a document, and the column represents the distinct tokens. Every cell in the frame gives the token count in each document. The tokens undergo preprocessing steps, are converted to a document frequency matric, and treated for sparsity. Finally, the classification model is created.
Stage 6: The final stage of the proposed model focuses on building the classification models. The document frequency matrix is generated after the preprocessing techniques are used for classification. The following section describes the full functionality of the MSVM process.
3.2 Multiclass Support Vector Machine
One of the new classification algorithms extended from the available classification algorithm is the Multiclass Support Vector Machine (MSVM) algorithm. Compared with SVM, which uses a more significant number of optimal hyperplanes to obtain the classification. Here, the class of the data using VVD (Vector Value Decision) is decided by MSVM. The hyperplane separates the classes in the feature space made by kernels. MSVM has generated more classes under various feature values compared with the SVM.
MSVM has more advantages than SVM. MSVM reduces computational complexity, the feature space is divided, and the unclassified regions are eliminated. The structure of the MSVM is illustrated in Fig. 5. For searching the best candidates in the solution space, the proposed work uses the Simulated Annealing (SA) method to explore the best candidates and candidate solutions speedily and accurately. The input dataset X is clustered using the ensemble method, and the score of each cluster is calculated . The idea of MSVM proposed is referred from [16], and the score of each group is calculated. After calculating the scores, the best score-based cluster data is obtained speedily using the SA algorithm. The local and global searching method is integrated into MSVM to get the high-scored data.

Figure 5: Multiclass support vector machine
Hence the proposed SA-MSVM reduces the computational complexity, increases the classification process’s speed, and less memory utilization. It is a great advantage provided by the SA-MSVM approach in analyzing the customer reviews in the online dataset. The proposed SA-MSVM algorithm is implemented and experimented on two different customer review datasets, and the performance is evaluated.
4 Experimental Results and Discussion
The experiment is conducted on Intel Core-i7-7th Gen-7700HQ CPU @ 2.80 GHz, 1-TB HDD, and 8 GB RAM laptop. The proposed SA-MSVM algorithm is implemented in Python 3.5, and the performance is verified in various aspects. Amazon.com and Clothing E-Commerce is the two different datasets used in the experiment. The algorithm given in Figs. 6 and 7 is programmed in Python software and experimented with the given input dataset. During the execution, the performance of the proposed approach is verified in various aspects. The proposed approach’s performance is evaluated by testing the code over two different datasets described below. MSVM is one of the extended classification algorithms obtained from the traditional SVM algorithm, whereas SVM is a machine learning algorithm used to classify linear and nonlinear data. SVM finds a hyperplane with the training data during the classification process and considers it a decision surface. It divides the positive and negative data at a maximum rate. A linear hyperplane is used to solve high-dimensional nonlinear data. In this case, the kernel used for nonlinear data is the Gaussian Radial Basis Function. In the proposed work, MSVM is used to classify “Positive,” “Negative,” and “Neutral” classes [17].

Figure 6: SA-MSVM algorithm

Figure 7: Simulated annealing algorithm
First, the proposed SA-MSVM method has experimented with the product-review data collected from a famous website Amazon.com [18]. The size of the data collected from the website is 3.5 million reviews. Each review has several features: rating, product-ID, reviewer-ID, the study’s title, time, comment, and helpfulness. A sample data is given in Tab. 3, showing the rating value is 5. A summary of review ratings is figured out from the entire dataset and shown in Fig. 8 to understand the number of reviews given by the customer as 5-stars to 1-star. Fig. 8 is explained that the highest review rating is more than 22%, which is increased than the other ratings (from 4 s to 1 s). But 22% is less than the number of products and daily business count calculated in amazon.com. Online customer or product review data have more noises like HTML tags, hyperlinks, quotes, informal texts, etc. Some of these words are not having any meaning while processing the data. Since the above-said kind of words makes it more complicated in data analytics, it is necessary to eliminate those words to make the process simple, easy, fast, and efficient. Also, these kinds of words and unwanted delimiters increase the dimensionality problem. For this issue, preprocessing is applied to the raw data with NLP processes.


Figure 8: Summary of review comments
The total number of customer review comments available on the Amazon.com website is 3.5 million. The customer reviews are a professional opinion about products. The review data is converted into a multi-dimensional vector. 80% of the information is used for the training process, and 20% of the data is used for testing. The entire process is repeated a more significant number of times, like 15 to 20 epochs. An N-fold cross-validation method is used for evaluating the performance of the MSVM algorithm and evaluated by calculating precision, recall, and classification accuracy. Performance evaluation is obtained by executing the experiment repeatedly for a more significant number of times, and the performance factors such as precision, recall, and accuracy are calculated.a The comparison of performance factor calculation at each epoch is given in Fig. 9. From the result, it is identified that the overall accuracy is achieved about 85%.

Figure 9: Performance comparison on Amazon.com dataset
The performance of the proposed approach is evaluated by experimenting with the proposed method on another dataset. The second dataset used in the experiment is the Women’s clothing E-Commerce dataset, which is publicly available in (“https://www.kaggle.com/nicapotato/womens-ecommerce-clothing-reviews/home”), where the clothing company revolving based on the customer reviews.
For instance, a dataset is taken from a Women’s Clothing E-Commerce site, which is included 23486 rows and ten features, where each row represents a customer review and the variables.
The ten features are as follows: Clothing ID, Age, Title, Review, Rating, Recommended IND, Positive feedback count, Division name, Department name, and Class name. Clothing ID is the categorical integer variable, which is referred to the specific piece that has been reviewed. Age is the positive integer, title and review text are the string variables. Rating is the positive ordinal integer variable for the product score. Recommended IND is the binary variable stating where the customer recommends the product where “1” is recommended, “0” is not recommended. Positive Feedback Count is the Positive Integer representing the number of other customers who found the review positive. Division Name is the categorical name of the product. Department and Class Name are the cluster name of the product department and class name, respectively.
The set of frequently used words on the social website is calculated by the statistical method. It is obtained by analyzing and learning the data thoroughly. Fig. 10 shows the words and their frequency values. It shows that the words “love,” “fit,” “size,” and “look” are the high-frequency words, and “soft” “beautiful” are the words that have less frequency value. It tries to identify how many words are used to recommend a product and not from the frequency. The review classes are predicted using SA-MSVM, and the result is depicted in Figs. 11 and 12.

Figure 10: Most frequent words

Figure 11: Frequency words are comments – recommending a product

Figure 12: Frequency words are comments – not recommending a product
Fig. 11 shows the frequently used words which recommend a product online. Fig. 12 shows the number of often-used words that are not recommending a product online. From this word frequency and their recommendation, it is straightforward and fast to classify the guidance class, positive, negative, and neutral. Several supervised and unsupervised techniques could be performed to obtain ideas on customer preferences based on these variables. But it is limited to using only text mining to understand and analyze differences between customers who recommend a product and those who don’t, rather than predicting the customer action based on the review. There are two broad categories in text mining approaches: semantic parsing and Bag of words. Semantic parsing is the task of converting a natural language to a machine-understandable representation of its meaning (word sequence, word usage, and hierarchical word structure). In the Bag-of-words model, a text is represented as the Bag of its words, disregarding grammar and even word order but keeping multiplicity.
In dataset 2, it is evaluated by predicting the density of the data regarding customer age. It helps the business vendor provide the stock according to the customer’s age to increase online sales. The customer’s age distribution is initially obtained from the dataset, as shown in Tab. 4. From Tab. 4, it is identified that the age highest number of customers belongs from 25 years to 45 years. But the customer who starts from 17 years to 75 years is buying clothes in E-commerce. Very few customers below 20 years and above 75 years are involving in buying clothes in E-Commerce—any E-Commerce business depending on the highest amount of positive feedback given by the customers. A new customer selects a cloth based on the highest positive feedback given by the old customer. So, the number of positive comments is calculated in the experiment, and the result is shown in Tab. 4. From the overall feedback, 20% of the customer has given positive feedbacks.

From the feedback, the positive reviews are counted to organize the sales. Next, from the overall reviews, recommendations, and sentiment, classifications are obtained using SA-MSVM. Both classification results are shown in Fig. 13. Fig. 13 shows that the frequency distribution of both classes is imbalanced because all the positive, negative, and neutral classes are mixed in the classification. A statistical report of classification on recommendation system with the highest score (high-frequency rate is called highest score) is shown in Fig. 14. Fig. 14 delivers the performance of the category on dataset-2.

Figure 13: Recommended vs. sentiment reviews

Figure 14: Recommended vs. non-recommended
The hyperparameters are tuned at each round of execution for performance evaluation. Some of the essential hyperparameters are epochs (50 to 100 rounds), learning rate (0.001 to 0.05), data size at each round (500 to 1500), and dropout rate (0.05%). Finally, the overall statistical report on review classification using SA-MSVM is calculated and shown in Tabs. 5 and 6.


Tab. 7 is explained the classification accuracy obtained from the experiment. The prediction status is weak for negative and neutral comments. It is also identified that the proposed SA-MSVM is given high performance in predicting recommendation, opinion, and sentiment classes. It is because of the imbalanced dataset. SA-MSVM provides a better classification result than the other models by verifying the prediction performance.

The accuracy obtained using various earlier methods on different datasets is compared. From the comparison, it is identified that the proposed SA-MSVM is proved better than the other approaches. Due to tuning hyperparameter, the SA-MSVM provides the best prediction result in Tab. 8. Fewer number hyperparameters are used in the experiment to avoid more expensive. Furthermore, the statistical and forecast analysis on various datasets is deemed satisfactory.
This proposed SA-MSVM (Simulated Annealing – Multiclass Support Vector Machine) algorithm designs and implements a novel hybrid metaheuristic algorithm for sentiment analysis. SA-MSVM is a hybrid heuristic approach for feature selection. Classifying text-based sentimental words extended with the NLP process is applied to tweets extracted from the Twitter dataset for cloth products. A simulated annealing algorithm searches for relevant features and selects and identifies sentimental terms that customers criticize. SA-MSVM is implemented, experimented with MATLAB, and the results are verified. The results concluded that SA-MSVM has more potential in sentiment analysis and classification than the existing SVM approach. SA-MSVM has obtained 96.34% accuracy in classifying the product review compared with the existing systems.
Funding Statement: The authors received no specific funding for this study.
Conflicts of Interest: The authors declare that they have no conflicts of interest to report regarding the present study.
1. T. Chen, R. Xu and Y. He, “Learning user and product distributed representations using a sequence model for sentiment analysis,” IEEE Computational Intelligence Magazine, vol. 811, no. 3, pp. 34–44, 2016. [Google Scholar]
2. T. Ramzan Talib, K. Muhammad and A. Shaeela, “Text mining: Techniques, applications, and issues,” International Journal of Advanced Computer Science and Applications, vol. 7, no. 11, pp. 45–52, 2016. [Google Scholar]
3. D. Trisha, “Effectiveness of social media as a communication tool and its potential for technology-enabled connections: A micro-level study,” International Journal of Scientific and Research Publications, vol. 2, no. 5, pp. 782–792, 2012. [Google Scholar]
4. A. Ankit and S. Nabizath, “An ensemble classification system for twitter sentiment analysis,” Procedia Computer Science, vol. 132, no. 5, pp. 937–946, 2018. [Google Scholar]
5. A. Fazeel, A. Muhammad and Y. Muhammad, “Sentiment analysis through recurrent variants on convolutional neural network of Twitter,” Future Generation Computer Systems, vol. 95, no. 3, pp. 292–308, 2019. [Google Scholar]
6. C. Avinash, S. Dharmveer and S. Mukesh, “Twitter sentiment analysis using hybrid cuckoo search method,” Information Processing & Management, vol. 53, no. 4, pp. 764–779, 2017. [Google Scholar]
7. S. Ahmed Sulaiman and M. Alharbi, “Twitter sentiment analysis with a deep neural network: An enhanced approach using user behavioral information,” Cognitive Systems Research, vol. 54, no. 8, pp. 50–61, 2019. [Google Scholar]
8. S. Symeon, E. Dimitrios and A. Avi, “A comparative evaluation of preprocessing techniques and their interactions for Twitter sentiment analysis,” Expert Systems with Applications, vol. 110, no. 9, pp. 298–310, 2018. [Google Scholar]
9. M. Ghiassi and S. Lee, “A transferable domain lexicon set for Twitter sentiment analysis using a supervised machine learning approach,” Expert Systems with Applications, vol. 106, no. 9, pp. 197–216, 2018. [Google Scholar]
10. S. Hassan, H. Yulan and F. Miriam, “Contextual semantics for Twitter sentiment analysis,” Information Processing & Management, vol. 52, no. 1, pp. 5–19, 2016. [Google Scholar]
11. S. Tajinder and K. Madhu Kumari, “Role of text pre-processing in twitter sentiment analysis,” Procedia Computer Science, vol. 89, no. 3, pp. 549–554, 2016. [Google Scholar]
12. X. Shufeng, L. Hailian and Z. Weiting Zhao, “Towards Twitter sentiment classification by multi-level sentiment-enriched word embeddings,” Neurocomputing, vol. 275, no. 12, pp. 2459–2466, 2018. [Google Scholar]
13. K. Efstratios, B. Christos and D. Theologos, “Ontology-based sentiment analysis of Twitter posts,” Expert Systems with Applications, vol. 40, no. 10, pp. 4065–4074, 2013. [Google Scholar]
14. A. Jour, K. Loai and S. Waleed, “Selection of significant clusters of genes based on ensemble clustering and recursive cluster elimination (RCE),” Journal of Proteomics and Bioinformatics, vol. 10, no. 5, pp. 186–192, 2017. [Google Scholar]
15. B. Nick, “Women’s e-comerce clothing reviews,” 2018. [Online]. Available: https://www.kaggle.com/nicapotato/womens-ecommerce-clothing-reviews. [Google Scholar]
16. X. Fangand and J. Zhan, “Sentiment analysis using product review data,” Journal of Big Data, vol. 2, no. 5, pp. 5–13, 2015. [Google Scholar]
17. J. A. Kumar and S. Abirami, “An experimental study of feature extraction techniques in opinion mining,” International Journal on Soft Computing, Artificial Intelligence, and Applications (IJSCAI), vol. 4, no. 1, pp. 15–21, 2015. [Google Scholar]
18. X. Ouyang, P. Zhou and C. H. Li, “Sentiment analysis using a convolutional neural network,” in Proc. of IEEE Int. Conf. on Computer and Information Technology, Liverpool, UK, pp. 2359–2364, 2015. [Google Scholar]
19. Z. Yang, D. Zihang and Y. Yiming Yang, “XLNet: Generalized autoregressive pretraining for language understanding,” Computation and Language, vol. 3, no. 1, pp. 752–760, 2019. [Google Scholar]
20. J. Howard and R. Sebastian Ruder, “Universal language model fine-tuning for text classification,” Computation and Language, vol. 5, no. 1, pp. 526–532, 2018. [Google Scholar]
21. E. Peters, M. Neumann and I. Mohit, “Deep contextualized word representations,” Computation and Language, vol. 10, no. 1, pp. 962–971, 2018. [Google Scholar]
 | This work is licensed under a Creative Commons Attribution 4.0 International License, which permits unrestricted use, distribution, and reproduction in any medium, provided the original work is properly cited. |