DOI:10.32604/EE.2020.013585
| Energy Engineering DOI:10.32604/EE.2020.013585 | |
| Article |
Off-Design Performance of Gas Turbine Power Units with Alternative Load-Control Strategies
1Guangzhou Zhujiang LNG Power Generation Co., Ltd., Guangzhou, 511457, China
2School of Electric Power, South China University of Technology, Guangzhou, 510640, China
*Corresponding Author: Cheng Yang. Email: CHYANG1@scut.edu.cn
Received: 12 August 2020; Accepted: 24 September 2020
Abstract: Gas turbine power units, as an effective way to cope with the severe challenge of renewable energy accommodation in power grids, arouse the interest of power enterprises in the deep peak-load regulation performance. Two common alternative load-control strategies including constant turbine inlet temperature (TIT) and constant turbine exhaust temperature (TET) regulations were taken into consideration. To comparatively investigate the part-load performance under these strategies, both mathematical and physical models were set up successively to serve as a validation and complementary to each other. For the mathematical model of compressor with inlet guide vane (IGV), combustor and turbine, stage-stacking method based on blade average geometric parameter, energy conservation and turbine stage model were adopted respectively. For the physical model, design and off-design analysis were carried out based on GT PRO and THERMOFLEX respectively. The simulation result of mathematical model validated the reliability of the physical model. Based on this, the influence of ambient temperature and different load-regulating strategies on the off-design performance of gas turbine power units was studied in THERMOFLEX. The results in the case of a PG 9351FA gas turbine show that the ambient temperature has a great impact on system performance, i.e., every 5°C increase in the ambient temperature produces a reduction of 3.7% in the relative full-load output and 1.1% in the relative efficiency respectively; when the gas turbine operates under constant TIT strategy, TET starts to rise till it reaches the maximum allowable value with the load rate decreasing, and IGV keeps at the minimum angle with both TIT and TET decreasing when the load rate is lower than 65%; when the gas turbine operates under constant TET strategy, TIT drops slightly at load rate of above 60% while both TIT and TET evidently decrease below 60% load rate operating along the constant corrected speed line at the minimum allowable IGV opening; gas turbine efficiency is greatly affected by load rate and the performance degradation is more obvious especially in lower load rate regions; constant TET strategy is superior in the operating efficiency to constant TIT strategy under part-load conditions.
Keywords: Gas turbine; part load performance; operating strategy; comparative simulation
Nomenclature
| A: | area, m2 |
| ac: | coefficient of pressure ratio |
| at: | distribution parameter for turbine stage expansion ratio |
| c: | absolute velocity, m/s |
| Ca: | axial velocity, m/s |
| Cp: | specific heat at constant pressure, kJ/(kg∙K) |
| G: | mass flow rate, kg/s |
| i: | specific enthalpy, kJ/kg |
| k: | specific heat ratio |
| LHV: | lower heating value, kJ/kg |
| M: | gas molar mass, kg/mol |
| Ma: | Mach number |
| N: | shaft speed of turbine, r/min |
| n: | total number of compressor or turbine stages |
| p: | pressure, kPa |
| PF: | pattern factor |
| PR: | turbine expansion ratio |
| R: | gas constant, J/(mol∙K) |
| rcl: | mass flow ratio between extracted cooling air and flue gas |
| St: | gas flow Stanton number |
| T: | temperature, K |
| u: | blade velocity at mean radius, m/s |
| W: | work, kW |
| w: | relative velocity, m/s |
| X: | mole fraction of each gas component |
| y: | ratio between flue gas velocity and cooling air component parallel to it |
Greek Symbols
| α: | absolute flow angle |
| β: | relative flow angle |
| Δ: | parameter difference |
| ε: | heat exchange coefficient of coolant path |
| Φ: | cooling effectiveness |
| ϕ: | flow coefficient |
| η: | efficiency |
| π: | compressor pressure ratio |
| ρa: | air density, kg/m3 |
| ψ: | pressure coefficient |
Suffix
| a: | air |
| ast: | reduced parameters of air at ISO condition |
| ave: | average |
| b: | blade |
| c: | compressor |
| cl: | coolant |
| comb: | combustor |
| f: | fuel |
| g: | flue gas |
| gen: | generator |
| gt: | gas turbine |
| i, k: | index of compressor stage |
| in: | inlet of each turbine stage |
| j: | index of turbine stage |
| m: | mechanical |
| max: | maximum |
| out: | outlet of each turbine stage |
| prod: | generated gas |
| s: | isentropic |
| st: | stage |
| t: | turbine |
| ’: | change of state |
| 0: | parameters at design condition |
| 1: | inlet of each compressor rotor blade |
| 2: | outlet of each compressor rotor blade |
Acronyms
| GTCC: | gas turbine combined cycle |
| IGV: | inlet guide vane |
| ISO: | International Standardization Organization |
| TET: | turbine exhaust temperature |
| TIT: | turbine inlet temperature |
| RH: | relative humidity |
 | This work is licensed under a Creative Commons Attribution 4.0 International License, which permits unrestricted use, distribution, and reproduction in any medium, provided the original work is properly cited. |
Over the past few years, the quest for sustainable energy has greatly increased all over the world with the global energy reserves depleting at an alarming rate [1,2]; meanwhile, energy transitions from fossil fuels to renewable energies have been taking place in many countries all over the world [3]. 72% of the total global power capacity increment was credited with renewables in the year 2019 alone [4]. However, there remain some regions faced with the challenge of over-increasing penetration. China is one of the most prominent representatives with the largest renewable power generation and considerable underutilization of it. Renewable power generation reached up to 634.2 TWh in 2018, with an increase of 1.46 percents compared with that in 2017 [5]. As the latest statistics from China National Energy Administration shows, its wind power accounted for 5.5 percents and photovoltaic power saw a year-on-year rise of 26.3 percents by the end of 2019. Nonetheless, the imbalance of accommodation is far-reaching in some areas. For example, the excessive wind and photovoltaic power unable to be accommodated was as high as 81% and 87% of the total waste respectively in northwest China [6].
So far, China has taken some measures to address the large-scale penetration of renewable energy which include source-network-load-storage strategy and market coordination [7,8]. Relevant policies have been promulgated to optimize the electric power structure featured by more flexible power sources. Conventional nuclear and coal-fired power plants tend to be base load plants with long-time running, while gas turbine power plants are better designed for peak regulation for the traits of quick start-up and high-efficient operation under part-load conditions [9]. Besides, gas turbines regarded as an effective way to use both fossil and renewable fuels boost the development of sustainable energy [10,11]. Hence, gas turbine-based power plants can pave the way for better adapting to wind and photovoltaic power fluctuations and further promoting the accommodation of renewables. As such, more power enterprises arouse interest in the overall performance of gas turbines.
Gas turbines as a critical part of gas turbine combined cycle (GTCC) system often operate in an environment with the ambient temperature or pressure different from the International Standardization Organization (ISO) condition, which leads to thermal performance deviations from the design values. In consequence, much attention was paid to the off-design behaviour of gas turbines [12]. Yang et al. proposed a gas turbine-based multi generation system with compressor bypass extraction air energy storage and studied the performance with bypass extraction regulation, inlet guide vane (IGV) regulation and constant corrected speed regulation, finding that compressor bypass extraction helped gas turbine sets to broaden the operation range at constant exhaust temperature and it was an effective strategy to strengthen the flexibility of peak-shaving [13]. Yang et al. investigated the influence of different regulation strategies with both heat control and IGV control on GTCC performance using the commercial software Aspen and Matlab, finally proposing a method of improving part-load performance with a novel compressor inlet air heating process [14]. González-Díaz et al. investigated the impact of ambient parameters including temperature, pressure and relative humidity on GTCC with post-combustion CO2 capture which was simulated in ThermoflowTM. In order to make up for the output loss caused by the temperature rise, supplementary firing in the heat recovery steam generator was proposed [15]. Liu et al. presented a novel multivariable optimization strategy for GTCC under part-load operation with simulation modelled in the commercial simulator GateCycle and particle swarm optimization algorithm implemented in Matlab. This vigorous strategy turned out to guarantee the maximum combined cycle efficiency compared with the conventional fuel flow control and IGV control strategies [16]. Ravi Kumar et al. proposed a gas turbine system with an alternative regenerator configuration and spray cooler for intake air cooling. It turned out that spray cooler alone could improve the efficiency by 2.05% compared with the reference cycle, while it could be 13.25% by using alternative configuration and spray cooler [17]. Najjar et al. studied the influence of pressure ratio and turbine inlet temperature on specific thrust and fuel consumption; they determined the optimum running points at different operating conditions using energy and exergy analysis, which was practical for performance improvement [18].
In the studies so far, much attention has been drawn to the overall performance of gas turbine based combined systems, which regretfully made a brief modeling description of the gas turbines or simply built models in relevant commercial simulation software without clarifying the constraint conditions. These existing drawbacks make the precisely quantitative analysis of gas turbines challenging. What’s more, there is little literature analyzing and comparing the influence that both constant turbine inlet temperature (TIT) and constant turbine exhaust temperature (TET) control strategies will exercise on the performance of gas turbines at part-load conditions, whereas this is of great significance for the efficient and economical operation of power units as well as the further study of related systems based on gas turbines.
Therefore, in this study, a detailed mathematical procedure for the performance analysis of simple cycle gas turbines is presented, which involves in the elaborate modeling of compressor, combustion chamber and gas turbine. The work is carried out with the simulations both in Matlab and the thermal engineering software Thermoflow, which serve as a validation and complementary to each other. In the case of PG 9351FA type gas turbines, the effect of ambient temperature and two part-load regulation strategies on the overall thermal performance is theoretically analyzed. Potentially, the focus of the present study helps to shed some light on the intricate mathematical modeling and provide a more fundamental approach to performance prediction of gas turbines. Importantly, these results can provide a basis for system optimization. The novelty and innovations of this research are as follows:
•A detailed mathematical modeling of the gas turbine system is conducted, whose simulation result validates the model reliability of THERMOFLEX.
•Part-load off-design performance of the gas turbine system under constant TIT and TET strategies is analyzed and compared.
•Influence of ambient temperature and load rate on the efficiency under the two strategies is studied.
•Operating parameter optimization can prospectively be realized based on this work for gas turbine energy systems at deep peak-load regulation.
2 Typical Gas Turbine Power Plant
The gas turbine simple cycle is also known as Brayton cycle, which is a thermodynamic cycle with the system configuration demonstrated in Fig. 1. A typical gas turbine power plant is mainly comprised of three critical components which include a compressor, combustion chamber and gas turbine. The main working process can be described as follows: compressor takes in the ambient air continuously and the pressurized air from it enters the combustion chamber, where fuel such as natural gas is sprayed and burnt with air. The combustion gas with high temperature and high pressure expands in the turbine to generate power, approximately two thirds of which is used for driving compressor during the normal running. This system is featured by flexibility and stabilization which ensure a good maneuvering performance.
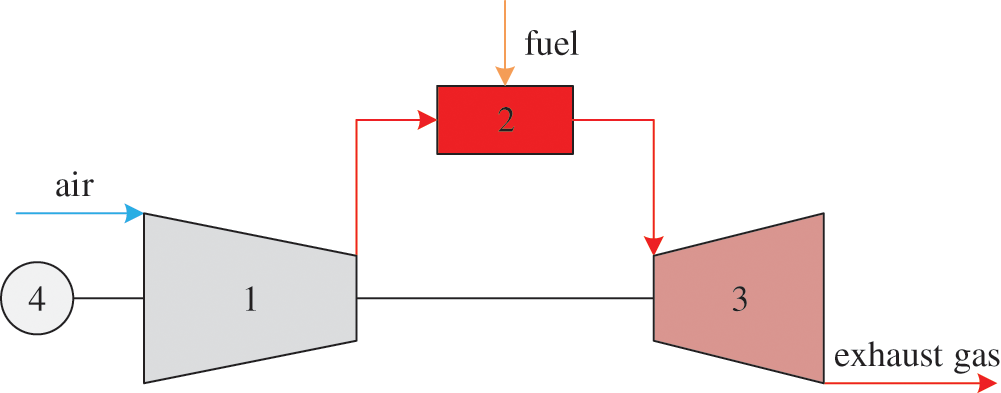
Figure 1: Schematic diagram for simple cycle gas turbine. (1) Air compressor. (2) Combustion chamber. (3) Turbine. (4) Generator
As a research case of this work, a PG 9351FA type gas turbine consists of an 18-stage axial flow compressor, a combustion chamber made up of 18 low NOx burners, a 3-stage axial turbine and other ancillary devices, among which the compressor is equipped with one stage of IGV. The main design parameters of PG 9351FA type gas turbines at ISO condition are listed in Tab. 1. The ISO ambient reference condition mainly refers to air at 15°C at sea level with 60% relative humidity.
Table 1: Design parameters for PG 9351FA type gas turbines

3 Mathematical Model for Gas Turbine Off-design Performance
The conventional research methods for axial multistage compressors under off-design conditions include numerical technique, approximate analytical technique and stage-stacking method [12,19–21]. The numerical integration has strict prerequisites that performance characteristics of each individual stage should be known in advance. For analytical method, it substantially simplifies the calculation while reduces the accuracy. One-dimensional stage-stacking method based on average blade diameter is adopted in this study to analyze the off-design performance of the compressor [12,21,22], which can effectively predict the detailed operating parameters including temperature, pressure, velocity, stage efficiency etc. of each stage and also the overall characteristics. Besides, it can also conveniently take the variable geometry structure into consideration.
Generalized stage characteristic curves for a multistage axial compressor are presented in Fig. 2. It is assumed to hold true for all stages. It reveals the typical relationship among some dimensionless parameters, including flow coefficient, pressure coefficient and stage efficiency. These stage characteristics underlie the overall compressor performance. Once the first stage inlet mass flow, air state parameters and rotation speed are given, pressure coefficient and stage efficiency can be obtained readily from the characteristic curves. Based on these, detailed stage outlet parameters can be deduced accordingly, which are also the inlet boundary parameters for the next stage. Likewise, this action is applied to the rest stages before the overall thermodynamic performance is figured out. The formulas involved in this work to make the performance prediction are described as follows.
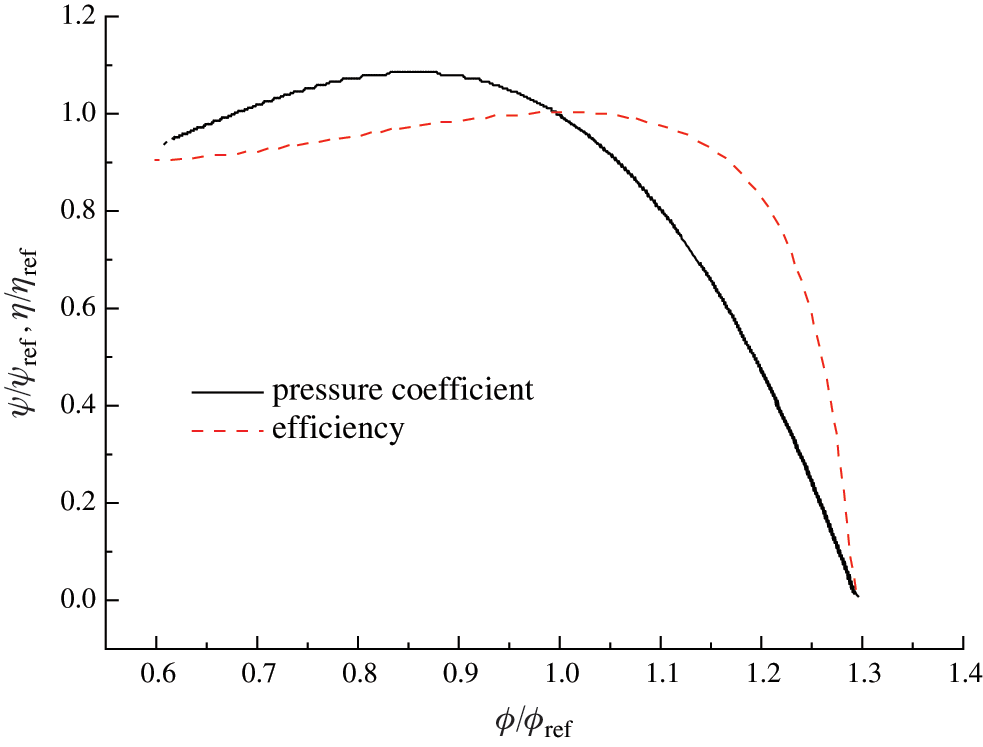
Figure 2: Generalized stage characteristic curves
Pressure ratio for each stage at design condition can be calculated as:
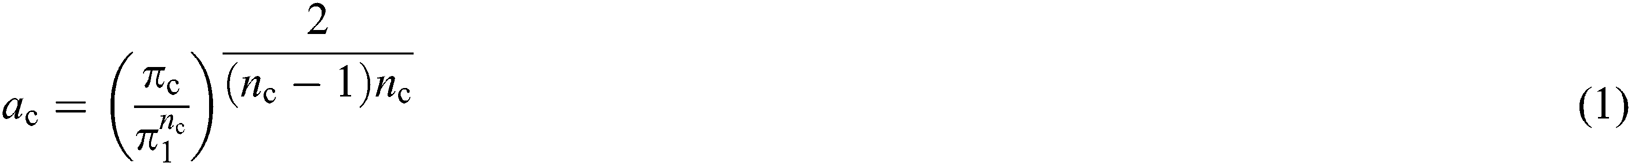

where, ac denotes the coefficient of pressure ratio; πc stands for the compressor total-to-total pressure ratio; π1 is the first stage pressure ratio which is determined by an equal enthalpy rise for each stage and nc means the total number of compressor stages. The subscript i represents the index of compressor stage.
Reduced mass flow rate and reduced peripheral blade velocity at the inlet of each stage are converted to those at ISO condition as Eqs. (3) and (4):


where, pa,i and Ta,i denote, respectively, air pressure [kPa] and Kelvin temperature [K] at the inlet to the ith stage; ua means rotor blade velocity at mean radius [m/s] and is given as 350; Ga,i represents the mass flow rate entering each stage [kg/s]; subscript st refers to reduced parameters at ISO condition.
Axial velocity for each stage is expressed as follows:
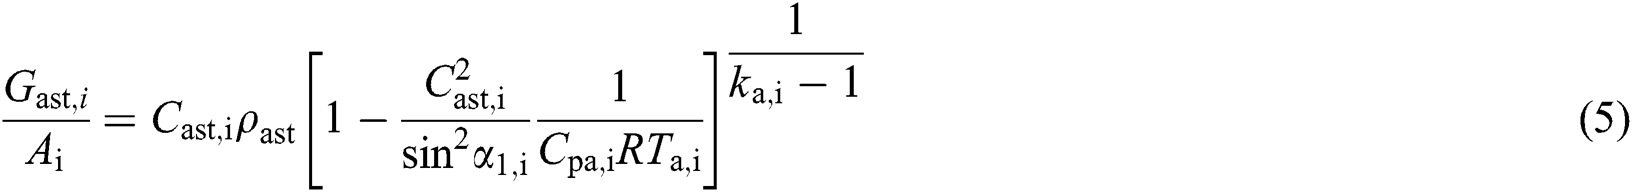
where, Cast,i refers to axial velocity at ISO condition [m/s]; Ai is the inlet flow path area of each stage [m2]; ρast is the density for air at ISO condition [kg/m3]; α1,i is the absolute flow angle at each rotor inlet calculation plane; R refers to gas constant [J/(mol∙K)], i.e., 8.3145; Cpa,i means the air specific heat at constant pressure at each stage inlet [kJ/(kg∙K)]; ka,i is air specific heat ratio.
Non-dimensional flow coefficient and pressure coefficient for each stage are defined as follows:
Flow coefficient at ISO condition ϕast:

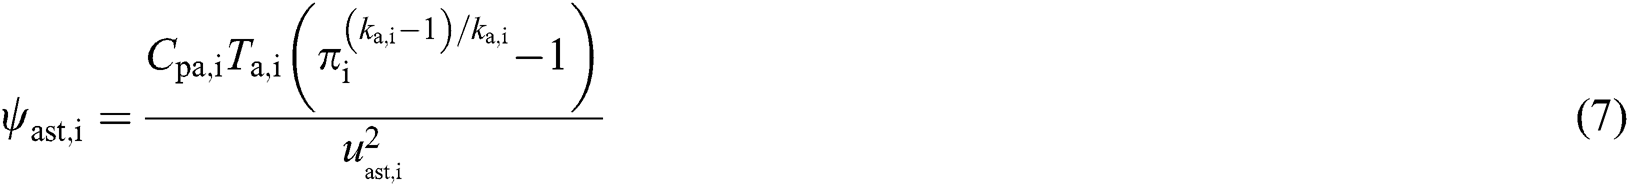
Pressure coefficient at ISO condition ψast:
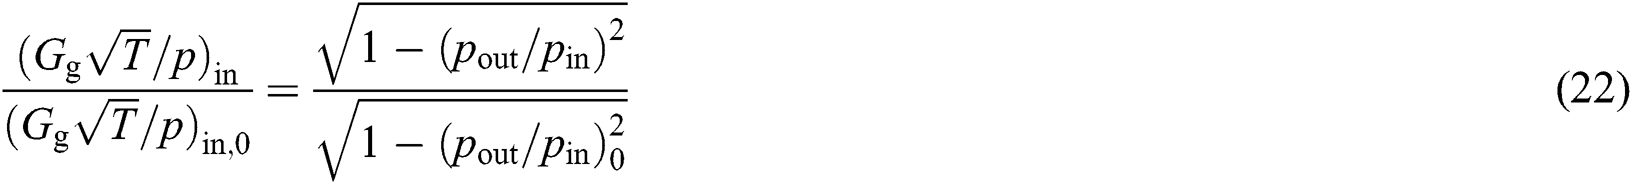
Most of modern heavy-duty gas turbines are equipped with variable inlet guide vane (VIGV) in axial compressors [12]. The angle of it can vary actively with the units operating at part-load conditions to ensure a high efficiency and prevent gas turbines from surges during transient operation including start-up and shut-down by regulating the inlet mass flow rate. Therefore, special efforts should be made to investigate the influence of IGV on the behaviour of gas turbines.
As is demonstrated in Fig. 3, compressor flow path is featured by the velocity triangles of rotor blade at mean radius [23]. The parameters used to depict the detailed characteristics of each rotor blade are as follows: α and β represent absolute flow angle and relative flow angle respectively; subscripts 1 and 2 refer to inlet and outlet cross section of each rotor blade respectively; for the first rotor, α1 is namely the setting angle of IGV which ranges from 49° to 88° for PG 9351FA type gas turbines [24] and the opening degree keeps maximum at design condition; w,c,u and Ca denote, respectively, relative velocity [m/s], absolute velocity [m/s], blade velocity at mean radius [m/s] and axial velocity [m/s]; superscript ′ means the parameters at different angle of IGV.
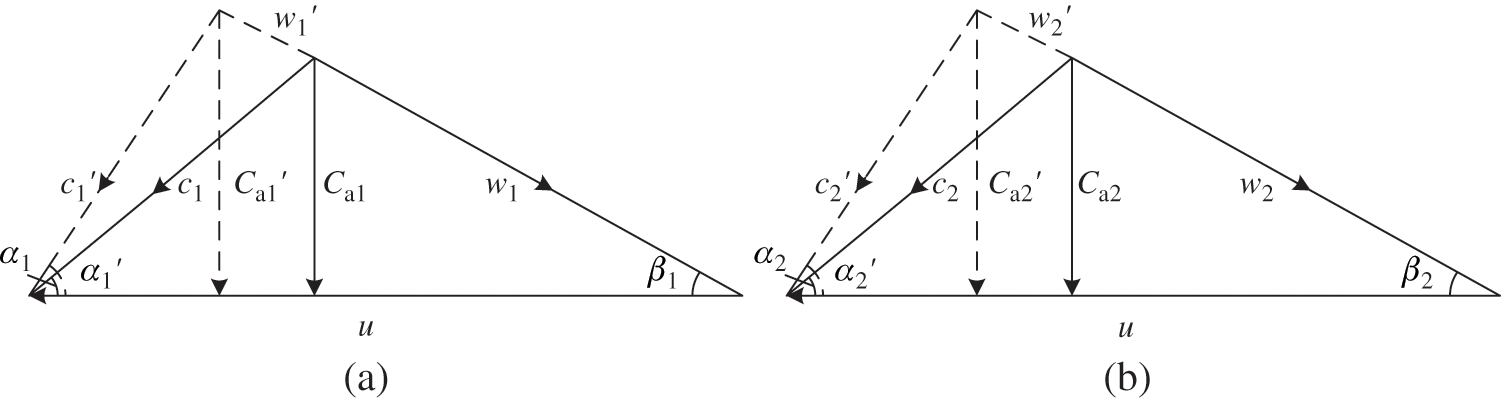
Figure 3: Velocity triangles of rotor blade with IGV regulation. (a) Velocity triangles of rotor inlet (b) Velocity triangles of rotor outlet
To analyze the operating performance during the variable geometry running mode, two assumptions are made in this study. First, relative rotor exit flow angle is assumed to be a mere function of rotor incidence. Second, stage efficiency is also regarded as a mere function of relative rotor exit flow angle. On the basis of these two hypotheses, Eqs. (8) and (9) can be derived readily through the stage energy conversion analysis and a geometric consideration of the velocity triangles.


When IGV angle varies to adapt to load regulation, the relationship between flow coefficient and absolute flow angle before and after the modulation can be expressed as follows:

When it comes to the overall compressor work, mid-stage coolant extraction should be determined in addition to the work that has done so far, and this will be discussed later in Section 3.3. Once the coolant flows are known, compression work Wc is expressed as follows [kW]:

where, Δia,i denotes the specific enthalpy increase of air in a compressor stage [kJ/kg]; Ga,i refers to the air mass flow entering the ith stage [kg/s] which subtracts the coolant flow and can be written as:

where, Ga,c denotes the total air mass flow rate at the inlet of the compressor [kg/s], and Gcl,k refers to the extracted coolant flow of each stage [kg/s].
3.2 Combustion Chamber Modeling
To simplify the combustion chamber modeling, it is assumed that fuel burns completely out there in the combustor. On the one hand, its thermodynamic characteristics are simulated by the first law of thermodynamics, i.e., a simple energy balance conservation which is written as:

where, Gcl and Gf denote, respectively, total cooling air mass flow rate extracted from the compressor [kg/s] and fuel mass flow rate [kg/s]; LHV represents lower heating value for fuel [kJ/kg], 50047 for methane; Δia,c and Δig,t represent a specific enthalpy rise during air compression in the compressor [kJ/kg] and a specific enthalpy drop during gas expansion in the turbine [kJ/kg] respectively; ηcomb means combustion efficiency whose value can maintain a high level due to the frequent upgrades of combustion technologies, and it is given as 0.96 in this study.
On the other hand, the detailed composition of generated high-temperature flue gas before entering turbine can be determined in the light of the introduction in literature, which is deemed as mixtures of ideal gases [25]. It can be written as follows:
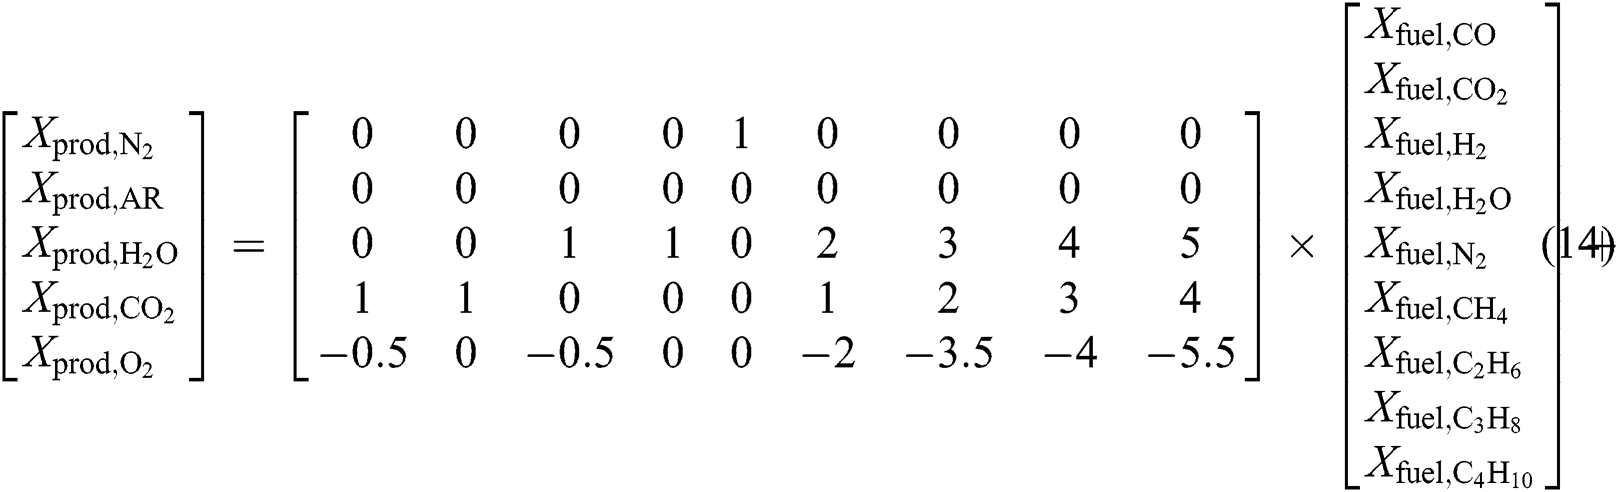
where, X stands for mole fraction of each gas component, and subscript prod denotes the generated gas.
Currently, the techniques of ceramic coatings of low thermal conductivity and blade cooling enable gas turbines to adapt to the increasing turbine inlet temperature, enhancing the ability of high-temperature endurance [26]. Among others, extracting air from different stages of the compressor to cool down turbine blades is an effective way to match the growing TIT and ensure a high efficiency. Fig. 4 illustrates the schematic diagram of PG 9351FA type gas turbines’ air cooling system. As is mentioned above, turbine is made up of three stages, each of which contains a stator blade and a rotor blade. Some air extracted from the outlet of the 9th and 13th stage of the compressor is supplied to cool down, respectively, the 3rd and 2nd stator blade of the turbine, some from the outlet of the 16th is to cool down the 1st and 2nd rotor blade, and the rest extracted from the outlet of compressor is supplied to cool down the first stator blade. In this work, the cooled turbine stage model [27] is adopted to do turbine calculation which is characterized by the row-by row calculation and enables to obtain the detailed thermodynamic performance, similar to the calculation of the compressor.
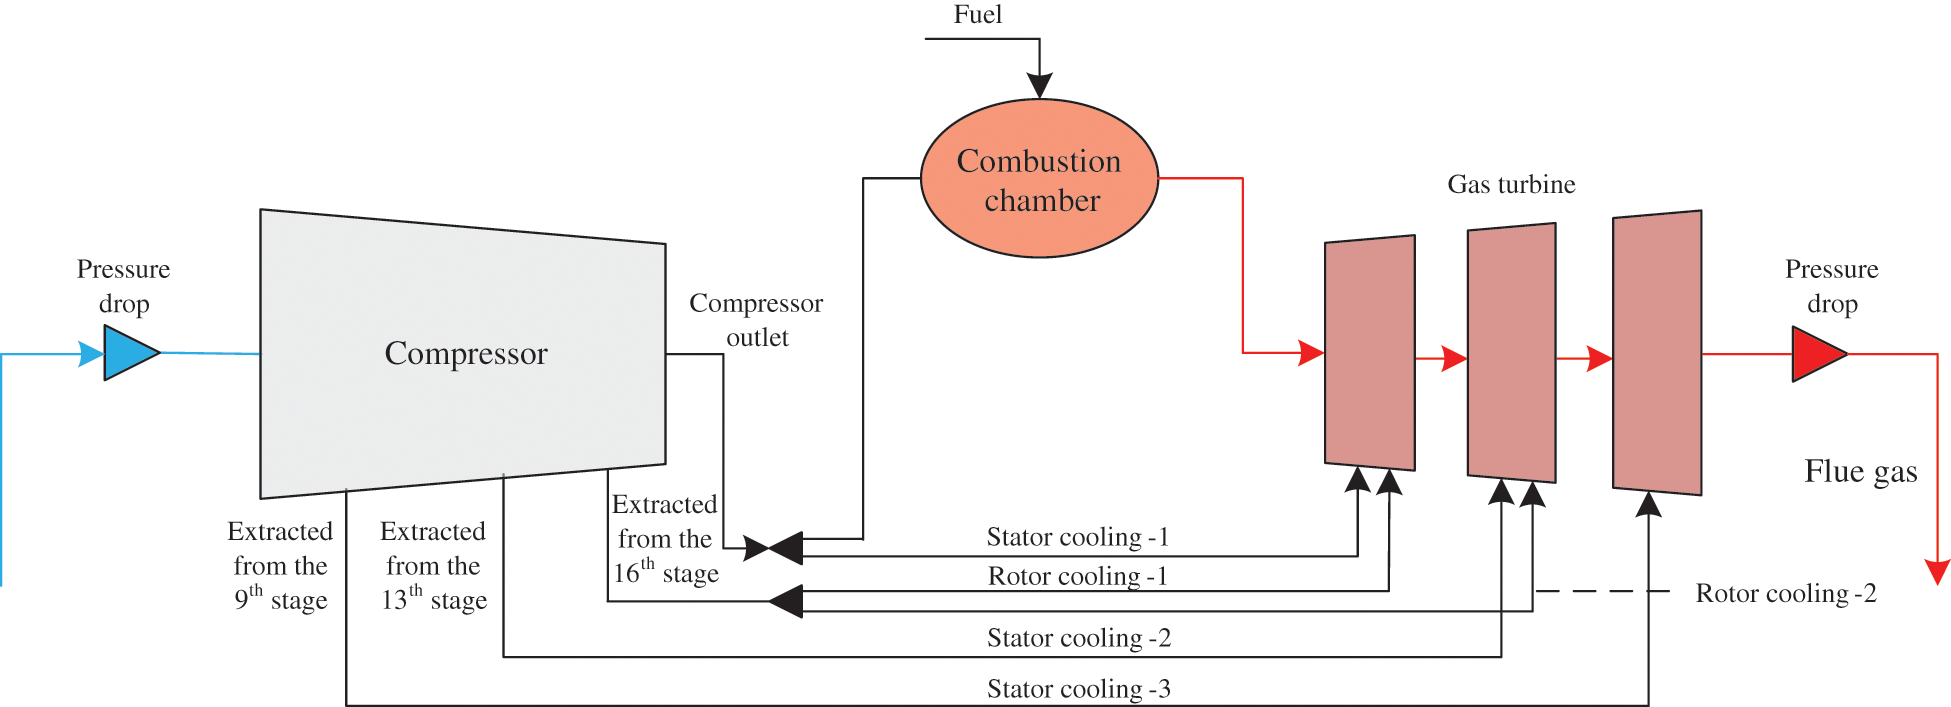
Figure 4: Schematic diagram of cooling model for PG 9351FA type gas turbines
Fig. 5 demonstrates the schematic diagram for cooled turbine stage model. Flue gas is first mixed with cooling air at the inlet of the stator blade with pressure loss ΔpN along the process 1-2-3, and then it expands in both the stator vane and rotor blade which corresponds to the process 3-4 in Fig. 5. Next, another pressure loss ΔpR is caused when the expanded gas is furtherly cooled by a breath of cooling air at the outlet of rotor blade which corresponds to the process 4-5-6. Here, it’s assumed that the cooling air to rotor blades doesn’t involve in expansion work.
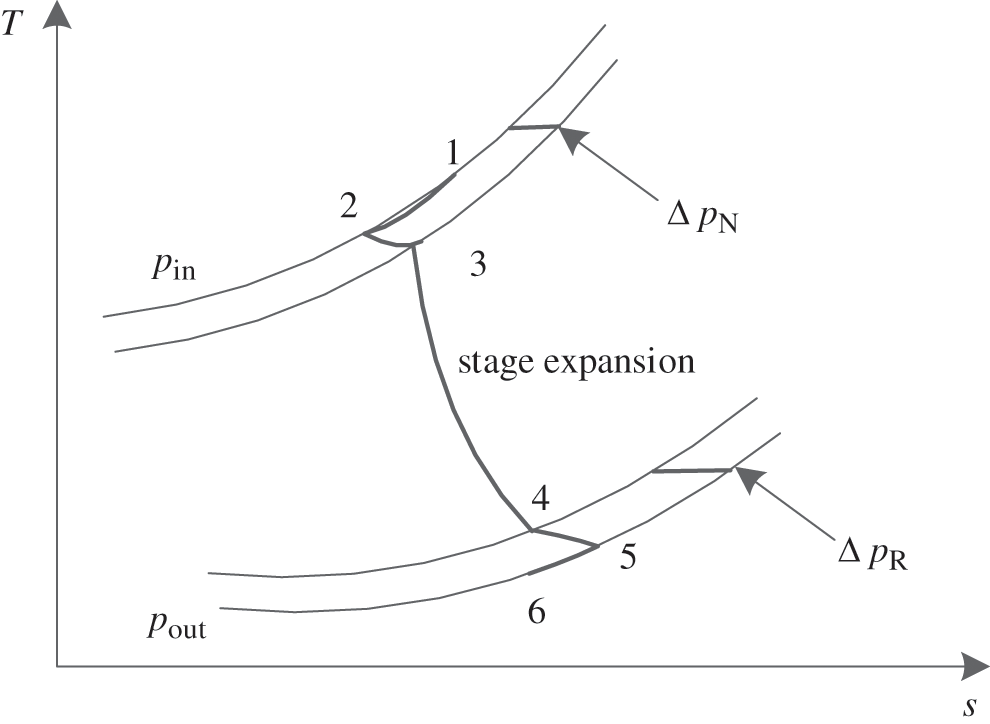
Figure 5: Schematic diagram for cooled turbine stage model
Expansion ratio for each stage at design condition can be calculated as:
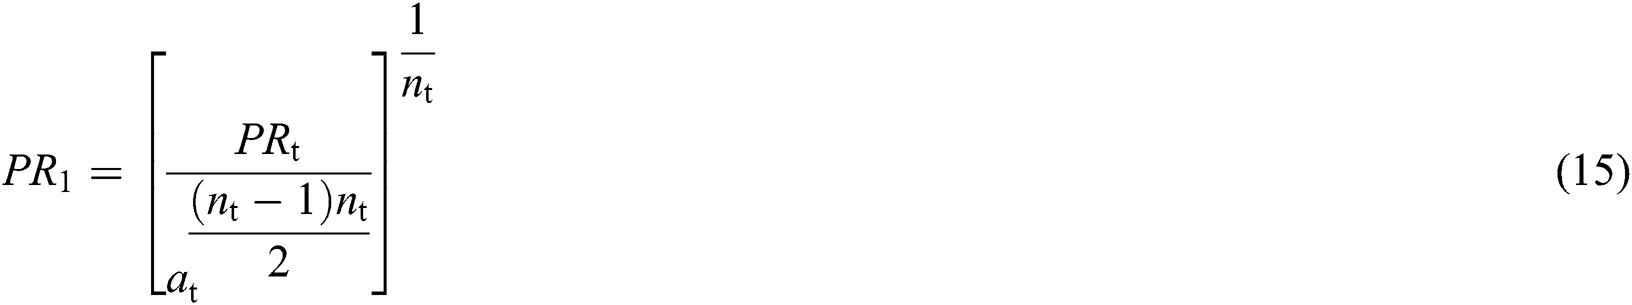

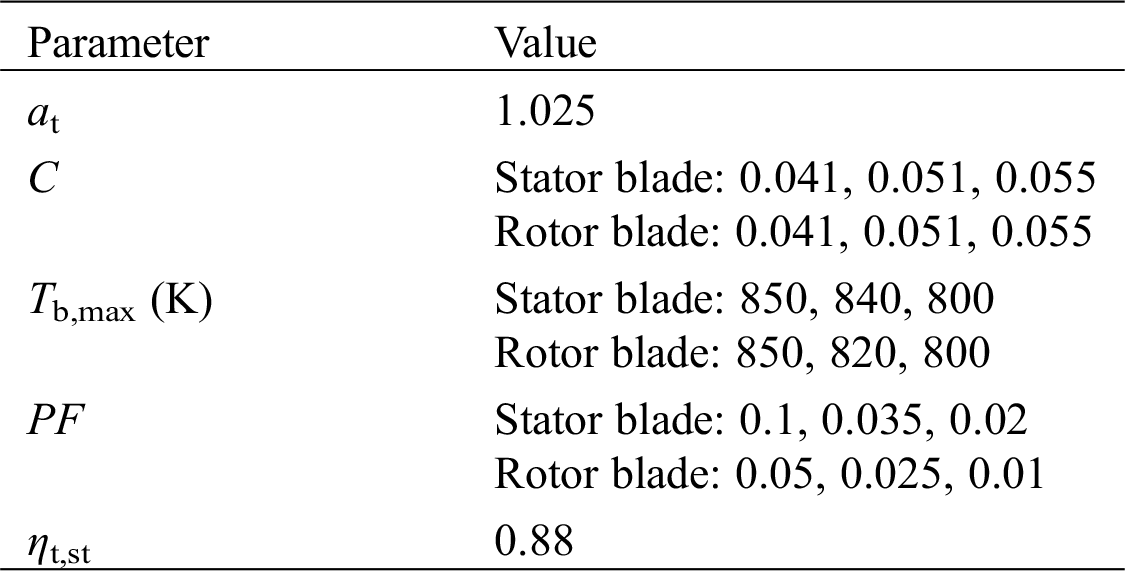
where, PRt denotes the turbine total-to-total expansion ratio; nt means the total number of turbine stages; PRj is the stage expansion ratio and the subscript j represents the index of turbine stage; at is the distribution parameter for turbine stage expansion ratio as is given in Tab. 2.
Table 2: Turbine design parameters for PG 9351FA type gas turbines
The mid-stage coolant extraction from the compressor to blades of the turbine at design condition can be described as follows:


where, Φ∞ denotes cooling effectiveness of turbine blades with large quantity of cooling air which is given as 1 in this study; Gg means the gas mass flow rate entering each stator blade and rotor blade [kg/s]; Cpg and Cpcl represent the specific heat at constant pressure of gas and cooling air respectively [kJ/(kg∙K)]; St is named as the gas flow Stanton number, Ab/Ag means blade to gas flow area ratio, ε is the heat exchange coefficient of coolant path, which are parts of the parameter C whose value is given in Tab. 2; Tgmax, Tbmax and Tcl denote, respectively, the maximum gas temperature, the maximum blade metal temperature and the temperature of coolant flow [K]; Tg,ave is the mean temperature of a mixture of flue gas and cooling air [K], which can be deduced from its enthalpy ig,ave according to Eq. (19); ΔTcomb means the temperature difference between flue gas exiting the combustion chamber and the pressurized air entering it [K]; rcl represents the mass flow ratio between extracted cooling air and flue gas of each stage; the subscript 0 means the parameters at design condition.
The pressure loss due to the mix of flue gas and coolant flow at the inlet and outlet of each stage can be expressed as follows:

where, y is a constant value which equals to 0.3 in this study and means the ratio between flue gas velocity and cooling air component parallel to it; Ma is Mach number; M is the gas molar mass [kg/mol]; p and T denote inlet gas pressure [MPa] and temperature [K] of each rotor blade respectively; the symbol Δ means the difference of gas parameters after flue gas and coolant flow are mixed. Relevant design parameters for the turbine are given in Tab. 2.
When the inlet and outlet thermodynamic parameters of each blade are figured out, turbine power Wt is expressed as follows [kW]:

where, Gt,j denotes the flue gas mass flow rate of each stage [kg/s] and Δit,j denotes the specific enthalpy drop of each stage [kJ/kg].
When turbine operates under off-design conditions, the actual expansion ratio and efficiency of each stage is determined by Flügel formulas:

where, ηt,st denotes the stage efficiency; N is the shaft speed of the turbine [r/min]; Δis represents the isentropic enthalpy drop of each stage [kJ/kg]; the subscripts in and out denote the inlet and outlet of each turbine stage.
Coolant flow rate of each blade under off-design conditions can be expressed as follows [28]:

where, the subscript cl denotes the cooling air.
On the basis of the aforementioned work, gas turbine power and efficiency can be determined by Eqs. (25) and (26):


where, Wgt and ηgt denote, respectively, gas turbine power [kW] and efficiency; ηm and ηgen represent mechanical efficiency and generator efficiency which are both given as 0.98 in this work.
3.5 Fluid Thermodynamic Properties Calculation
In this work, the thermodynamic property model introduced by Bucker et al. is applied to carry out the simulation in Matlab, which regards moist air and combustion gas as mixtures of various ideal gases [29]. It represents the relationship by means of scientific equations, greatly simplifying the simulation difficulty with well-proven precision.
4 Gas Turbine Physical Modeling
ThermoflowTM is a well-known developer of thermal engineering software in America, specializing in power system simulation. It develops a comprehensive suite which contains GT PRO and THERMOFLEX, etc [30]. It is helpful to professionally predict the full-range performance in a short time, so It is widely applied to power plant projects during the preliminary design period and operational period. In this study, PG 9351FA type gas turbines are selected as the research object. Its design and off-design physical modelings are respectively carried out in GT PRO and THERMOFLEX, based on which the overall performance can be obtained easily.
4.1 Design Physical Modeling in GT PRO
To build the design physical modeling for simple cycle gas turbines in GT PRO, the general implementation steps are as follows:
•Choosing methane as the fuel gas, whose LHV is 50047 kJ/kg relative to that at the reference temperature 25°C.
•Selecting the general plant configuration as gas turbine only.
•Setting values for site ambient parameters. 15°C for temperature, 0.101325 MPa for pressure and 60% for relative humidity, i.e., ISO condition.
•Selecting the PG 9351FA type gas turbines from GT PRO library.
•Modifying the default parameters of gas turbines in software according to the design values from the open literature.
•Determining the TIT control model by setting values in specific options.
•Computing to get the design results of thermodynamic cycle calculation.
Fig. 6 shows the graphic output of simulation result in GT PRO, where T and p refer to Celsius temperature [°C] and ambient pressure [bar] respectively; M denotes mass flow rate [kg/s] and RH stands for relative humidity.
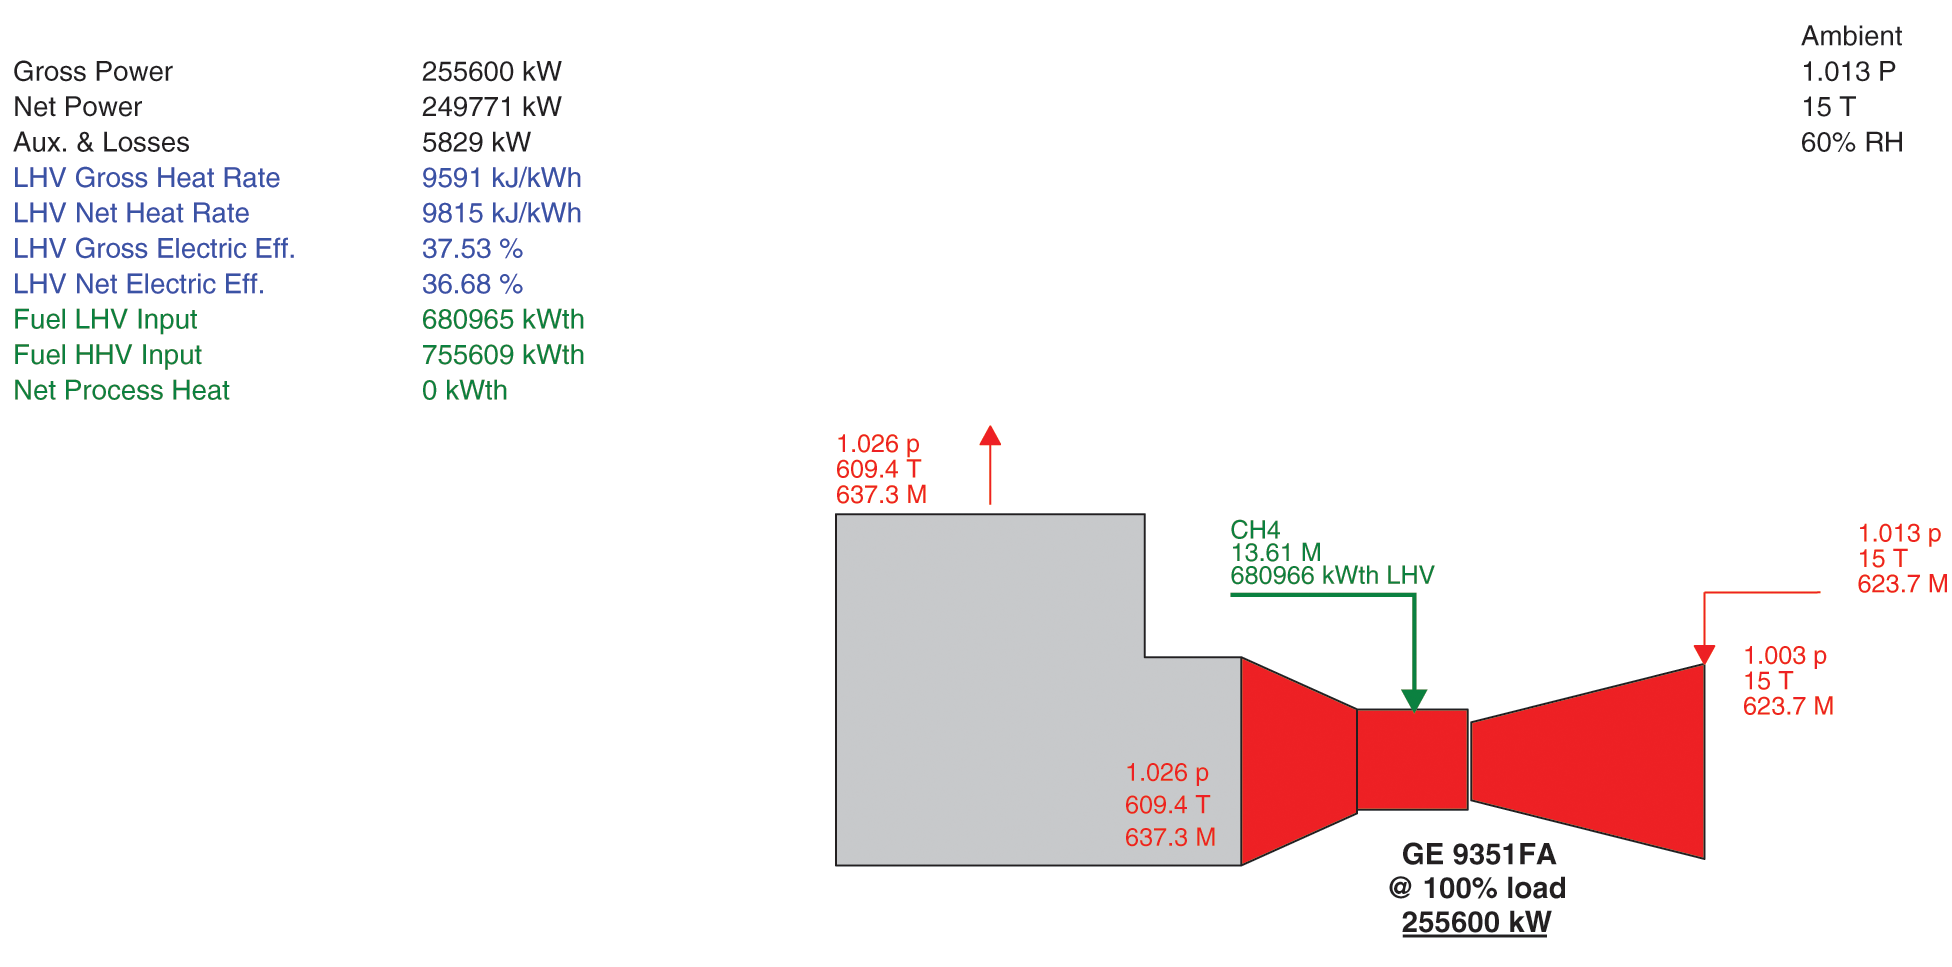
Figure 6: Simulation diagram of gas turbine plants
4.2 Off-Design Physical Modeling in THERMOFLEX
To build the off-design physical modeling for simple cycle gas turbines in THERMOFLEX, the general implementation steps are as follows:
•Importing the design physical modeling built in GT PRO to THERMOFLEX and carrying out both the thermodynamic design and engineering design calculation in turn.
•Setting macro variables and the different values which in other words are the interested research variables that make a difference to the system performance. These common variables include ambient temperature, ambient pressure, ambient relative humidity, gas turbine load rate and so forth, which are chosen according to the research demands.
•Computing to get the off-design results of thermodynamic cycle calculation.
5 Modeling Validation at Overall Part-Load Operation
5.1 Validation at Design Condition
After performing design calculations based on mathematical modeling and physical modeling, simulation results of some key parameters are compared to the corresponding design values, as is shown in Tabs. 3 and 4.
Table 3: Design parameters of mathematical modeling result
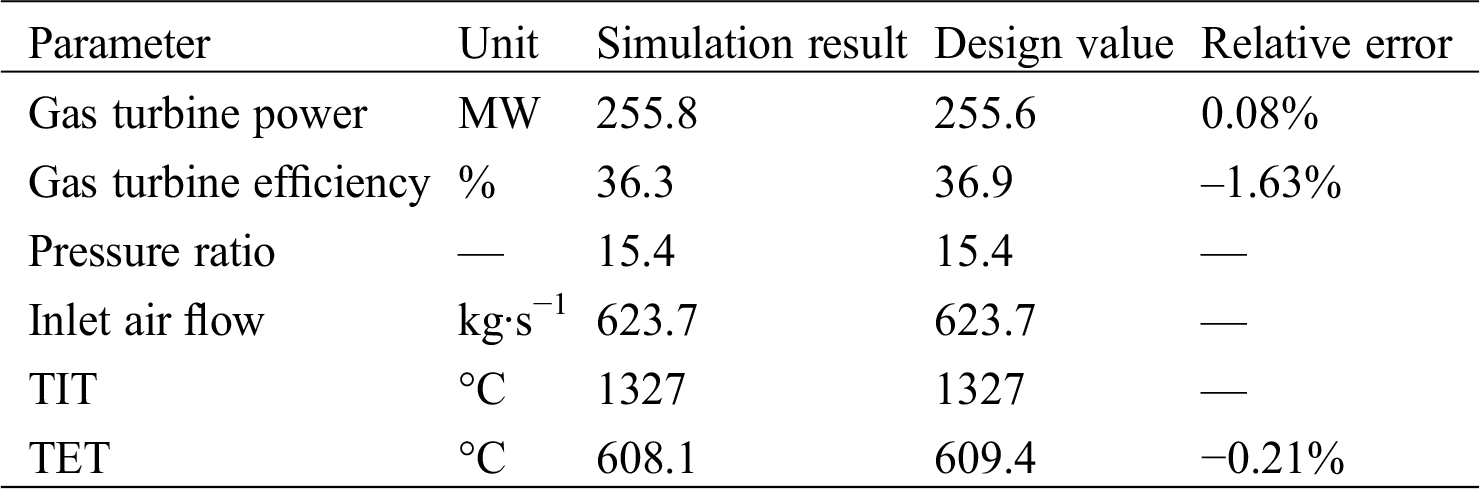
Table 4: Design parameters of physical modeling result
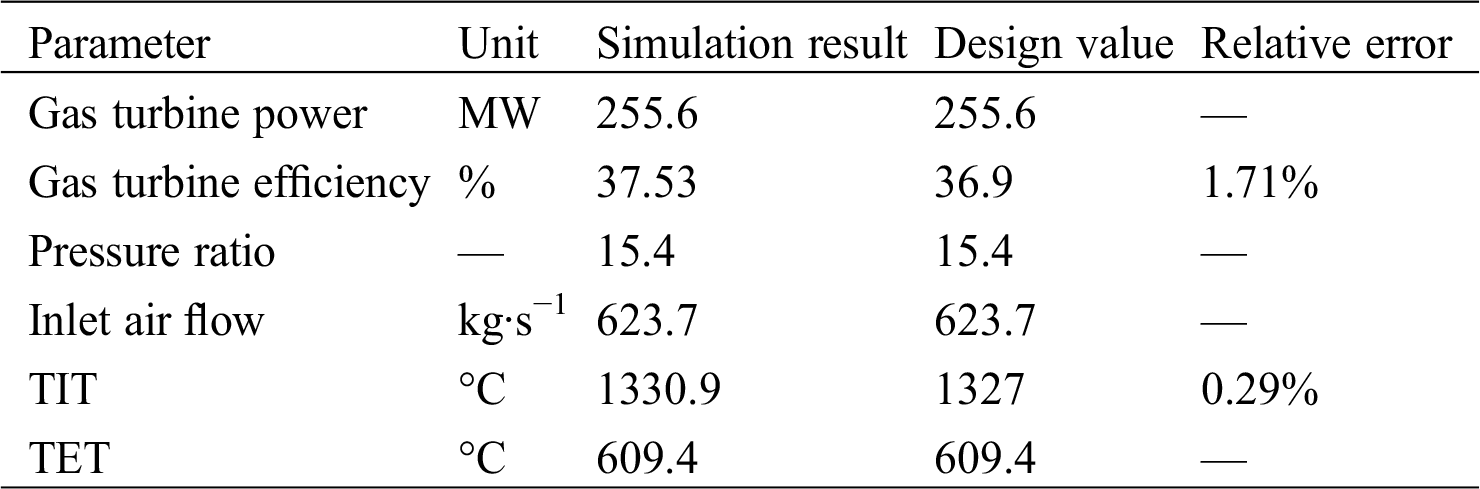
From the tables above, we can see clearly that simulation results of both modelings agree very well with the design values. Though the results show bigger discrepancies of gas turbine efficiency which are −1.63% and 1.71% respectively, the overall relative error is within ±2%. Hence both the design modelings are of relatively high reliability and furthermore pave the way for off-design study.
5.2 Full Load Validation at Various Ambient Temperatures
Full-load operation is defined as the way that gas turbines run at the given ambient conditions and at the rated firing temperature with IGV maintaining a fully open angle (i.e., 88 degrees here). Besides, the gas turbine exhaust pressure remains unchanged in all conditions for safety operation. Notably, when operating under full-load operation, gas turbine units will adjust the fuel flow to meet the rated TIT. Some studies have so far shown that ambient parameters especially temperature and pressure have an influence on the unit performance [15,31,32].
Fig. 7 shows the effect of the ambient temperature on compressor relative pressure ratio, which denotes the ratio of actual value to the design value. Simulation results of both modelings are in a good agreement with each other. When ambient pressure is held invariant, air density decreases with temperature rising, resulting in a decrease in inlet air mass flow rate and pressure ratio successively. The maximum error is 0.018. On average, every increase of 5°C in ambient temperature will cause a decrease of 0.024 of the relative pressure ratio. Correspondingly, turbine exhaust temperature gets higher with the decrease in expansion ratio as the turbine inlet temperature remains constant, which is depicted in Fig. 8. Approximately, every increase of 5°C in ambient temperature will cause an increase of 0.0062 of the relative turbine exhaust temperature.
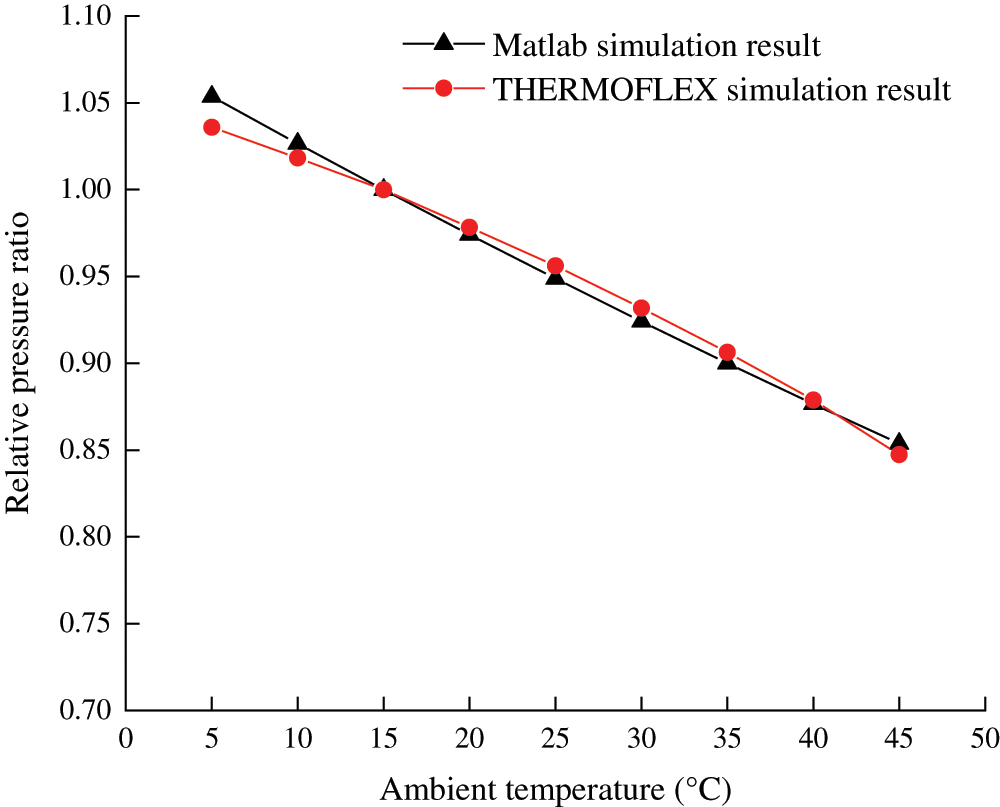
Figure 7: Comparison of compressor pressure ratio under full-load operation at various ambient temperatures
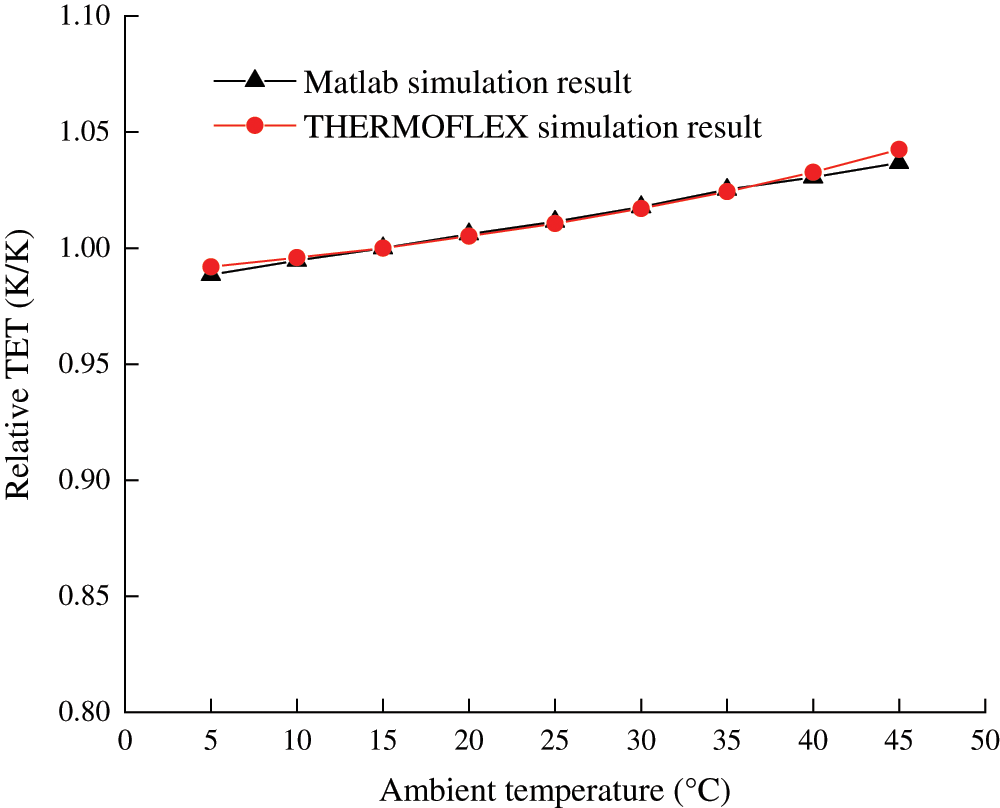
Figure 8: Comparison of turbine exhaust temperature under full-load operation at various ambient temperatures
Fig. 9 demonstrates the effect of the ambient temperature on relative gas turbine power and efficiency. For gas turbine efficiency, mathematical simulation result agrees quite well with that of physical modeling. Compared with efficiency, there exists some bigger error between the two modeling results of gas turbine power whose maximum error is 0.036. As is shown in Fig. 9, the relative output capacity decreases almost linearly as the ambient temperature rises. Every increase of 5°C in ambient temperature will cause an approximate decrease of 0.037 of the relative gas turbine output. By comparison, a modest change occurs in gas turbine efficiency as the ambient temperature fluctuates. Each increment of 5°C in temperature will reduce relative efficiency by an average of 0.011. This result provides the evidence and a basis for optimal operation with inlet-air cooling technologies which play a favorable part in gas turbine power output and overall efficiency improvement [33].
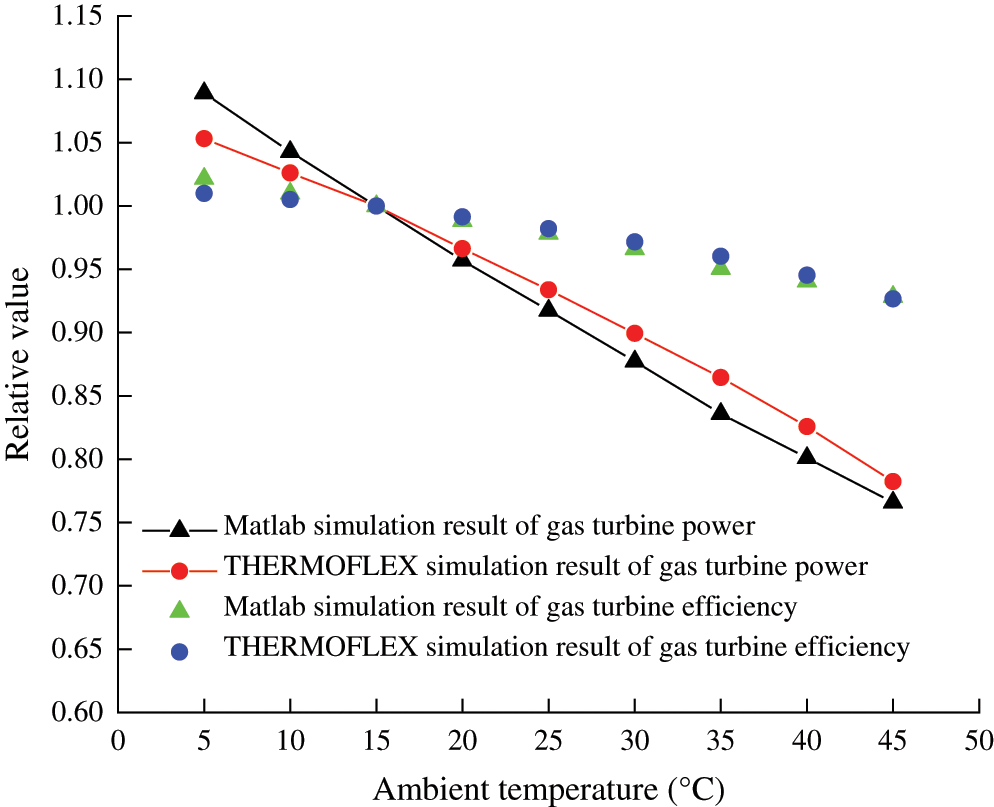
Figure 9: Comparison of gas turbine performance under full-load between two modelings at various ambient temperatures
5.3 Part-Load Validation at Various Load Regulation Strategies
5.3.1 Part-Load Performance at Constant TIT Regulation
The load control strategies for state-of-the-art heavy-duty gas turbines usually are characterized by IGV regulation [24]. Turbine inlet or exhaust temperature can keep constant under part-load operation by regulating IGV angle to optimize the efficiency. Evidently, there exist thermodynamic differences between the two modes.
Fig. 10 shows the variation of key parameters with gas turbine load rate under constant TIT regulation which includes inlet air mass flow rate, turbine inlet and exhaust temperature. The simulation results of both modelings show a good agreement with each other. With reduction of gas turbine load, the opening degree of IGV decreases gradually to maintain TIT, leading to a decrease of air flow and then a reduction of pressure ratio. In this way, TET is on a steady rise until the load rate decreases to 75%, where the peak value is reached, about 922.04K. When load rate comes between 75% and 65%, IGV opening continues to decrease and TET almost levels out with TIT experiencing a gradual decline. For the load rate lower than 65%, there is a slump in both TIT and TET with IGV opening keeping at 49 degrees and therefore inlet air flow at about 74% of the rated value.
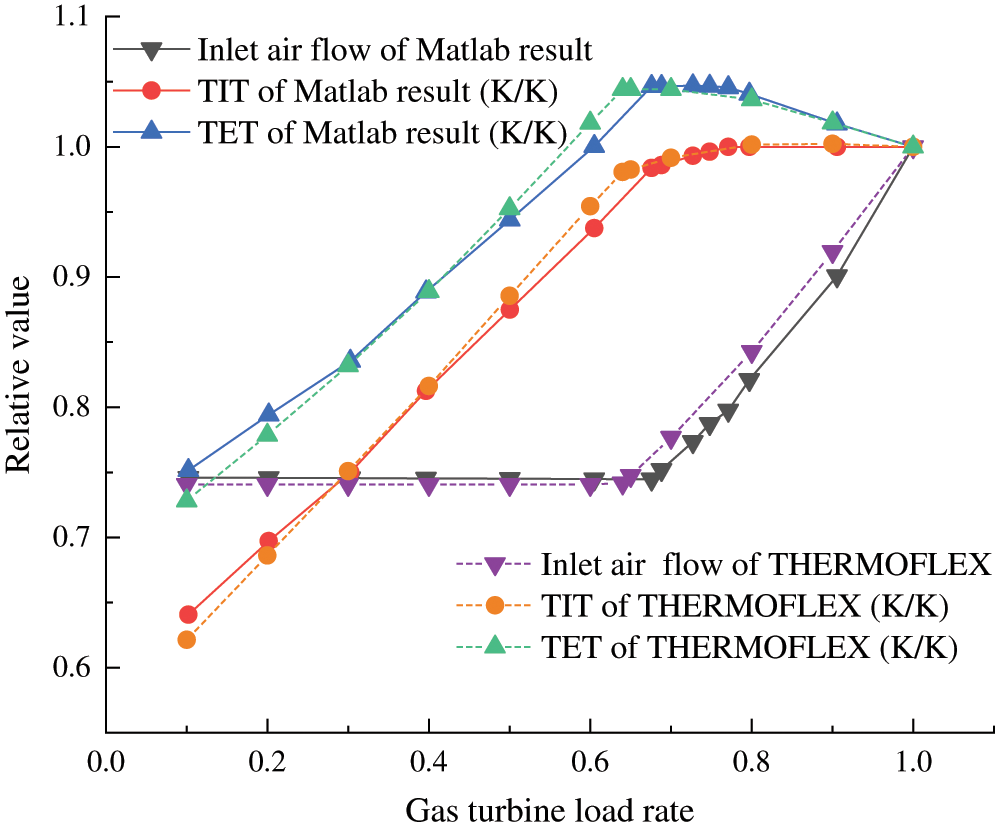
Figure 10: Comparison of key parameters between mathematical and physical modelings under constant TIT regulation
Fig. 11 shows the change in relative efficiency of the two modelings over the full-range load rates under constant TIT regulation. It’s apparent from the graph that the efficiency is susceptible to gas turbine load rate. A considerable decrease will occur especially in lower load rate regions, for example, the relative efficiency diminishes slightly from 0.826 at 50% load rate to 0.762 at 40% load rate, however that descends markedly from 0.676 at 30% load rate to 0.538 at 20% load rate.
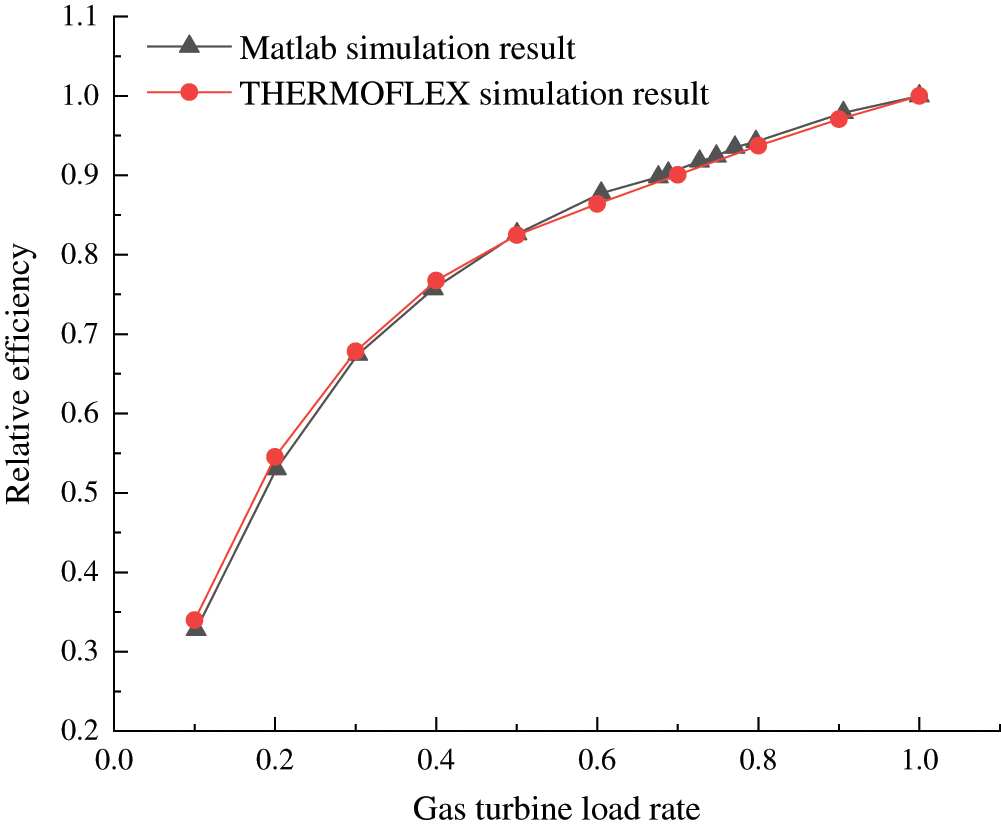
Figure 11: Comparison of gas turbine efficiency between mathematical and physical modelings under constant TIT regulation
5.3.2 Part-Load Performance at Constant TET Regulation
Fig. 12 shows the variation of inlet air mass flow rate, turbine inlet and exhaust temperature with gas turbine rate under constant TET regulation. The two modeling results are highly consistent. Unlike constant TIT regulation, TET keeps constant in the range of 100% to 60% load rate and TIT slides slightly. In the meantime, IGV opening decreases from 88 degrees to 49 degrees. Thereafter, gas turbines operate along the constant corrected speed line to keep the inlet air mass flow level, basically about 74% of the rated value. When gas turbines operate under 60% load rate, TIT and TET decline rapidly, especially TIT.
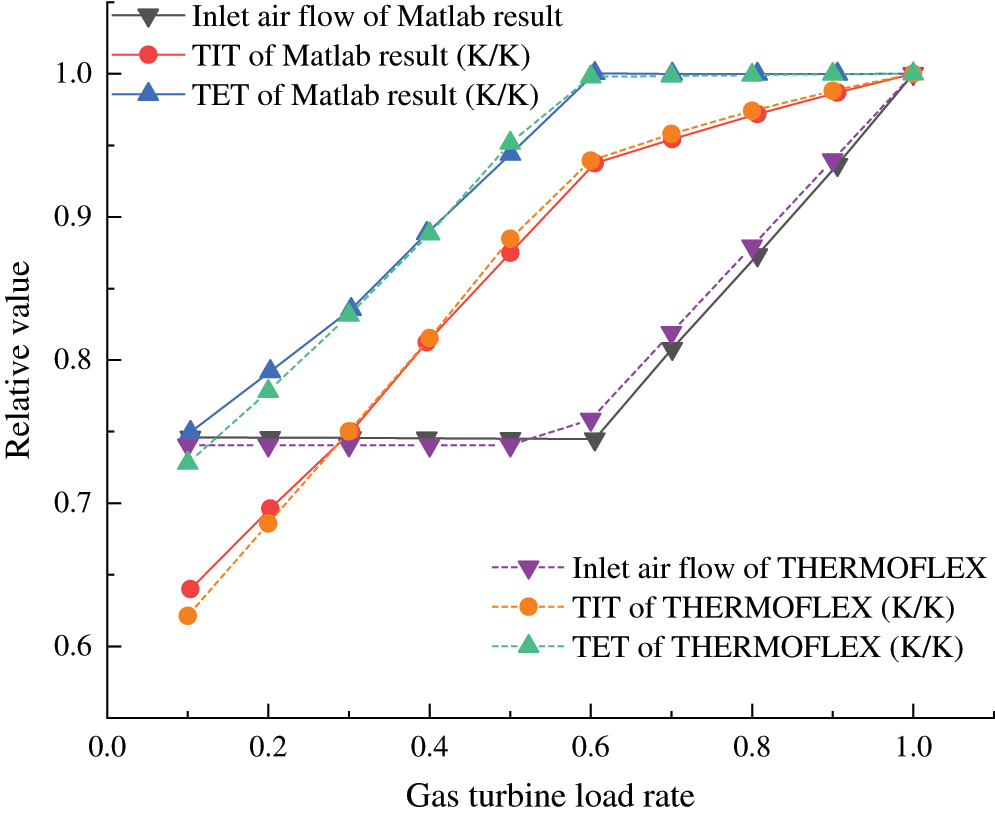
Figure 12: Comparison of key parameters between mathematical and physical modelings under constant TET regulation
The comparison of gas turbine efficiency under constant TET regulation at different gas turbine load rates is shown in Fig. 13. The overall changing trend is similar to that of constant TIT regulation. The variation of efficiency for load rate ranging from 10% to 100% is consistent between the two modelings. Relative efficiency degrades rapidly in lower load rate regions, for example, it drops by 0.0531 from 100% to 80% load rate, while that increases to 0.0788 from 80% to 60% load rate.
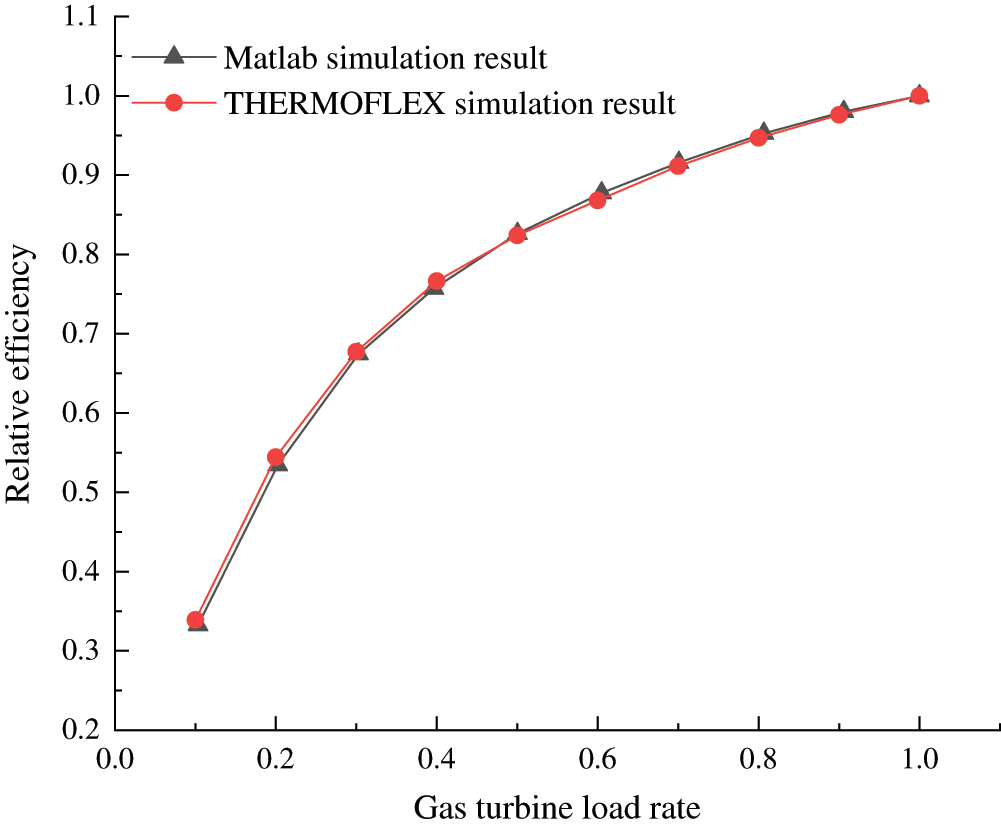
Figure 13: Comparison of gas turbine efficiency between mathematical and physical modelings under constant TET regulation
6 Effects of Ambient Temperature on Gas Turbine Performance in Part-Load Operation
On the basis of the detailed quantitative calculations of gas turbine performance with both mathematical modeling and physical modeling in Section 5, it is well proved that these two modelings are essentially equivalent and practical with high precision. In this section, the effects of ambient temperature on gas turbine performance under both constant TIT and TET part-load operation will be carried out in THERMOFLEX, as is exhibited in Figs. 14–16 where the load rate refers to the ratio of the actual output to the full-load output at the same ambient temperature and relative power and efficiency refer to the ratio of the actual value to the rated value at ISO condition.
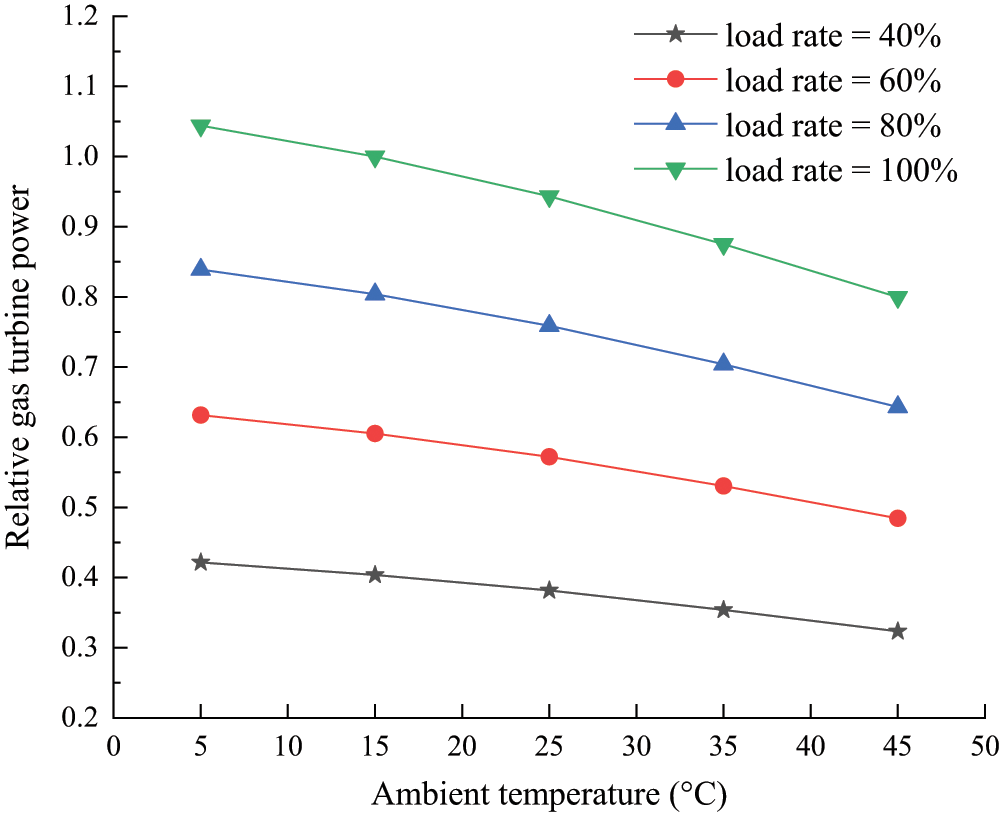
Figure 14: Variation of gas turbine part-load output with ambient temperature
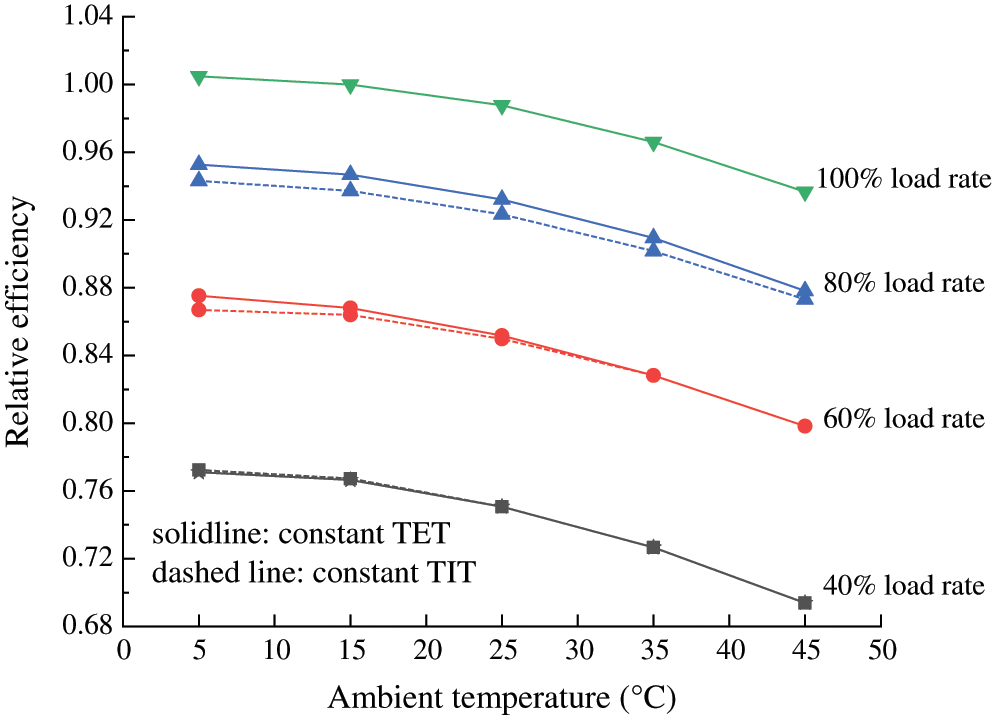
Figure 15: Variation of gas turbine part-load efficiency with ambient temperature under both regulations
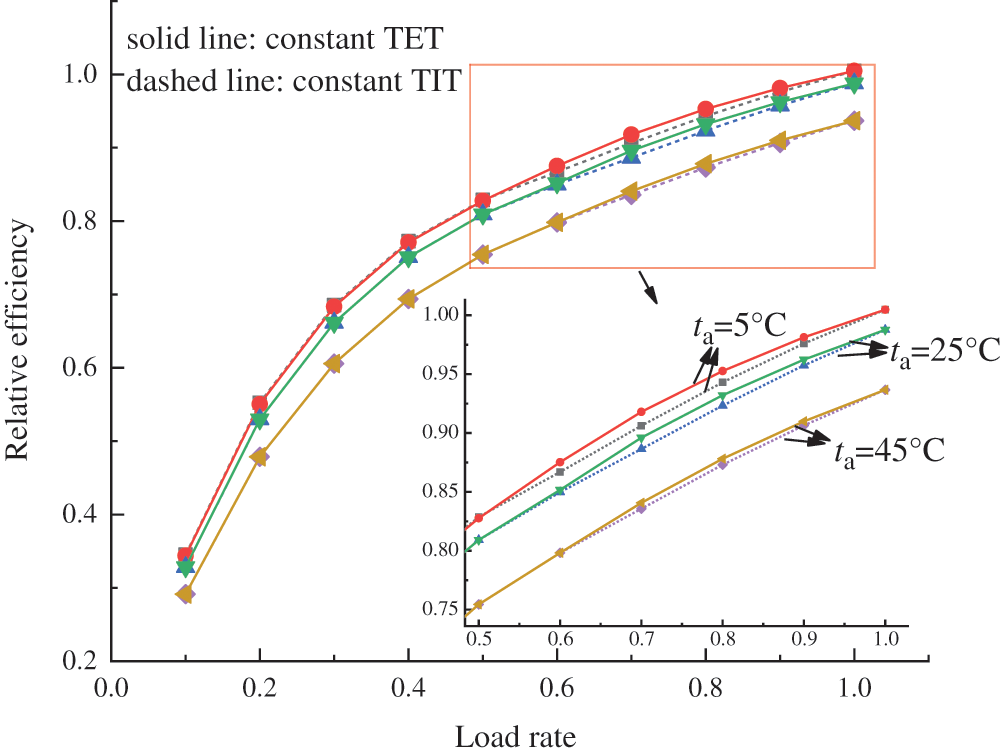
Figure 16: Variation of gas turbine part-load efficiency with ambient temperature under both regulations
Fig. 14 shows the variation of relative gas turbine power with ambient temperature, which is independent of part-load operation strategies. As can be seen from the graph, there is a near negative linear correlation between the output and ambient temperature at a given load rate. At full-load rate, relative output capacity declines from 1.04 at 5°C to 0.80 at 45°C, consistent with what is previously described in Section 5.2. Remarkably, higher temperature exerts a larger influence on gas turbine power at a given load rate, for example, the relative output drops by 0.026 for temperature ranging from 5°C to 15°C at 60% load rate while it drops by 0.033 from 15°C to 25°C. In addition, the output capacity is more sensitive to ambient temperature at a higher load rate, for instance, when gas turbines operate at 40% and 80% load rate, each increment of 10°C in temperature will cause an average reduction of 0.025 and 0.049 in relative output respectively.
Fig. 15 shows the trend of relative gas turbine efficiency at different load rates over the ambient temperature spanning from 5°C to 45°C under constant TIT and TET strategies, generally similar to that of relative output capacity in Fig. 14. The gas turbine efficiency is significantly affected by the load rate. Take constant TET strategy for example, the relative efficiency drops by 0.057 and 0.102 respectively when load rate decreases from 100% to 80% and 60% to 40% at 35°C. Unlike gas turbine power, the efficiency is more sensitive to ambient temperature at a lower load rate, for instance, when gas turbines operate at 100% and 60% load rate, each increment of 10°C in temperature will reduce relative efficiency by an average of 0.017 and 0.019 respectively. It’s worth noting, however, that slight difference exists between the two modes. When gas turbines operate at a high load rate (60% and 80% for example), constant TET regulation shows its advantage with a higher efficiency due to the lower exhaust temperature which can be verified from the off-design simulation results in Figs. 10 and 12. As for the 40% load rate situation, IGV opening has reached the minimum degree which results in the same operation status for both strategies and the performance distinction therefore disappears.
Fig. 16, from a different perspective, further illustrates the relationship between efficiency and load rates under constant TIT and TET strategies. At a given ambient temperature, both modes share similar variation trends like Figs. 11 and 13 described previously in Section 5.3. Besides, it’s important to note that constant TET strategy is efficiently superior to constant TIT strategy under part-load conditions. It can be seen from the figure that the lower the ambient temperature is, the bigger discrepancy will occur. For example, the maximum efficiency difference is 0.51% when ta is 45°C, while that will reach to 1.2% when ta is 5°C.
To comparatively investigate the off-design performance of gas turbine power units operating at alternative load-regulating strategies, both mathematical modeling and physical modeling were applied and validated for analyzing the various effects on the gas turbine performance. In the case of a PG 9351FA gas turbine power units, the influence of ambient temperature as well as constant TIT and TET regulation strategies on the overall part-load performance was obtained. The general conclusions drawn from this work are listed as follows:
•The ambient temperature exerts a considerable influence on gas turbine output power and efficiency. Every 5°C increase in the ambient temperature produces a reduction of 3.7% in the relative full-load output and 1.1% in the relative efficiency respectively.
•At constant TIT regulation within the allowable IGV opening range, TIT remains the rated referenced value and TET maintains an upward trend with the load decrease until at the TET peak temperature of about 922.04 K and 75% load rate. In the range of load rate from 75% to 65%, TET varies little and TIT declines slightly with the load reduction. Below 65% load rate, both TIT and TET drop evidently with load reduction at 49 degrees of IGV opening.
•At constant TET regulation within the allowable IGV opening range, TET keeps the rated referenced value while TIT slides slightly during load reduction from 100% to 60%. Below the load rate of 60%, both TIT and TET declines rapidly with IGV opening at 49 degrees; and gas turbine operates along constant corrected speed line of the compressor.
•Efficiency is susceptible to gas turbine load rate, and it degrades rapidly especially in lower load rate regions. Constant TET regulation is preferred instead of constant TIT regulation for the sake of a higher efficiency under part-load operation.
Further studies would be carried out on the thermodynamic analysis of Rankine bottoming cycle, whose performance is affected directly by the exhaust quality of gas turbines. This work provides prospect for dynamic optimization and a higher energy efficiency of the gas turbine-based power system at deep peak-regulating operation.
Funding Statement: This work was supported by Guangdong Province Key Laboratory of Efficient and Clean Energy Utilization (2013A061401005), by Guangdong Basic and Applied Basic Research Foundation (2020A1515011103), and by research fund from Guangzhou Development Group Co., Ltd.
Conflicts of Interest: The authors declare that they have no conflicts of interest to report regarding the present study.
References
1. Samson, A. O., Babatunde, O. M., Denwigwe, I. H. (2019). Powering a space environment research laboratory (serlHybrid renewable energy system or diesel system? Energy Engineering, 116(2), 41–64. DOI 10.1080/01998595.2019.12054404.
2. Kalaiselvi, K., Renuga, P., Suresh Kumar, V. (2018). CO2 emission and cost reduction by integrating electric vehicles and wind energy systems with thermal power plants. Energy Engineering, 115(4), 11–22. DOI 10.1080/01998595.2018.12016669.
3. Ellabban, O., Abu-Rub, H., Blaabjerg, F. (2014). Renewable energy resources: Current status, future prospects and their enabling technology. Renewable and Sustainable Energy Reviews, 39(11), 748–764. DOI 10.1016/j.rser.2014.07.113.
4. International Renewable Energy Agency (IRENA). (2020). Renewable capacity statistics 2020. https://www.irena.org/publications/2020/Mar/Renewable-Capacity-Statistics-2020.
5. BP (2020). BP statistical review of world energy 2019. https://www.bp.com/en/global/corporate/energy-economics/statistical-review-of-world-energy.html.
6. National Energy Administration (NEA) (2020). Flourishing clean energy with wind and solar. http://www.nea.gov.cn/2020-03/03/c_138838993.htm.
7. Wang, C., Liu, S., Bie, Z., Wang, J. (2018). Renewable energy accommodation capability evaluation of power system with wind power and photovoltaic integration. IFAC-PapersOnLine, 51(28), 55–60. DOI 10.1016/j.ifacol.2018.11.677.
8. Cheng, Y., Zhang, N., Kirschen, D. S., Huang, W., Kang, C. (2020). Planning multiple energy systems for low-carbon districts with high penetration of renewable energy: An empirical study in China. Applied Energy, 261, 114390. DOI 10.1016/j.apenergy.2019.114390.
9. Kim, E., Park, Y., Roh, J. H. (2019). Competitiveness of open-cycle gas turbine and its potential in the future Korean electricity market with high renewable energy mix. Energy Policy, 129, 1056–1069. DOI 10.1016/j.enpol.2019.03.014.
10. Maraver, D., Sin, A., Royo, J., Sebastian, F. (2013). Assessment of CCHP systems based on biomass combustion for small-scale applications through a review of the technology and analysis of energy efficiency parameters. Applied Energy, 102, 1303–1313. DOI 10.1016/j.apenergy.2012.07.012.
11. Udomsri, S., Martin, A. R., Martin, V. (2010). Thermally driven cooling coupled with municipal solid waste-fired power plant: Application of combined heat, cooling and power in tropical urban areas. Applied Energy, 88(5), 1532–1542. DOI 10.1016/j.apenergy.2010.12.020.
12. Song, T. W., Kim, T. S., Kim, J. H., Ro, S. T. (2001). Performance prediction of axial flow compressors using stage characteristics and simultaneous calculation of interstage parameters. Proceedings of the Institution of Mechanical Engineers, Part A: Journal of Power and Energy, 215(A1), 89–98. DOI 10.1243/0957650011536598.
13. Yang, C., Wang, P., Fan, K., Ma, X. (2020). Performance of gas turbine multi generation system regulated with compressor bypass extraction air energy storage. Applied Thermal Engineering, 172, 115181. DOI 10.1016/j.applthermaleng.2020.115181.
14. Yang, Y., Bai, Z., Zhang, G., Li, Y., Wang, Z. et al. (2019). Design/off-design performance simulation and discussion for the gas turbine combined cycle with inlet air heating. Energy 178, 386–399. DOI 10.1016/j.energy.2019.04.136.
15. González-Díaz, A., Alcaráz-Calderón, A. M., González-Díaz, M. O., Méndez-Aranda, Á., Lucquiaud, M. et al. (2017). Effect of the ambient conditions on gas turbine combined cycle power plants with post-combustion CO2 capture. Energy, 134, 221–233. DOI 10.1016/j.energy.2017.05.020.
16. Liu, T., Zhang, G., Li, Y., Yang, Y. (2018). Performance analysis of partially recuperative gas turbine combined cycle under off-design conditions. Energy Conversion and Management, 162, 55–65. DOI 10.1016/j.enconman.2018.01.075.
17. Ravi Kumar, N., Rama Krishna, K., Sita Rama Raju, A. V. (2007). Performance improvement and exergy analysis of gas turbine power plant with alternative regenerator and intake air cooling. Energy Engineering, 104(3), 36–53. DOI 10.1080/01998590709509498.
18. Najjar, Y. S. H., AbuEisheh, H. (2016). Exergy analysis and greening performance carpets for turbojet engines. Journal of Engineering Thermophysics, 25(2), 262–274. DOI 10.1134/S1810232816020119.
19. Robbins, W. H., Dugan, J. F. (1965). Prediction of off-design performance of multistage compressors. NASA SP-36, Chapter X, 297–310.
20. Zhang, N., Cai, R. (2002). Analytical solutions and typical characteristics of part-load performances of single shaft gas turbine and its cogeneration. Energy Conversion and Management, 43(9–12), 1323–1337. DOI 10.1016/S0196-8904(02)00018-3.
21. Muir, D. E., Saravanamuttoo, H. I. H., Marshall, D. J. (1989). Health monitoring of variable geometry gas turbines for the Canadian Navy. Journal of Engineering for Gas Turbines and Power, 111(2), 244–250.
22. Kim, J. H., Song, T. W., Kim, T. S., Ro, S. T. (2001). Model development and simulation of transient behavior of heavy duty gas turbines. Transactions of ASME Journal of Engineering for Gas Turbines and Power, 123(3), 589–594. DOI 10.1115/1.1370973.
23. Ma, W., Su, M., Yu, N. (2008). Characteristic estimation method of variable geometry multistage axial-flow compressors. Proceedings of the CSEE, 28(11), 72–76.
24. Liu, Z., Karimi, I. A. (2018). Simulation and optimization of a combined cycle gas turbine power plant for part-load operation. Chemical Engineering Research and Design, 131, 29–40. DOI 10.1016/j.cherd.2017.12.009.
25. Turns, S. R. (2000). An Introduction to Combustion: Concept and Applications. 2nd ed. New York: McGraw-Hill, 9–78.
26. Bosc, C., Rocha, L. A. O., Centeno, F. R., Gutierrez, F. (2019). Constructal design of elliptical conduits for cooling of gas turbine blades with external thermal barrier coating. Journal of Engineering Thermophysics, 28(4), 507–528. DOI 10.1134/S1810232819040064.
27. Kim, T. S., Ro, S. T. (1995). Comparative evaluation of the effect of turbine configuration on the performance of heavy-duty gas turbine. Proceedings of the International Gas Turbine and Aeroengine Congress and Exposition. 95-GT-334, V004T10A019.
28. Lee, J. J., Kang, D. W., Kim, T. S. (2011). Development of a gas turbine performance analysis program and its application. Energy, 36(8), 5274–5285. DOI 10.1016/j.energy.2011.06.032.
29. Bücker, D., Span, R., Wagner, W. (2003). Thermodynamic property models for moist air and combustion gases. Journal of Engineering for Gas Turbines and Power, 125(1), 374–384. DOI 10.1115/1.1520154.
30. Thermoflow Inc. (2020). Overview. https://www.thermoflow.com/products_overview.html.
31. Ponce Arrieta, F. R., Silva Lora, E. E. (2004). Influence of ambient temperature on combined-cycle power-plant performance. Applied Energy, 80(3), 261–272. DOI 10.1016/j.apenergy.2004.04.007.
32. Ünver, Ü., Kiliç, M. (2017). Influence of environmental temperature on exergetic parameters of a combined cycle power plant. International Journal of Exergy, 22(1), 73–87. DOI 10.1504/IJEX.2017.081202.
33. Najjar, Y. S. H., Al-Zoghool, Y. M. A. (2015). Sustainable energy development in power generation by using green inlet-air cooling technologies with gas turbine engines. Journal of Engineering Thermophysics, 24(2), 181–204. DOI 10.1134/S1810232815020083.
| This work is licensed under a Creative Commons Attribution 4.0 International License, which permits unrestricted use, distribution, and reproduction in any medium, provided the original work is properly cited. |