DOI:10.32604/EE.2020.013834
| Energy Engineering DOI:10.32604/EE.2020.013834 | |
| Article |
Relationship between Industrial Coupling Coordination and Carbon Intensity in the Bohai Rim Economic Circle
1School of Management, China University of Mining and Technology-Beijing, Beijing, 100083, China
2Key Laboratory of Carrying Capacity Assessment for Resource and Environment, Ministry of Natural Resources, Sanhe, 065201, China
*Corresponding Authors: Mei Song. Email: songmei6361@cumtb.edu.cn. Mingxin Zhang. Email: mingxinzhang1@163.com
Received: 23 August 2020; Accepted: 23 September 2020
Abstract: Coordinated development of new high-tech industries and traditional industries is crucially important for economic growth and environmental sustainability, and it has become a focus of academic and governmental bodies. This study establishes the comprehensive evaluation index system of high-tech industries and traditional industries, and uses the method of principal component analysis, coupling and coupling coordination degree model to determine the level of industry coordinated development. Then, Pearson correlation test is used to further analyze the correlation between regional industrial coupling coordination and carbon intensity of the seven provinces in the Bohai Rim Economic Circle (BREC). The results are as follows. (1) There is a negative correlation between industrial coupling coordination and carbon intensity. (2) The degree of industrial coordination of Beijing, Tianjin, and Shandong is significantly higher than other provinces in the BREC, as both the high-tech industries and traditional industries of these three provinces have reached a high level of development and achieved high coupling. The high-tech industries of the three provinces show positive changes, whereas the traditional industries show negative changes, which indicates that the new high-tech industries are driving the upgrading of the traditional industries by the application of high technologies. (3) From 2011 to 2016, the number of provinces with a low degree of high-tech and traditional industrial coordination fell from three to one. The traditional industries in Hebei and Inner Mongolia have been upgraded by strengthening their technological innovation with the introduction of rapid high-tech industrial development. These findings are a useful reference for regional industrial coupling coordination and carbon emission reduction.
Keywords: Industrial coupling coordination degree; industrial coupling degree; carbon intensity; Bohai Rim Economic Circle
With China’s economic growth entering the new normal stage, the Chinese government regards the upgrading of industrial structures as an important strategy to transform the current economic development model. The experience of domestic and foreign development was summarized, and the global trends were analyzed at the 18th National Congress of the Communist Party of China. Five new development concepts were recommended based on this review. One of these concepts was coordinated development. There is no doubt that coordinated industrial development is inevitably required to improve the overall coordinated development and the high-quality development of economy.
The Bohai Rim Economic Circle1 (BREC) is an important area for China’s economic development and a key area for carbon emission reduction. The BREC, which is China’s third economic growth pole following the Yangtze River Delta and Pearl River Delta, is known as the “engine” of northern economic development. As a major industrialized region in China, the BREC is located at the northeastern coast of mainland China. This area, which includes Beijing and Tianjin, is directly under the administration of the central government, so the government can directly drive the urban economic, ecological, and social development of the whole region. The other five provinces in the BREC, which are Hebei, Liaoning, Shanxi, Inner Mongolia, and Shandong, surround the Bohai Sea. We call this group the seven provinces, as shown in Fig. 1. The provinces in the BREC have differences in resource endowments, energy consumption structures, industrial structures, technological levels and policy inclinations, which don't exist in the Yangtze River Delta, the Pearl River Delta and other Chinese urban agglomerations. Currently, the BREC is also faced with “two peaks that are advancing together” in the process of industrial development. On the one hand, it is essential to increase the rate of development of the new high-tech industries which are expected to occupy a commanding position in future development. On the other hand, the proportion of traditional industries relative to high-tech industries is still large, so it is critical to equally promote the high-quality development of these industries, to transform and upgrade the entire industrial structure. Meanwhile, environmental problems and the contradiction between economic development and carbon emissions are also becoming increasingly prominent as a consequence of rapid economic development. As a high carbon emission region in China, the carbon intensity of the BREC was well above the national average in 2015, so there is an urgent need for emission reductions and energy retrenchment to accelerate the implementation of a low-carbon economy pattern and sustainable development strategy. And the comprehensive and efficient realization of its regional coordinated emission reduction is of great significance for achieving the national carbon emission reduction target.
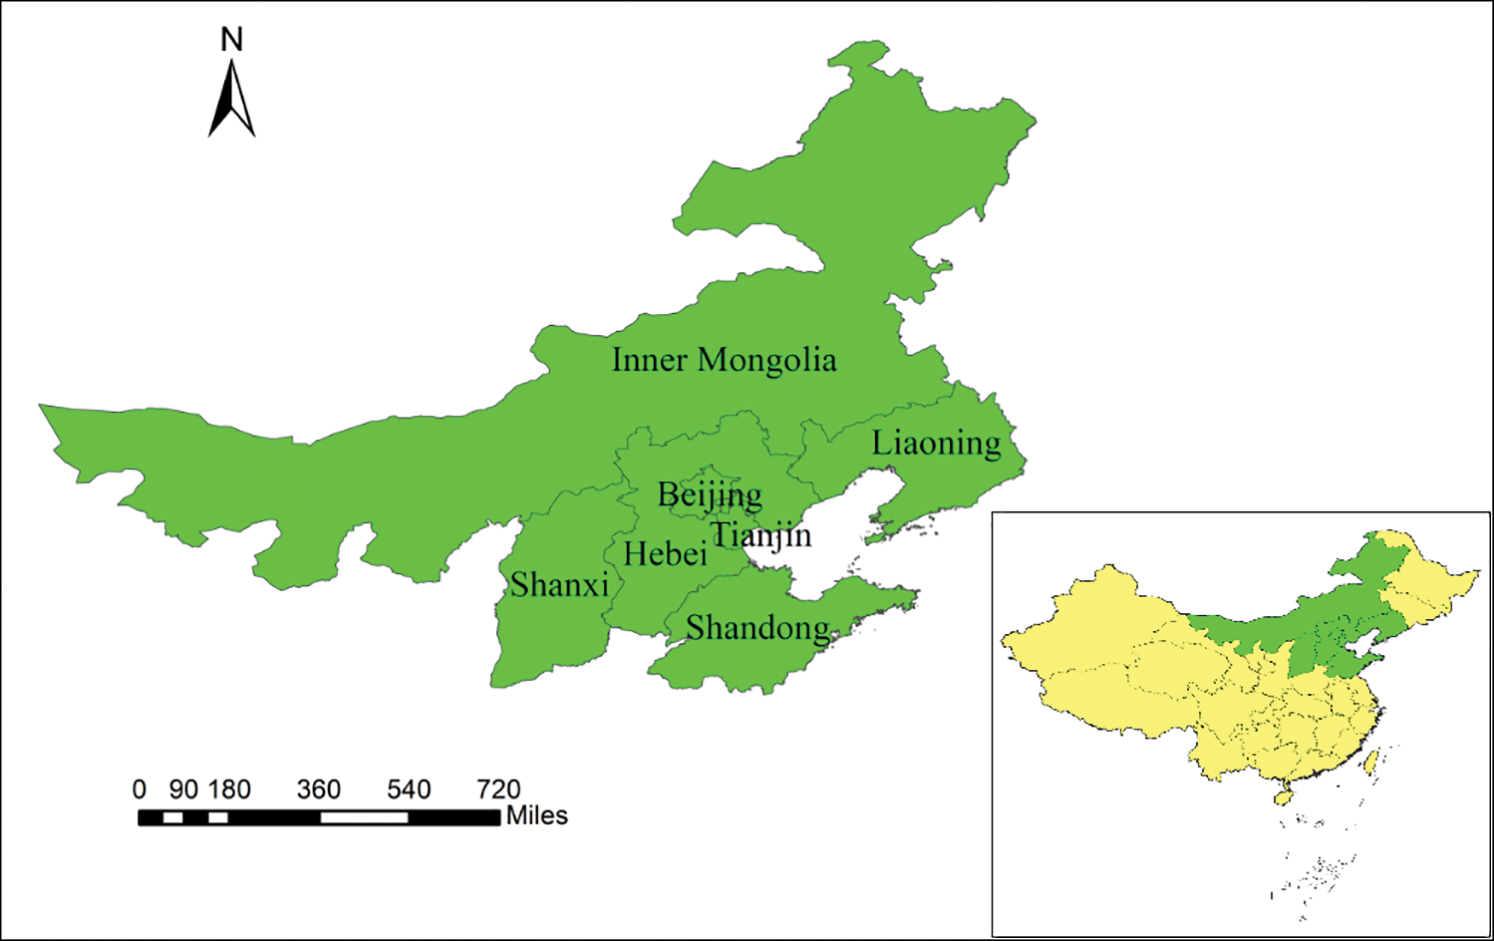
Figure 1: The geographical position of the BREC in China
In addition, industrial coupling coordination is an important factor affecting the two factors—industrial development and economic growth, which are important factors affecting carbon intensity. Therefore, there may be a connection between the industrial coupling coordination and carbon intensity. And coordinated level between industries may influence the carbon emission structure by influencing the industrial structure and the energy consumption structure within the industry, thus influencing the carbon emission reduction. Therefore, dealing with the relationship between the twin peaks requires a positive interaction between all industries in the BREC. This has profound implications for economic growth and environmental sustainability.
The BREC is taken as the research object of this study. Our study confirms that industrial coupling coordination is negatively correlated with carbon intensity in this region. It is anticipated that our research results will enrich other studies concerned with the correlation between industrial coupling coordination and carbon intensity in China, and will provide a valuable reference for the overall coordinated development of the BREC and different countries in the world. The remainder of this study is organized as follows: Section 2 presents the literature review; Section 3 describes the method, model, data sources, and index system; Section 4 explains the data calculations and presents the results; Section 5 provides the conclusions and policy implications; and Section 6 summarizes the discussion points.
2.1 Traditional and High-Tech Industries
Previous studies on traditional and high-tech industries can be divided into two categories: one category focuses on traditional or high-tech industries in isolation, and the other focuses on the relationship between the two industries. The research on high-tech industries has mainly focused on their evaluation using many different methods. Chen et al. [1] examined the innovation performance of high-tech industries in China using the data envelopment analysis method. Zhang et al. [2] comprehensively assessed the competitive force of the high-tech industries of Fujian Province. He et al. [3] assessed the high-tech industrial competitiveness in Chinese provinces by applying factor analysis. Gao [4] took the upgrading of the coal industry as an example to analyze the mechanisms of sustainable development. Wang and Wang [5] assessed the competitive power of the high-tech industries of China with an improved TOPSIS method. Taking Longjing Industrial Zone as an example, Pan et al. [6] mainly investigated the upgrading of the old industrial area to study the effect of the implementation of the new revitalization policy. Wang et al. [7] constructed a framework for evaluating the effectiveness of technological innovation in high-tech industries by applying two-stage network data envelopment analysis. The research on traditional industries has mainly focused on transforming and upgrading the industries. Li [8] analyzed the impact of the producer service sector on the upgrading of the manufacturing industry sector by constructing a two-sector model. Zhai et al. [9] concentrated on the factors that affect the clean development of the manufacturing industry under environmental regulations.
Currently, a lot of studies have focused on the relationship between the new high-tech industries and traditional industries. Chakrabarti et al. [10] proposed that emerging and traditional industries could integrate and develop together. Mendonca [11] challenged the assumption that traditional industries could not partner with high-tech industries; he proposed that traditional industries could be transformed into high-tech industries through technological diversification. Arbuthnott et al. [12] found that there were indications of acceptance and integration between the newly created and old industry participants based on the dialectic interaction between the industries. Zhu et al. [13] proposed that industrial planning and policies accelerating the development of high-tech industries create enabling environments for cultivating the new industries and high-end services, so that the zero-emission high-end industries will displace the high-emission low-end industries.
2.2 Industrial Structure and Carbon Intensity
Studies in recent years have shown that optimizing and upgrading industrial structures can reduce the carbon intensity. By analyzing the relationship between the industrial structural transformation and carbon dioxide emissions in China, Zhou et al. [14] concluded that optimizing and upgrading industrial structures can reduce carbon emissions. Zhang et al. [15] studied the effect of changes in the industrial structure on China's carbon intensity by adopting panel data and ARDL( autoregressive distributed lag method), and they proposed that increasing the proportion of the tertiary industry was extremely beneficial to curb carbon intensity. Zheng et al. [16] proposed the determinant factors of China’s provincial carbon intensity by using a dynamic spatial panel model, and the conclusions showed a positive correlation between carbon intensity and secondary-sector share. Yao et al. [17] found that transferring highly energy-intensive enterprises from the east to the west of China cannot solve the problem of carbon emissions; instead, policies should be used to guide China to improve its industrial structure fundamentally, and then reduce the carbon intensity. By applying a dynamic spatial panel data model, Cheng et al. [18] analyzed the impact of industrial restructuring and technology development on carbon intensity, and the conclusions indicated that although optimizing and upgrading industrial structures are beneficial to lower carbon intensity, technological progress is the most important factor in China. Xiao et al. [19] drew the conclusion that the secondary industry was significantly less carbon-friendly than the service industry by comparing and analyzing the total-factor carbon emission performance in 2016. Benjamin et al. [20] proposed that the industrial structure can be optimized and upgraded by developing targeted high-tech metallurgy industries and gradually phasing out the low-end industries to reduce carbon dioxide emissions. Zhang et al. [21] proposed that market integration can, to some extent, enhance technological innovation and the effects of emission-reduction, and at the same time, it can achieve effective carbon emission reduction through industrial optimization policies.
2.3 Possible Academic Contribution
As one of China’s high carbon-emission regions, achieving coordinated emission reduction in the BREC has important significance for accomplishing the national carbon emission reduction target. However, few researchers have focused on industrial coupling coordination and carbon emission reduction in this region. And many similar studies on industry coordination have focused on the whole country; there have not been as many focused on the regional level. Moreover, existing research has focused on the impact of optimizing and upgrading industrial structures on carbon intensity; there not many studies have analyzed the correlation between industrial coupling coordination and carbon intensity. The possible innovation of this study in comparison with existing studies lies in the following aspects. (1) This paper establishes the evaluation system to study the spatiotemporal evolution characteristics of the new high-tech industries and traditional industries in the BREC. (2) By constructing the coupling degree and the coupling coordination degree model, this paper studies the difference of the coordination level of two kinds of industries in different provinces of BREC and the driving effect of high-tech industries on the upgrading of traditional industries. (3) It studies the relationship between the industrial coupling coordination degree of both types and carbon intensity.
3 Model Specification and Index System
The concept of coupling comes from physics, and it means the mutual effect between several systems or motion forms. The degree of industrial coupling is often used for measuring the degree of inter-industrial coupling. The comprehensive evaluation index can be calculated using the principal component analysis method [22], and it is written as shown below:


where  and
and  refer to the comprehensive evaluation functions of the new high-tech industries and traditional industries, respectively. ai and bj are the principal component contributing rates extracted by principal component analysis. They represent the weight of the evaluation index of the new high-tech industries and traditional industries, respectively.
  and
and  represent the principal component scores of subsystems of the new high-tech industries and traditional industries, respectively [22].
According to the capacity coupling system model in physics, a small deviation coefficient indicates a high degree of coupling. The formula of the deviation coefficient is shown below:

where k is the coordination coefficient; since the model contains two subsystems, k = 2. C is the coupling degree.  and
and  refer to the comprehensive evaluation function of the new high-tech industries and traditional industries, respectively, which reflects the level of comprehensive development of these two subsystems.
3.2 Coupling Coordination Degree Model
In the above deviation coefficient formula, C is a good reflection of the degree of coordination between the two subsystems; however, it does not reflect the overall level of coordinated development. For example, the development level indexes of the traditional industries and new high-tech industries in one region may both be low, while these in another region may both be high, but the degree of coordination may be the same in the above two situations. In order to account for this defect, the concept of the coupling coordination degree is put forward. This concept involves adding the measurement of the whole level based on measuring the degree of coordination between the elements in order to reflect the total function [23]. We establish the following model:


where D refers to the degree of coupling coordination ranging between 0 and 1, T represents the comprehensive coordination development index, and α and β are both undetermined weights. The determination process is analyzed in detail below. A high D value indicates a higher level of coordinated development of the high-tech industries and traditional industries; conversely, a low D value indicates a lower level of coordination [24,25].
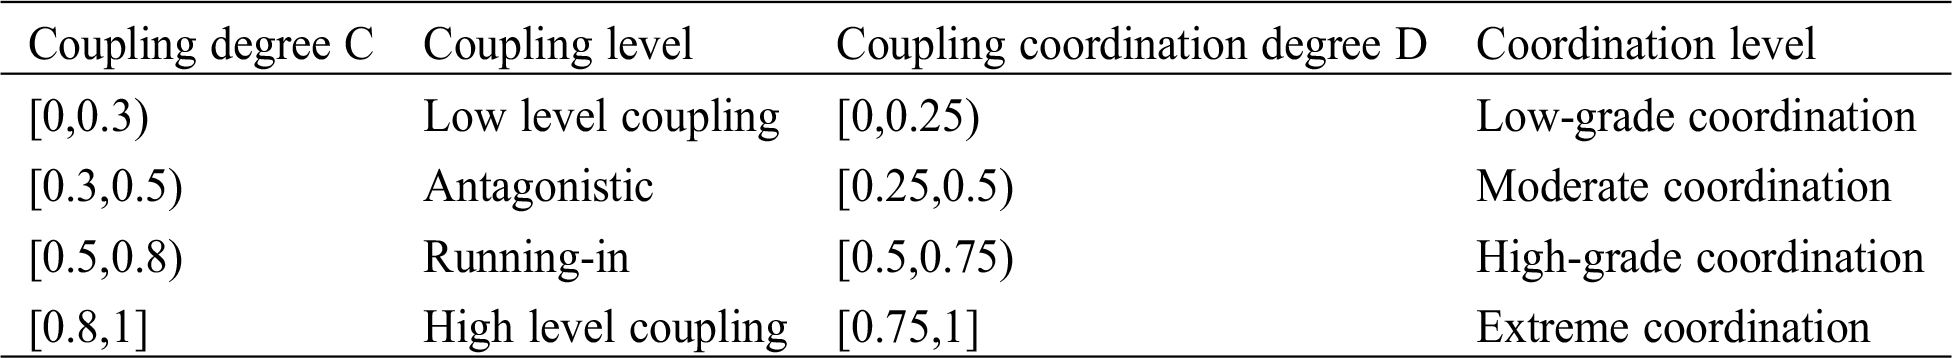
Based on the previous research results and studies on the coupling and coupling coordination [26–29], the degree of coupling and coupling coordination are divided into four levels as shown in the following table (Tab. 1).
Table 1: Classification criteria of the degree of coupling and coupling coordination
3.3 Establishment of the Evaluation Index System
3.3.1 New High-Tech Industries
This study takes the standard set by the OECD (Organization for Economic Cooperation and Development) to classify high-tech industries. According to this standard, a new high-tech industry (manufacturing) is a manufacturing industry with a relatively high intensity (i.e., the expenditure proportion in the main business income) of research and development (R&D) in the national industrial economy. The standard includes six major types: Pharmaceutical manufacturing, aerospace and equipment manufacturing, electronic and communication equipment manufacturing, computer and office equipment manufacturing, medical equipment and instrumentation manufacturing, and chemical manufacturing.
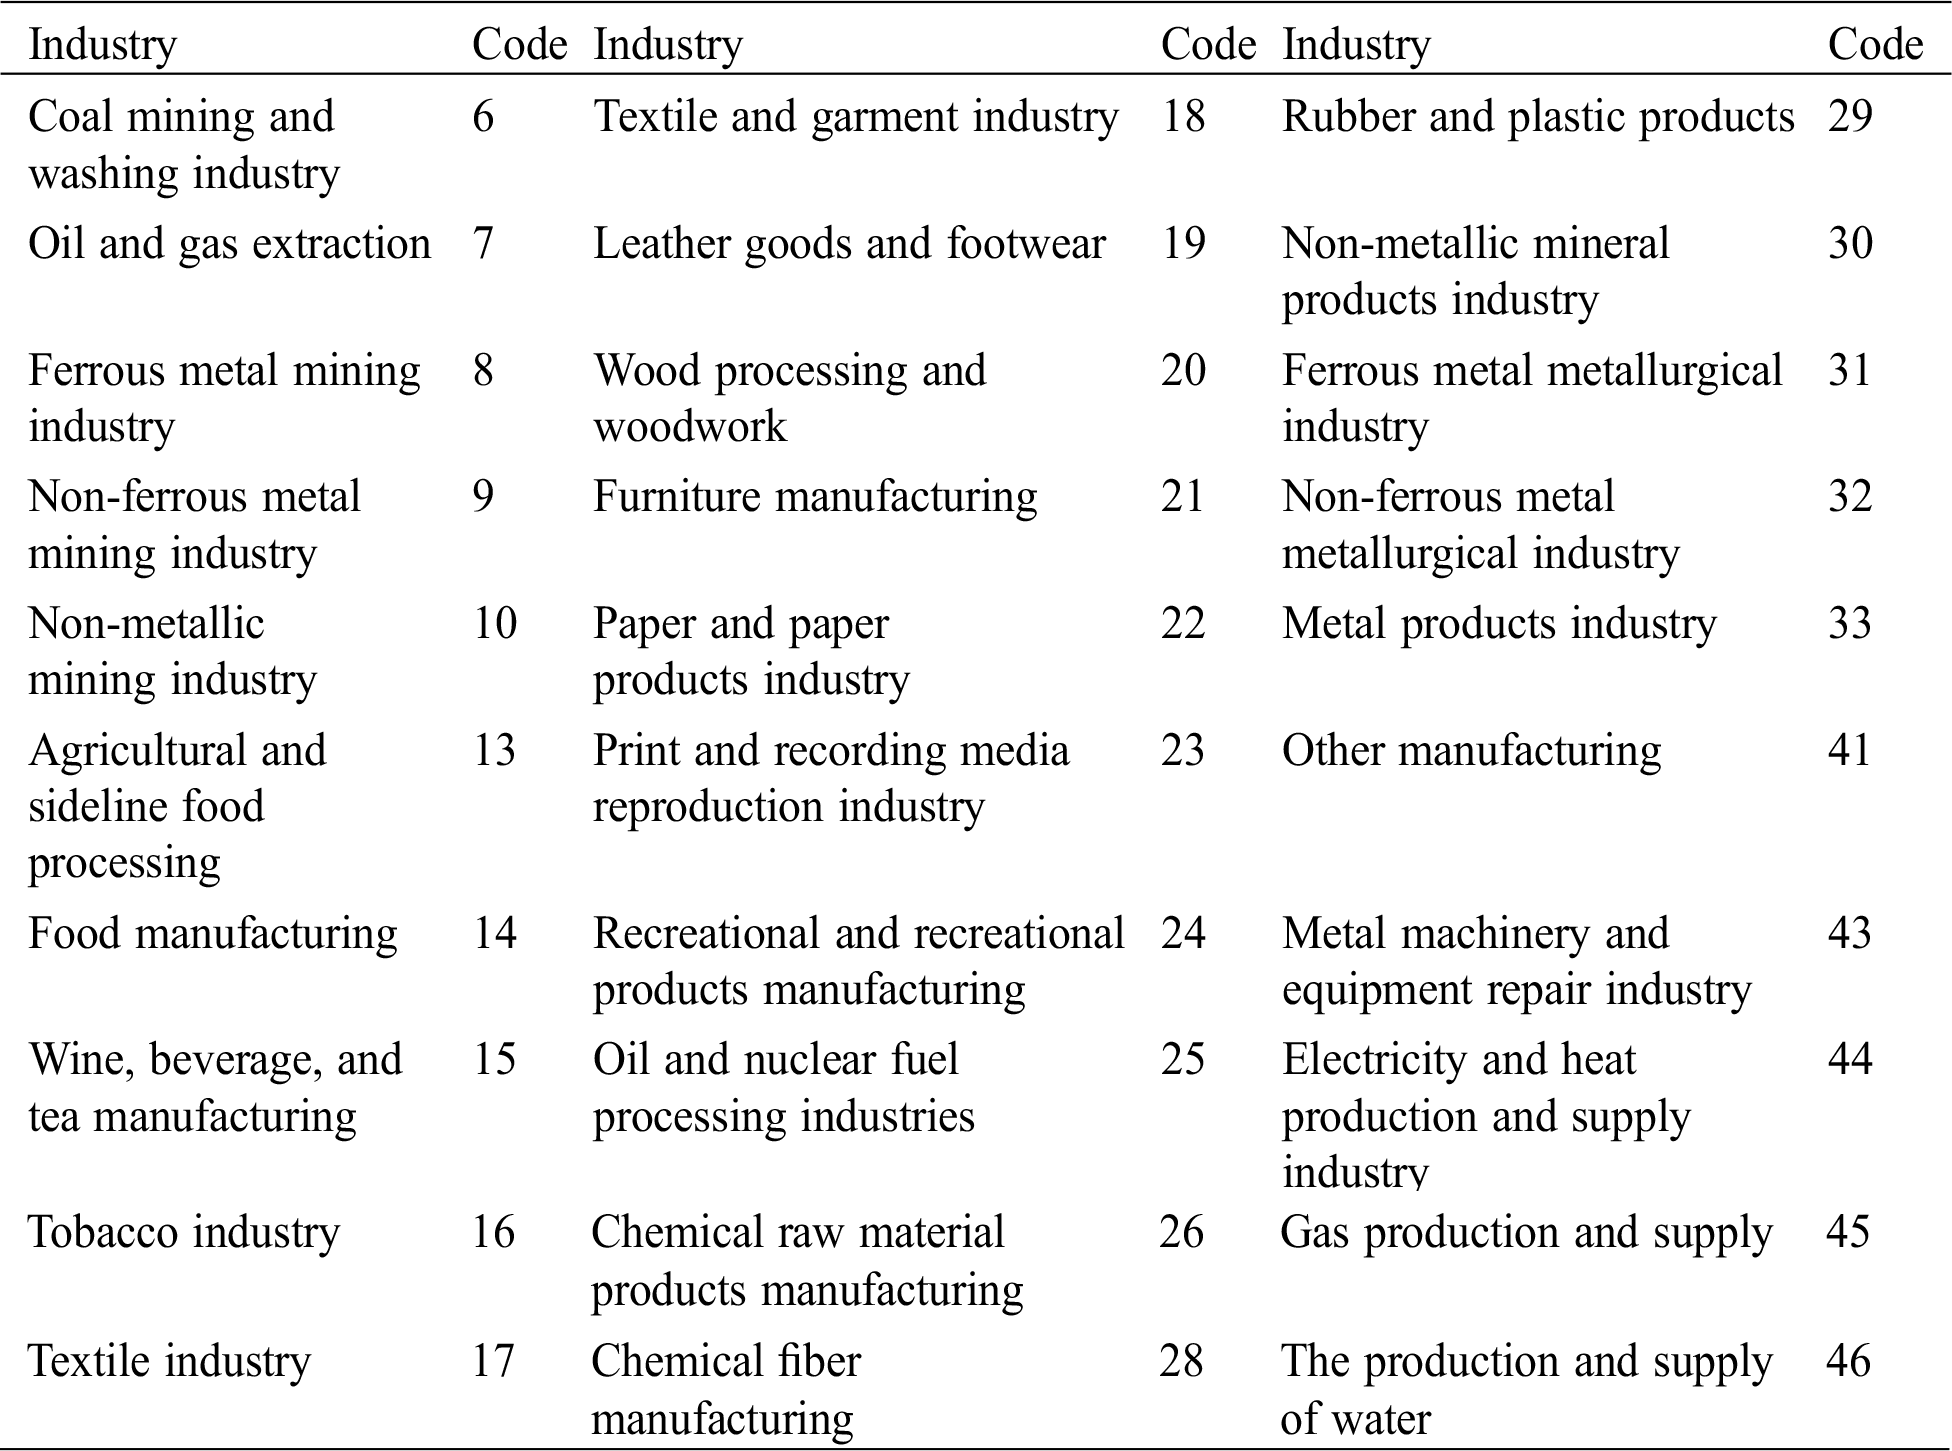
Because of China's specific national conditions, the selected traditional industries were all developed in the primary stage of industrialization. These were mainly the chemical, textile, light industry, metallurgy, machinery parts, and building materials industries, most of which are statistically classified as segments of the secondary industry. Therefore, this study excludes the industries defined as high-tech from analysis on the basis of the Classification of the National Economy Industry (GB/t4754-2011), such as the pharmaceutical manufacturing industry, computer communications and other electronic equipment manufacturing industry, instrument manufacturing industry, and other industries. We took the coal mining and washing industry, oil and natural gas extraction industry, ferrous metal mining industry, and 30 other industries as the representatives of the traditional industries (see Tab. 2).
Table 2: Classifications and codes of traditional industries
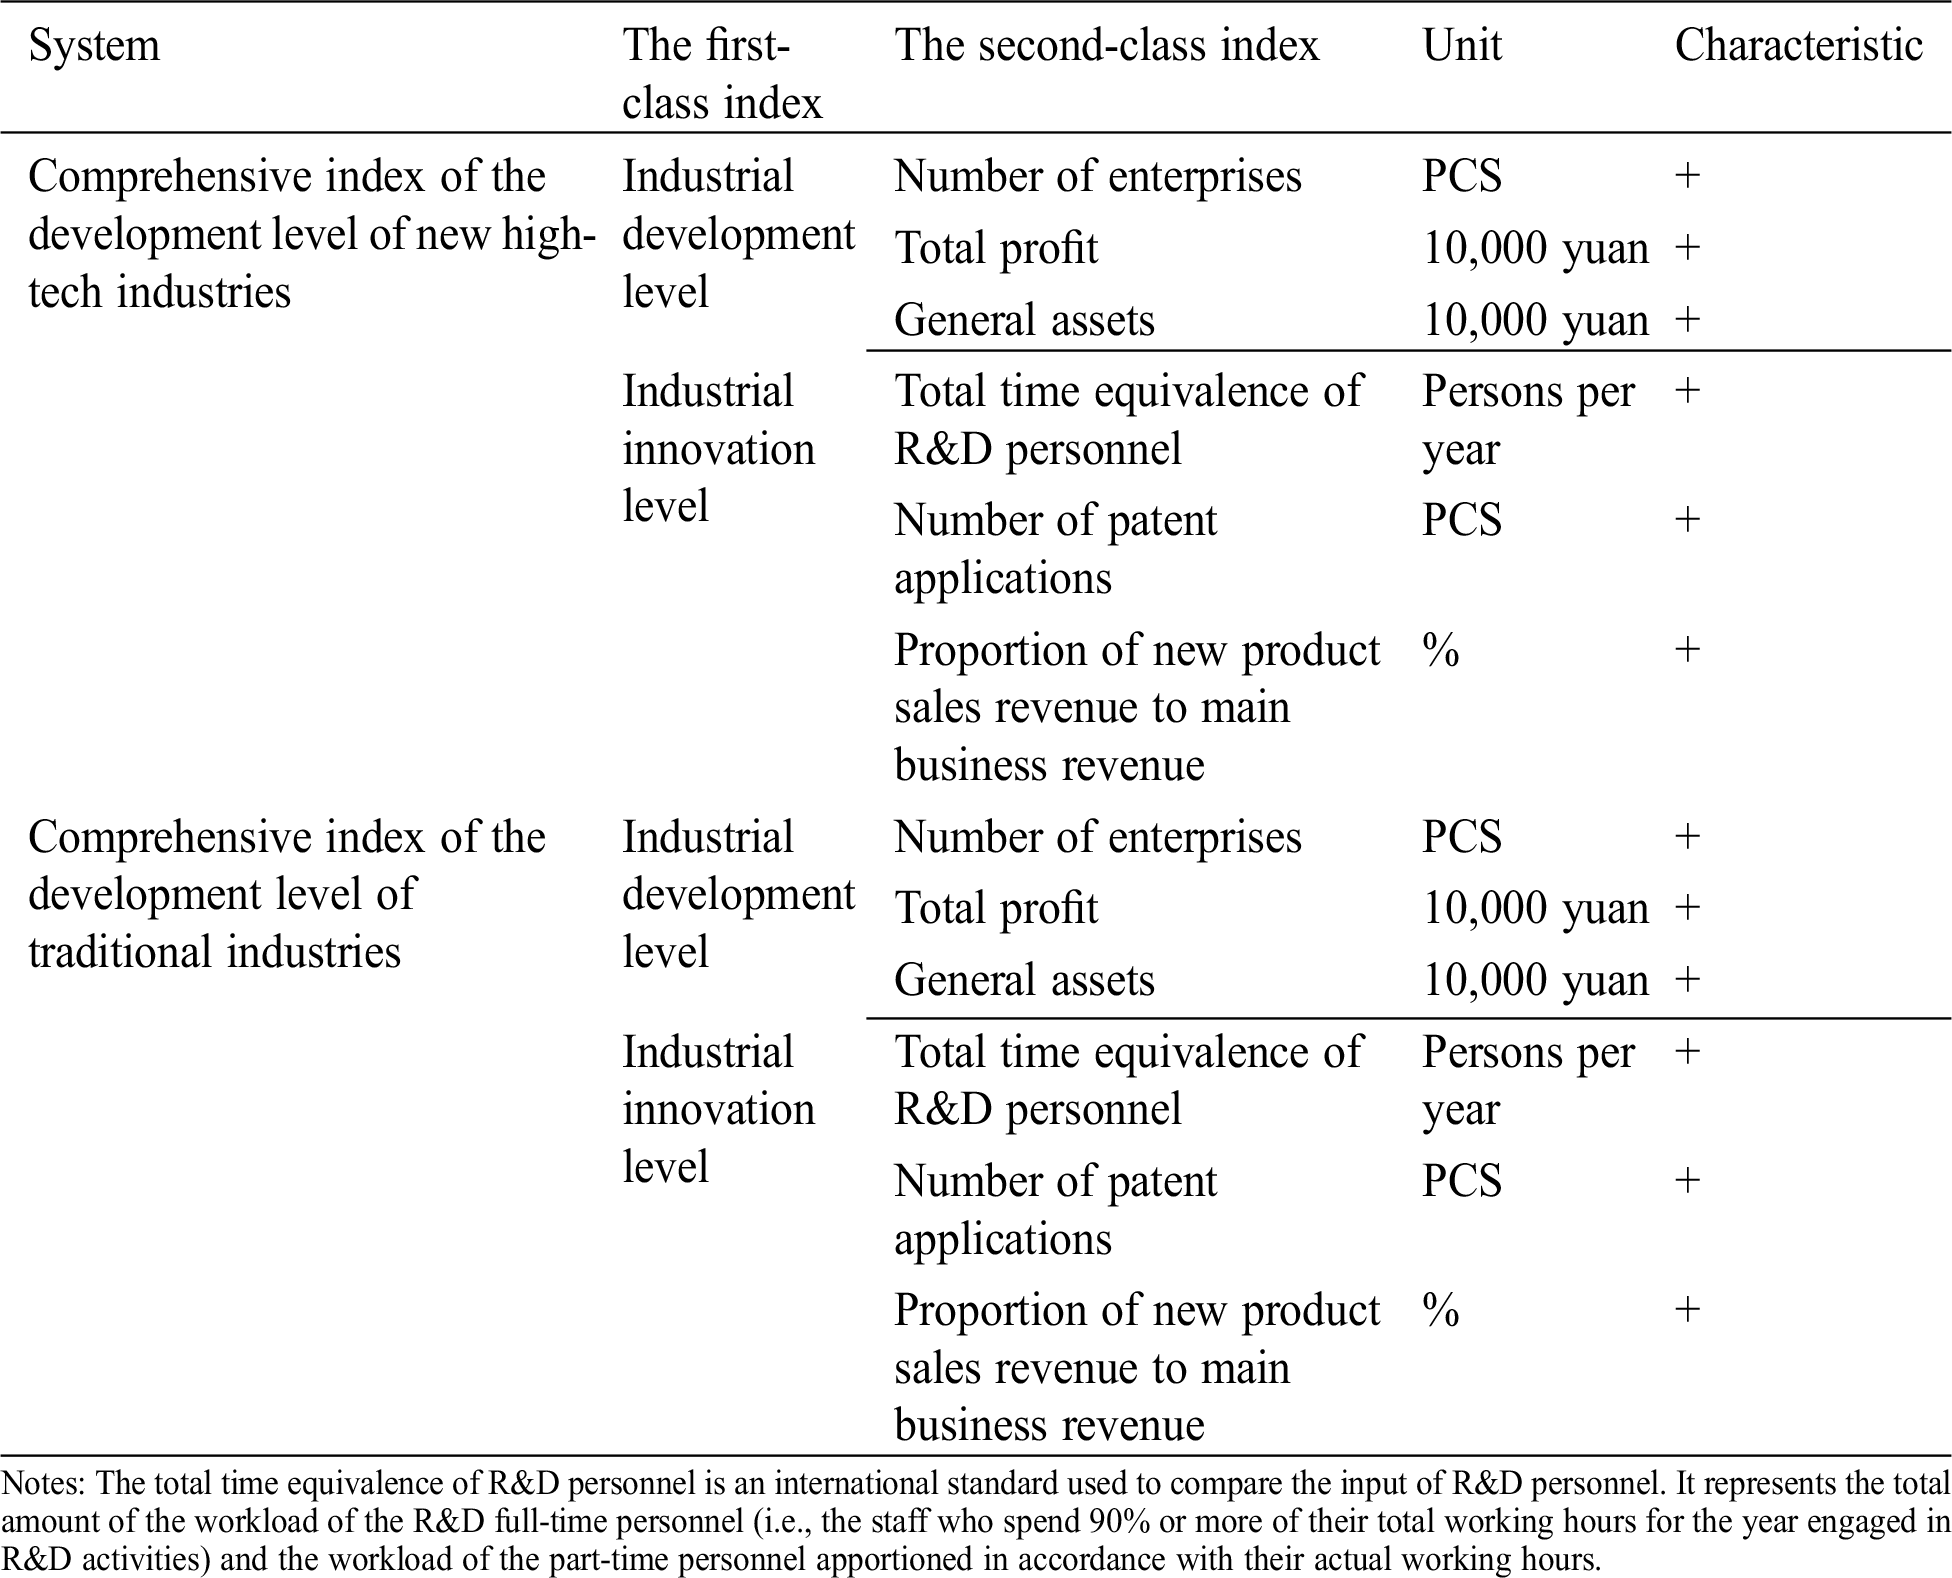
On the basis of references [30,31], the study has established the following evaluation index system: the level of industrial development and the level of industrial innovation. The level of industrial development reflects the scale and benefits of the two types of industries, while the level of industrial innovation describes the impact of scientific innovation on the technical progress of the two categories as shown in Tab. 3.
Table 3: Subsystem index construction of new high-tech industries and traditional industries
The data for the high-tech industries and traditional industries came from the EPS Data Platform China New High-tech Industry database, EPS Data Platform China Science and Technology database, China Statistical Yearbook, and China Science and Technology Statistical Yearbook.
Carbon intensity is the carbon emission per unit of GDP, so accurately measuring regional carbon dioxide emission is the key of this paper. The international carbon emission data are mainly from official statistics. But there is no official statistical data in China. At present, the most used methods for carbon emission estimation mainly include model estimation method, material balance algorithm, inventory compilation method and measurement method, etc. Most scholars adopt a simple and effective carbon emission measurement method, material balance algorithm. So, this paper also adopts this method to calculate the carbon emission data of BREC. The consumption of energy only accounts for the consumption of various types of energy actually used by each province in the process of social production, excluding the trans-regional transmission of coal, electricity and coke. Based on the statistical data of energy consumption of different regions and varieties in China Energy Statistical Yearbook and the carbon emission estimation method proposed by the Intergovernmental Panel on Climate Change (IPCC), this paper selects eight major energy sources, coal, coke, crude oil, gasoline, kerosene, diesel, fuel oil and natural gas, to calculate the carbon emission of each province. The formula is as follows [32,33]:

where  refers to the CO2 emissions of the region
  ,
,  denote Beijing, Tianjin, Hebei, Shanxi, Inner Mongolia, Liaoning, and Shandong, respectively, and
  represent the coal, coke, crude oil, fuel oil, gasoline, kerosene, diesel, and natural gas, respectively.
  represents energy consumption of the type
  (104 t or 108 m3),
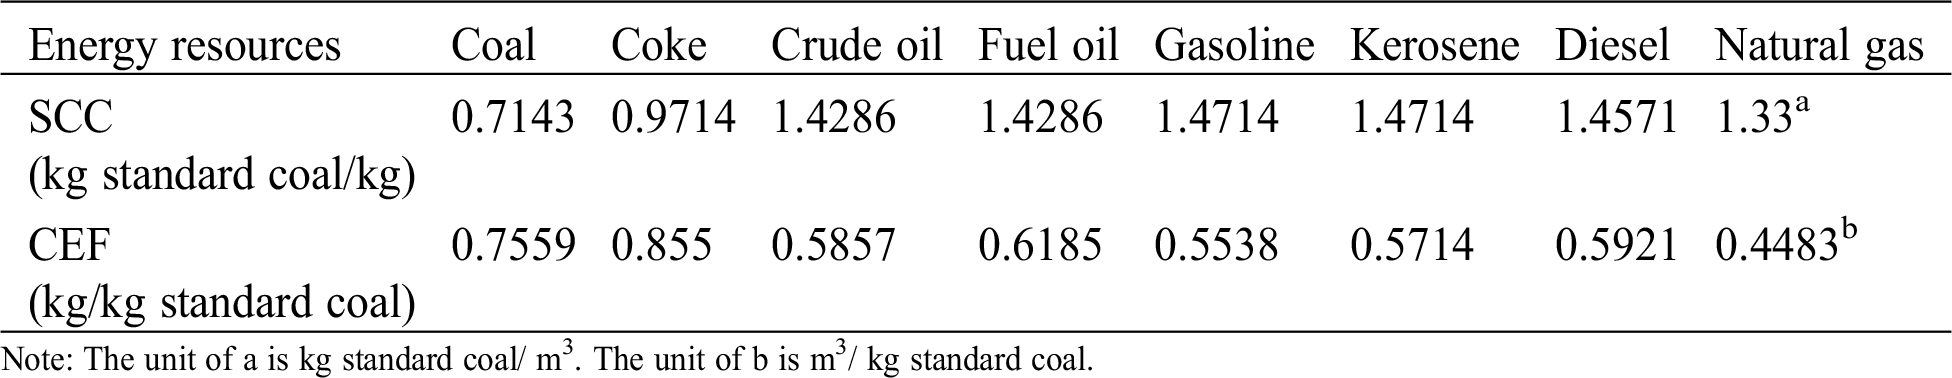
  represents the standard coal coefficient [34], and
  represents the carbon emission factors of the type
  . Reference coefficients are listed in Tab. 4. The carbon intensity (CEI) is the CO2 emissions per unit of the real provincial gross domestic product of region
  in the following formula:

Table 4: The carbon emission reference coefficients
4.1 Degree of Coupling and Coupling Coordination
The high-tech and traditional industries systems are both composed of multiple indexes, and the dimensions of each indicator are not uniform. Therefore, the first step is to eliminate the influence of the dimensions by standardizing the raw data. We assume  and
and  indicate the raw and the standardized value of index
  in industry
  , respectively.
The positive index is processed using formula (a), and the negative index is processed using formula (b). A high value of the positive index indicates better system; a lower value of the negative index indicates better system.
For the positive index: 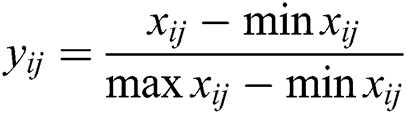 (a)
(a)
For the negative index: 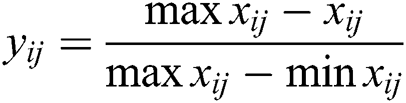 (b)
(b)
where  and
and  refer to the maximum and minimum value, respectively.
4.1.2 Calculation of the Comprehensive Evaluation Index
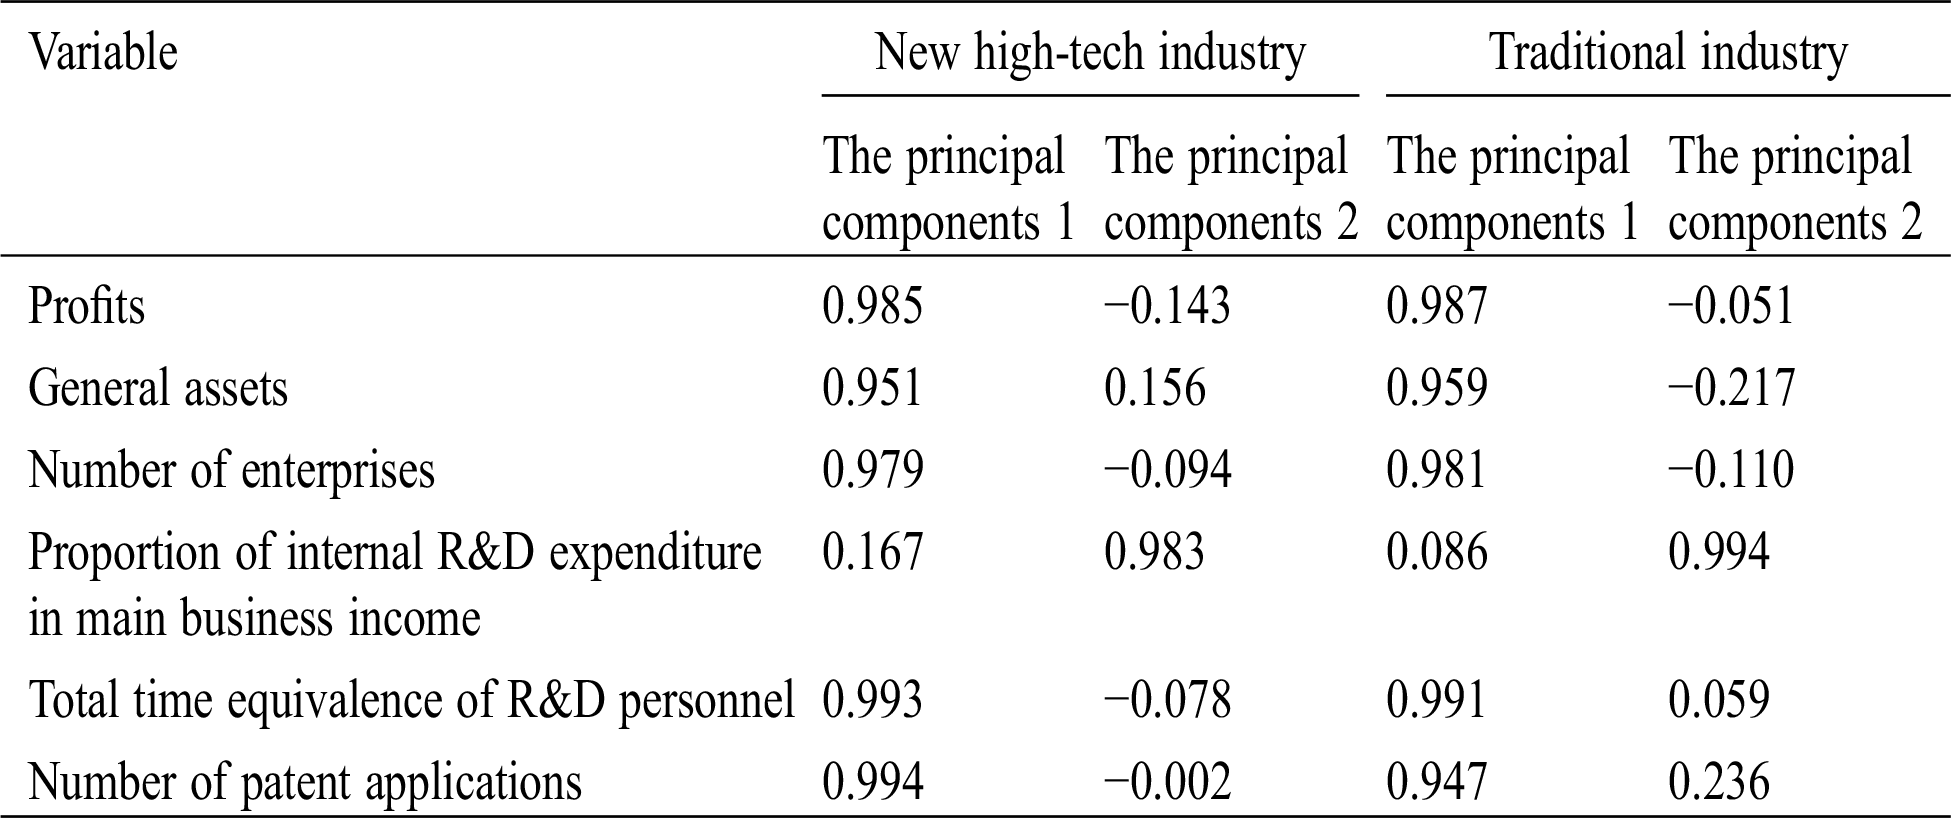
We used the calculation process of the comprehensive evaluation index of the high-tech industries and traditional industries in 2016 as an example. SPSS software was used to do the principal component analysis of the standardized data of the high-tech industries and traditional industries. First, the Kaiser-Meyer-Olkin (KMO) value test was carried out on the high-tech industries and traditional industries systems, and it is found that the KMO values of both systems are higher than 0.6 and pass the Bartlett spherical test, so principal component analysis could be conducted. In addition, the contribution rates of the cumulative variance of the first two principal components of each system in 2016 (see Appendix A) were both more than 85%, so the two principal components extracted from each system reflected the main information of the original indexes. We could then obtain the score coefficient matrices of the two systems (see Appendix A).
The comprehensive evaluation indexes of the high-tech and traditional industries were constructed. The variance contribution rate was taken as the weight, and the corresponding principal component score value of each system was taken as the variable.
 where
where and
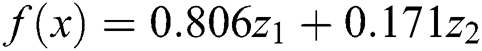
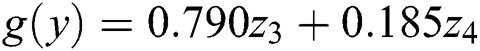
and  refer to the comprehensive evaluation index of the high-tech and traditional industries, respectively. Z1 and Z2 and Z3 and Z4 represent the first and second principal component scores of the development of the high-tech and traditional industries, respectively. Z is calculated by the score coefficient of the principal component and the standardized value of the corresponding raw variable. The formula is shown below:


Accordingly, the comprehensive evaluation index of the high-tech and traditional industries systems in 2016 was calculated. Similarly, the comprehensive evaluation index of the two systems in 2011 was calculated; the calculation process is not listed because of space limitations.
4.1.3 The Determination of α and β
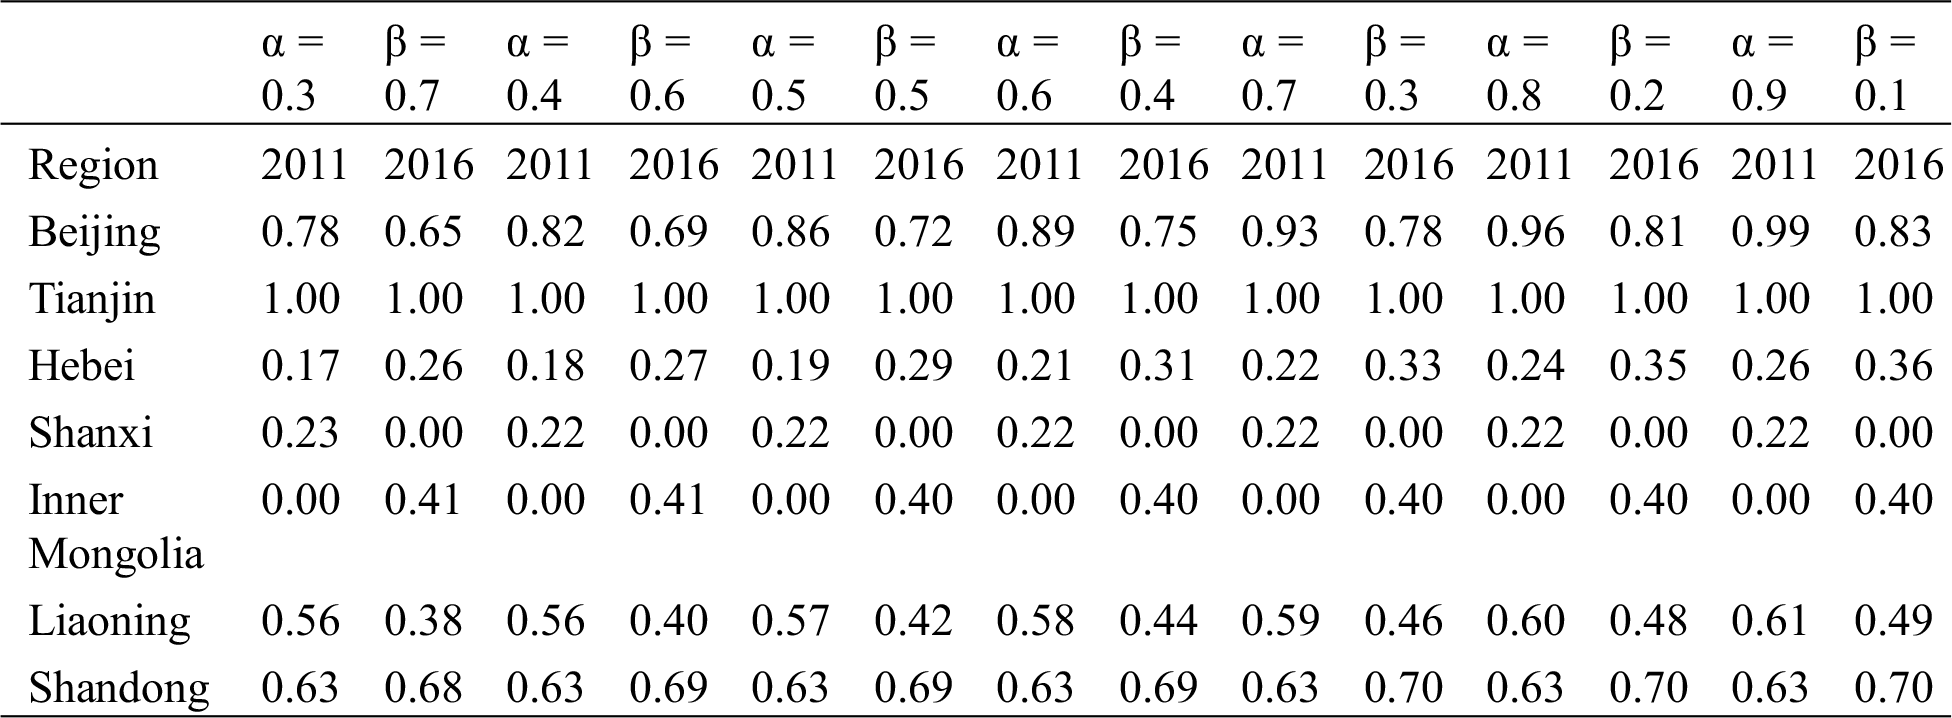
When studying the coupling coordination of the two subsystems, the literature review indicates that α and β should both be given an equal value of 0.5 if the two subsystems are considered to have the same degree of importance. For the purpose of exploring the influence of different values of the two factors on the degree of coupling coordination (see Appendix B), this study uses the exhaustive method to examine different scenarios. Considering that the high-tech industries represent an important economic growth point in the new normal period, the weight should not be too low, so 0.3–0.9 was selected for the calculation.
The results showed that the values of α and β had little effect on the coupling coordination. For example, when α = 0.4, β = 0.6 and α = 0.5, β = 0.5, it was found that there was little difference in the degree of coupling coordination. However, considering that the BREC is still dominated by traditional industries, the high-tech industrial share in the economic structure was low, and the two are actually not equally important, so the results produced by α = 0.4 and β = 0.6 were selected for this study [35].
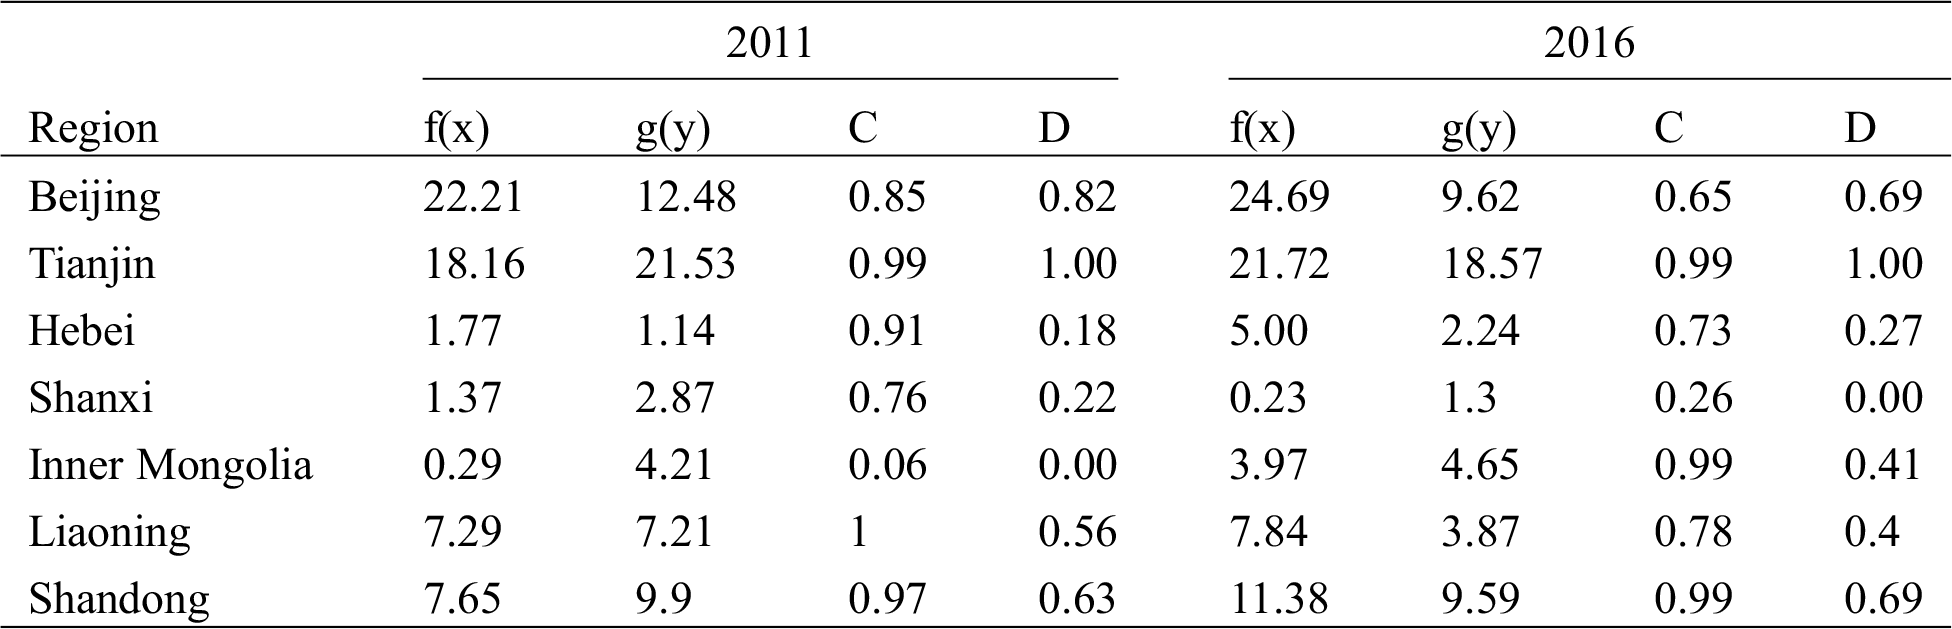
The calculation results of the comprehensive evaluation index, coupling degree, and coupling coordination degree of the two industries can be found in Appendix C.
4.2 Carbon Intensity and Industrial Coupling Coordination
4.2.1 Calculation Results of the Carbon Intensity
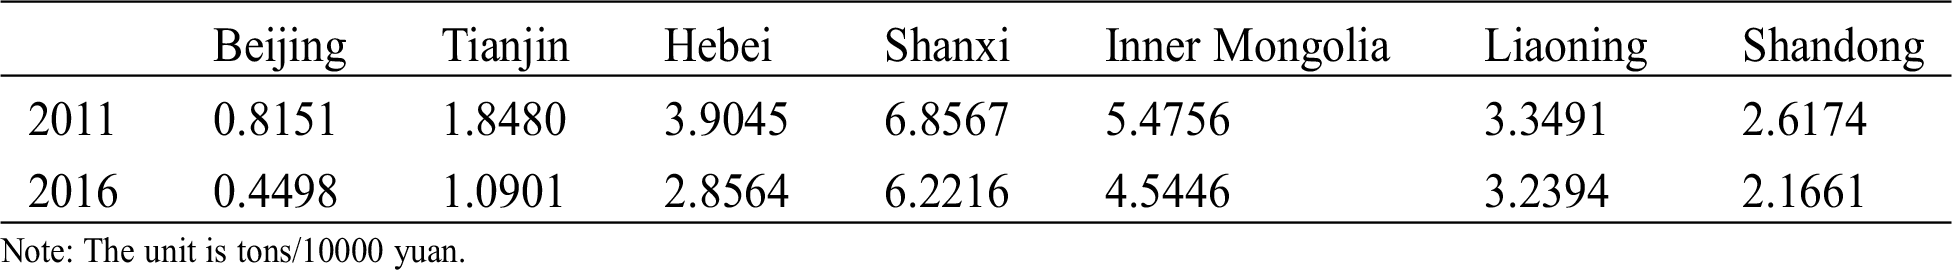
Applying the carbon emission estimation method proposed by IPCC, this study evaluated the total carbon emissions of the BREC on the basis of natural gas, diesel, kerosene, gasoline, fuel oil, crude oil, coke, and coal and then calculated the carbon intensity. The calculation results are shown in the Tab. 5.
Table 5: The carbon intensity of the BREC in 2011 and 2016
4.2.2 Correlation of the Degree of Industrial Coupling Coordination and Carbon Intensity
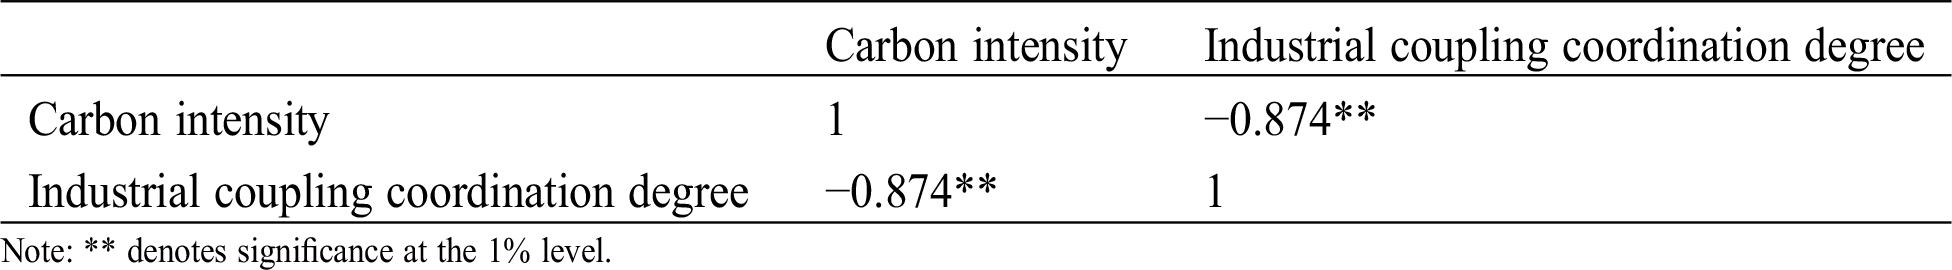
As indicated in Fig. 2, the high-tech and traditional industries in Beijing, Tianjin, and Shandong had a higher degree of industrial coupling coordination and a lower carbon intensity, whereas the industries in Shanxi, Hebei, Inner Mongolia, and Liaoning had a lower degree of industrial coupling coordination and a higher carbon intensity. There seems to be some correlation between the degree of industrial coupling coordination and carbon intensity in the BREC. The Pearson correlation test was further applied to verify the correlation. The results (Tab. 6) indicate that the degree of industrial coupling coordination and carbon intensity are negatively correlated, and the level of the statistical significance reaches 0.01.
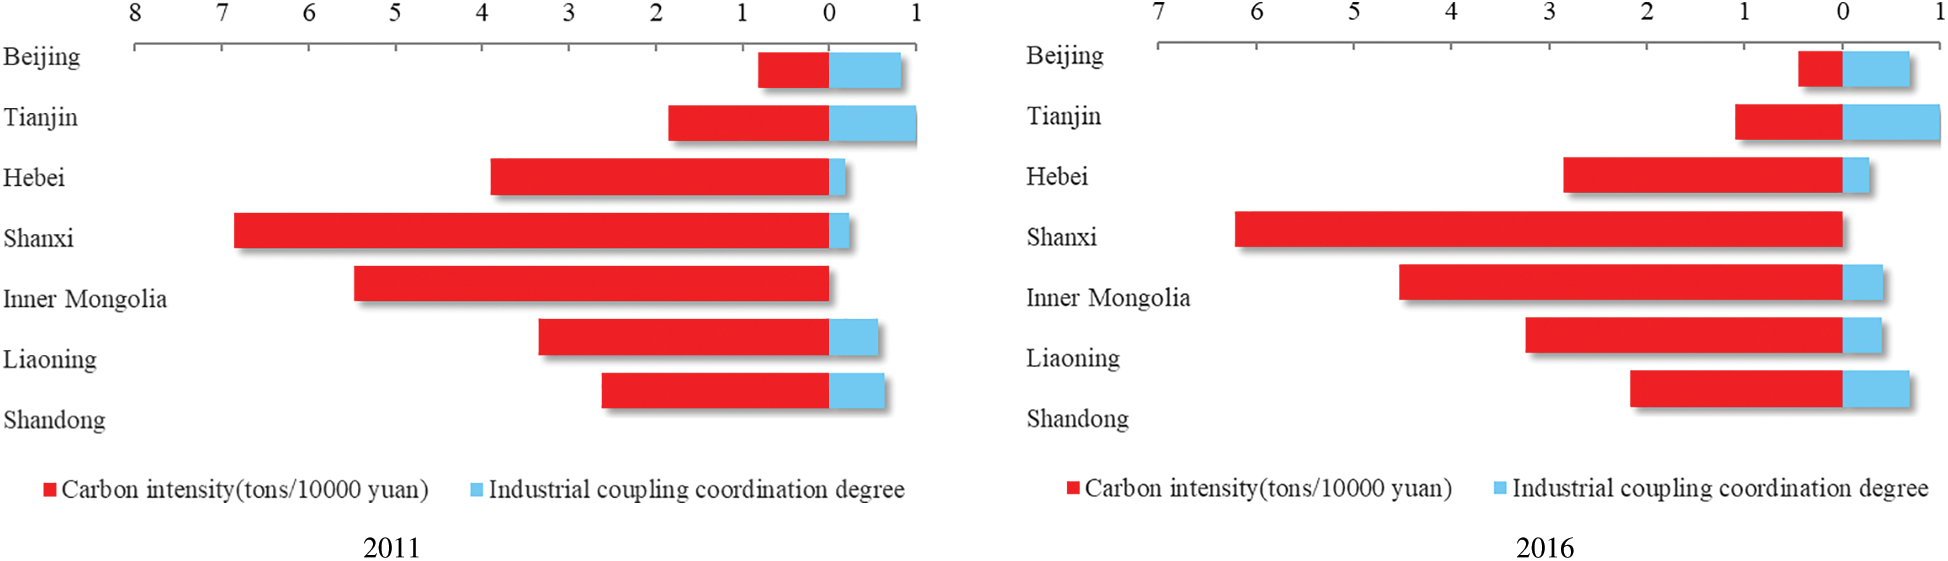
Figure 2: Comparison of the degree of coupling coordination and carbon intensity in the BREC
Table 6: Results of correlation analysis between the degree of industrial coupling coordination and carbon intensity
4.3.1 Different Spatiotemporal Characteristics of High-Tech and Traditional Industries
The comprehensive evaluation indexes of the high-tech industries in Beijing, Tianjin, Hebei, Inner Mongolia, Liaoning, and Shandong all changed positively from 2011 to 2016 (Fig. 3a). Under the influence of the policy of accelerating the development of new high-tech industries and improving the ability of independent innovation, enterprises have become the main body of technological innovation, which has promoted a substantial increase of high-tech industries in Inner Mongolia, from 0.29 in 2011 to 3.97 in 2016. But the overall development level still lagged behind that of the more developed provinces due to the late start and the weak development foundation of high-tech industry in Inner Mongolia. The high-tech industrial development of Liaoning has been slow, with only a 7.54% change in 5 years, which is related to the slow overall development in Northeast China. On the one hand, Northeast China’s state-owned businesses accounted for a relatively large proportion of this low efficiency. On the other hand, with the gradual loss of resource advantages and the serious brain drain problem in recent years, the economic development has lacked momentum in Northeast China. The comprehensive evaluation indexes of the high-tech industries in Shanxi changed negatively; they were down from 1.37 in 2011 to 0.23 in 2016, and the lagging status remains unchanged. Shanxi is relatively remote than other provinces in this region, with inconvenient infrastructure and backward economic development. There are serious problems of talent introduction and brain drain. As a result, the proportion of high-tech industries is too small, the cultivation of the new high-tech industries is insufficient, and technological innovation is lagging.
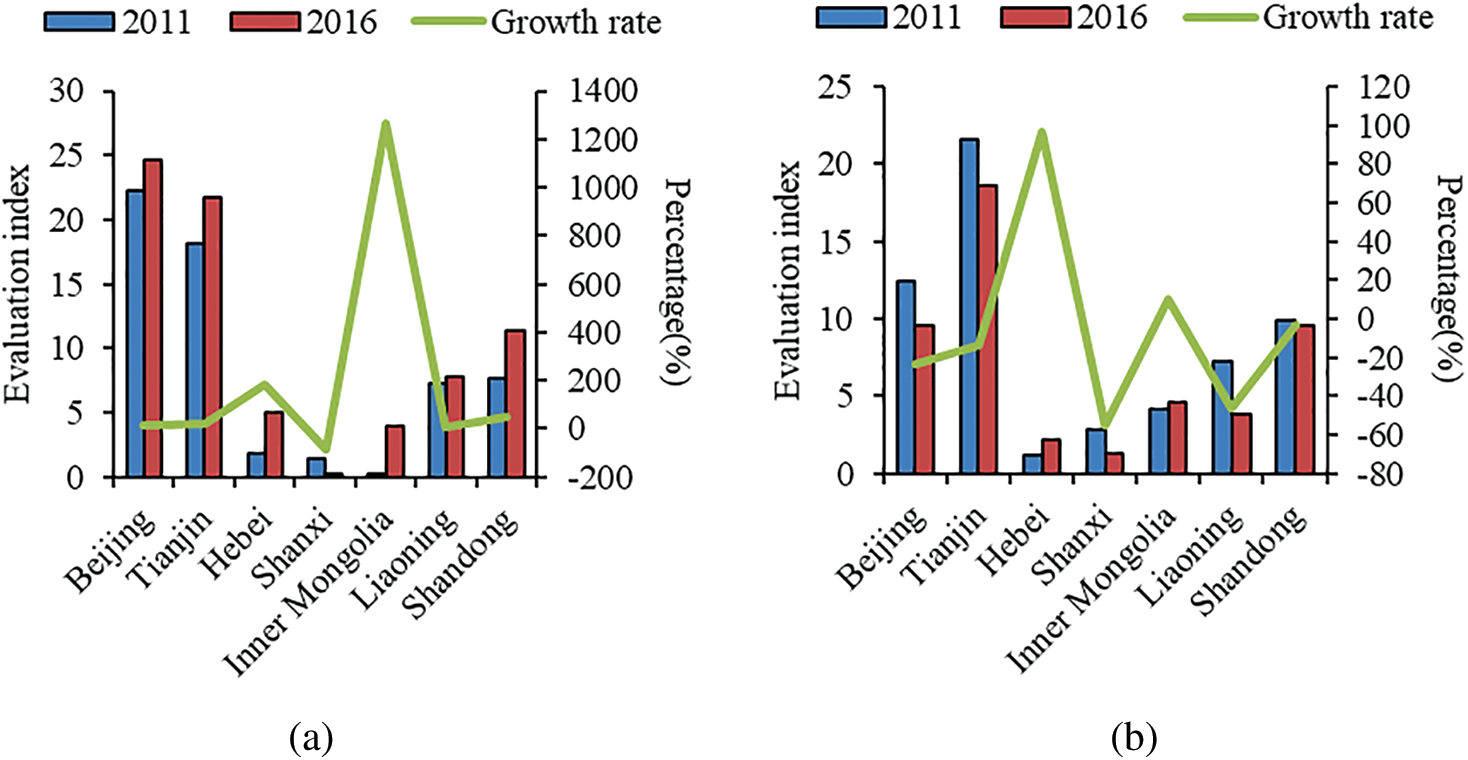
Figure 3: The comprehensive evaluation index in 2011 and 2016. (a) High-tech industries (b) Traditional industries
The highest comprehensive evaluation indexes of the new high-tech industries were in Beijing and Tianjin. As these two municipalities comprise the political and economic center in the BREC, their geographical advantages, policy advantages, and relatively complete infrastructure are a great attraction for high-level talented personnel and foreign investment, which has driven technological innovation and the overall development of the cities. Shanxi and Inner Mongolia had the lowest comprehensive evaluation indexes for the high-tech industries, mainly because resource-intensive enterprises make up a large proportion of their economies, and their technological innovation ability is relatively weak.
The comprehensive evaluation indexes of traditional industries in Hebei and Inner Mongolia changed positively between 2011 and 2016, and those in Beijing, Tianjin, Shanxi, Liaoning, and Shandong changed negatively (Fig. 3b). There are two reasons for this. On the one hand, traditional industries can be transformed into high-tech industries by increasing scientific research and technological innovation, reducing the overall number of traditional industries. This conclusion is consistent with Mendonca’s research that traditional industries could be transformed into high-tech industries through technological diversification. Such changes are positive. On the other hand, many of the backward production facilities have been closed under the dual effect of the visible hand and invisible hand, as a result of the implementation of structural reform on the supply side and the further deepening of marketization in recent years, which has also led to a reduction of traditional industries.
In relation to regional development differences, the traditional industrial development levels in Beijing and Tianjin are still obviously better than those in other provinces, whereas those in Hebei and Shanxi are relatively backward. As the core provinces in the BREC, Beijing and Tianjin have unique geographical and policy advantages. And there is a siphon effect in the region, which is conducive to gathering various advantages and promoting the industrial development level and industrial innovation level. Because Hebei is located in the Beijing-Tianjin-Hebei economic circle, the siphon effect of Beijing and Tianjin on Hebei is more obvious than other provinces in the BREC. As a traditional resource-dependent province, Shanxi has a relatively single economic structure, which is mainly based on energy and raw material production. Under the downward trend of economy, the development of resource-dependent industries is difficult in Shanxi.
4.3.2 Different Spatial Evolution Pattern of Industrial Coupling Coordination Degree in Different Provinces
The degree of coupling (see Appendix D) only reflects the degree of correlation between the two indexes; however, some provinces with a low comprehensive evaluation index in respect of their high-tech and traditional industries also reached a high level of coupling. Therefore, this section focuses on the coupling coordination index. And the classification criteria of industrial coupling coordination degree is shown in Tab. 1.
As indicated in Fig. 4, there were three provinces with low-grade coordination between the development of the high-tech and traditional industries in 2011, namely Hebei, Shanxi, and Inner Mongolia. There were two provinces with high-grade coordination and two provinces with extreme coordination in 2011. The number of low-grade coordination provinces fell to one in 2016. Hebei and Inner Mongolia were elevated to moderate coordination in 2016, which indicates that the industrial restructuring had an impact. This might result in the rapid development of high-tech industries in these provinces, and the traditional industries may be upgraded to high-tech industries by increasing their scientific research and technological innovation. Because of the low level of development of high-tech and traditional industries, Shanxi was still a low-grade coordination province in 2016. In recent years the upgrading of low-end manufacturing and energy-dependent enterprises in Shanxi has been difficult. This is because the proportion of high-tech industries is too small, the cultivation of the new high-tech industries is insufficient, and technological innovation is lagging. Industrial coordination level was best in Beijing, Tianjin, and Shandong in 2016. Because the high-tech and traditional industries had reached higher coordination levels, the two industries achieved high-grade coordination and entered onto a benign development pathway. The high-tech industries have already become an important growth pole of regional economic development. The high-tech industries in the three provinces showed a positive change, but the traditional industries showed the opposite. This indicates that high-tech industries have driven the development of traditional industries, and some traditional industries have also been transformed and upgraded with the help of emerging technologies.
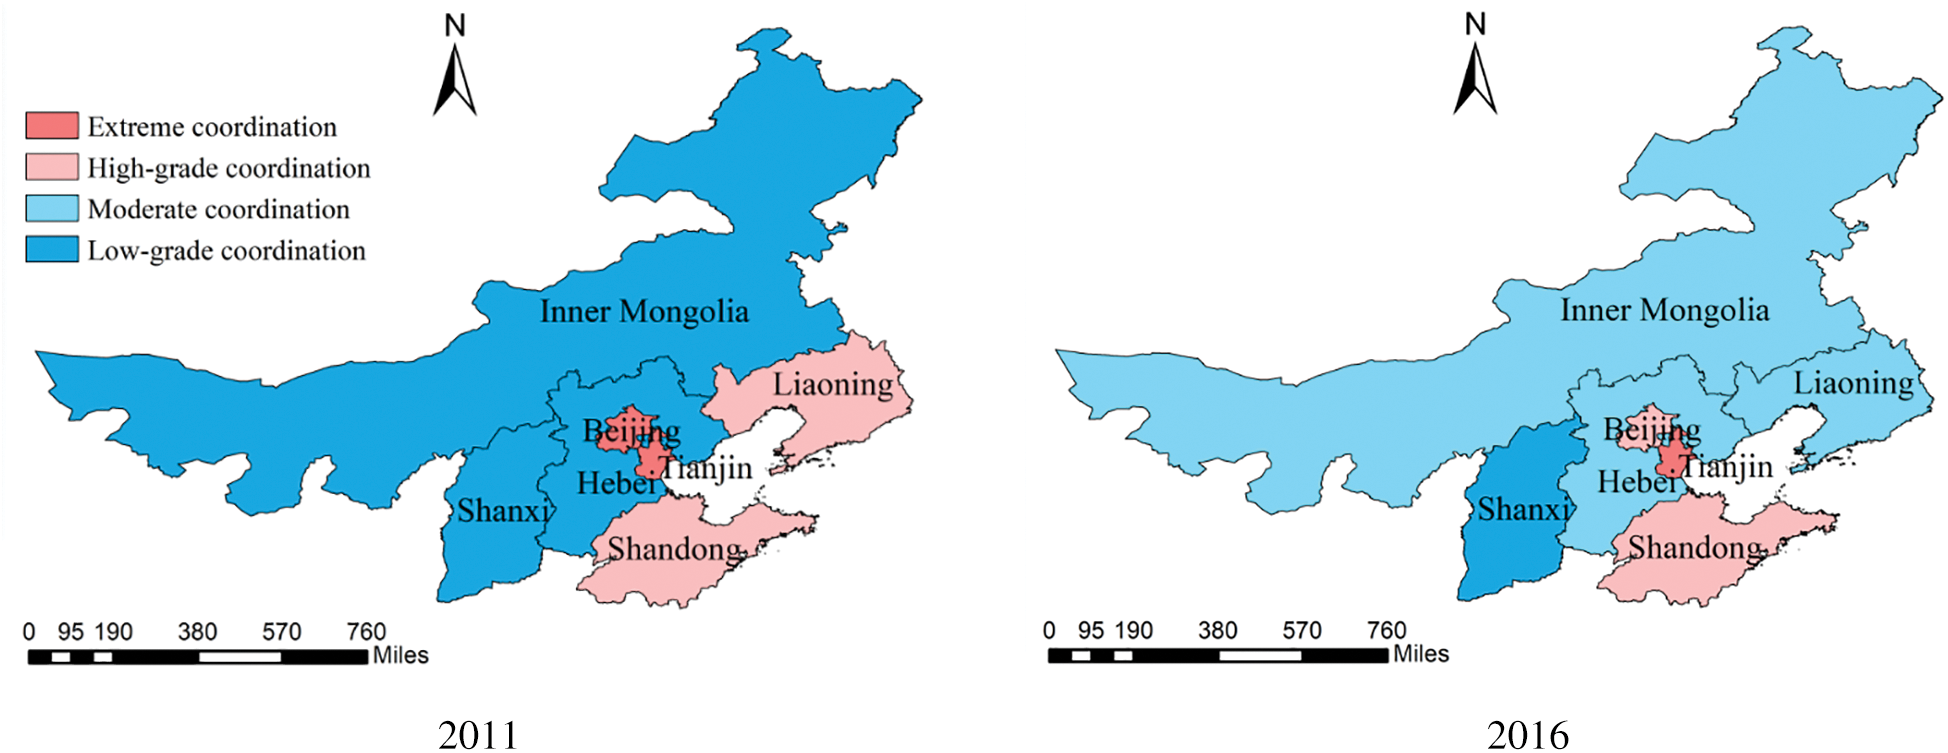
Figure 4: Spatial evolution pattern of the degree of industrial coupling coordination of the BREC
4.3.3 Negative Correlation between the Degree of Industrial Coupling Coordination and Carbon Intensity
Industrial coupling coordination refers to the degree of coordinated development between industries. It not only reflects the degree of interaction and coupling between industries, but also reflects the overall level of development between industries. This paper studies the coupling coordination between traditional industries and high-tech industries. The development of high-tech industries is inseparable from the development of traditional industries. The relationship between knowledge and technology determines that the traditional industry is the basic platform for the development of the high-tech industry and the high-tech industry is the driving force for the transformation and upgrading of the traditional industry. Therefore, the healthy and coordinated interaction between high-tech industries and traditional industries is the key to industrial development and economic growth. Meanwhile, industrial development and economic growth are important factors affecting carbon intensity. Therefore, there may be a connection between the industrial coupling coordination and carbon intensity.
The results (Tab. 6) indicate that the degree of industrial coupling coordination and carbon intensity are negatively correlated, and the level of the statistical significance reaches 0.01. It can be inferred that the higher the degree of industrial coupling coordination, the lower the carbon intensity, i.e., the degree of regional industrial coupling coordination was negatively correlated with the carbon intensity. Because the higher the degree of industrial coupling coordination, the stronger the promotion effect between the two industries. The stronger the promotion effect between the two industries has a stronger optimization effect on the industrial structure and energy consumption structure within the industries, and also has a stronger effect on the optimization of carbon emission structure, so as to reduce the carbon intensity. The potential mechanism is shown in Fig. 5.

Figure 5: The potential mechanism between industrial coupling coordination and carbon intensity
5 Conclusions and Policy Implications
Above all, the industrial coordination levels of the seven provinces in the BREC were significantly different. The development levels of high-tech and traditional industries were relatively high, and the coordination levels were obviously better in Beijing, Tianjin, and Shandong. However, the levels of development of the two industries were relatively backward, and the coordination levels were also not optimistic in Hebei, Shanxi, and Inner Mongolia. There were problems with unbalanced industrial development, weak innovation ability, single economic structure, resource-dependent economy, and the siphon effect of core cities such as Beijing and Tianjin among the regions.
From the perspective of coordinated industrial development, the development of new high-tech industries is inseparable from the development of traditional industries, which comprises a large proportion of the industries in the BREC. The relationship between knowledge and technology among the industries determines that the traditional industries provide the basic platform for developing the new high-tech industries, and the new high-tech industries provide the impetus for transforming and upgrading the traditional industries.
Moreover, the degree of industrial coupling coordination and carbon intensity are negatively correlated. The high-tech and traditional industries in Beijing, Tianjin, and Shandong had a higher level of coupling coordination and a lower carbon intensity, whereas the industries in Shanxi, Hebei, Inner Mongolia, and Liaoning had a lower level of coupling coordination and a higher carbon intensity. Therefore, promoting benign interaction among the various industries is critical to realize the target of economically and environmentally sustainable development in the regions.
5.2 Policy Implications for the BREC
For the purpose of improving the level of coordination between high-tech industries and traditional industries in the BREC and reducing the carbon intensity to realize sustainable development, this study puts forward the following proposals.
First, because traditional industries are the pillar industries of the economy in the BREC, the government should not solely pursue the interests of high-tech industries or increase investment in these industries. Instead, it should increase its financial support for transforming and upgrading traditional industries. Meanwhile, Hebei, Shanxi, and Inner Mongolia, as traditional heavy industrial bases, should speed in phasing out backward production facilities, improve the industrial technology level and production efficiency, and actively transform and upgrade traditional industries, to promote coordinated industrial development.
Second, the high level of development of high-tech and traditional industries contributes to the high-grade industrial coordination in Beijing and Tianjin. The key to improving the coordination level of the two kinds of industries is to improve the level of innovation. Therefore, the low-grade coordination provinces should optimize their scientific research environment and implement talent introduction policies. Policies to strengthen scientific research should be directed to enterprises by creating an institutional environment to attract and retain talented employees, as enterprises with highly talented employees can play a key role in innovation.
Third, at present the industrial development in the BREC is seriously differentiated and regional development is unbalanced. Promoting the coordinated development of industries in the BREC will facilitate the coordinated development of the whole region. Therefore, we should optimize the allocation of production factors on a larger scale and actively explore new mechanisms for regional cooperation. In April 2017, China officially established the Xiong’an New Area to facilitate the integration of Beijing, Tianjin, and Hebei and to explore a new pattern to optimize development in areas with dense populations and intensive economies. Many non-capital functions of Beijing will be transferred to the Xiong’an New Area. Against this background, the provinces in the BREC should develop comparative advantages, realize industrial restructuring and upgrading, improve the mechanism for cooperation and development, break down the administrative divisions, accelerate the development of major trans-regional infrastructure, and achieve equal access to public services to realize the coordinated development of the whole region.
5.3 Policy Implications for Different Countries
The conclusion that the coordinated development of industries is negatively related to carbon intensity of this study can be extended from the BREC to different countries in the world. (1) Different countries should develop and support their advantageous industries according to their resource endowments and market orientation, and pay attention to the coordinated development between their advantageous industries and other industries, so as to promote the benign development of economy and environment. (2) Carbon emissions can be reduced by guiding the coupling coordination development of high-tech and traditional industries. Different countries should attach importance to the coordinated development of high-tech and traditional industries, when formulating carbon emission reduction policies or setting carbon emission reduction targets.
The study results indicated that provinces with lower coordination levels and higher carbon intensity, such as Hebei, Shanxi, Inner Mongolia, and Liaoning, are facing much more pressures to upgrade and transform their traditional industries for the purpose of realizing the targeted reduction in their carbon emissions. Therefore, the following aspects of this research need further study. First, the spatial correlation between provinces in respect of carbon intensity should be explored. Second, technological innovation affects the carbon intensity, but the mechanism of this effect is worthy of further study in terms of reducing the carbon intensity and upgrading traditional industries. Third, the driving mechanism of high-tech industries to traditional industries should also be further studied.
Acknowledgement: The authors would like to thank the anonymous referees for their helpful suggestions and corrections on the earlier draft of this paper, as well as International Science Editing and Mr. Wei Wu for checking and modifying the wording of this manuscript (Mr. Wei Wu graduated from Roger Williams University with a master's degree and is studying for a doctorate at National Chengchi University).
1 “Outline for cooperation and development of the BREC” makes clear that the BREC includes Beijing, Tianjin, Hebei, Liaoning, Shandong, Shanxi and Inner Mongolia, which enacted by the National Development and Reform Commission, the relevant departments of the State Council, and local governments in 2015.
Authorship and Contribution: Mei Song: Study design and method selection, Funding acquisition, Project administration. Liyan Zhang, Mingxin Zhang: Data collection, Writing-Original Draft. Dandan Li: Methodology, Software, Supervision. Yaxu Zhu, Mingxin Zhang: Investigation. Mei Song and Liyan Zhang: Writing- Review & Editing. Yaxu Zhu: Software.
Funding Statement: This study was funded by the Key Laboratory of Carrying Capacity Assessment for Resource and Environment, Ministry of Natural Resources [CCA2019.16]; Program for New Century Excellent Talents in University [NCET-11-0731], and the Fundamental Research Funds for the Central Universities (2009QG08).
Conflicts of Interest: The authors declare that they have no known competing financial interests or personal relationships that could have appeared to influence the work reported in this paper.
References
1. Chen, C. J., Wu, H. L., Lin, B. W. (2006). Evaluating the development of high-tech industries: Taiwan’s science park. Technological Forecasting and Social Change, 73(4), 452–465. DOI 10.1016/j.techfore.2005.04.003.
2. Zhang, B., Luo, Y., Chiu, Y. H. (2019). Efficiency evaluation of China’s high-tech industry with a multi-activity network data envelopment analysis approach. Socio-Economic Planning Sciences, 66, 2–9. DOI 10.1016/j.seps.2018.07.013.
3. He, W. D., Lin, Z. F., Hao, R. (2018). Analysis of regional competitiveness in the high-tech industry. Current Science, 114(4), 854–860. DOI 10.18520/cs/v114/i04/854-860.
4. Gao, Z. (2012). Sustainable development and upgrading mode of coal industry in China. International Journal of Mining Science and Technology, 22(3), 335–340. DOI 10.1016/j.ijmst.2012.04.009.
5. Wang, Z. X., Wang, Y. Y. (2014). Evaluation of the provincial competitiveness of the Chinese high-tech industry using an improved TOPSIS method. Expert Systems with Applications, 41(6), 2824–2831. DOI 10.1016/j.eswa.2013.10.015.
6. Pan, M., Song, H. (2017). Transformation and upgrading of old industrial zones on collective land: Empirical study on revitalization in Nanshan. Habitat International, 65, 1–12. DOI 10.1016/j.habitatint.2017.04.014.
7. Wang, Y., Pan, J. F., Pei, R. M., Yi, B. W., Yang, G. L. (2020). Assessing the technological innovation efficiency of China’s high-tech industries with a two-stage network DEA approach. Socio-Economic Planning Sciences, 71, 100810. DOI 10.1016/j.seps.2020.100810.
8. Li, X. (2011). Upgrading of China’s manufacturing industry: two-sector analysis based on the facilitation of producer services. Procedia Environmental Sciences, 10, 307–312. DOI 10.1016/j.proenv.2011.09.050.
9. Zhai, X., An, Y. (2020). Analyzing influencing factors of green transformation in China's manufacturing industry under environmental regulation: a structural equation model. Journal of Cleaner Production, 251, 119760. DOI 10.1016/j.jclepro.2019.119760.
10. Chakrabarti, A. K., Lester, R. K. (2002). Regional economic development: comparative case studies in the US and Finland. IEEE International Engineering Management Conference, 2, 635–642. DOI 10.1109/iemc.2002.1038510.
11. Mendonça, S. (2009). Brave old world: accounting for ‘high-tech’ knowledge in ‘low-tech’ industries. Research Policy, 38(3), 470–482. DOI 10.1016/j.respol.2008.10.018.
12. Arbuthnott, A., Eriksson, J., Wincent, J. (2010). When a new industry meets traditional and declining ones: an integrative approach towards dialectics and social movement theory in a model of regional industry emergence processes. Scandinavian Journal of Management, 26(3), 290–308. DOI 10.1016/j.scaman.2010.05.001.
13. Zhu, B., Zhang, M., Zhou, Y., Wang, P., Sheng, J. et al. (2019). Exploring the effect of industrial structure adjustment on interprovincial green development efficiency in China: a novel integrated approach. Energy Policy, 134, 110946. DOI 10.1016/j.enpol.2019.110946.
14. Zhou, X., Zhang, J., Li, J. (2013). Industrial structural transformation and carbon dioxide emissions in China. Energy Policy, 57, 43–51. DOI 10.1016/j.enpol.2012.07.017.
15. Zhang, Y. J., Liu, Z., Zhang, H., Tan, T. D. (2014). The impact of economic growth, industrial structure and urbanization on carbon emission intensity in China. Natural Hazards, 73(2), 579–595. DOI 10.1007/s11069-014-1091-x.
16. Zheng, X., Yu, Y., Wang, J., Deng, H. (2014). Identifying the determinants and spatial nexus of provincial carbon intensity in China: a dynamic spatial panel approach. Regional Environmental Change, 14(4), 1651–1661. DOI 10.1007/s10113-014-0611-2.
17. Yao, X., Guo, C., Shao, S., Jiang, Z. (2016). Total-factor CO2 emission performance of China’s provincial industrial sector: A meta-frontier non-radial Malmquist index approach. Applied Energy, 184, 1142–1153. DOI 10.1016/j.apenergy.2016.08.064.
18. Cheng, Z., Li, L., Liu, J. (2018). Industrial structure, technical progress and carbon intensity in China’s provinces. Renewable and Sustainable Energy Reviews, 81((June 2016)), 2935–2946. DOI 10.1016/j.rser.2017.06.103.
19. Xiao, H., Shan, Y., Zhang, N., Zhou, Y., Wang, D. et al. (2019). Comparisons of CO2 emission performance between secondary and service industries in Yangtze River Delta cities. Journal of Environmental Management, 252, 109667. DOI 10.1016/j.jenvman.2019.109667.
20. Benjamin, N. I., Lin, B. (2020). Quantile analysis of carbon emissions in China metallurgy industry. Journal of Cleaner Production, 243, 118534. DOI 10.1016/j.jclepro.2019.118534.
21. Zhang, K., Shao, S., Fan, S. (2020). Market integration and environmental quality: evidence from the Yangtze river delta region of China. Journal of Environmental Management, 261, 110208. DOI 10.1016/j.jenvman.2020.110208.
22. Yang, C., Zeng, W., Yang, X. (2020). Coupling coordination evaluation and sustainable development pattern of geo-ecological environment and urbanization in Chongqing municipality, China. Sustainable Cities and Society, 61, 102271. DOI 10.1016/j.scs.2020.102271.
23. Li, W., Yi, P. (2020). Assessment of city sustainability—coupling coordinated development among economy, society and environment. Journal of Cleaner Production, 256, 120453. DOI 10.1016/j.jclepro.2020.120453.
24. Zhang, X. M. (2018). Empirical Research on the Coupling Coordination Degree of Cultural Industry and Manufacturing Industry in China Based on Industrial Integration. Proceedings of 2018 International Conference on Information, Teaching and Applied Social Sciences, Singapore, 36–41.
25. Shen, L. Y., Huang, Y. L., Huang, Z. H., Lou, Y. L., Ye, G. et al. (2018). Improved coupling analysis on the coordination between socio-economy and carbon emission. Ecological Indicators, 94(July), 357–366. DOI 10.1016/j.ecolind.2018.06.068.
26. Cui, D., Chen, X., Xue, Y., Li, R., Zeng, W. (2019). An integrated approach to investigate the relationship of coupling coordination between social economy and water environment on urban scale-A case study of Kunming. Journal of Environmental Management, 234, 189–199. DOI 10.1016/j.jenvman.2018.12.091.
27. Yang, Y. Y., Bao, W. K., Liu, Y. S. (2020). Coupling coordination analysis of rural production-living-ecological space in the Beijing-Tianjin-Hebei region. Ecological Indicators, 117, 106512. DOI 10.1016/j.ecolind.2020.106512.
28. Zhang, H., Zhou, N. (2019). Analysis of the Temporal and Spatial Characteristics of Coupling and Coordination Between Manufacturing Industry and Service Industry of China. Proceedings of 3rd International Conference on Culture, Education and Economic Development of Modern Society, Moscow, Russia, 1764
29. Zheng, J., Hu, Y. J., Boldanov, T., Bazarzhapov, T., Meng, D. et al. (2020). Comprehensive assessment of the coupling coordination degree between urbanization and ecological environment in the Siberian and Far East Federal Districts, Russia from 2005 to 2017. Peer J, 8, e9125.
30. Chen, Y., Shi, H. M., Ma, J., Shi, V. (2020). The Spatial Spillover Effect in Hi-Tech Industries: Empirical Evidence from China. Sustainability, 12(4), 1551–1567. DOI 10.3390/su12041551.
31. Zhang, W. R. (2018). An Empirical Study on the Synergic Relationship between the Regional Sci-Tech Innovation Platform and the Development of Strategic Emerging Industries. American Journal of Industrial and Business Management, 8(3), 747–759. DOI 10.4236/ajibm.2018.83051.
32. Zhang, L. N., Chen, D. H., Peng, S., Pang, Q. H., Li, F. J. (2020). Carbon emissions in the transportation sector of Yangtze River Economic Belt: decoupling drivers and inequality. Environmental Science and Pollution Research, 27(17), 21098–21108. DOI 10.1007/s11356-020-08479-9.
33. Song, M., Wu, J., Song, M. R., Zhang, L. Y., Zhu, Y. X. (2020). Spatiotemporal regularity and spillover effects of carbon emission intensity in China’s Bohai Economic Rim. Science of the Total Environment, 740(2020), 140184–140195. DOI 10.1016/j.scitotenv.2020.140184.
34. Huang, C. H., Zhang, X. Q., Liu, K. (2021). Effects of human capital structural evolution on carbon emissions intensity in China: a dual perspective of spatial heterogeneity and nonlinear linkages. Renewable and Sustainable Energy Reviews, 135(August), 110258. DOI 10.1016/j.rser.2020.110258.
35. Liu, F., Xu, Q. (2016). Research on the Performance of Coupling Coordination between IT Service and Manufacturing. International Science and Culture for Academic Contacts. Proceedings of the 2016 International Conference on Judicial, Administrative and Humanitarian Problems of State Structures and Economical Subjects, Domodedovo, Russia, 123–129.
Appendix A
Table A1: Principal component contribution rate of the high-tech and traditional industries in 2016
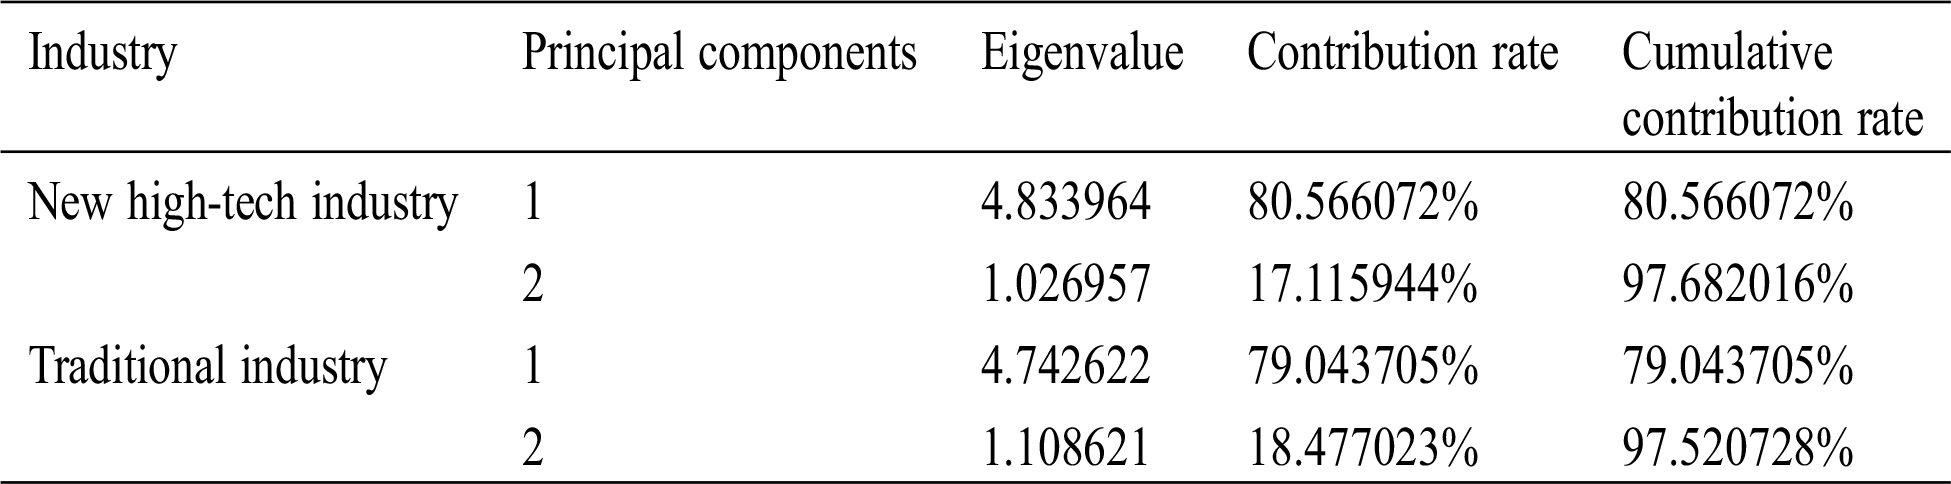
Table A2: Comprehensive evaluation index of high-tech and traditional industries in 2016
Appendix B
Table B1: Degree of coupling coordination across BREC regions with different values of α and β
Appendix C
Table C1: Comprehensive evaluation indexes, degree of coupling, and degree of coupling coordination of high-tech and traditional industries across BREC regions in 2011 and 2016
Appendix D

Figure D1: Degree of coupling and coupling coordination in 2011 and 2016. (a) Coupling degree (b) Coupling coordination degree
 | This work is licensed under a Creative Commons Attribution 4.0 International License, which permits unrestricted use, distribution, and reproduction in any medium, provided the original work is properly cited. |