DOI: 10.32604/EE.2021.013472
ARTICLE
Impact of Greenization on the Marginal Utility of Intensity of Carbon Emissions and Factors Affecting it in China
1College of Geography and Environment, Shandong Normal University, Jinan, 250358, China
2Collaborative Innovation Center of Human-Nature and Green Development in Universities of Shandong, Jinan, 250358, China
*Corresponding Author: Kai Liu. Email: liukaisdnu@163.com
Received: 07 August 2020; Accepted: 02 November 2020
Abstract: The impact of greenization on the marginal utility of the intensity of carbon emissions in China and factors influencing this relationship are explored in this study. China’s level of greenization is evaluated by using an index system developed based on the comprehensive index method. The intensity of carbon emissions is determined by using the standards for the coefficients of conversion of coal equivalent and coefficients of carbon emission. The impact of greenization on the marginal utility of the intensity of carbon emissions is then evaluated by using an elastic formula and factors affecting this relationship are verified by regression analysis. The results are as follows: (1) China’s level of greenization has exhibited a trend of constant increase. The intensity of carbon emissions has followed a continual downward trend while the impact of greenization on the marginal utility of the intensity of these emissions has been declining. (2) Urbanization as well as scientific and technological developments have slowed the reduction in the marginal utility of the intensity of carbon emissions, whereas the structure of energy consumption has expedited it under the diminishing impact of greenization. The standard of living of the population, intensity of environmental regulation, and environmental quality have had different influences under different conditions.
Keywords: Greenization; carbon emission intensity; marginal utility; influential factor
In recent years, the international community has reached the consensus that green development should be pursued worldwide. China is the largest developing country in the world. It has for a long time driven the development of the global economy owing its large economic growth and enormous economic volume. However, China has traditionally followed a model of extensive development that has led to many environmental problems, such as excessive consumption of resources and energy, and the emission of large amounts of pollutants and waste. Industrialization and urbanization in China have resulted in a substantial increase in national carbon emission. Therefore, since the 18th National Congress of the Communist Party of China (CPC), the government has worked to develop a path to green development that suits its national conditions. Liu [1] has claimed that a green development strategy is needed to combat climate change and improve the living conditions of the human population. In March 2015, the Opinions of the CPC Central Committee and the State Council on Accelerating the Ecological Civilization Construction proposed the promotion of new industrialization, urbanization, informationization, agricultural modernization, and greenization. A region is a complex system that features the economy, society, resources, and the environment. Greenization is the process of coordinated development and growth of the systems of the economy, society, and resources and the environment [2]. In this process, the goals of these systems are green growth, green welfare, and green wealth, respectively (Fig. 1). China attaches great importance to green development, and thus greenization has emerged as a new trend with the goal of high-quality development in the country in the new era.
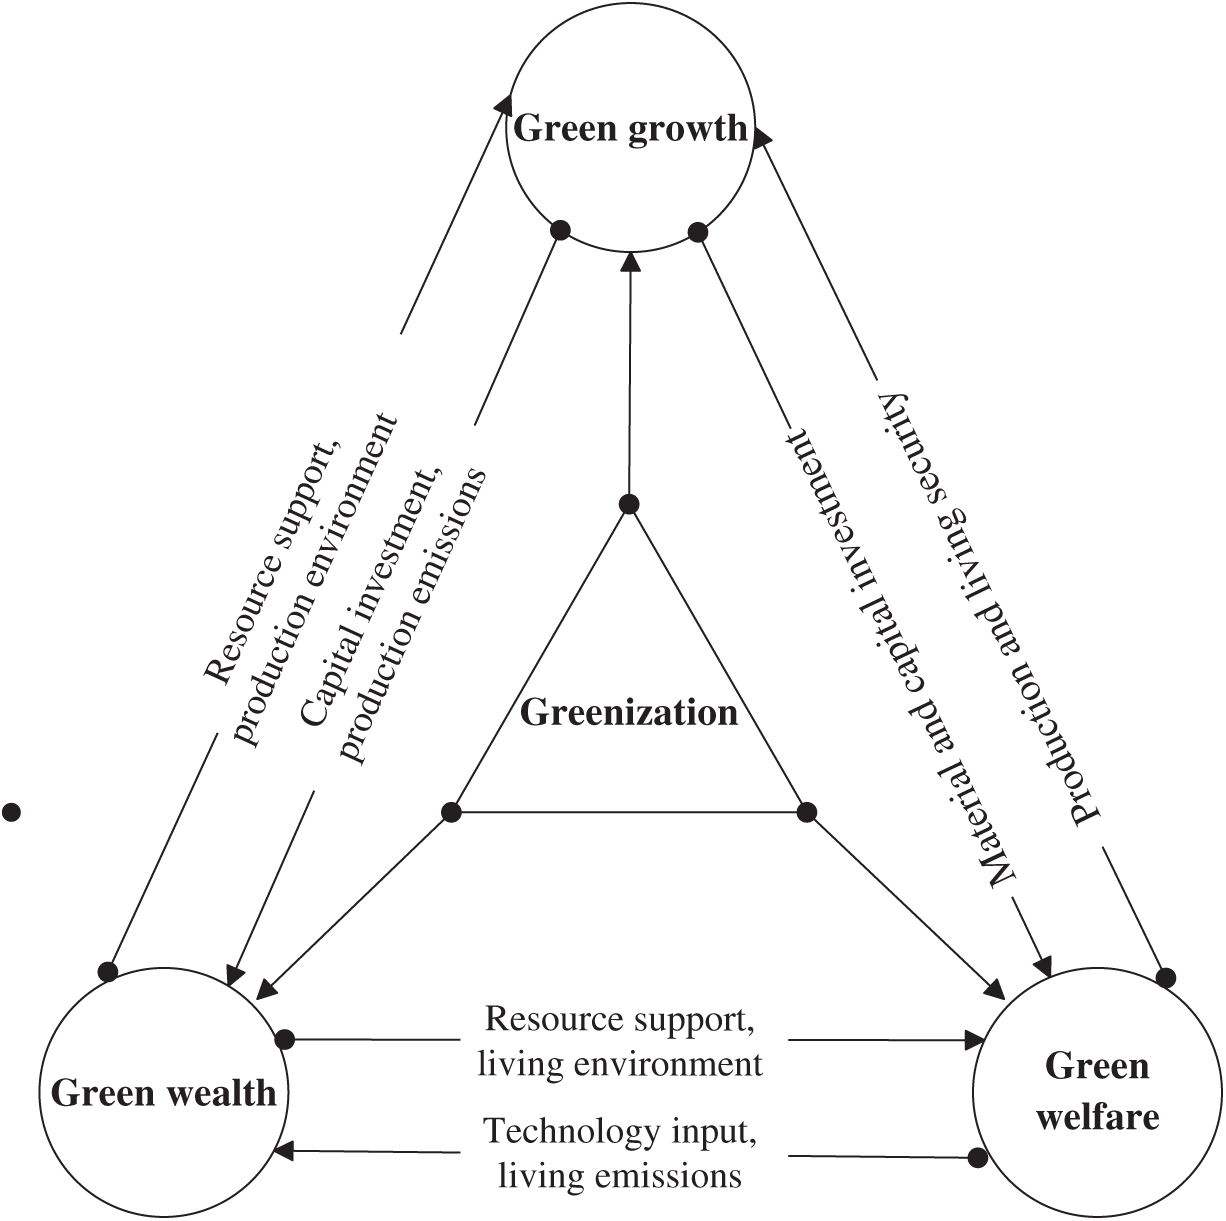
Figure 1: The definition of greenization
Low-carbon development is the core of the concept of greenization. Over the past 100 years, the Earth has experienced a warming of its climate. The impact of human activities on the climate system is clear, and a substantial increase in carbon emissions is considered to be the major driver of global climate change [3,4]. To respond to this challenge, cooperation between countries and regions is necessary. The international community has worked together to reduce carbon dioxide (CO2) emissions, and has successively formulated the Kyoto Protocol, Bali Roadmap, Copenhagen Accord, and the Paris Agreement. China has made a series of commitments to mitigate climate change in this context. As a major global center of urbanization and industrialization, it is one of the largest emitters of carbon in the world [5,6]. At the Paris Climate Change Conference in 2015, China announced that its carbon emissions would peak by 2030 [1]. In the Chinese 11th Five-Year Plan (2006–2010), the concepts of energy conservation and emissions reduction were proposed. The concept of green development was proposed in the Chinese 12th Five-Year Plan (2011–2015), and the reduction of CO2 emissions per unit of the GDP was used as a binding indicator in the 13th Five-Year Plan (2016–2020). The world will face drastic environmental changes in the next 100 years. As China’s international influence grows, it will come to play a crucial role in reducing global carbon emissions.
Green development and low-carbon development have in common theoretical bases and a goal. The former are the theory of an ecological economy and system theory, and the latter is the construction of an ecological civilization, and harmonious development between humans and nature. However, they differ in content. Research on green development has focused on solving the problem of environmental pollution and attending to the coordination of the economy, society, and resources and the environment. Work on low-carbon development has focused on solving the problem of the warming climate and attending to reducing of greenhouse gas emissions. The research on green development is more extensive and that on low-carbon development is more specific, and at this point, the former subsumes the latter. Thus, studying the impact of greenization on the intensity of carbon emissions has theoretical and practical significance. It can help enrich research on greenization as well as the relationship between greenization and carbon emissions. The motivation underlying this study is to explore the impact of greenization on the marginal utility of the intensity of carbon emissions and factors influencing it, with the aim of providing a reference for examining the relationship between green development and low-carbon development.
In recent years, many studies have investigated green development and carbon emissions. The relevant literature can be divided into three groups as below.
An evaluation index system has been developed and different methods of evaluation used to determine the levels of greenization of different regions. The concept of the green index has been proposed, and a system to assess it is divided into three classes [7]. The first class contains two kinds of indicators. The first kind, green status, further contains seven second-class indicators: air pollution, water pollution, energy consumption, toxin substance, solid waste, community environment, and agricultural environment. The second kind of indicator is green policy, which in turn contains two second class indicators: leadership, and the promotion of policy. The third class contains 77 indicators. Chua et al. [8] used Malaysia as study area to investigate its green development. By using the non-radial data envelopment analysis (DEA) model, the green development of the Chinese transportation sector was evaluated across provinces [9]. An index system was established to evaluate green industrial development, and the analytic hierarchy process was applied to determine the weights and properties of the index when measuring the level of green industrial development [10]. Liu et al. [2] calculated the weights of the index using the entropy method, and assessed the evolution of greenization in China through the Technique for Order Preference by Similarity to Ideal Solution (TOPSIS). Sun et al. [11] established an indicator system that uses the weighting method to analyze the evolution of the level of green development in China from the temporal and spatial perspectives. Wang et al. [12] employed a multi-level method of evaluation and the entropy method to evaluate the levels of green development of nine cities in the Pearl River Delta. Yang et al. [13] constructed a comprehensive index system to assess green development from the social, economic, and environmental perspectives to evaluate the levels of green development of 109 cities with rich mineral resources in China. Yang et al. [14] measured the green development index of Shaanxi Province based on an improved green development indicator system.
The literature on green efficiency is rich. The work includes studies on the evaluation and analysis of the green efficiency of arable land use [15], the green efficiency of industrial sectors in sectoral and supply-chain quantifications [16], and the green efficiency of the metalworking industry [17]. In addition, a series of studies on green economic efficiency and green growth efficiency have been conducted. The green economic efficiency of China’s provinces has been measured [18], and the results indicate that large interregional differences in green economic efficiency, energy, and CO2 emissions are key factors influencing the country’s overall green economic efficiency. Different regions have different potentials for saving energy and reducing CO2 emissions. Wang et al. [19] studied the green economic efficiency of 26 cities in the Yangtze River Delta from 2005 to 2015. Better understanding the level of greening of the manufacturing industry is important for promoting green growth. Qu et al. [20] measured the efficiency of green growth of the Chinese manufacturing industry by applying the epsilon-based measure (EBM), and found that it has significant potential for saving resources and reducing environmental pollution. Ma et al. [21] analyzed the input–output index and spatiotemporal pattern of the efficiency of green growth of Chinese cities, and found spatial differences among cities.
In previous studies on green efficiency, the construction of an input–output index system has been considered an important process. Research on the evaluation of green efficiency has demonstrated that the DEA model is the most frequently used technique to evaluate the multi-input and multi-output index. It is a popular and effective method for evaluating the relative efficiency of decision-making units (DMUs) of multiple inputs and outputs [22]. The slack-based measurement (SBM) model [23,24], which has the important advantage of considering the problem of the slackness of the inputs and outputs [25], and of being able to directly solve for the excess of inputs and insufficiency of outputs in efficiency evaluations, is particularly suitable for evaluating green efficiency. In addition, with the continual improvement and maturity of measurement techniques, the super-SBM model [21,26–28] and the bootstrap model [29–31] have been widely used in the evaluation of efficiency.
Many researchers have explored the determinants and effects of carbon emissions and their intensity as well as the factors that influence the spatiotemporal evolution of this intensity. Input–output techniques have been widely used to calculate carbon emissions [32]. It is also important to consider the factors influencing the intensity of these emissions. After conducting a study of 142 countries, York et al. [33] found that population, urbanization, and economic growth have positive effects on carbon emissions. Lee et al. [34] discovered that per capita GDP and population were the main factors that affect carbon emissions, whereas Sharma [35] claimed that the per capita GDP and urbanization were the two main determinants of global CO2 emissions. The intensity of carbon emissions in various regions is mainly influenced by energy intensity, economic growth, the ratio of the secondary industry to overall industrial output, and fiscal expenditure [36]. Shahbaz et al. [37] reported that economic growth is a major contributor to CO2 emissions. Energy consumption raises the intensity of carbon emissions and capital stock boosts energy consumption. More importantly, urbanization initially reduces CO2 emissions but, after reaching a threshold, causes them to increase. Cheng et al. [38] found that energy intensity, the industrial structure, and urbanization are the main driving forces of the intensity of carbon emissions. Dong et al. [39] found that urbanization and the energy mix have a positive impact on the intensity of carbon emissions. Acheampong et al. [40] observed that renewable energy, foreign direct investment (FDI), openness to trade, population growth, and financial development have an impact on carbon emissions. Pan et al. [41] demonstrated that the GDP, industrialization, technological innovation, urbanization, total population, and FDI are the main factors influencing the intensity of carbon emissions. Bai et al. [42] showed that a rising urban population has a significant and positive influence on CO2 emissions. Furthermore, net FDI flow, the industrial structure, energy structure, environmental regulation, energy efficiency, and the structure of land use have been shown to affect the intensity of carbon emissions [43–47]. Liu et al. [48] found that the concentration structure of urban agglomeration exerts a positive impact on carbon emissions. In addition, international agreements have had impacts on carbon emissions; for instance, in a recent study, Cary [49] found that tariffs increase the intensity of carbon emissions but do not have an effect on the emissions themselves, where the increase in intensity due to tariffs is sufficient to offset decreases in CO2 emissions due to decreased production.
Green development and low-carbon development have been received considerable attention in research, but the relationship between green development and low-carbon development is worth further studying. In particular the impact of greenization on the marginal utility of the intensity of carbon emissions should be considered. However, few studies have addressed this issue. Therefore, based on an evaluation of the level of greenization and the intensity of carbon emissions, this study empirically examines the marginal utility of the greenization in China on the intensity of carbon emissions, and analyzes the factors that influence this marginal utility. The major contribution here is a clarification of the relationship between greenization and the intensity of carbon emissions, tested using the perspective of marginal utility. The results will provide a reference for China to formulate policies for energy conservation and emissions reduction in the context of green development and the construction of an ecological civilization.
3 Hypothesis of Impact Mechanism
The system of economic, social and resources and the environment of greenization can exert different influences on the intensity of carbon emissions (Fig. 2). Environmental pollutants present an inverted U-shaped trend of first increasing and then decreasing with economic growth [50]. We thus assume that the economic system has this impact on the intensity of carbon emissions. In the early stage of economic growth, the intensity of carbon emissions increases because of the mode of extensive growth, and then can be reduced through the idea of green growth. Population is a significant element of the social system that can lead to an increase in the intensity of carbon emissions as it grows [51], but better awareness of environmental issues helps reduce it through the cultivation and promotion of green ideas. Thus, we assume that the social system also has an inverted U-shaped impact on the intensity of carbon emissions. The reduction in environmental pollutants and resource consumption reduces the intensity of carbon emissions, and thus there is a negative correlation between the system of resources and the environment, and the intensity of carbon emissions. In light of the law of regional development and the impact of the three systems on the intensity of carbon emissions, we conclude that greenization has an inverted U-shaped impact on this intensity.
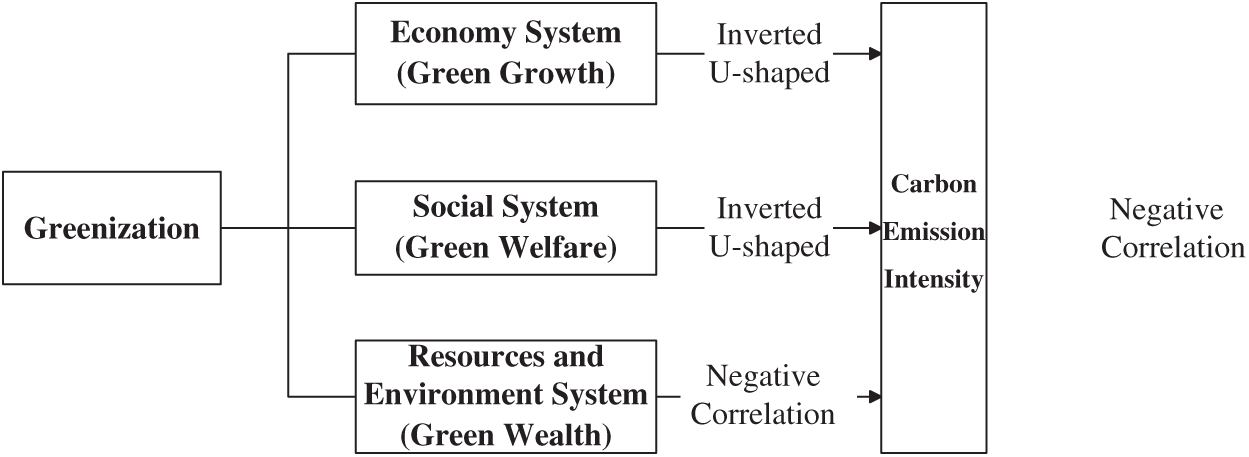
Figure 2: The hypothesis of the mechanism of impact
The level of greenization is reflected by a composite index computed using the entropy weight summation method and the evaluation index system. The intensity of carbon emissions is reflected by the ratio of total carbon emissions to the GDP, where total carbon emissions are computed by using the standard conversion coefficients of coal equivalent and coefficients of carbon emissions. The marginal utility was computed using the theoretical elastic formula.
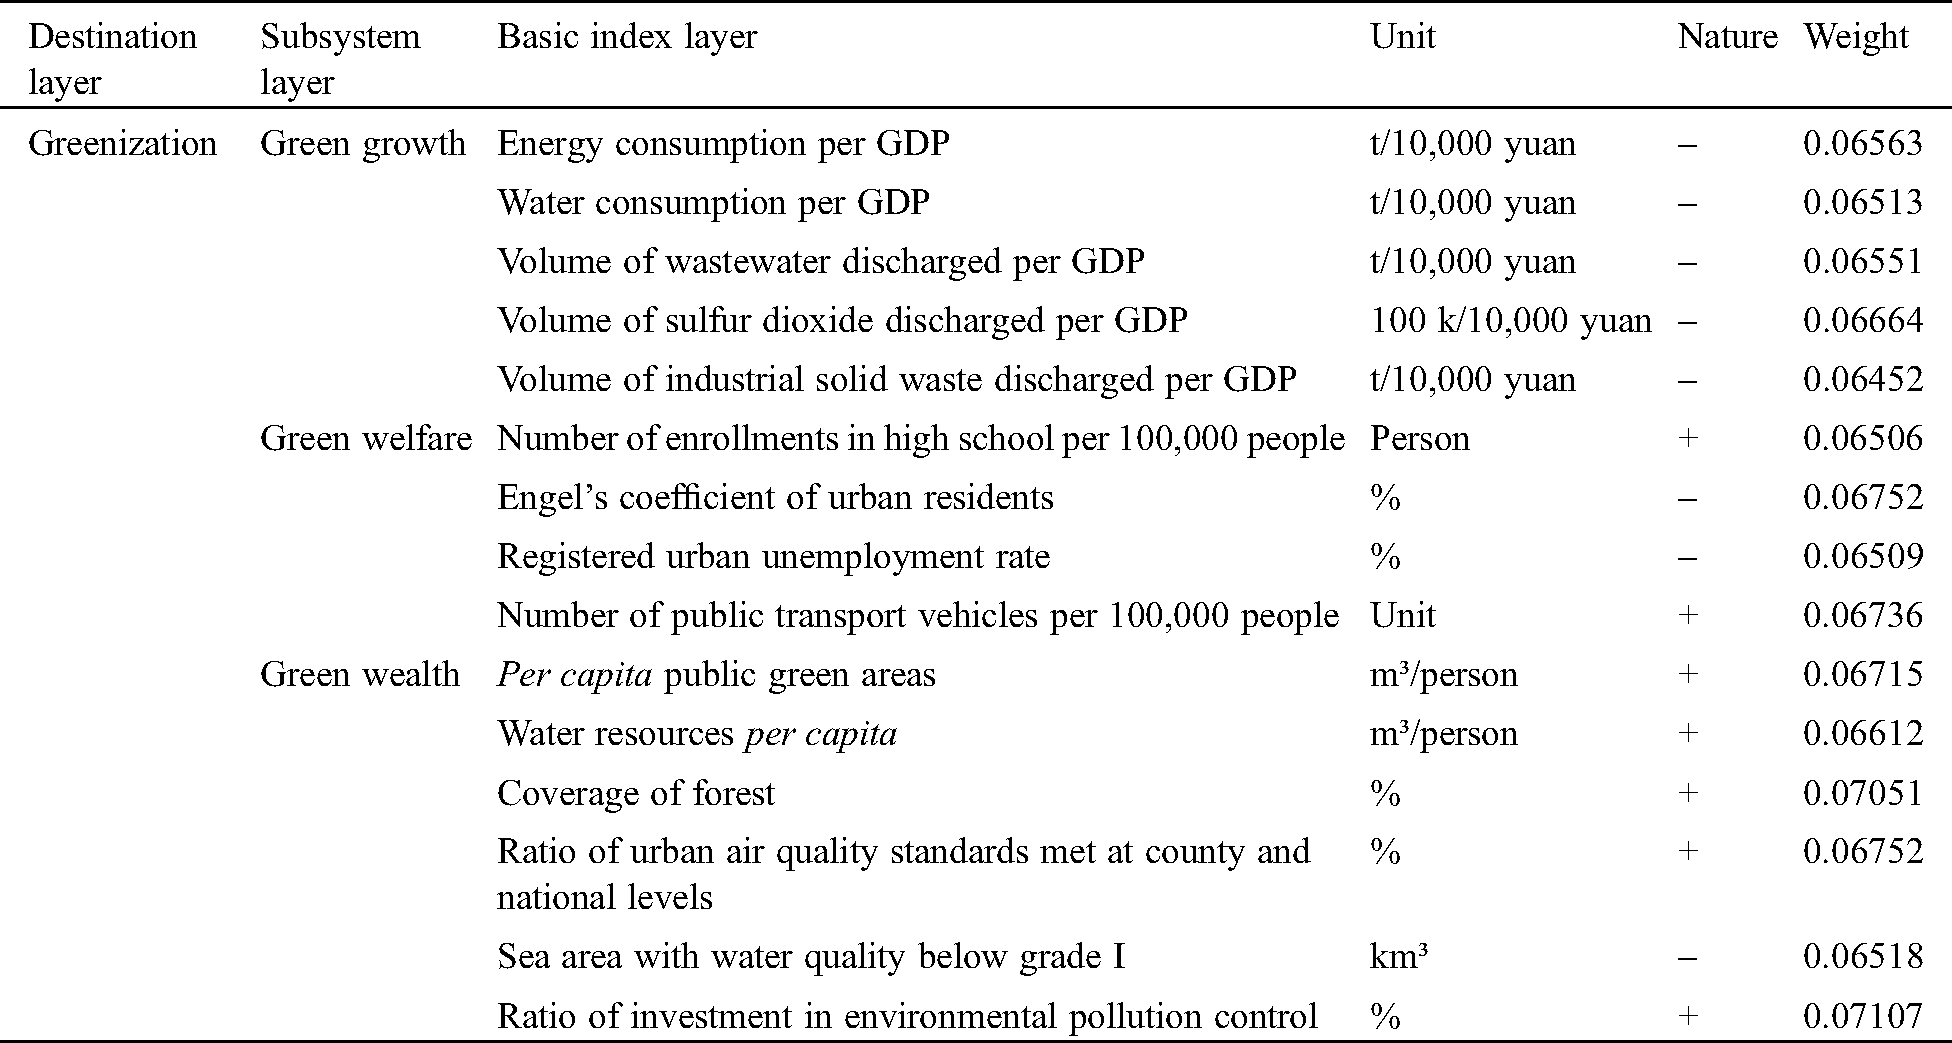
Greenization is a process of coupling and collaborative development that enables economic subsystems to achieve green growth, social subsystems to increase green welfare, and ecological environment subsystems to accumulate green wealth. Layers of the subsystems of an index system to assess greenization were therefore constructed in this study from the perspectives of green growth, green welfare, and green wealth. Tab. 1 provides a summary of the descriptive information on the indicators.
Resources, energy consumption, and waste discharge were selected as indicators of green growth. Energy consumption per GDP, water consumption per GDP, volume of waste water discharged per GDP, volume of sulfur dioxide (SO2) discharged per GDP, and volume of industrial solid waste discharged per GDP were selected as the basic layers of the index. The lower the consumption and the emissions were, the more favorable the conditions were for green growth; therefore, they were negative indicators.
Social progress and stability, and the development of environmental protection in the process of social development were selected as indicators of green welfare. Enrollment in high school per 100,000 people, Engel’s coefficient of urban residents, registered urban unemployment rate, number of public transport vehicles per 100,000 people, and per capita public green areas were selected as indicators of green welfare. Engel’s coefficient of urban residents and the registered urban unemployment rate were used as negative indicators, whereas the other indicators were positive.
Resource abundance, environmental quality, and investment in environmental protection were selected as indicators of green wealth. They included water resources per capita, forest coverage, proportion of urban air quality standards met at the county and the national levels, area of sea with water quality below grade I, and proportion of investment in environmental pollution control. The area of the sea with water quality below grade I was considered a negative indicator while the other indicators were positive. The weights were derived from the entropy method. As the resource and environmental data had been collected starting from 2004, the period 2004–2016 was selected as the time series for the study. The data for the study were sourced from the China Statistics Network and the China Statistical Yearbook (2005–2017).
Table 1: Indicator system to assess greenization
The entropy value method was used to determine the weighted coefficients of the greenization evaluation index (Tab. 1), and the comprehensive index method was adopted to obtain the level of greenization of China from 2004 to 2016 [52]. The entropy value method is a comprehensive index research method that can be used to assess the assignment of weights by calculating the informational entropy of the index. This renders the results of evaluation more objective through the elimination of the influence of subjective factors [53].
4.2.2 Intensity of Carbon Emissions
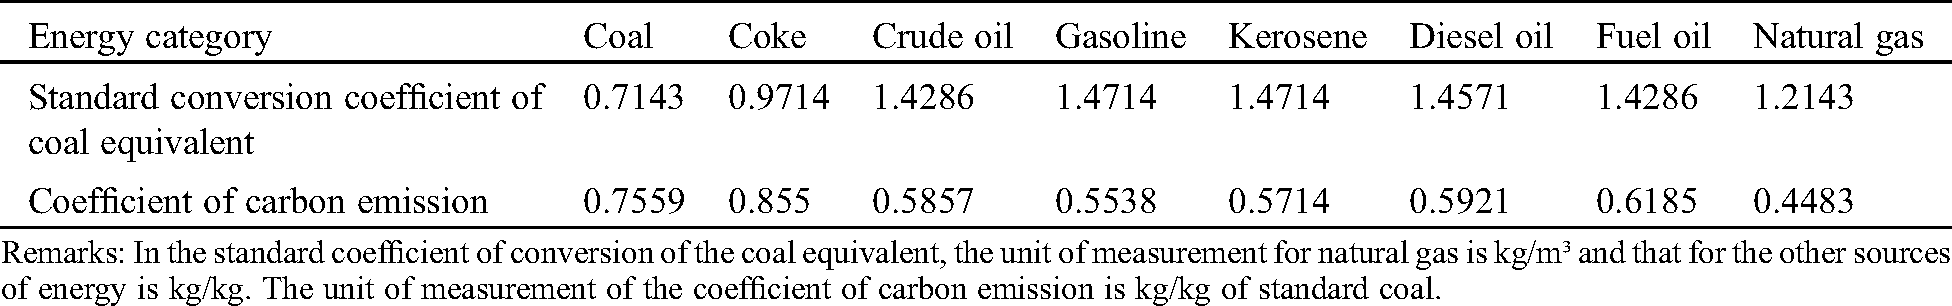
Fossil fuels are the major source of carbon emissions according to different standards for the coefficients of conversion of coal equivalent and coefficients of carbon emission provided by the Intergovernmental Panel on Climate Change (IPCC) (Tab. 2). The energy consumed by using coal, coke, crude oil, gasoline, kerosene, diesel oil, fuel oil, and natural gas was used to calculate total carbon emissions. The intensity of carbon emissions was used as the yardstick to evaluate the relative extent of the emissions of a given country [41], expressed as the ratio of total carbon emissions to the GDP(C) [54]. The energy consumption data were sourced from the China Energy Statistical Yearbook (2005–2017), and data on the GDP were taken from the China Statistical Yearbook (2005–2017). The formula used to calculate total carbon emissions is as follows:
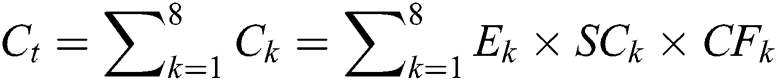
where  is the total carbon emissions, E is the energy consumption, SC is the coefficient of standard conversion of the coal equivalent, and CF is the coefficient of carbon emission.
Table 2: Standard conversion coefficient of coal equivalent and the coefficient of carbon emission
Economics defines utility as a measure of how much satisfaction a person obtains from specific goods or services. Marginal utility is the change in the total utility caused by the consumption of an additional unit of goods or services, and the diminishing marginal effect refers to the marginal utility obtained from a unit of goods or services after consumption being less than that of the previous unit [55]. According to the law of diminishing marginal utility, the marginal utility of the intensity of carbon emissions in the process of greenization can be defined as the utility of a reduction in the intensity of these emissions caused by an increase in one unit of the level of greenization, which reflects changes in the intensity of carbon emissions with those in the level of greenization. The reduction in the marginal utility of the intensity of carbon emissions during greenization can be calculated using a partial derivative of the impact of the greenization index on the intensity of carbon emissions:

where G is the level of greenization, C is the intensity of carbon emissions, MI is marginal utility, and 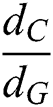 is a derivative of the impact of greenization on the intensity of carbon emissions. When
  is positive, this indicates that the impact of greenization on the marginal utility of the intensity of carbon emissions is increasing; when
  is negative, this indicates that this is decreasing. The marginal utility exhibited a decreasing characteristic, which indicates an optimal quantitative ratio of the combination of greenization and the intensity of carbon emissions.
4.2.4 Linear Regression Method
The factors influencing the impact of greenization on the marginal utility of the intensity of carbon emissions was evaluated via a regression analysis. The formula and variables are provided in Section 5.3.
5 Results of Empirical Analysis
5.1 Greenization Level and the Intensity of Carbon Emissions
The level of greenization and the intensity of carbon emissions were calculated for 2004–2016 (Fig. 3). The level of greenization increased from 0.05 in 2004 to 0.86 in 2016, showing an overall trend of a gradual increase. The improvements in the levels of green growth, green welfare, and green wealth were the direct reason for the increase in the level of greenization. The primary goals of greenization are the development of an ecological civilization, green development (including clear waters and lush mountains as invaluable assets), ecological prosperity as civilized prosperity, and harmony between humans and nature, all of which have gradually infiltrated into various fields of China’s economic, social, and environmental development. The intensity of carbon emission exhibited an upward trend in 2004–2006 and a downward trend in 2006–2016. Owing to the continual development of the green, recycling, and low-carbon economy in China as well as the optimization of the structure of energy consumption, the proportional contribution of coal to total energy consumption has been declining and that of clean energy has been increasing, which has contributed to a decline in the intensity of China’s carbon emissions. In addition, such factors as the optimization of the industrial structure, technological progress, and environmental regulations have contributed. Although the intensity of carbon emission in the country has shown a downward trend since 2006, total carbon emissions had declined only slightly by 2014, indicating that the reduction in emissions has proven to be challenging, and effective measures for energy conservation and emissions reduction are yet to be implemented.
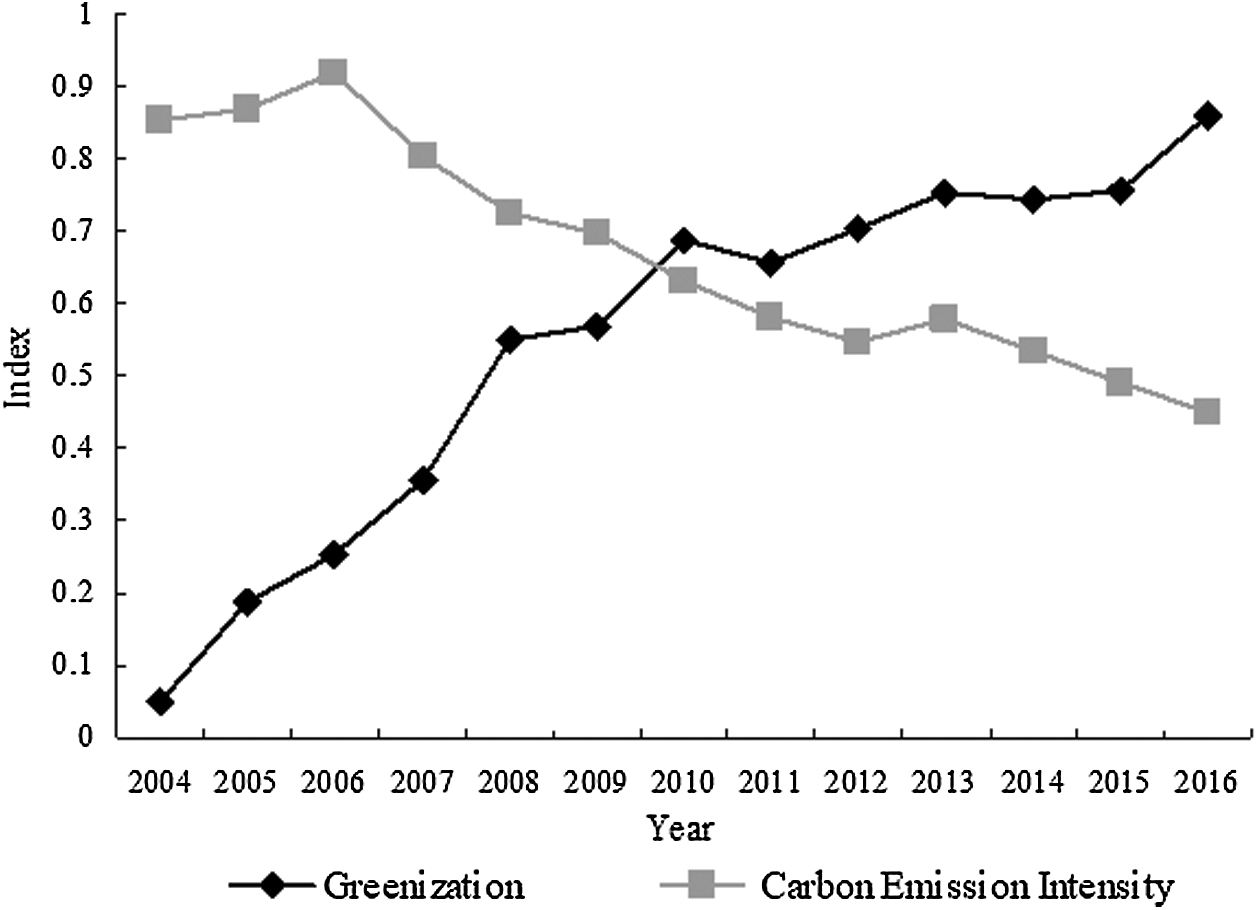
Figure 3: China’s level of greenization and the intensity of carbon emissions from 2004 to 2016
Before calculating marginal utility, it is necessary to conduct a curve-fitting analysis of the greenization and the intensity of carbon emissions in China. The optimal function equation is as follows:

The optimal function of the two parameters is a cubic equation, R2 = 0.96, F = 74.185, that satisfies the requirements of the significance test. The derivative result of the cubic function, the level of greenization, and the intensity of carbon emissions were then input into Eq. (4) to obtain the marginal utility of the intensity of carbon emissions in case of greenization in China (Fig. 4).
The impact of greenization on the marginal utility of the intensity of carbon emissions in 2004–2006 was positive, indicating that the total effect of greening on the reduction in the intensity of emissions was still rising. Since 2007, the marginal utility has become negative, and the overall trend has gradually decreased, indicating that the total effect of greening on the reduction in the intensity of carbon emissions has been declining. Owing to a lack of statistical resources and environmental data before 2004, this study analyzed only the impacts of greenization on the marginal utility of the intensity of carbon emissions since 2004. According to the law of marginal utility in microeconomics, it can be inferred that before 2004, the impact of greenization on the marginal utility of the intensity of carbon emissions gradually increased. However, the marginal utility decreased during the period of analysis, and has assumed a negative value in recent years. This indicates that China is relying on traditional processes to reduce its intensity of emissions. The role of traditional measures of economic and ecological environment in promoting greenization is thus no longer significant. China’s efforts to promote energy conservation and emissions reduction require refined, intensive, and targeted management processes to: (1) Strengthen the reduction of major pollutants; (2) Promote an efficient industrial structure and optimize the energy structure; (3) Promote energy-saving work and clean production in industries that consume a large amount of energy; (4) Establish a market-oriented mechanism for energy conservation and emissions reduction; and (5) Promote the transformation from epitaxial to intrinsic emissions reduction.
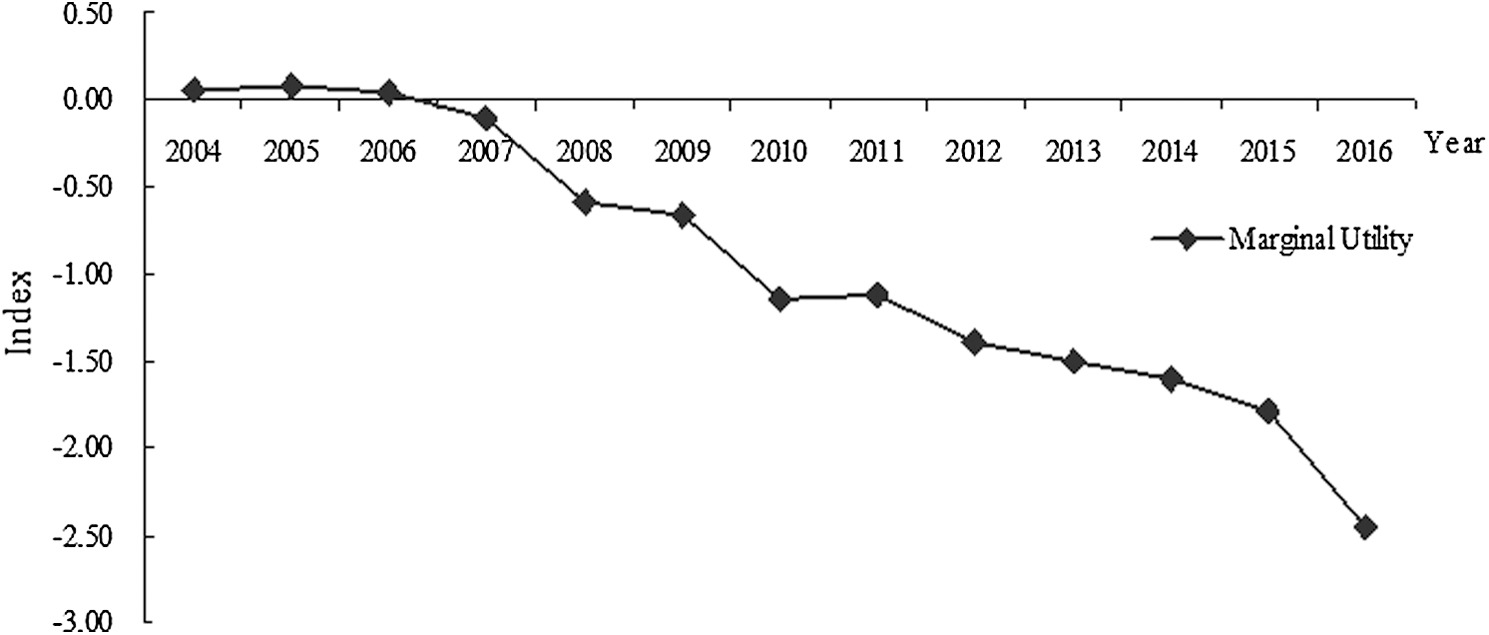
Figure 4: Marginal utility of the intensity of carbon emissions under China’s greenization process from 2004 to 2016
The impact of China’s greenization on the marginal utility of the intensity of carbon emissions was analyzed from the perspective of the interactions between humans and nature, and eight factors were selected from the three facets of the economy, society, and the environment. Shao et al.’s work [56] and Liu et al.’s work [57] were used as reference. The first factor, GDP per capita, was used to represent the level of economic development. The second, the degree of optimization of the industrial structure, was expressed as the ratio of tertiary industry to all industry in China. The third, the level of urbanization, was expressed as the ratio of the population residing in urban areas. The fourth, living standard of residents, was expressed as the per capita disposable income of urban residents. The fifth, the structure of energy consumption, was expressed as the ratio of the consumption of coal for energy to total energy consumption. The sixth, the level of scientific and technological development, was expressed as the ratio of expenditure on research and development. The seventh, intensity of environmental regulation, was expressed as the number of people employed in environmental protection units. The eighth, environmental quality, was expressed as the volume of wastewater discharged per capita.
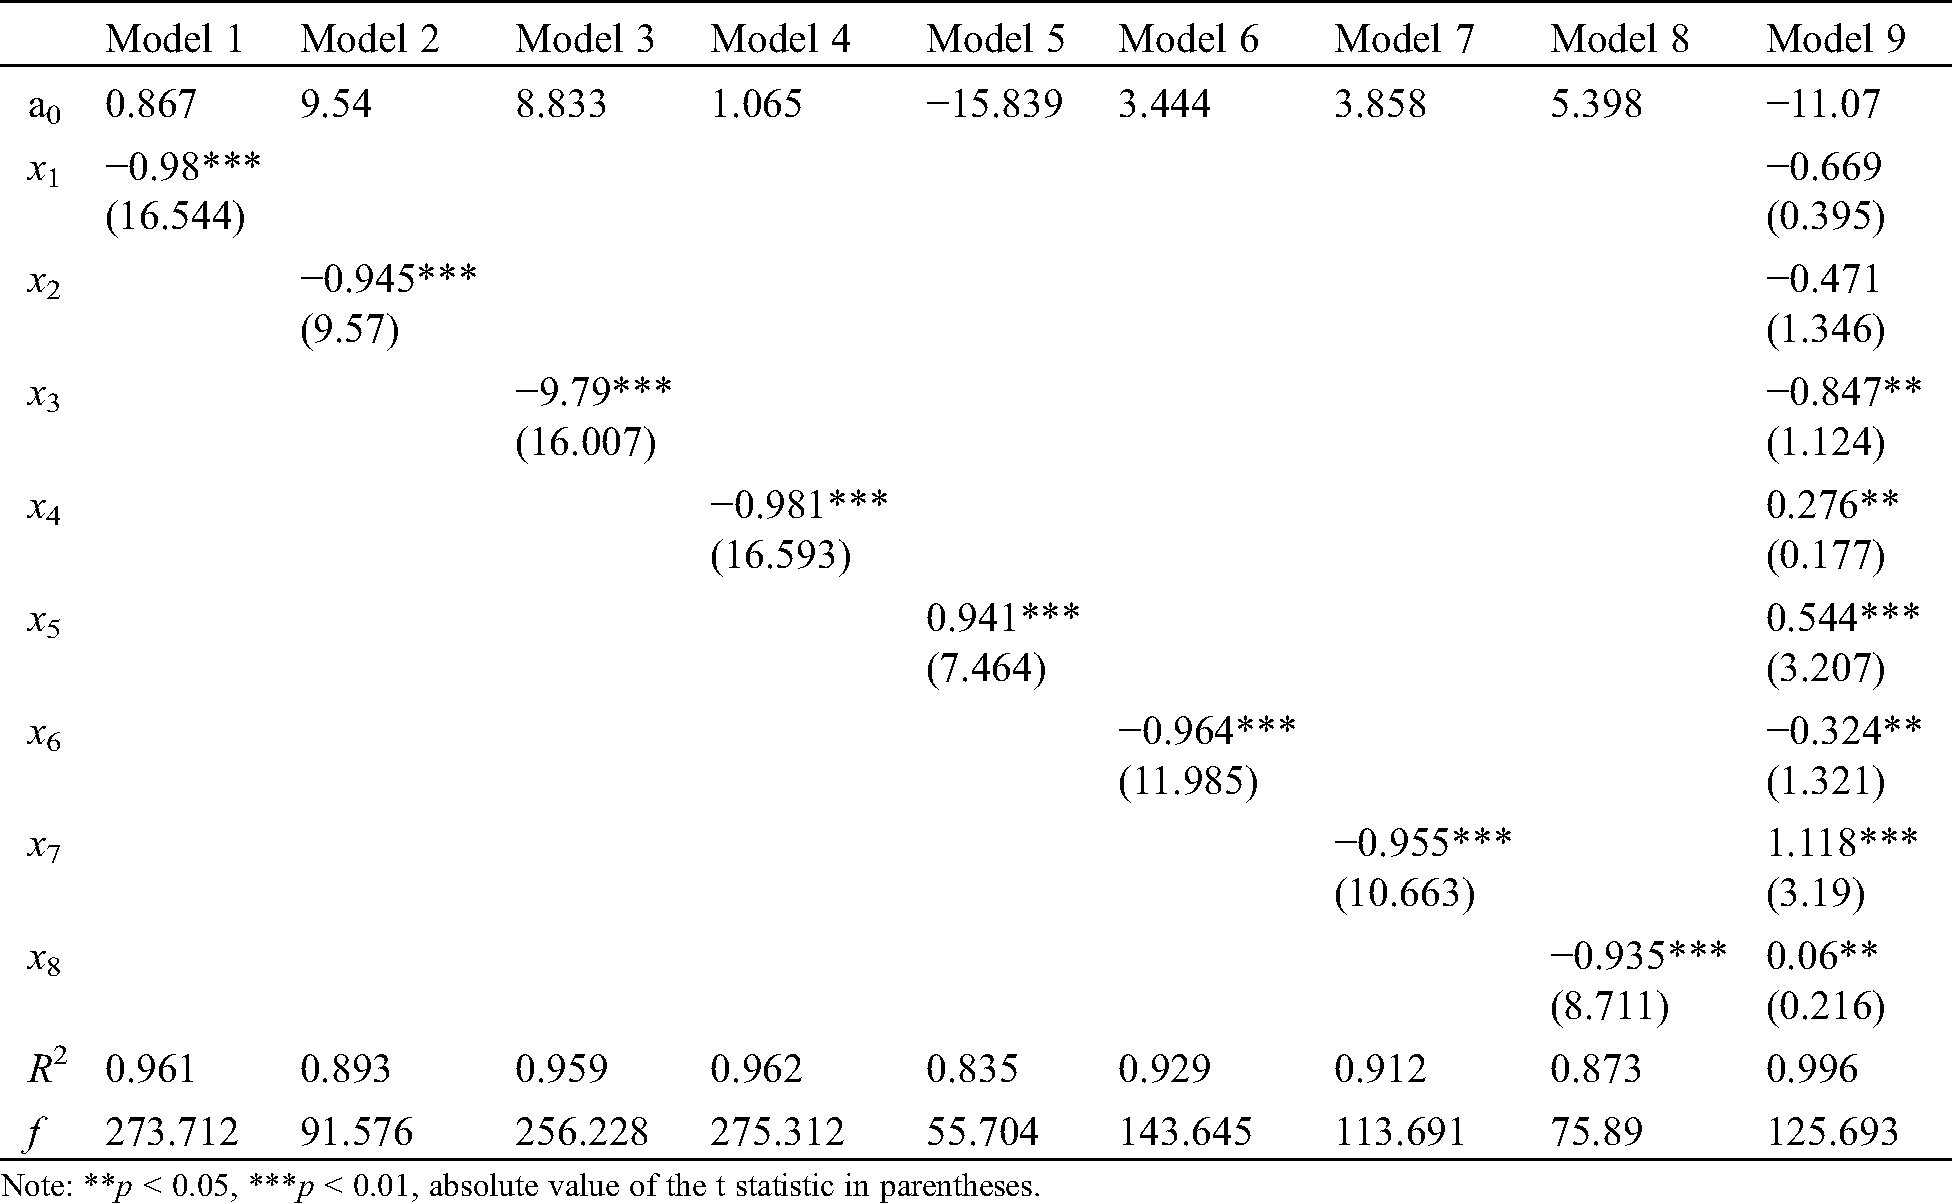
To further determine the extent of the impact of different factors on marginal utility, the impact of greenization on the marginal utility of the intensity of carbon emissions was taken as the dependent variable, and the level of economic development, the degree of optimization of the industrial structure, the level of urbanization, living standard of residents, structure of energy consumption, the level of scientific and technological development, intensity of environmental regulation, and environmental quality were taken as the independent variables:  , respectively. A linear regression equation was established:

SPSS 21.0 software was used for data analysis, and the results are shown in Tab. 3. To increase the reliability of the results, the eight independent variables were first used for the regression analysis with the dependent variable (Models 1–8, respectively), and were then taken as independent together in the regression analysis (Model 9). According to the results, in particular those of Model 9, the partial regression coefficients of the levels of urbanization, and scientific and technological development were both negative, which indicates that these factors were obstacles to, or had a negative impact on, the marginal utility of the intensity of carbon emissions. The structure of energy consumption had a positive impact in the regression model tests, which indicates that it had a positive influence on the marginal utility of the intensity of carbon emissions. The level of economic development and the degree of optimization of the industrial structure did not pass the significance test in Model 9, and the influence of these two factors on the diminishing marginal utility needs to be further tested. The results for the living standard of residents, intensity of environmental regulation, and environmental quality were not consistent in the two tests, which indicates that their impacts on the marginal utility of the intensity of carbon emissions varied under different conditions.
Table 3: Results of a regression analysis of the impact of greenization on the marginal utility the intensity of carbon emissions in China
During China transition to urbanization, the model of development model has transformed from traditional patterns of urbanization to those of new urbanization, the goal of development have transformed from the pursuit of speed to that of quality. The factors influencing environmental protection, and energy saving, and resource-bearing capacity have been considered in the new type of urbanization, which has characteristics of green urbanization and low carbon emission. This has changed the environmental pollution caused by the large-scale agglomeration of traditional urbanized populations, and has a negative impact on marginal effects. As a result, China needs to continue to promote coupling and coordination between urbanization and the ecological environment.
Scientific and technological development in China is advancing. Scientific innovation and technological progress can improve the efficiency of resource use and energy consumption, and can therefore improve environmental pollution by reducing carbon emissions. China therefore needs to improve its capacity for innovation, break through the constraints of key and core technologies, and rely on scientific and technological innovation to overcome the constraints of resources and environmental bottlenecks, develop and utilize clean energy, and develop clean production technology and pollution control technology.
Although the proportional contribution of coal to China’s structure of energy consumption has declined in recent years, China is still the world’s largest consumer of coal, and coal still accounts for the largest category of energy production in the country. Coal burning is an important source of carbon emissions, and therefore the structure of energy consumption reduces the marginal utility of the intensity of carbon emissions. Reducing the consumption of coal resources and improving the structure of energy utilization are the most direct ways for China to achieve its target of a peak in its carbon emissions by 2030. Therefore, the structure of energy consumption, environmental protection in energy production, and low-carbon development should be the top priorities for China in promoting an ecological civilization and greenization.
Theoretically, improving the level of economic development and optimizing the industrial structure can promote green growth in a greenization system, further encouraging the transformation into an efficient, environmentally sustainable, and green economy. Optimizing the industrial structure also contributes to the optimization of the energy structure, which should in turn improve the marginal utility of the intensity of carbon emissions. However, the level of economic development and the degree of optimization of the industrial structure did not pass the significance test in Model 9. Whether these factors help improve the marginal utility of the intensity of carbon emissions remains to be verified.
The living standards of residents, intensity of environmental regulation, and environmental quality should improve the marginal utility of the intensity of carbon emissions. With improvements in the living standards of residents, people tend to pursue low-carbon living. Improving the intensity of environmental regulation and environmental quality can promote the level of green wealth in the greenization process. In addition, strengthening environmental regulation can encourage enterprises to reduce carbon emissions, but the results of the regression models were inconsistent here. In Models 4, 7, and 8, with these three factors as independent variables, the three factors improved the marginal utility of the intensity of carbon emissions, which is consistent with the above theoretical analysis. However, in Model 9, where all factors were combined, these three factors had the opposite impact, which illustrates that they can transform the marginal utility of the intensity of carbon emissions in a complex manner under different economic, social, and environmental conditions. Therefore, it is necessary to weaken the influence of other factors to promote the living standards of residents, intensity of environmental regulation, and environmental quality to improve the impact of greenization on the marginal utility of the intensity of carbon emissions.
Studies on the marginal utility of the intensity of carbon emissions in the process of China’s greenization have theoretical value for better explaining the relationship between greenization and carbon emissions, and practical value for guiding energy conservation and emissions reduction in China. This study, which measured the level of greenization and the intensity of carbon emissions in China, made use of the production function model to analyze the impact of China’s greenization on the marginal utility of the intensity of carbon emissions during 2004–2016, and conducted a regression analysis to analyze factors that influence the marginal utility. The following conclusions were obtained: (1) The overall level of China’s greenization is increasing and the overall the intensity of carbon emissions is declining. However, the impact of greenization on the marginal utility of the intensity of carbon emissions is already in a stage of decline. (2) The levels of urbanization, and scientific and technological development have a negative impact on the diminishing marginal utility of the intensity of carbon emissions, while the structure of energy consumption has had a positive impact on it. This conclusion is identical to that of Cheng et al. [38] and Dong et al. [39]. The structure of energy consumption exerts a positive impact on carbon emissions, because of which it is necessary to change the structure of energy consumption, which is dominated by coal. Further studies are required to verify the impact of the level of economic development and the degree of optimization of the industrial structure, while the impact of the living standards of residents, intensity of environmental regulation, and environmental quality have varied under different conditions. The policy implications includes: (1) New urbanization model is necessary for China, urban planning should be undertaken at a purposeful scale and avoid a dilution of resources caused by traditional urbanization mode. To realize the coordinated development of urbanization and ecological environment, the spatial structure and scale structure of cities should be undertaken based on the carrying capacity of ecological environment. (2) The role of scientific and technological development in greenization should be fully utilized. The technology of energy conservation, resource cycle, pollution control and ecological restoration could be seen as the driving force of greenization. (3) The structure of energy consumption must be changed. Measures should be taken at the technical level, to introduce production and energy consumption technologies. Industries and enterprises with large energy consumption should improve energy efficiency.
Carbon emissions are a problem that countries of the world are working together to solve in the backdrop of global warming. In the scenario in which green development has become the main theme of global development, this study will help better understand the impact of greenization on carbon emissions in the process of development, and will provide a reasonable path to greenization to reduce carbon emissions. Previous studies on the factors influencing carbon emissions have used spatial econometric and regression models to study the impacts of economic, social, and resource-related factors on carbon emissions. This study used the marginal utility.
At the national level, it is necessary to clarify the relationship between greenization and the intensity of carbon emissions, including the major features of and general rules for promoting greenization and reducing carbon emissions. This will enable the development of a roadmap for reducing carbon emissions and ensure that China meets its target of a peak in carbon emissions by 2030. However, China has a vast territory and significant regional differences, and future research therefore needs to use panel data to study the relation between greenization and carbon emissions in different regions. Typical regions and industries should be selected to analyze the measures required as well as options for greenization to promote a reduction in carbon emissions. This will help more comprehensively and systematically evaluate the relationship between greenization and the intensity of carbon emissions, and enable different regions to reduce the intensity of carbon emissions through greenization. Studies on the impact of greenization on the marginal utility of the intensity of carbon emissions offer a perspective on the wider relationship between greenization and carbon emissions. They can be used to construct a framework for the theoretical analysis of greenization and carbon emissions. Spatial econometric models based on panel data can be used to further verify the impact of the level of economic development and the degree of optimization of the industrial structure on the intensity of carbon emissions.
Funding Statement: This paper was supported by National Natural Science Foundation of China (72004124) and the Social Sciences Planning Project of Shandong Province (20BJJJ06).
Conflicts of Interest: The authors declare that they have no conflicts of interest to report regarding the present study.
1. Liu, Y. (2019). Enacting a low-carbon economy: Policies and distrust between government employees and enterprises in China. Energy Policy, 130, 130–138. DOI 10.1016/j.enpol.2019.04.001. [Google Scholar] [CrossRef]
2. Liu, K., Ren, J. L., Wang, C. X. (2016). Evolution characteristic and influence factors of China’s greenization. Urban Problems, (4), 11–17. DOI 10.13239/j.bjsshkxy.cswt.160402. [Google Scholar] [CrossRef]
3. Cuffey, K. M., Françoise, V. (2001). Covariation of carbon dioxide and temperature from the Vostok ice core after deuterium-excess correction. Nature, 412(6846), 523–527. DOI 10.1038/35087544. [Google Scholar] [CrossRef]
4. Cui, X. L., Lei, Y. T., Zhang, F., Zhang, X. Y., Wu, F. (2019). Mapping spatiotemporal variations of CO2 (carbon dioxide) emissions using nighttime light data in Guangdong Province. Physics and Chemistry of the Earth, 110, 89–98. DOI 10.1016/j.pce.2019.01.007. [Google Scholar] [CrossRef]
5. Olivier, J. G. J., Janssens, M., Muntean, M. (2014). Trends in global CO2 emissions: 2014 report. Hague: PBL Netherlands Environmental Assessment Agency. [Google Scholar]
6. Quire, C. L., Moriarty, R., Andrew, R. M. (2015). Global carbon budget 2014. Earth System Science Data Discussions, 7(2), 521–610. DOI 10.5194/essdd-7-521-2014. [Google Scholar] [CrossRef]
7. Hall, B., Kerr, M. L. (1991). 1991-1992 green index: A state-by-state guide to the nation’s environmental health. Washington, DC: Island Press. [Google Scholar]
8. Chua, S. C., Oh, T. H. (2011). Green progress and prospect in Malaysia. Renewable and Sustainable Energy Reviews, 15(6), 2850–2861. DOI 10.1016/j.rser.2011.03.008. [Google Scholar] [CrossRef]
9. Song, X., Hao, Y., Zhu, X. (2015). Analysis of the environmental efficiency of the Chinese transportation sector using an undesirable output slacks-based measure data envelopment analysis model. Sustainability, 7(7), 9187–9206. DOI 10.3390/su7079187. [Google Scholar] [CrossRef]
10. Chen, C. F., Han, J., Fan, P. L. (2016). Measuring the level of industrial green development and exploring its influencing factors: Empirical evidence from China’s 30 provinces. Sustainability, 8(2), 153–173. DOI 10.3390/su8020153. [Google Scholar] [CrossRef]
11. Sun, C. Z., Tong, Y. L., Zou, W. (2018). The evolution and a temporal-spatial difference analysis of green development in China. Sustainable Cities and Society, 41, 52–61. DOI 10.1016/j.scs.2018.05.006. [Google Scholar] [CrossRef]
12. Wang, M. X., Zhao, H. H., Cui, J. X., Fan, D., Lv, B. et al. (2018). Evaluating green development level of nine cities within the Pearl River Delta, China. Journal of Cleaner Production, 174, 315–323. DOI 10.1016/j.jclepro.2017.10.328. [Google Scholar] [CrossRef]
13. Yang, Y. Y., Guo, H. X., Chen, L. F., Liu, X., Gu, M. Y. et al. (2019). Regional analysis of the green development level differences in Chinese mineral resource-based cities. Resources Policy, 61, 261–272. DOI 10.1016/j.resourpol.2019.02.003. [Google Scholar] [CrossRef]
14. Yang, L., Huang, P. P. (2019). Has the level of green development in the northwestern provinces of China truly improved? A case study of Shaanxi. Sustainable Cities and Society, 51, 1–34. DOI 10.1016/j.scs.2019.101779. [Google Scholar] [CrossRef]
15. Xie, H. L., Chen, Q. R., Wang, W., He, Y. F. (2018). Analyzing the green efficiency of arable land use in China. Technological Forecasting and Social Change, 133, 15–28. DOI 10.1016/j.techfore.2018.03.015. [Google Scholar] [CrossRef]
16. Zhang, J. X., Chang, Y., Wang, C. B., Zhang, L. X. (2018). The green efficiency of industrial sectors in China: A comparative analysis based on sectoral and supply-chain quantifications. Resources, Conservation and Recycling, 132, 269–277. DOI 10.1016/j.resconrec.2017.02.015. [Google Scholar] [CrossRef]
17. Júnior, R. D. L., Nunes, A. O., Costa, L. B. M., Silva, D. A. L. (2018). Creating value with less impact: Lean, green and eco-efficiency in a metalworking industry towards a cleaner production. Journal of Cleaner Production, 196, 517–534. DOI 10.1016/j.jclepro.2018.06.064. [Google Scholar] [CrossRef]
18. Tao, X. P., Wang, P., Zhu, B. Z. (2016). Provincial green economic efficiency of China: A non-separable input–output SBM approach. Applied Energy, 171, 58–66. DOI 10.1016/j.apenergy.2016.02.133. [Google Scholar] [CrossRef]
19. Wang, Z. B., Wang, X. M., Liang, L. W. (2019). Green economic efficiency in the Yangtze River Delta: Spatiotemporal evolution and influencing factors. Ecosystem Health and Sustainability, 5(1), 20–35. DOI 10.1080/20964129.2018.1559000. [Google Scholar] [CrossRef]
20. Qu, Y., Yu, Y., Appolloni, A., Li, M. R., Liu, Y. (2017). Measuring green growth efficiency for Chinese manufacturing industries. Sustainability, 9(4), 637–655. DOI 10.3390/su9040637. [Google Scholar] [CrossRef]
21. Ma, L., Long, H. L., Chen, K. Q., Tu, S. S., Zhang, Y. N. et al. (2019). Green growth efficiency of Chinese cities and its spatio-temporal pattern. Resources, Conservation and Recycling, 146, 441–451. DOI 10.1016/j.resconrec.2019.03.049. [Google Scholar] [CrossRef]
22. Charnes, A., Cooper, W. W., Rhodes, E. (1978). Measuring the efficiency of decision making units. European Journal of Operational Research, 2(6), 429–444. DOI 10.1016/0377-2217(78)90138-8. [Google Scholar] [CrossRef]
23. Bai, Y., Hua, C. C., Jiao, J. L., Yang, M., Li, F. Y. (2018). Green efficiency and environmental subsidy: Evidence from thermal power firms in China. Journal of Cleaner Production, 188, 49–61. DOI 10.1016/j.jclepro.2018.03.312. [Google Scholar] [CrossRef]
24. Chen, L. L., Zhang, X. D., He, F., Yuan, R. S. (2019). Regional green development level and its spatial relationship under the constraints of haze in China. Journal of Cleaner Production, 210, 376–387. DOI 10.1016/j.jclepro.2018.11.037. [Google Scholar] [CrossRef]
25. Song, M. L., An, Q., Zhang, W., Wang, Z., Wu, J. (2012). Environmental efficiency evaluation based on data envelopment analysis: A review. Renewable and Sustainable Energy Reviews, 16(7), 4465–4469. DOI 10.1016/j.rser.2012.04.052. [Google Scholar] [CrossRef]
26. Yang, Q., Wan, X. Z., Ma, H. M. (2015). Assessing green development efficiency of municipalities and provinces in China integrating models of super-efficiency DEA and Malmquist index. Sustainability, 7(4), 4492–4510. DOI 10.3390/su7044492. [Google Scholar] [CrossRef]
27. Chen, N. C., Xu, L., Chen, Z. Q. (2017). Environmental efficiency analysis of the Yangtze River Economic Zone using super efficiency data envelopment analysis (SEDEA) and tobit models. Energy, 134, 659–671. DOI 10.1016/j.energy.2017.06.076.
28. Zhang, J. R., Zeng, W. H., Wang, J. N., Yang, F. L., Jiang, H. Q. (2017). Regional low-carbon economy efficiency in China: Analysis based on the Super-SBM model with CO2 emissions. Journal of Cleaner Production, 163, 202–211. DOI 10.1016/j.jclepro.2015.06.111. [Google Scholar] [CrossRef]
29. Cui, Y. J., Huang, G. L., Yin, Z. Y. (2015). Estimating regional coal resource efficiency in China using three-stage DEA and bootstrap DEA models. International Journal of Mining Science and Technology, 25(5), 861–864. DOI 10.1016/j.ijmst.2015.07.024. [Google Scholar] [CrossRef]
30. Jebali, E., Essid, H., Khraief, N. (2017). The analysis of energy efficiency of the Mediterranean countries: A two-stage double bootstrap DEA approach. Energy, 134, 991–1000. DOI 10.1016/j.energy.2017.06.063.
31. Yang, H. R., Zheng, H., Liu, H. G., Wu, Q. (2019). NonLinear effects of environmental regulation on eco-efficiency under the constraint of land use carbon emissions: Evidence based on a bootstrapping approach and panel threshold model. International Journal of Environmental Research and Public Health, 16(10), 1679. DOI 10.3390/ijerph16101679. [Google Scholar] [CrossRef]
32. Jiang, M. H., An, H. Z., Gao, X. Y., Liu, S. Y., Xi, X. A. (2019). Factors driving global carbon emissions: A complex network perspective. Resources, Conservation and Recycling, 146, 431–440. DOI 10.1016/j.resconrec.2019.04.012. [Google Scholar] [CrossRef]
33. York, R., Rosa, E. A., Dietz, T. (2003). Footprints on the earth: The environmental consequences of modernity. American Sociological Review, 68(2), 279–300. DOI 10.2307/1519769. [Google Scholar] [CrossRef]
34. Lee, K., Oh, W. (2006). Analysis of CO2 emissions in APEC countries: A time-series and a cross-sectional decomposition using the log mean Divisia method. Energy Policy, 34(17), 2779–2787. DOI 10.1016/j.enpol.2005.04.019. [Google Scholar] [CrossRef]
35. Sharma, S. S. (2011). Determinants of carbon dioxide emissions: Empirical evidence from 69 countries. Applied Energy, 88(1), 376–382. DOI 10.1016/j.apenergy.2010.07.022. [Google Scholar] [CrossRef]
36. Tsai, S. F. (2014). Analysis of influencing factors on regional carbon emission intensity in China-based on empirical research with provincial panel data. Journal of Sustainable Development, 7(3), 83–95. DOI 10.5539/jsd.v7n3p83. [Google Scholar] [CrossRef]
37. Shahbaz, M., Loganathan, N., Muzaffar, A. T., Ahmed, K., Jabran, M. A. (2016). How urbanization affects CO2 emissions in Malaysia? The application of STIRPAT model. Renewable and Sustainable Energy Reviews, 57, 83–93. DOI 10.1016/j.rser.2015.12.096. [Google Scholar] [CrossRef]
38. Cheng, Y., Wang, Z., Ye, X., Wei, Y. (2014). Spatiotemporal dynamics of carbon intensity from energy consumption in China. Journal of Geographical Sciences, 24(4), 631–650. DOI 10.1007/s11442-014-1110-6. [Google Scholar] [CrossRef]
39. Dong, F., Long, R., Li, Z. (2016). Analysis of carbon emission intensity, urbanization and energy mix: Evidence from China. Natural Hazards, 82(2), 1375–1391. DOI 10.1007/s11069-016-2248-6. [Google Scholar] [CrossRef]
40. Acheampong, A. O., Adams, S., Boateng, E. (2019). Do globalization and renewable energy contribute to carbon emissions mitigation in Sub-Saharan Africa? Science of the Total Environment, 677, 436–446. DOI 10.1016/j.scitotenv.2019.04.353. [Google Scholar] [CrossRef]
41. Pan, X. F., Uddin, M. K., Ai, B., Pan, X. Y., Saima, U. (2019). Influential factors of carbon emissions intensity in OECD countries: Evidence from symbolic regression. Journal of Cleaner Production, 220, 1194–1201. DOI 10.1016/j.jclepro.2019.02.195. [Google Scholar] [CrossRef]
42. Bai, Y. P., Deng, X. Z., John, G., Zhao, Z., Xu, H. (2019). How does urbanization affect residential CO2 emissions? An analysis on urban agglomerations of China. Journal of Cleaner Production, 209, 876–885. DOI 10.1016/j.jclepro.2018.10.248. [Google Scholar] [CrossRef]
43. Zakarya, G. Y., Mostefa, B., Abbes, S. M., Seghir, G. M. (2015). Factors affecting CO2 emissions in the BRICS countries: A panel data analysis. Procedia Economics and Finance, 26, 114–125. DOI 10.1016/S2212-5671(15)00890-4. [Google Scholar] [CrossRef]
44. Wang, Z., Deng, X. Z., Bai, Y. P., Chen, J. C., Zheng, W. T. (2016). Land use structure and emission intensity at regional scale: A case study at the middle reach of the Heihe River basin. Applied Energy, 183, 1581–1593. DOI 10.1016/j.apenergy.2016.09.109.
45. Zheng, J. L., Mi, Z. F., Coffman, D. M., Milcheva, S., Shan, Y. L. et al. (2019). Regional development and carbon emissions in China. Energy Economics, 81, 25–36. DOI 10.1016/j.eneco.2019.03.003.
46. Pei, Y., Zhu, Y. M., Liu, S. X., Wang, X. C., Cao, J. J. (2019). Environmental regulation and carbon emission: The mediation effect of technical efficiency. Journal of Cleaner Production, 236, 117599. DOI 10.1016/j.jclepro.2019.07.074.
47. Zhang, Y. J., Sun, Y. F., Huang, J. L. (2018). Energy efficiency, carbon emission performance, and technology gaps: Evidence from CDM project investment. Energy Policy, 115, 119–130. DOI 10.1016/j.enpol.2017.12.056. [Google Scholar] [CrossRef]
48. Liu, K., Xue, M., Peng, M., Wang, C. (2020). Impact of spatial structure of urban agglomeration on carbon emissions: An analysis of the Shandong Peninsula, China. Technological Forecasting & Social Change, 161, 120313. DOI 10.1016/j.techfore.2020.120313. [Google Scholar] [CrossRef]
49. Cary, M. (2020). Molecules of inefficiency: How tariffs impact carbon intensities, carbon dioxide emissions, and the environment. Science of the Total Environment, 713, 136531. DOI 10.1016/j.scitotenv.2020.136531. [Google Scholar] [CrossRef]
50. Grossman, G., Krueger, A. (1995). Economic growth and the environment. Quarterly Journal of Economics, 110(2), 353–377. DOI 10.2307/2118443. [Google Scholar] [CrossRef]
51. Gong, Q., Wang, Y., Tong, Y. (2020). Population’s pressure on carbon emissions in Beijing-Tianjin-Hebei Region: Spatial pattern and change analysis. Journal of Capital University of Economics and Business, 22(2), 56–67. DOI 10.13504/j.cnki.issn1008-2700.2020.02.006. [Google Scholar] [CrossRef]
52. Liu, K., Wu, Y., Tao, Y., Wang, C. (2019). The influence of ecological civilization construction to carbon emission intensity in China’s provinces. China Population, Resources and Environment, 29(7), 50–56. DOI 10.12062/cpre.20190301. [Google Scholar] [CrossRef]
53. Zou, H., Xu, F. F., Yang, S. (2013). Research on entropy-based regional innovation capability evaluation in China. Science and Technology Management Research, 23, 56–61. DOI 10.3969/j.issn.1000-7695.2013.23.012. [Google Scholar] [CrossRef]
54. Wang, H., Ang, B. W., Su, B. (2017). A multi-region structural decomposition analysis of global CO2 emission intensity. Ecological Economics, 142, 163–176. DOI 10.1016/j.ecolecon.2017.06.023. [Google Scholar] [CrossRef]
55. Dean, K., Jonathan, M. (2017). Microeconomics. China: China Machine Press. [Google Scholar]
56. Shao, S., Li, X., Cao, J. (2019). Urbanization promotion and haze pollution governance in China. Economic Research Journal, 64(2), 148–165. DOI CNKI:SUN:JJYJ.0.2019-02-011. [Google Scholar]
57. Liu, K., Wu, Y., Wang, X., Wang, C. (2020). The impact of spatial structure of urban agglomerations on air pollution in China. China Population, Resources and Environment, 30(10), 28–35. DOI 10.12062/cpre.20200904. [Google Scholar] [CrossRef]
 | This work is licensed under a Creative Commons Attribution 4.0 International License, which permits unrestricted use, distribution, and reproduction in any medium, provided the original work is properly cited. |