DOI: 10.32604/EE.2021.013890
ARTICLE
Performance Assessment of Heat Exchangers for Process Heat Integration
1Institute of Energy and Environmental Technology, Jomo Kenyatta University of Agriculture and Technology, Nairobi, Kenya
2College of Engineering and Technology, Jomo Kenyatta University of Agriculture and Technology, Nairobi, Kenya
3Office of the Deputy Vice Chancellor (Academic Affairs), Jomo Kenyatta University of Agriculture and Technology, Nairobi, Kenya
*Corresponding Author: Fenwicks Shombe Musonye. Email: fenshombe@gmail.com
Received: 25 August 2020; Accepted: 01 October 2020
Abstract: Pinch Analysis is an attractive solution for reduction of thermal energy costs in thermo-chemical industries. In this approach, maximum internally recoverable heat is determined and a heat exchange network is designed to meet the recovery targets. The thermal performance of a heat exchanger over its lifetime is however a concern to industries. Thermal performance of a heat exchanger is affected by many factors which include the physical properties of the shell and tube materials, and the chemical properties of the heat transfer fluid. In this study, thermal performance of shell and tube heat exchangers designed to meet heat recovery targets in a Pinch Analysis study is simulated. The aim of this paper is to present predictions of thermal performances of shell and tube heat exchangers with different heat transfer fluids and geometries as they undergo fouling degradation. Engineering approaches based on thermodynamic analysis, heat balance and Kern Design equations, as well as what-if simulation modeling are used in this work. Shell and tube heat exchangers were designed to meet internal heat recovery targets for three process plants, A, B and C. These targets were published in a separate paper. The effects of degradation of the tubes-due to incremental growth of fouling resistance - on thermal performance of the exchanger were simulated using Visual Basic Analysis (VBA). Overall, it was found that growth in fouling reduces thermal efficiency of shell and tube heat exchangers with an exponential relationship. An increase of 100% of fouling resistance leads to an average reduction of 0.37% heat transfer. Higher values of logarithmic mean temperature difference (LMTD) and higher ratios of external diameter to internal diameter of the exchanger tubes amplify the effect of fouling growth on thermal performance of the exchangers. The results of this work can be applied in pinch analysis, during design of heat exchangers to meet the internal heat recovery targets, especially in predicting how fouling growth can affect these targets. This can also be useful in helping operators of shell and tube heat exchangers to determine cleaning intervals of the exchangers to avoid heat transfer loss.
Keywords: Pinch analysis; internal heat recovery; thermal performance; fouling resistance; fouling growth; what if simulation; shell and tube heat exchangers
Costs of production of goods and services have been increasing, partly due to increase in the energy costs. The energy cost is associated both with the fuel and electricity purchase prices and the environmental degradation [1]. Pinch analysis is one of the process integration tools used to reduce energy consumption in thermo-chemical plants. The tool reduces costs through minimization of energy required in the processes [2]. It involves process energy balance, energy targeting and design of heat exchanger network to meet the computed energy targets [3].
Pinch analysis was first used in 1978 [4] and since then, various improvements have been suggested, with some of them successfully implemented. Some of these improvements and suggestions were highlighted in work published by [5], which include the shift from process to site wide pinch analysis, the use of stream specific values of temperature difference and a combination of principles of mathematical programming and pinch analysis. Significant improvements resulting from these suggestions have been demonstrated to work in energy targeting phases of pinch analysis. These include a combination of energy and pinch analysis [6,7], total site targeting and the use of stream specific minimum temperature difference [8].
Published work on design and simulation of heat recovery network, for example, Becker [9] and Harkin et al. [10] demonstrated that there is potential improvement in combination of mathematical programming and pinch analysis. However, as observed by reference [5], these designs in pinch analysis have not considered all attendant state variables of heat exchanger systems. Various algorithms have been developed to make the designing and incorporation of these variables easier. Notable efforts can be found in [11], for alternative Mixed Integer Linear Programming (MILP) formulations and [12], for basic MILP formulations. The authors used MILP equations and executed them using General Algebraic Modelling System (GAMS). This is perhaps one of the important steps in improving the shell and tube heat exchanger design in pinch analysis.
From the available published works in pinch analysis [6–12], little attempt has been made to investigate the ability of shell and tube heat exchangers to meet the computed heat recovery targets, over their lifetime. Thermal performance of the exchangers is bound to change with time, especially in light of growth of fouling, as this reduces the heat transfer rate [13].
Some aspects of fouling growth and performance of heat exchangers have been investigated in studies unrelated to pinch analysis. They however have not centered on thermal performance of shell and tube heat exchanger and neither have such studies elaborated how tube thickness and temperature gradient contribute to the fouling resistance effects severity on thermal performance. In [14] for example, investigation of the effects of sea water fouling on thermal efficiency of a nuclear power plant was reported. This revealed that a change in fouling factors from 0.00015 to 0.00035 m2.K/W resulted in decrease of the output power and thermal efficiency of the plant by 1.36% and 0.448%, respectively. Effects of fouling of fills in a cooling tower have been studied by [15], where the cooling tower effectiveness and the outlet water temperatures were modelled. This study used experimental data to validate the model. It was concluded that fill fouling had a bigger impact in medium sized as opposed to small sized cooling towers, with temperature decreases of 18.3 per cent and 23.5 per cent. Other studies have focused on fouling, but they were concerned with computational fluid dynamics modelling of fouling growth [16] and the effects of flow velocity on rate of fouling [17]. Effects of fouling factor on performance of shell and tube heat exchangers-in pinch analysis-can be visualized through the use of Kern Design Equations. The published studies of pinch analysis discussed here do not take into account these equations, thus missing out on capturing both the actual exchanger area and the fouling factor effects on thermal performance of the same.
This paper seeks to contribute to the research on fouling by assessing the effects of tube side fouling growth on thermal performance of shell and tube heat exchangers designed using Kern Design Equations. This assessment includes visual representation of the thermal performance curve and analysis of the effects of tube thickness and fluid temperature difference on the severity of fouling resistance in heat transfer. The assessment is based on selected 5 shell and tube heat exchangers for three plants, A, B and C. Pinch analysis was carried out in these plants and heat recovery targets were determined. The targets were published in a separate paper [18].
1.1 Pinch Analysis and Shell and Tube Heat Exchangers
Pinch analysis is a heat integration approach used to internally recover heat in thermo-chemical process plants. The analysis involves heat balancing, where the total heating loads for each process stream are determined, using the First Law of Thermodynamics. The second stage involves determination of maximum possible internally recoverable heat, using the heat cascading method. A heat exchange network is then developed to meet the computed recovery targets. Detailed description of pinch analysis can be found in [3] and [4].
A heat exchange network is made up of heat exchangers which recover heat from hot streams to cold streams. Shell and tube heat exchangers are the common types of exchangers used in thermo-chemical industries. They are described in [19]. During heat recovery, the fluids in the hot and cold streams in a processing plant are conveyed in the tube and the shell sides of the exchanger. Allocation of the fluids to either sides of the exchanger is based on factors that vary from process to process [20]. In some processes, hot fluid can be conveyed in the tube side while in others, it can be conveyed in the shell side. Fouling in heat exchangers contributes to heat transfer resistance. Growth of fouling depends on the chemical characteristics of the heat transfer fluid, the velocity profile and the temperature [21].
This study was executed in three stages:
i) Extraction of design from the previous pinch analysis study
ii) Determination of shell and tube heat exchanger areas using Kern Design Equations
iii) What-if simulation of effects of fouling on quantity of heat transferred
This work is a continuation of a pinch analysis study carried out on a sulphonation plant, a dairy processing plant and an alcohol distillery plant. The plants were named A, B and C, respectively, and they were described in [18]. The data included the chemical and physical properties of the process stream fluids from the three plants, the heat exchanger material properties and the quantity of heat to be recovered by each exchanger.
2.2 Determination of Heat Exchanger Areas
Kern Design Equations were used to take into account all the variables attendant to shell and tube exchanger heat transfer process. The starting point in design of these exchangers is expressed by:

where Uass is the estimated overall coefficient of heat transfer. Estimates of U have been published for different fluids.
LMTD is the logarithmic mean temperature difference between the medium exchanging heat, computed as:
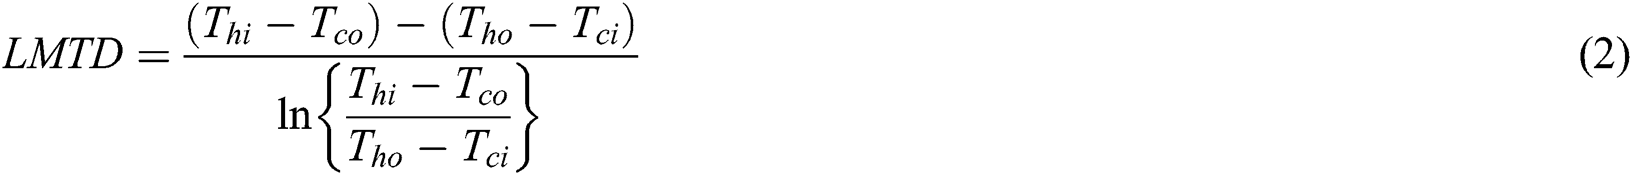
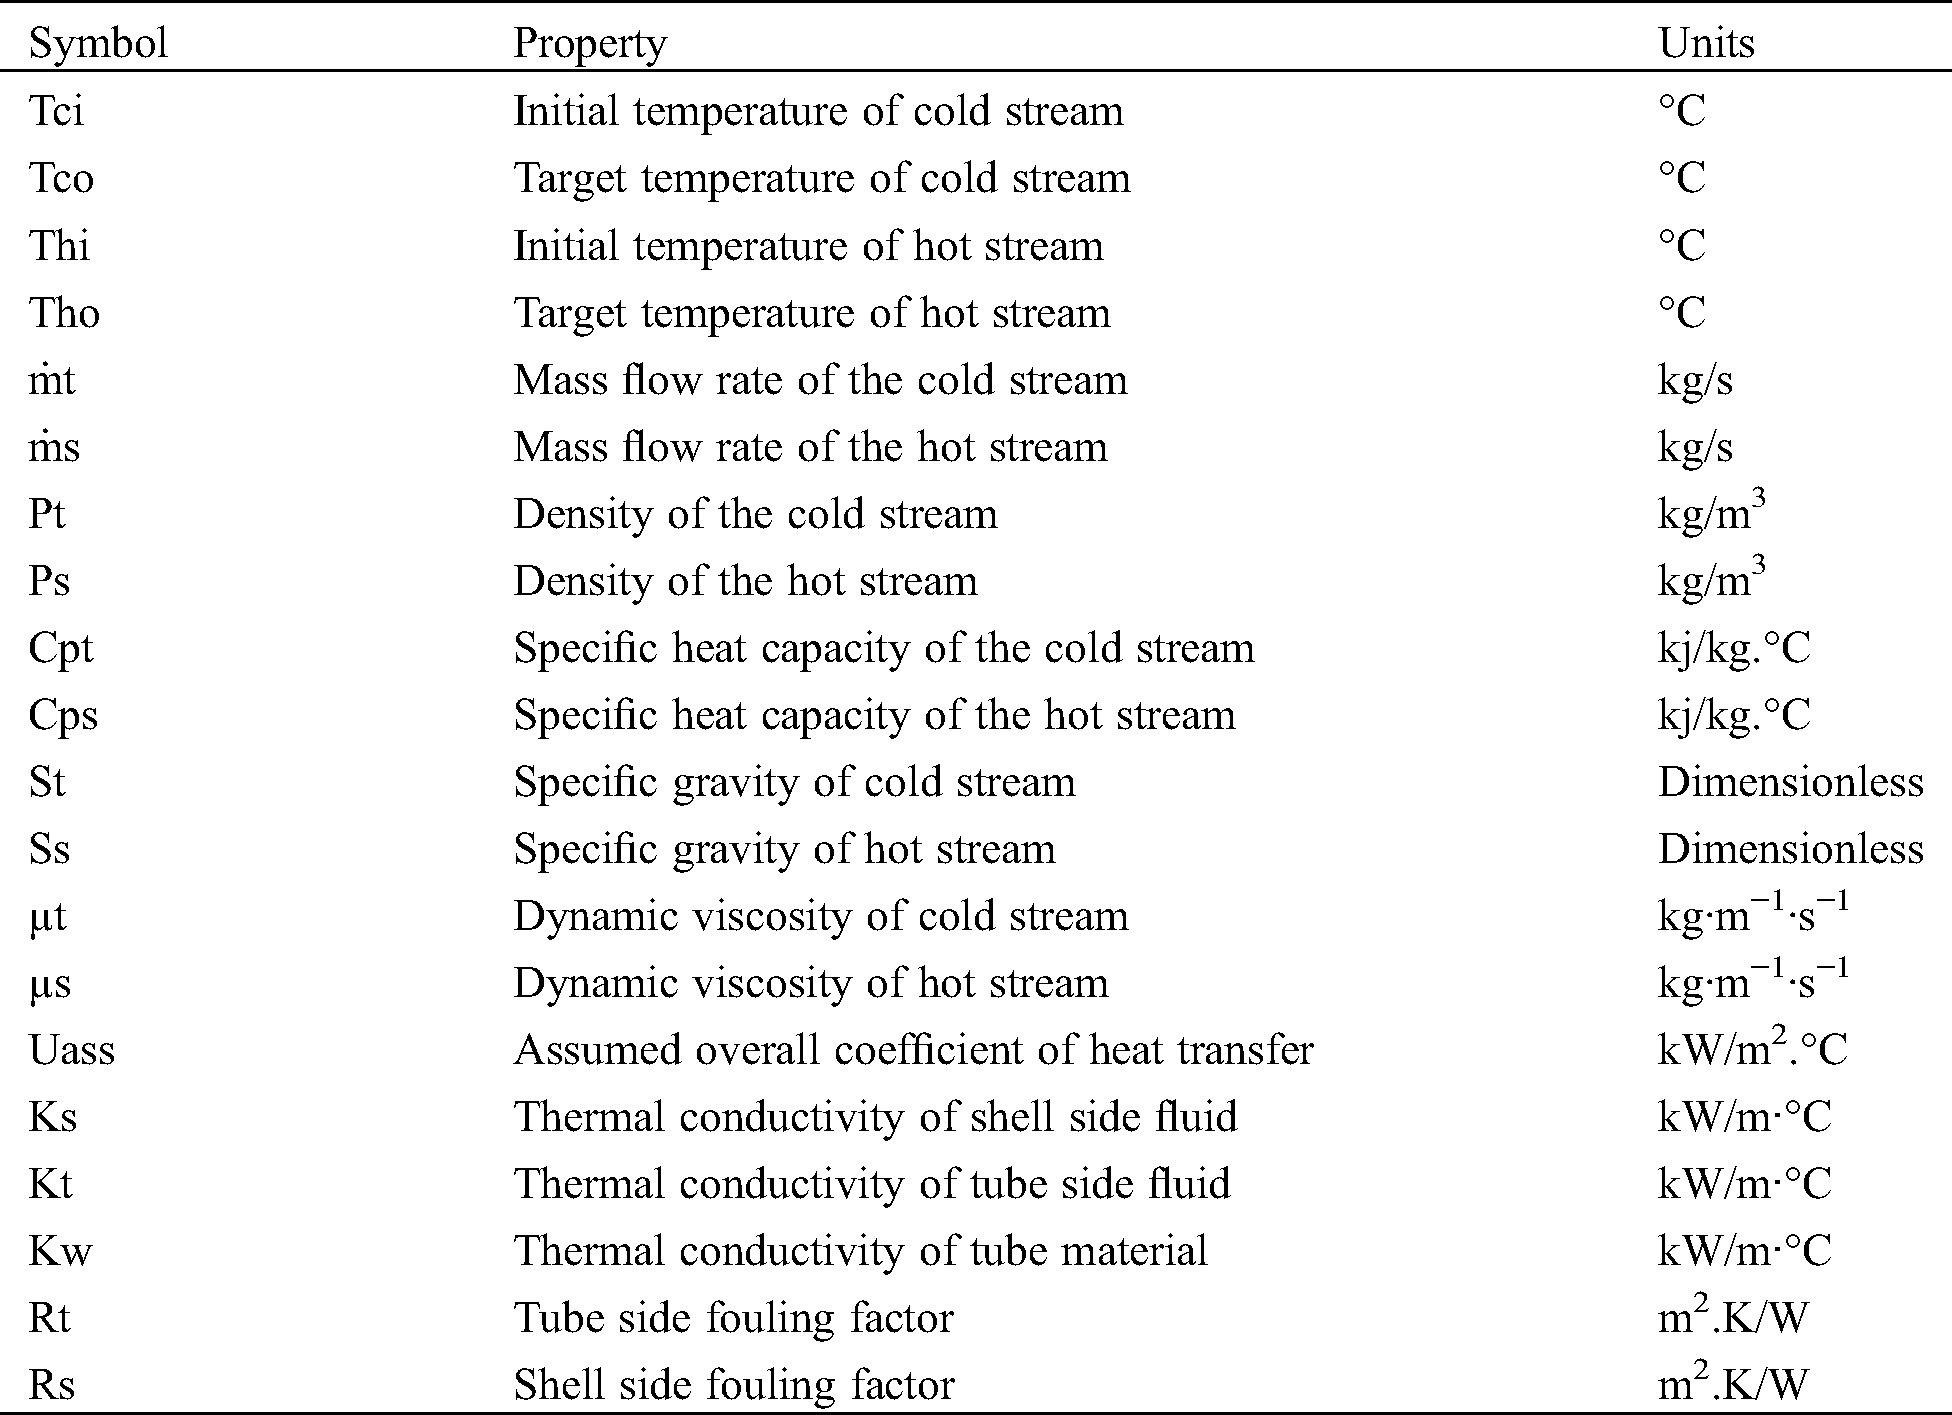
Here,
Thi is the inlet temperature of the hot fluid
Tco is the outlet temperature of the cold fluid
Tho is the outlet temperature of the hot fluid
Tci is the inlet temperature of the cold fluid
Q, the heat flux to be exchanged, is determined by the process streams variables. The hot or the cold stream can determine this value.

 is the mass flow rate of the hot fluid
Cp is the specific heat capacity of the hot fluid
Even though Eqs. (1–3) are useful in estimation of the required heat exchanger area, they do not represent the actual thermo-fluid characteristics of flow in a heat exchanger. The actual characteristics are considered by Kern equations of heat exchanger design [22]. These equations modify the LMTD and Uass, and then impose some design constraints on the fluid velocity, the Reynold’s number and the pressure drops. They as well allow selection of discrete geometrical variables.
Eq. (1) is therefore modified to become;

where Uc is the calculated overall coefficient of heat transfer and Ft is the geometric correction factor. This factor corrects for true counter flow characteristics and can be determined analytically or graphically. Uc is determined by:

In Eq. (5), all the true thermo-fluid cha}racteristics of a heat exchanger have been captured. The variables are as follows:
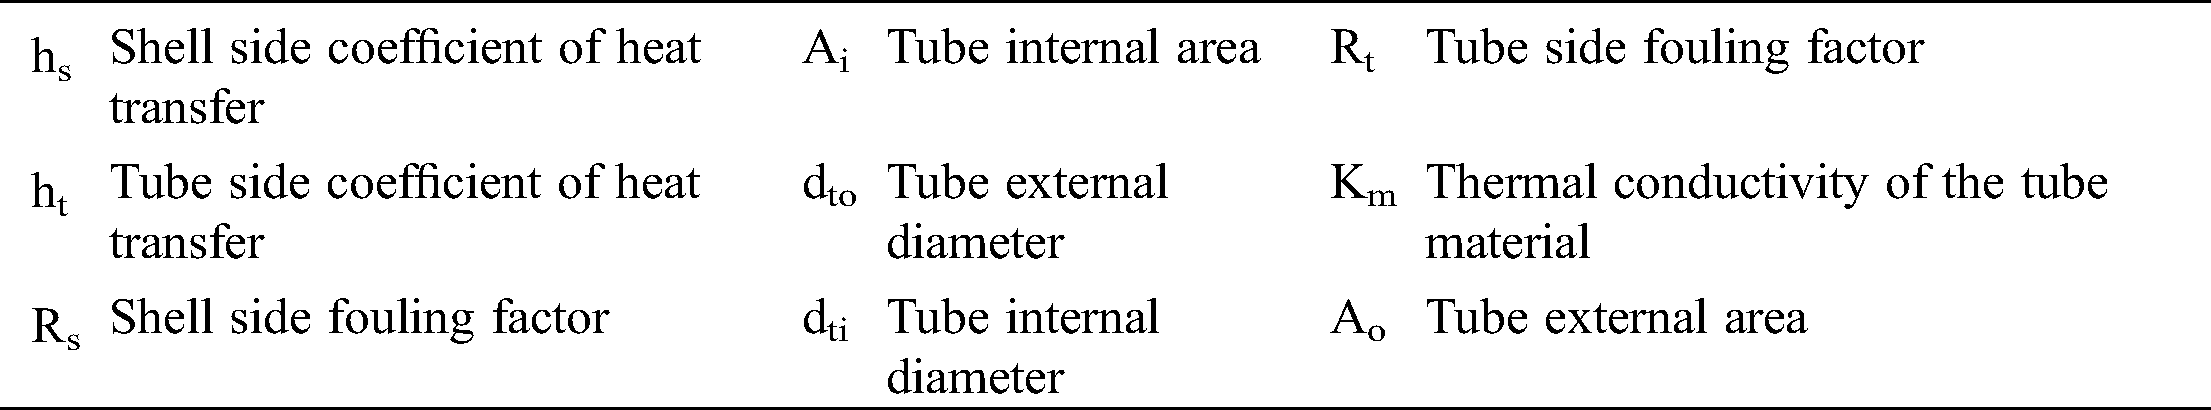
dto and dti are discrete variables, determined by Tubular Exchanger Manufacturers Association (TEMA) standards [23]. From these, Ao and Ai are derived. Thermal conductivity km is also fixed, according to the material used. Fouling factors Rs and Rt are ranges of values, provided in literature and the designer has the latitude of varying them. They are dependent of the heat transfer fluid under consideration, the surface of the tube and shell and the flow characteristics [24].
Tube side heat transfer coefficient ht is determined by:

where kt is the thermal conductivity of the tube side fluid and Nut, the tube side Nusselt number is computed using the Dittus-Boelter correlation:

Prt, the Prandtl number, is given by:

where kt is thermal conductivity of the tube side fluid, Cpc is the constant pressure specific heat capacity of the tube side fluid and µt is the tube side dynamic viscosity.
The tube side Reynold’s number, Ret, is:
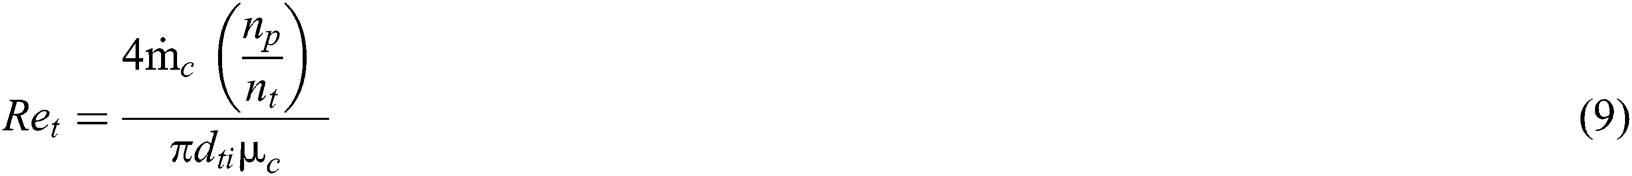
Here, c is the mass flow rate of the tube side fluid, nt is the number of tubes and np is the number of shell passes. They are discrete too, determined by TEMA standards. Initial value of nt can be determined using the formula:

L, the length of the exchange tubes, is discrete and obtained from the TEMA standards.
Ret is a design constraint. For design to be acceptable, this value should be greater than 10000. Turbulent flow is desired for optimal convective transfer of heat [15]. This value can be manipulated only through selection of dti, np and nt. Once this condition is satisfied, the tube side coefficient of heat transfer is determined.
The shell side heat transfer coefficient, hs, is determined by:

Here, ks is the thermal conductivity of the shell side fluid and Nus is the shell side Nusselt number. Nus is determined by the Nusselt number equation for turbulent sensible flow:

Shell side Prandtl number Prs is calculated using:

where Cph and µh are the isobaric specific heat capacity and the dynamic viscosity of the shell side fluid, in that order.
Shell side Reynold’s number is given by:

Gs is the shell side fluid ratio of mass flow rate. It is a function of h the shell side mass flow rate and cross-sectional flow area as.

The cross-sectional flow area as is:


Here, dto is the external diameter of the exchanger tubes.

The equivalent shell diameter De, for square pitch, is calculated using:

Eq. (1) was used to determine the required area of a heat exchanger, without considering the TEMA standards and the Kern Heat Exchanger design considerations. Eqs. (4) and (5) were used to determine the effects of fouling on thermal performance of heat exchangers.
2.3 Simulation of Effects of Fouling on Thermal Performance
For each heat exchanger, tube side fluid fouling factors were gradually increased, from the maximum design recommended value, in incremental steps of 5%, to a maximum increase of 100%. The values were obtained from [24]. The factors were varied in Eq. (5). The result was applied in Eq. (4) to get the change in the required heat exchanger area. To get the heat loss due to increased fouling resistance, a difference in the designed maximum allowable fouling resistance and the required area under fouling resistance that exceeds the design limit was used in Eq. (4), and applied as follows:

where Aadditional is the difference between required area with designed maximum allowable resistance and the required area due to fouling resistance that exceeds design limit, and Ucf is the coefficient of heat transfer after fouling growth. Qloss was plotted against the changes in fouling factor for each exchanger. At the maximum allowable design fouling factor, performance was assumed to be 100% (0 heat loss), because the exchanger meets the targets it was designed to recover. These equations were executed through VBA. Simulation was carried out on 5 heat exchangers. Selection of the exchangers was based on the type of the fluid on the tube side. The exchangers had air (Exchanger 1, Plant A), air (Exchanger 2, Plant A), water (Exchanger 3, Plant A), milk (Exchanger 1, Plant B) and wash (Exchanger 1, Plant C).
The fluid flow parameters and the Heat Exchanger Design for Plant C are presented in Tabs. 1 and 2, respectively. The parameters and design for Plants A and B are presented in the appendix section.
Table 1: Heat transfer parameters from Plant C
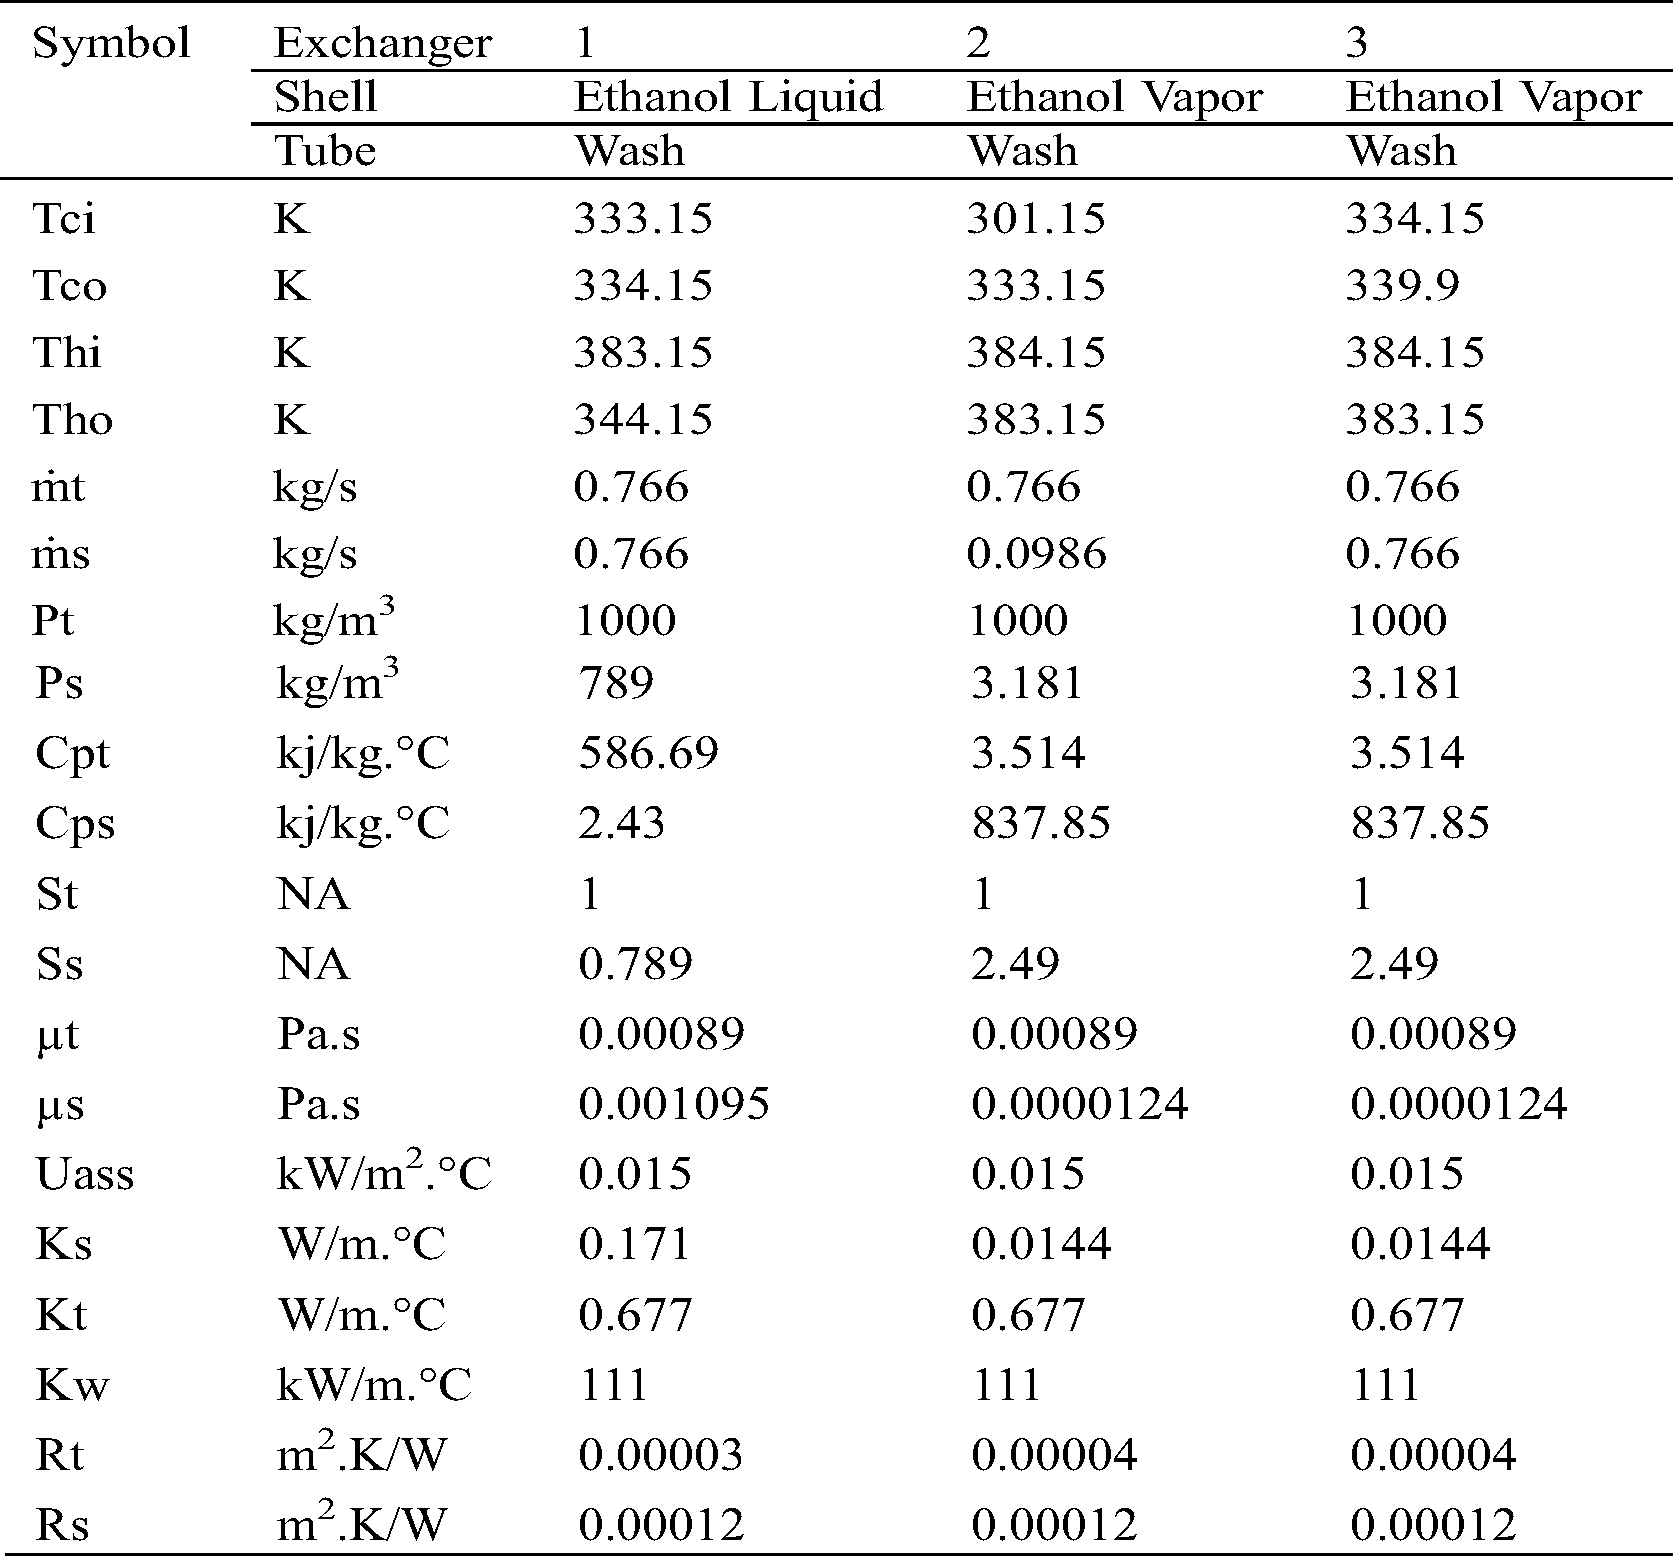
In plant C, as is for A and B, the hot fluids were allocated the shell side and the cold fluids on the tube side. The parameters in Tab. 1 were used for design of heat exchangers for Plant C, shown in Tab. 2.
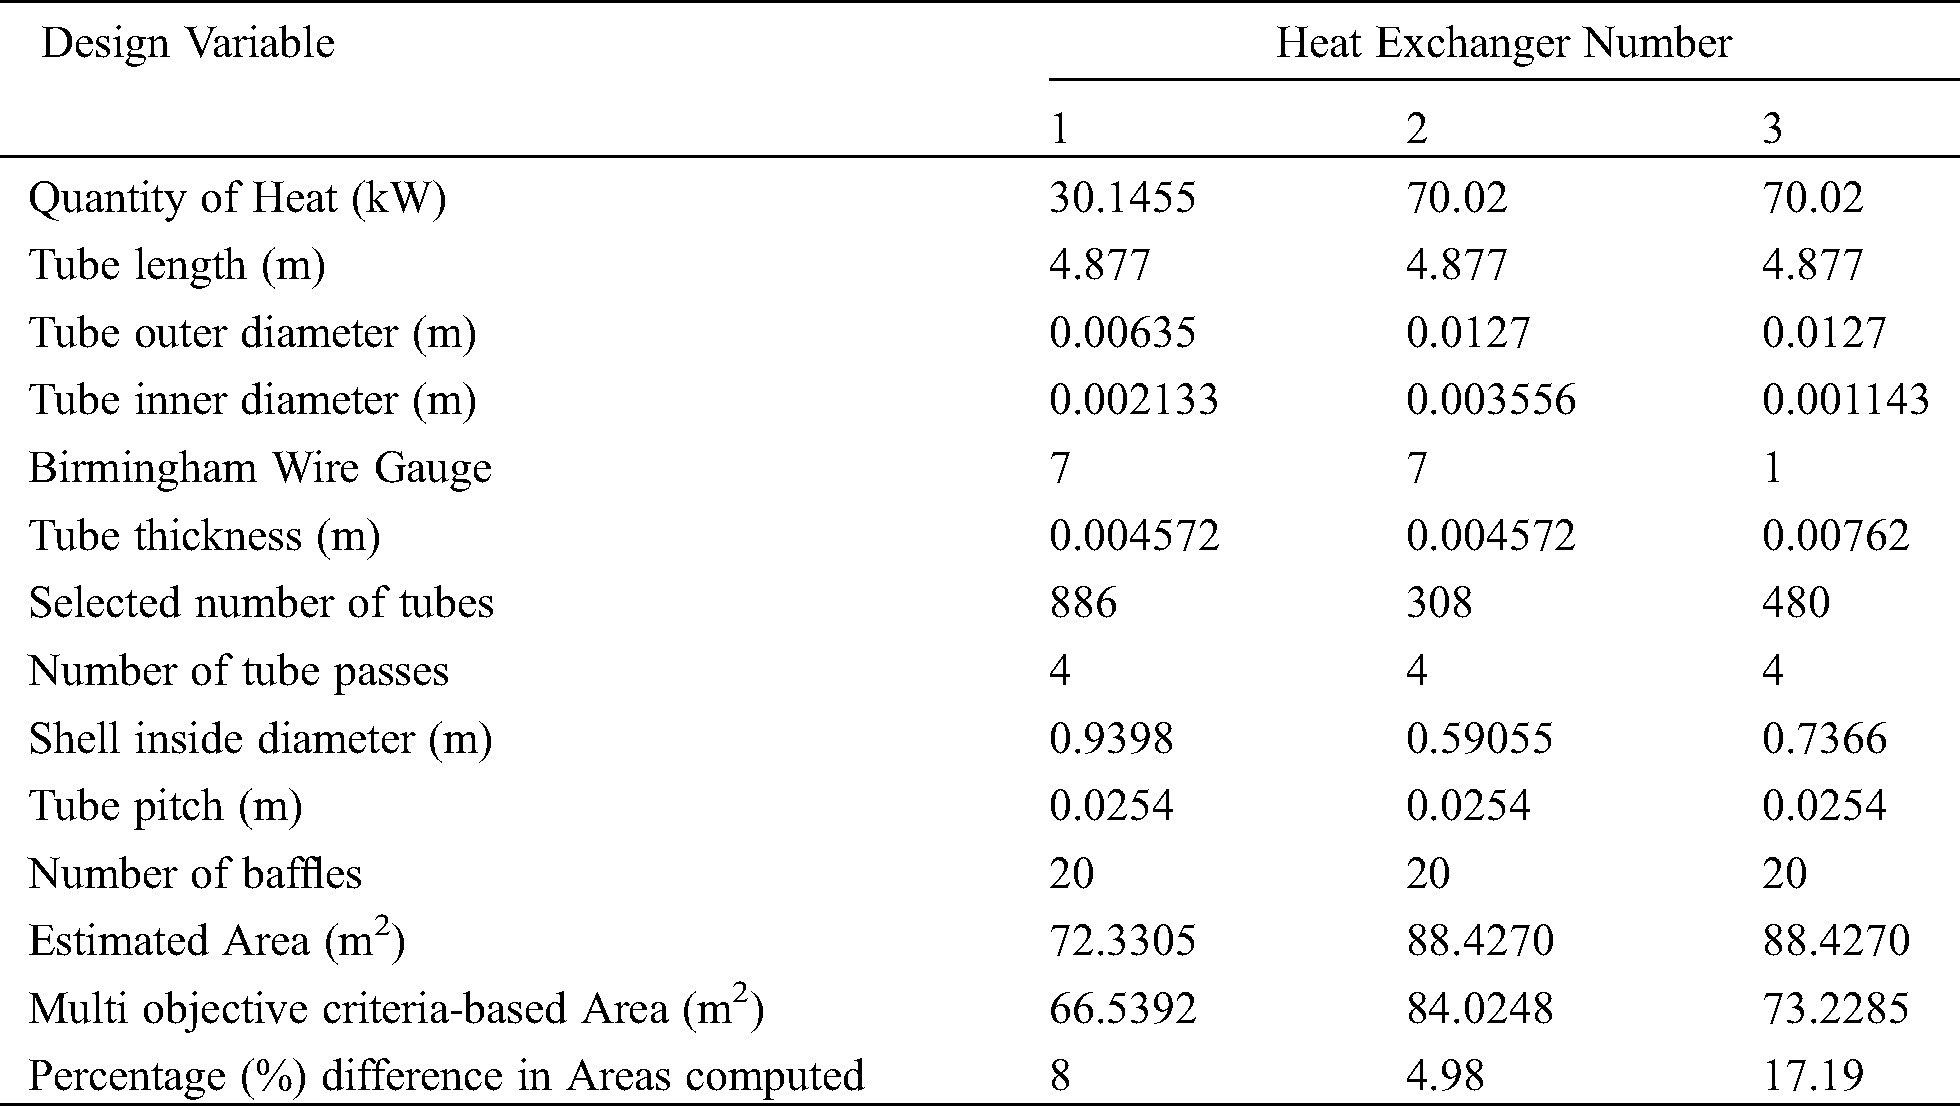
Table 2: Heat exchanger design for plant C
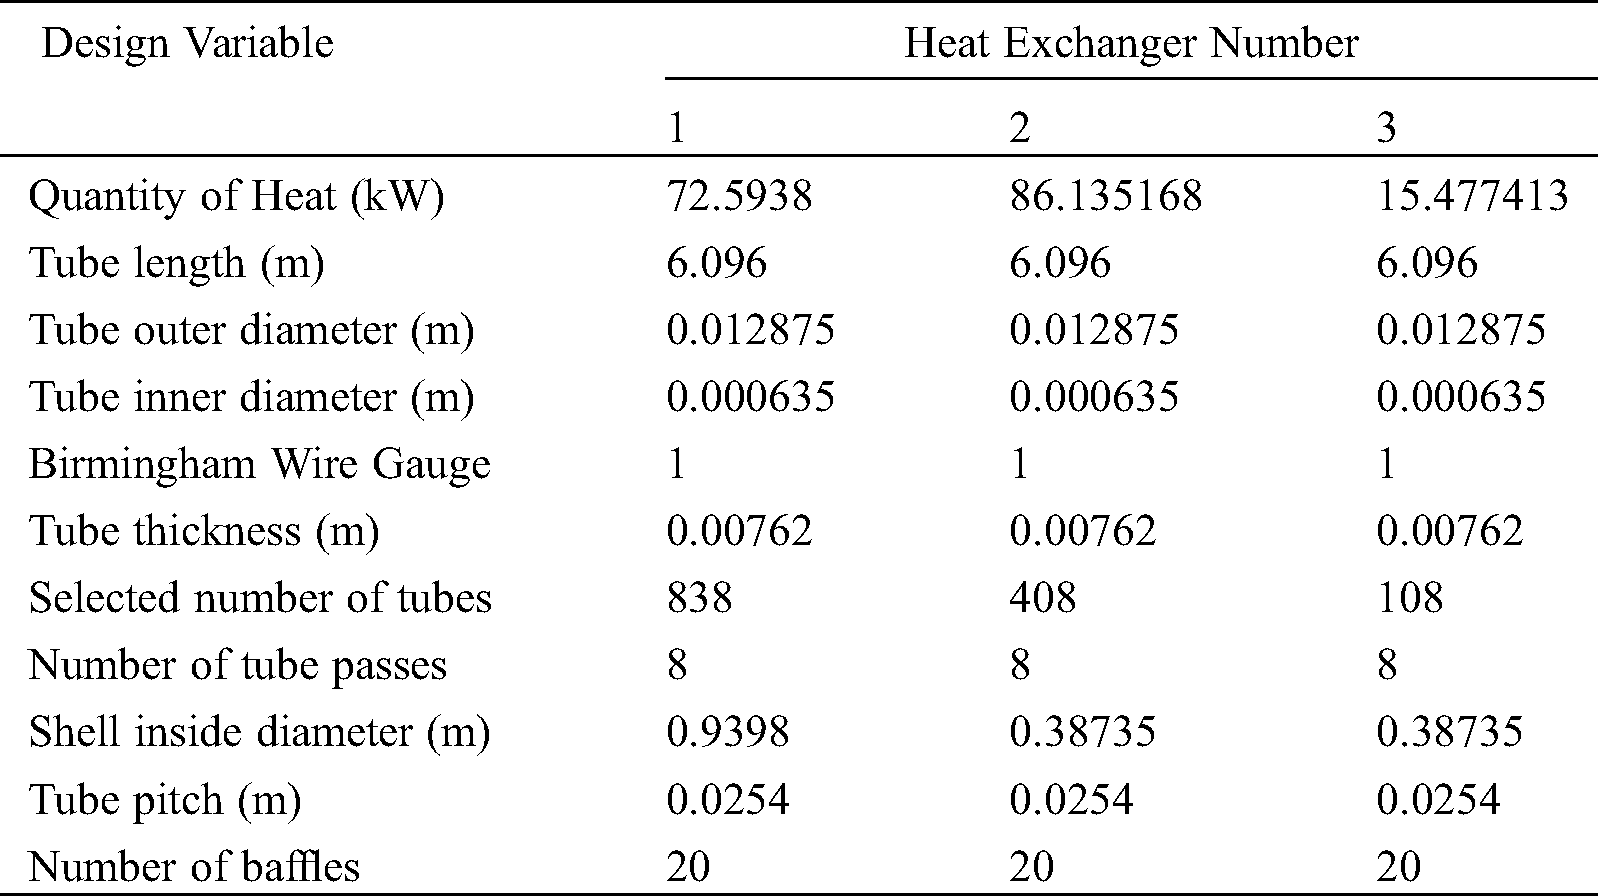
The quantity of heat specified for each exchanger should be exchanged to meet the specified internal recoverable heat, in pinch analysis.
Two types of heat exchanger areas required, designed to meet the quantified heat recovery are presented in this section. One area has been designed using Uass, the assumed value of coefficient of heat transfer, while the other area has been designed using Kern Equations. The results are shown in Fig. 1.
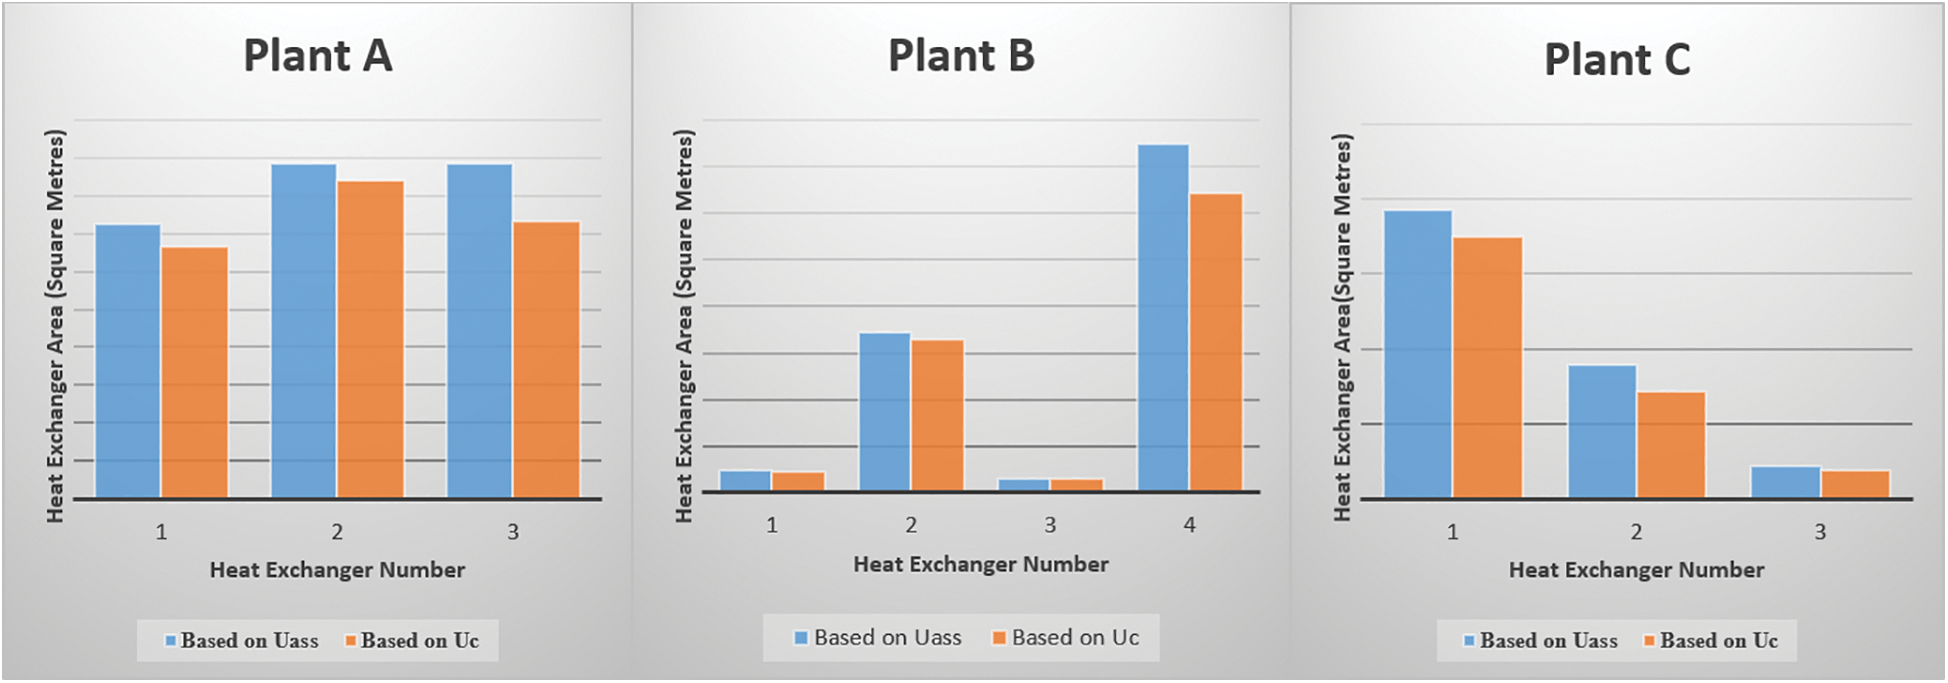
Figure 1: Comparison of heat exchanger areas
For all the plants, the areas computed by assuming the value of overall coefficient of heat transfer are more than those computed using the one calculated using Kern Equations. The average percentage difference for the plants is 10.1%, 6.9% and 14.9% for A, B and C, respectively. The design approach that uses assumed value of overall coefficient of heat transfer does not consider the fouling factor. The Uass value from the literature is assumed to cater for the fluid fouling factor. However, this assumption leads to overstating the required heat transfer area, thus overstating the cost of heat recovery, by these computed percentages. This confirms findings of a simulation study by [25], which revealed that the design method that obviates the use of fouling factors during design of fin and plate heat exchangers increased the costs by a variation of 0.34% to 21.65%.
3.2 Effects of Fouling Growth on Thermal Performance of Heat Exchangers
The percentage heat transfer loss due to growth in fouling resistance for the 5 selected heat exchangers is presented in Fig. 2. The simulation assumed that at the optimal design fouling factor, for example, for Exchanger 1, Plant A, at 0.003 m2.K/W, the heat exchanger will meet the targeted quantity of heat transfer. As fouling increases beyond the designed value, heat transfer reduces.
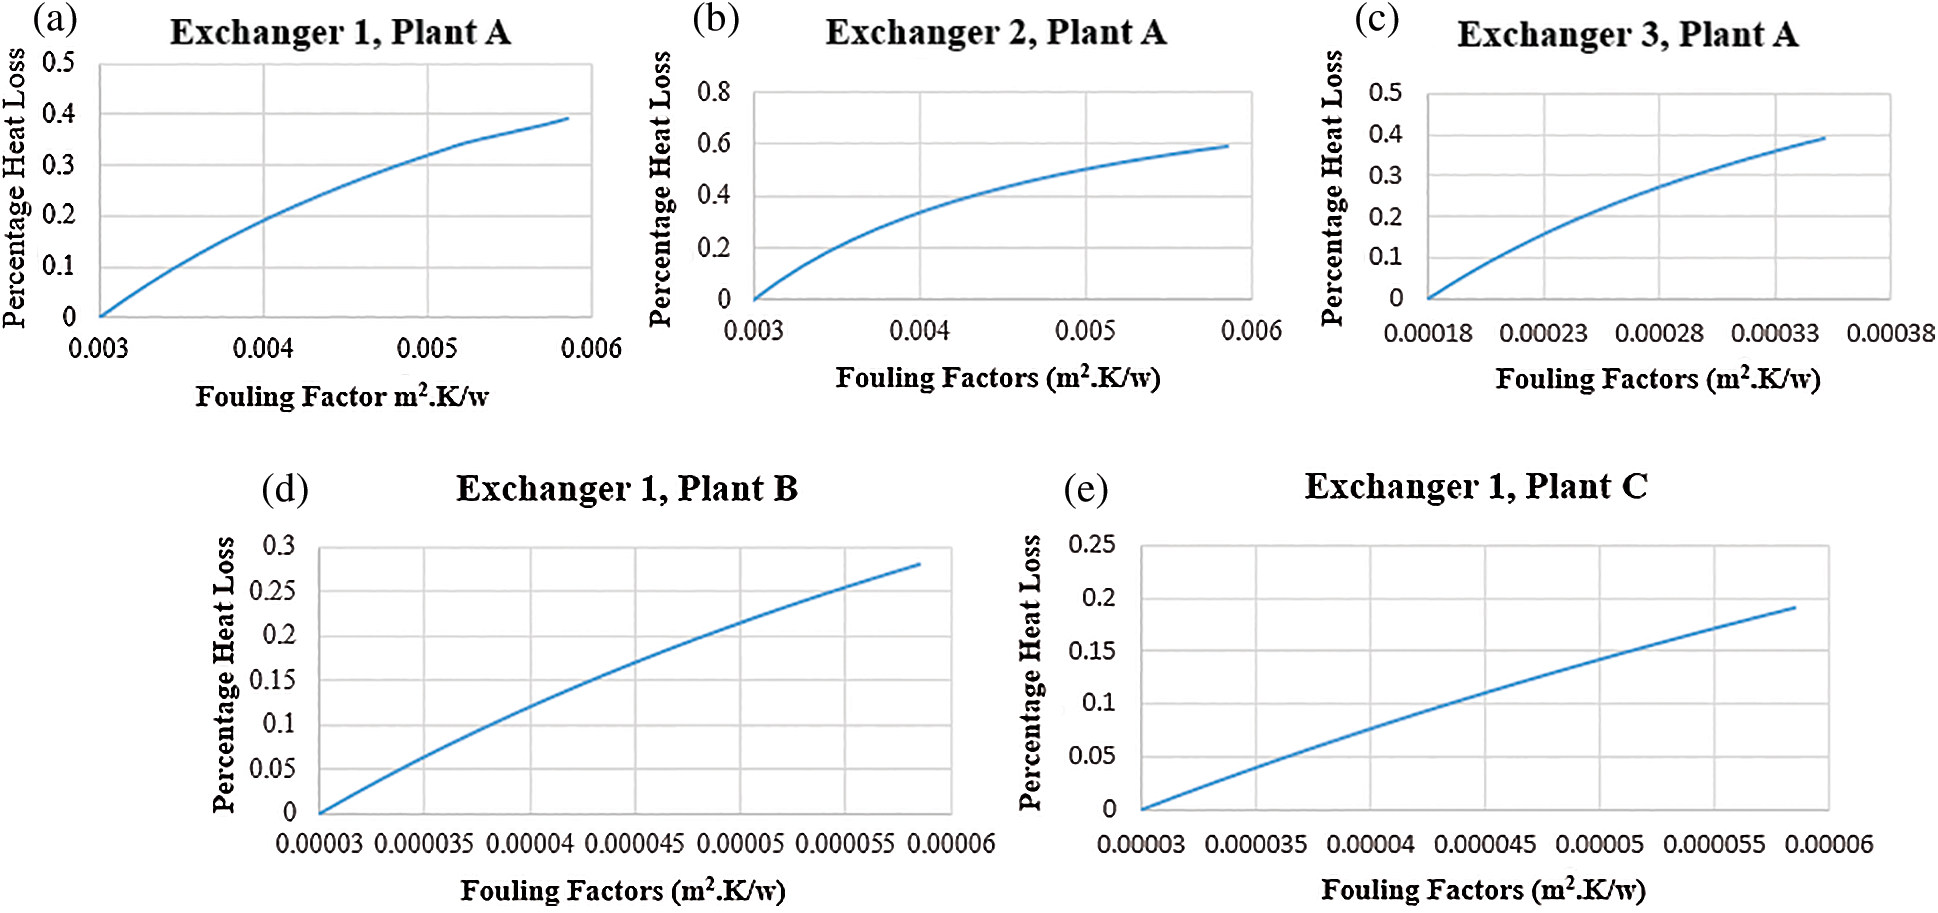
Figure 2: Effect of fouling growth on heat loss
The heat loss has an exponential relationship with growth of fouling, for the five exchangers. The modelled average losses, for the 100% increase in fouling factors, was 0.37%. The findings of this study fortify the findings of the work by [14], which revealed that growth in fouling factors affected thermal efficiency of a power plant by 0.45%. Exchanger 1 and 2 for Plant A have similar increase in the fouling factors, but their heat transfer losses are different, at 0.39% and 0.59%. The LMTD for the former is 28.51°C while the latter is 55.97°C. This implies that heat exchange processes with a higher LMTD are bound to be affected more in thermal performance deterioration due to growth in fouling.
The modelled maximum fouling growth for Exchanger 3 for Plant A is almost half that of Exchangers 1 and 2 for Plant A, at 0.000351 m2.K/W, compared to 0.00585 m2.K/W. However, the percentage heat loss is 0.39%. Its LMTD is higher, at 52.8°C, compared to Exchanger 1, at, 28.51°C. Similarly, the ratio of the external to internal diameter of the tube for Exchanger 3 is higher compared to Exchanger 1, at 11.11 (Birmingham Wire Gage of 7.62 mm), compared to 3.03 (Birmingham Wire Gage of 4.572 mm). This is illustrated in the design data in the appendices. Fouling growth thus has a higher effect on exchangers with tubes that have more thickness than those that have lower thickness.
The modelled heat transfer losses for Exchanger 1 Plant B and Exchanger 1 Plant C are 0.28% and 0.19%, respectively. The same fouling growth notwithstanding, the two have different percentage losses. The LMTD for Exchanger 1, Plant B is 31.8°C while that of Exchanger 1 Plant C is 25.4°C. The tube thickness of the two is the same, with Birmingham Wire Gage of 7.62 mm. The effect of fouling growth on the heat loss in the heat exchangers was thus moderated by the LMTD of the two exchangers.
This paper has analyzed the effects of growth of fouling in shell and tube heat exchangers, by use of thermodynamic analysis, heat balance and Kern Design equations. This study has revealed that estimation of overall heat transfer coefficient, which uses an estimated fouling factor for design of heat exchangers, leads to an overestimate of the required shell and tube exchanger area. The overestimation was by an average of 10.1%, 6.9% and 14.9% for plants A, B and C, respectively, compared to computation of the same using Kern Design Equations. Increase in the design fouling factor by 100% leads to increase in heat losses by an average of 0.37%, for the three plants.
This work has led to four conclusions concerning heat exchanger design, fouling resistance and thermal performance of shell and tube heat exchanger. The relationship between increase in fouling resistance and heat transfer losses in shell and tube heat exchangers is exponential. In design problems that estimate the overall heat transfer coefficient, thus not factoring in the fouling factors unique to the heat transport fluid, the exchange areas are overestimated, thus overestimating the costs of heat recovery. The LMTD determines the severity of fouling resistance in shell and tube heat exchangers. Higher values of LMTD exacerbate the heat losses, compared to lower values, because of the exponential relationship between exchanger heat loss and fouling growth. Similarly, the ratio of external diameter to internal diameter of the exchanger tubes amplifies the effect of fouling growth on thermal performance of the exchangers. The higher the ratio, the higher the heat loss due to growth in fouling. There is need for more work to be carried out on the effect of fouling growth in shell and tube heat exchangers conveying different fluids, especially in prediction of fouling growth using computation fluid dynamics and linking the predicted growth to thermal performance.
Acknowledgement: I appreciate the efforts of Prof. Kinyua and Dr. Eng Ndiritu for helping me shape this work, which is a continuation of pinch analysis work I carried out on three process plants.
Funding Statement: The authors received no specific funding for this work.
Conflicts of Interest: The authors declare that they have no conflicts of interest to report regarding the present study.
1. Ramos, J., Aires, L. (2020). The effect of a naturally ventilated roof on the thermal behaviour of a building under mediterranean summer conditions. Journal of Sustainable Development of Energy, Water and Environment Systems, 8(3), 508–519. DOI 10.13044/j.sdewes.d7.0297. [Google Scholar] [CrossRef]
2. Aspelund, A., Berstad, D. O., Gundersen, T. (2007). An extended pinch analysis and design procedure utilizing pressure based exergy for subambient cooling. Applied Thermal Engineering, 27(16), 2633–2649. DOI 10.1016/j.applthermaleng.2007.04.017. [Google Scholar] [CrossRef]
3. Kemp, I. C. (2011). Pinch Analysis and Process Integration: A user guide on process integration for the efficient use of energy. Butterworth-Heinemann, Oxford. [Google Scholar]
4. Linnhoff, B., Kemp, I. C. (2007). Pinch analysis and process integration, a user guide on process integration for the efficient use of energy. Butterworth-Heinemann, Oxford. [Google Scholar]
5. Klemeš, J. J., Kravanja, Z. (2013). Forty years of heat integration: Pinch analysis (PA) and mathematical programming (MP). Current Opinion in Chemical Engineering, 2(4), 461–474. DOI 10.1016/j.coche.2013.10.003. [Google Scholar] [CrossRef]
6. Aljundi, I. H. (2009). Energy and exergy analysis of a steam power plant in Jordan. Applied Thermal Engineering, 29(2), 324–328. DOI 10.1016/j.applthermaleng.2008.02.029. [Google Scholar] [CrossRef]
7. Cihan, A., Hacıhafızoglu, O., Kahveci, K. (2006). Energy-exergy analysis and modernization suggestions for a combined-cycle power plant. International Journal of Energy Research, 30(2), 115–126. DOI 10.1002/er.1133. [Google Scholar] [CrossRef]
8. Fodor, Z., Klemeš, J. J., Varbanov, P., Walmsley, M. R., Atkins, M. J. et al. (2012). Total site targeting with stream specific minimum temperature difference. Chemical Engineering Transactions, 29, 409–414. [Google Scholar]
9. Becker, H. C. (2012). Methodology and thermo-economic optimization for integration of industrial heat pumps (Ph.D. Thesis). Federal Polytechnic College of Lausanne, Lausanne. [Google Scholar]
10. Harkin, T., Hoadley, A., Hooper, B. (2010). Reducing the energy penalty of CO2 capture and compression using pinch analysis. Journal of Cleaner Production, 18(9), 857–866. DOI 10.1016/j.jclepro.2010.02.011. [Google Scholar] [CrossRef]
11. Gonçalves, C. D. O., Costa, A. L., Bagajewicz, M. J. (2017). Shell and tube heat exchanger design using mixed-integer linear programming. AIChE Journal, 63(6), 1907–1922. DOI 10.1002/aic.15556. [Google Scholar] [CrossRef]
12. Gonçalves, C. D. O., Costa, A. L. H., Bagajewicz, M. J. (2017). Alternative mixed-integer linear programming formulations for shell and tube heat exchanger optimal design. Industrial & Engineering Chemistry Research, 56(20), 5970–5979. DOI 10.1021/acs.iecr.6b04950. [Google Scholar] [CrossRef]
13. Antar, M. A., Zubair, S. M. (2007). The impact of fouling on performance evaluation of multi-zone feedwater heaters. Applied Thermal Engineering, 27(14–15), 2505–2513. DOI 10.1016/j.applthermaleng.2007.02.006. [Google Scholar] [CrossRef]
14. Ibrahim, S. M., Attia, S. I. (2015). The influence of condenser cooling seawater fouling on the thermal performance of a nuclear power plant. Annals of Nuclear Energy, 76, 421–430. DOI 10.1016/j.anucene.2014.10.018. [Google Scholar] [CrossRef]
15. Khan, J. U. R., Zubair, S. M. (2004). A study of fouling and its effects on the performance of counter flow wet cooling towers. Proceedings of the Institution of Mechanical Engineers, Part E: Journal of Process Mechanical Engineering, 218(1), 43–51. DOI 10.1243/095440804322860636. [Google Scholar] [CrossRef]
16. Pérez, M. G., Vakkilainen, E., Hyppänen, T. (2016). Fouling growth modeling of kraft recovery boiler fume ash deposits with dynamic meshes and a mechanistic sticking approach. Fuel, 185, 872–885. DOI 10.1016/j.fuel.2016.08.045. [Google Scholar] [CrossRef]
17. Wang, L. C., Li, S. F., Wang, L. B., Cui, K., Zhang, Q. L. et al. (2016). Relationships between the characteristics of CaCO3 fouling and the flow velocity in smooth tube. Experimental Thermal and Fluid Science, 74, 143–159. DOI 10.1016/j.expthermflusci.2015.12.001. [Google Scholar] [CrossRef]
18. Musonye, F. S., Ndiritu, H., Kinyua, R. (2020). Modeling and simulation of heat balance and internal heat recovery targets through a combination of stream specific minimum temperature difference and polynomial temperature coefficients of specific heat capacities using pinch analysis. AIMS Energy, 8(4), 652–668. DOI 10.3934/energy.2020.4.652. [Google Scholar] [CrossRef]
19. Thulukkanam, K. (2013). Heat exchanger design handbook. CRC press, London. [Google Scholar]
20. Thakore, S. B., Bhatt, B. I. (2015). Introduction to process engineering and design. McGraw-Hill Education, New Delhi. [Google Scholar]
21. Müller-Steinhagen, H. (2000). Heat exchanger fouling: mitigation and cleaning techniques. IChemE, Warwickshire. [Google Scholar]
22. Flynn, A. M., Akashige, T., Theodore, L. (2019). Kern's process heat transfer. John Wiley & Sons, New Jersey. [Google Scholar]
23. TEMA. (2007). Standards of the tubular heat exchanger manufacturers association. 9th ed. New York: Tubular Heat Exchanger Manufacturers Association. [Google Scholar]
24. Podolski, W. F., Schmalzer, D. K., Conrad, V. (2000). Perry's chemical engineers handbook. McGraw-Hill Professional Publishing, New York. [Google Scholar]
25. Rao, R. V., Patel, V. (2013). Multi-objective optimization of heat exchangers using a modified teaching-learning-based optimization algorithm. Applied Mathematical Modelling, 37(3), 1147–1162. DOI 10.1016/j.apm.2012.03.043. [Google Scholar] [CrossRef]
Appendices
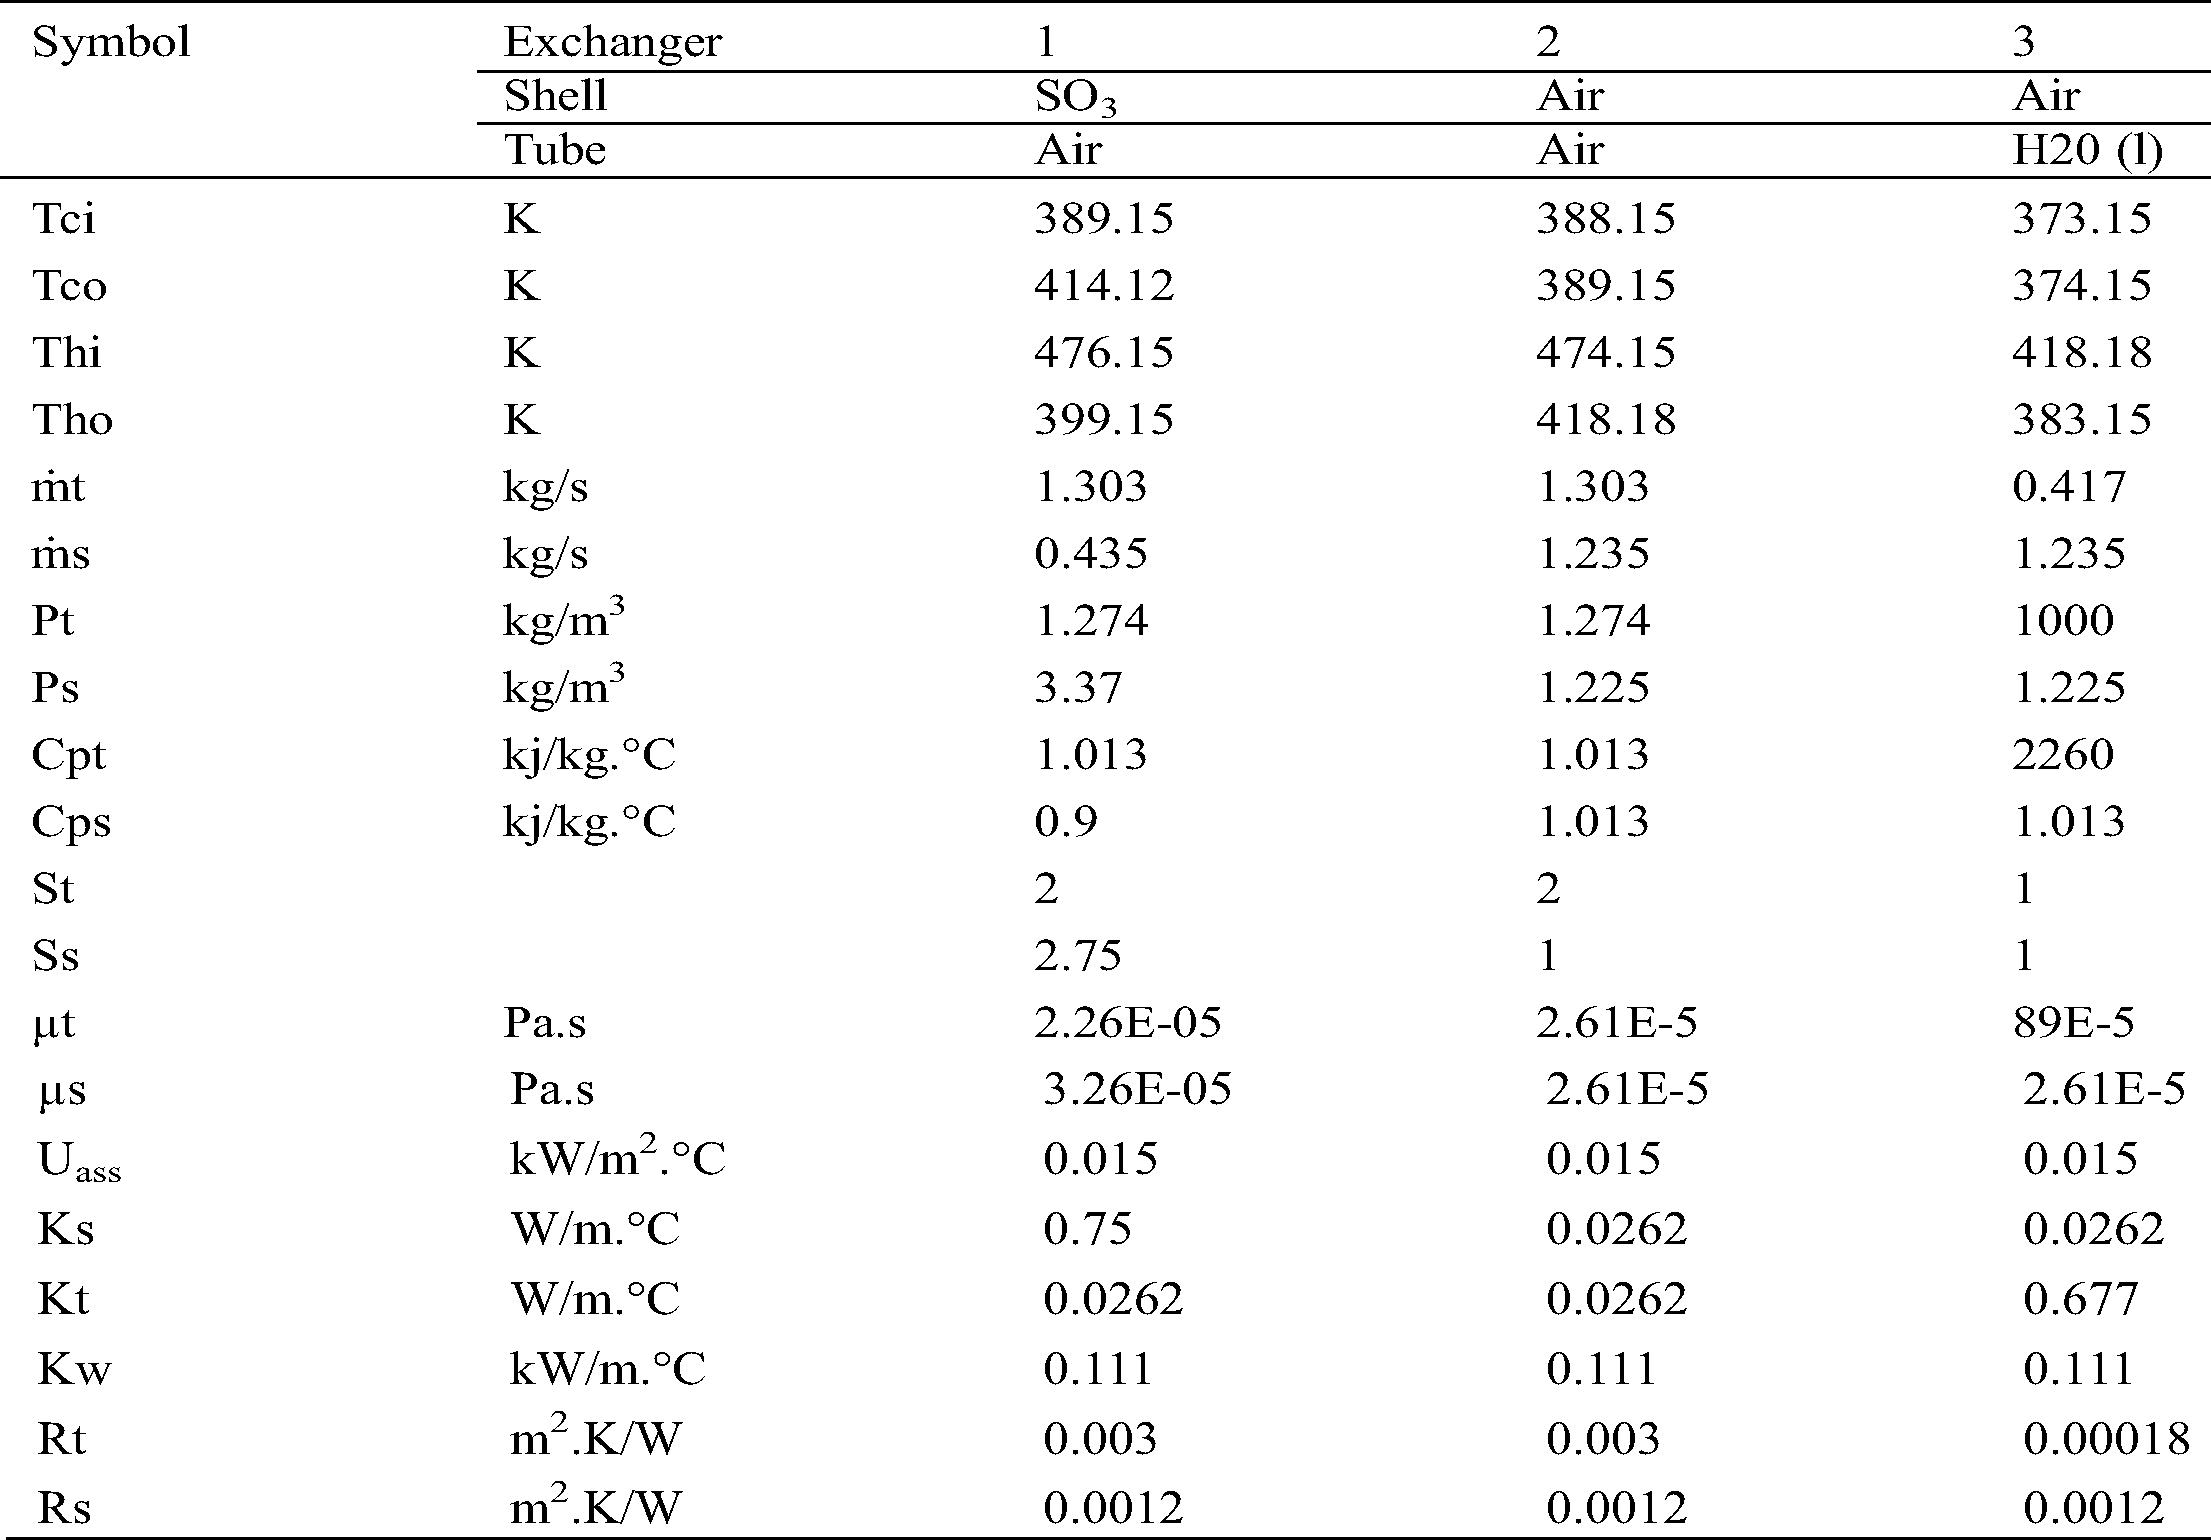
Appendix 1: Data for design of heat exchangers for Plant A
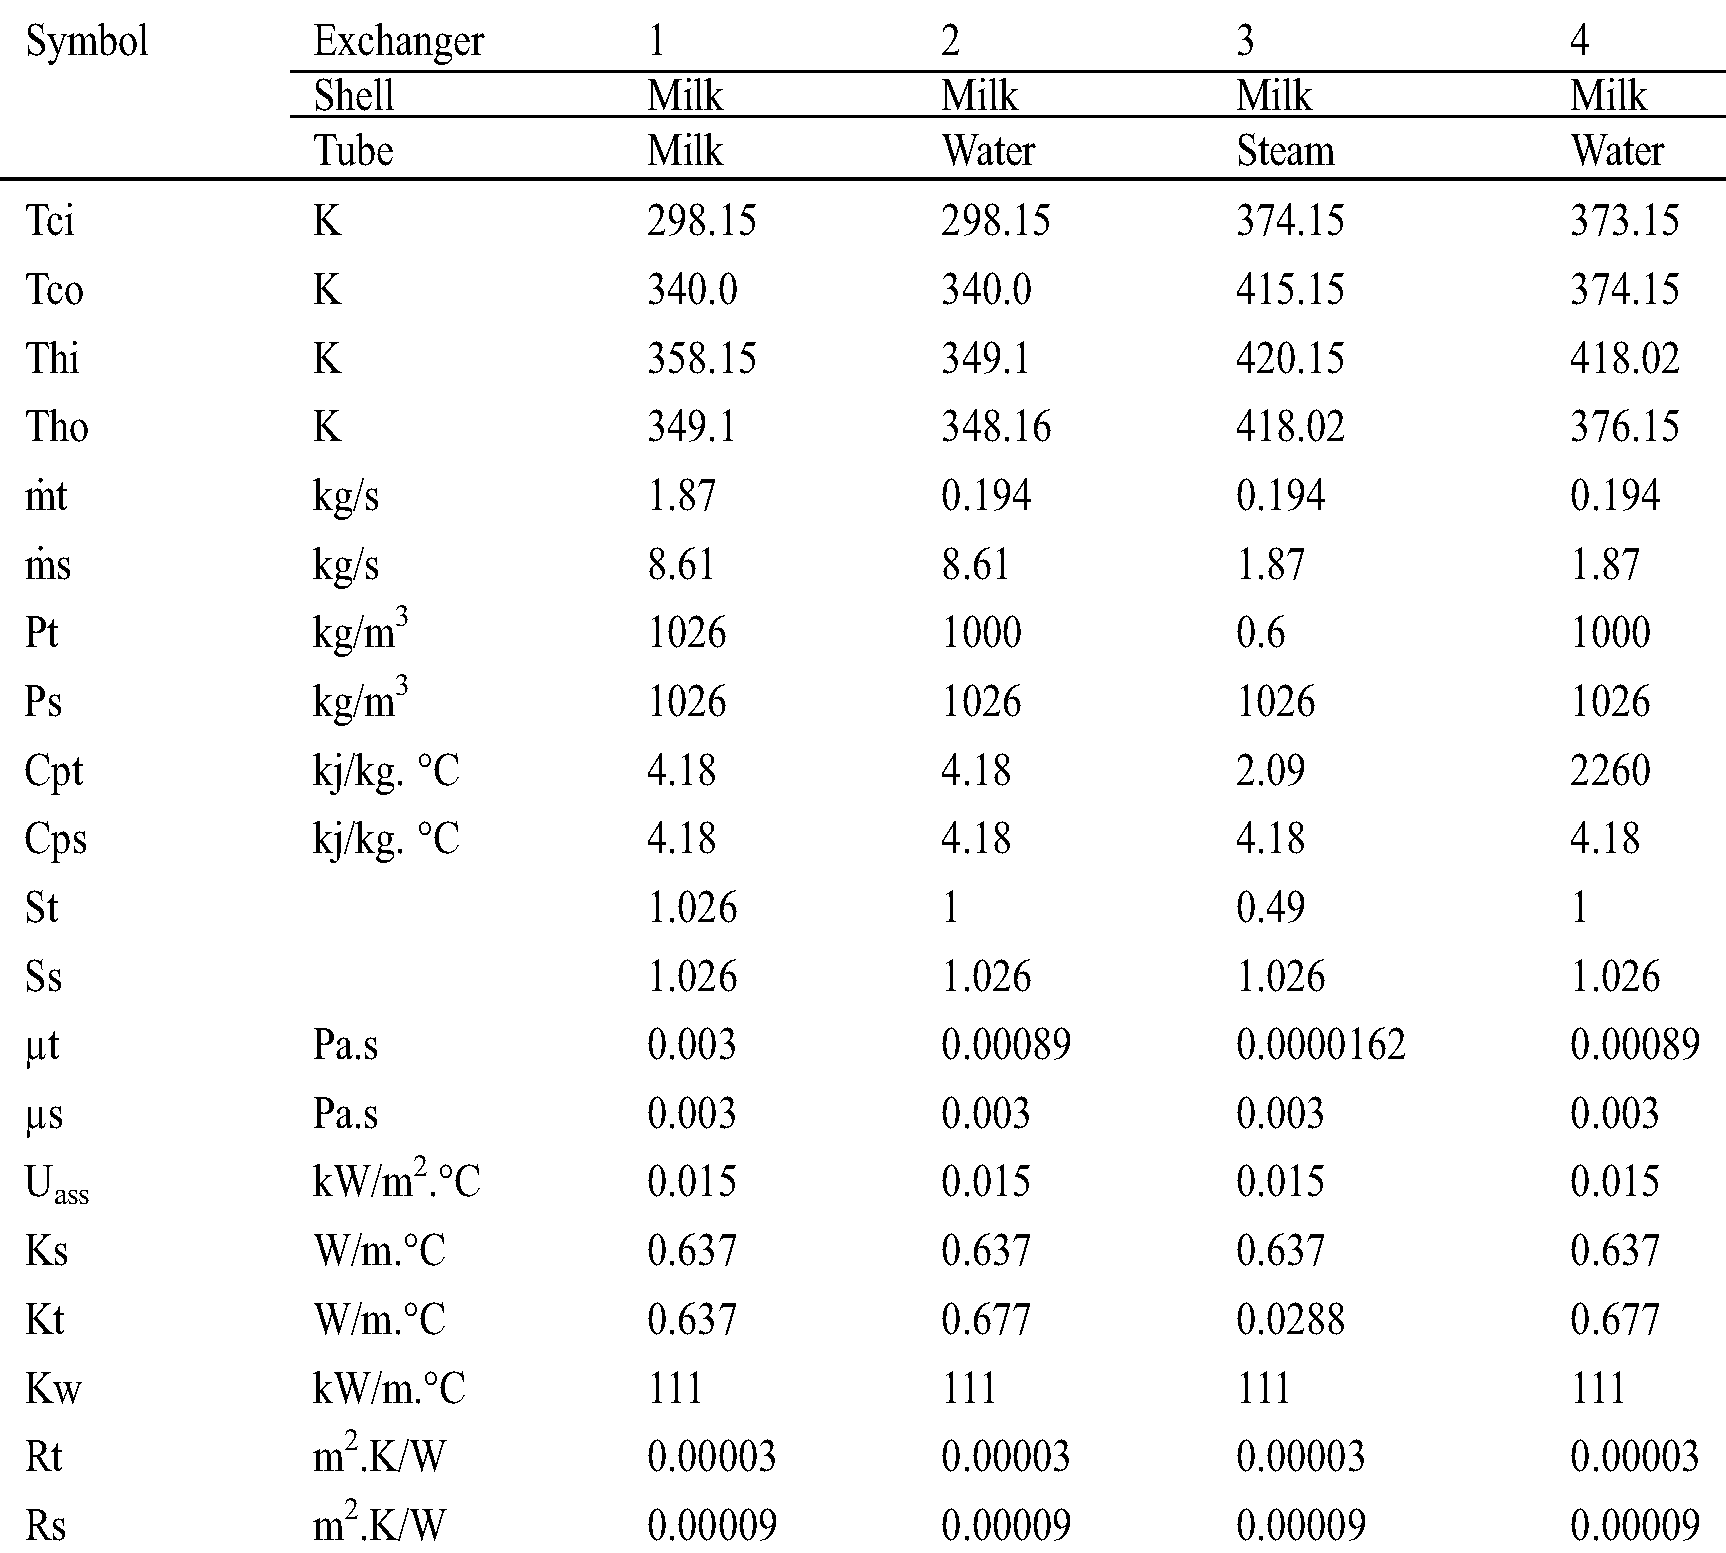
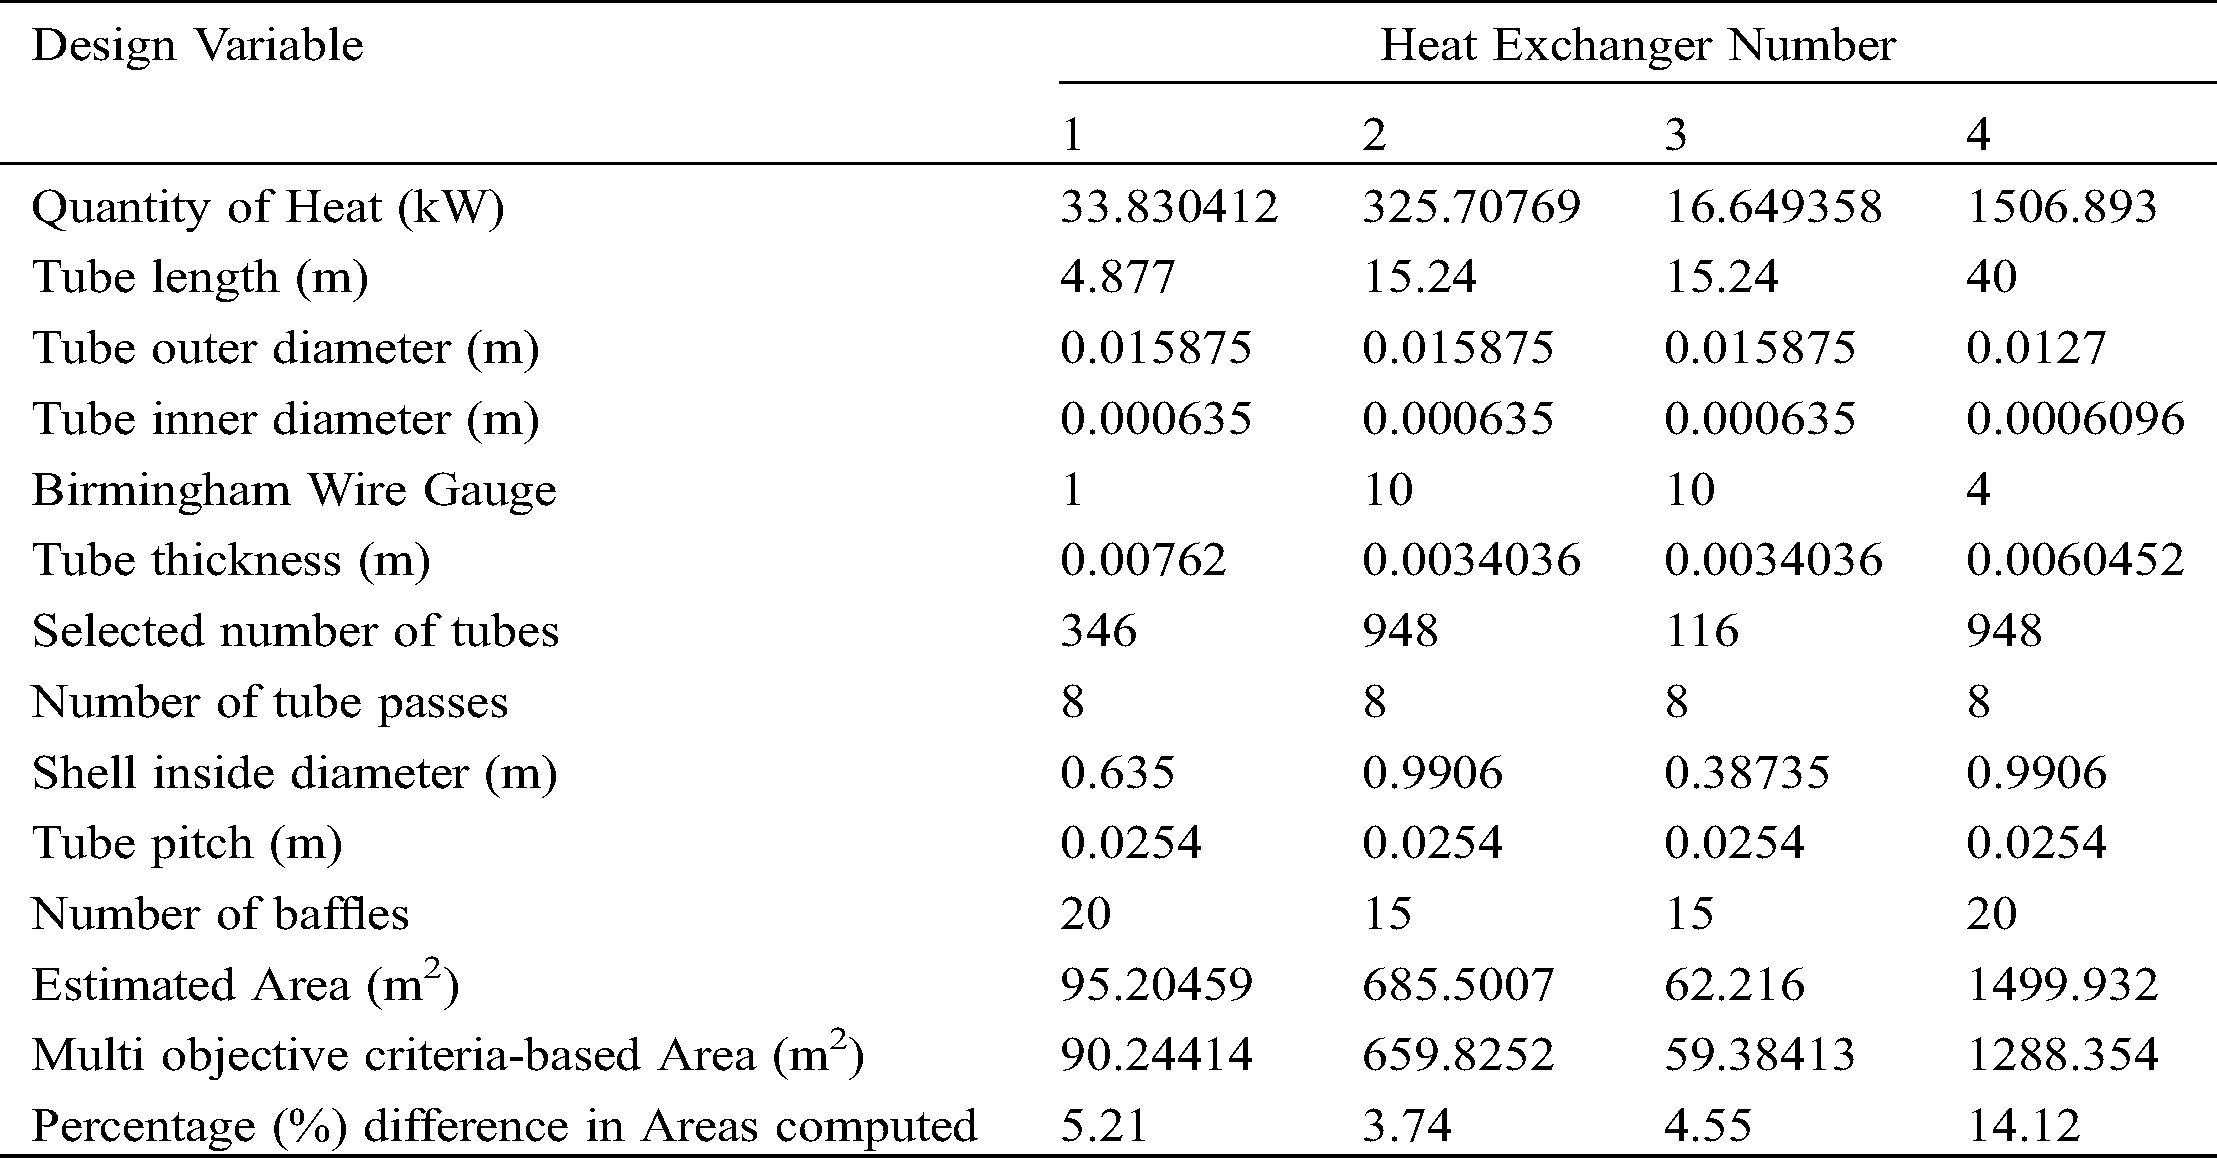
Appendix 2: Data for design of heat exchangers for Plant B
Appendix 3: Exchanger parameters for Plant A
Appendix 4: Exchanger parameters for Plant B
 | This work is licensed under a Creative Commons Attribution 4.0 International License, which permits unrestricted use, distribution, and reproduction in any medium, provided the original work is properly cited. |