| Energy Engineering |
DOI: 10.32604/EE.2021.014464
ARTICLE
Performance Characteristics of Geothermal Single Well for Building Heating
1New Energy Development Center, Shengli Petroleum Administration Bureau, Ltd., Sinopec Group, Dongying, 257000, China
2Guangzhou Institute of Energy Conversion, Chinese Academy of Sciences, Guangzhou, 510640, China
*Corresponding Author: Lingbao Wang. Email: wanglb@ms.giec.ac.cn
Received: 29 September 2020; Accepted: 28 October 2020
Abstract: The single well geothermal heating (SWGH) technology has attracted extensive attention. To enhance heat extraction from SWGH, a mathematical model describing heat transfer is set up, and the key influence factor and heat transfer enhancement method are discussed by thermal resistance analysis. The numerical results show that the thermal resistance of rock is far greater than that of well wall and fluid. So, reducing rock thermal resistance is the most effective method for enhancing the heat extraction power. For geothermal well planning to drill: rock thermal resistance can be reduced by increasing well diameter and rock thermal conductivity; the temperature difference between liquid and rock can be raised by increasing well depth. For already existing geothermal well: an insulator with thermal conductivity of 0.2 W/(mK) is sufficient to preserve fluid enthalpy; a decrease in injection water temperature causes the increase of heat extraction power from geothermal well and heat output from heat pump simultaneously; increasing injection velocity causes the increase of pump power consumption and heat extraction power from geothermal well as well as net heat output between them. The entrepreneurs may refer to the above data in actual project. Furthermore, filling composite materials with high thermal conductivity into leakage formation is proposed in order to reduce the thermal resistance of rocks.
Keywords: Geothermal heating; heat transfer enhancement; single well; experiment validation; deep borehole heat exchanger; thermal resistance
Nomenclature
| A1: | flow area of extraction channel, m2 |
| A3: | flow area of injection channel, m2 |
| C4: | specific heat of rock, J/(kg K) |
| CP: | specific heat of fluid, J/(kg K) |
| D4: | well depth, m |
| H: | well depth, m |
| Pr: | Prandtl number |
| QE: | heat extracted from geothermal well, kW |
| QT: | Output heating of heat pump, kW |
| Re: | Reynolds number |
| RH: | the convective thermal resistance for fluid in the geothermal well, mK/W |
| RR: | the conductive thermal resistance in the rock, mK/W |
| RS: | the conductive thermal resistance for well wall, mK/W |
| RT: | total thermal resistance, mK/W |
| S12: | heat exchange rate between injection and extraction channel, K/s |
| S23: | heat exchange rate between fluid and well wall, K/s |
| T0: | ground surface temperature, K |
| T1: | fluid temperature in extraction channel, K |
| T2: | fluid temperature in injection channel, K |
| T3: | well wall temperature, K |
| T4: | rock temperature, K |
| Tg: | geothermal gradient, K/km |
| Tin: | injection temperature, K |
| Tout: | extraction temperature, K |
| Vin: | injection velocity, m/s |
| V1: | flow velocity in extraction channel, m/s |
| V2: | flow velocity in injection channel, m/s |
| b1: | thickness of insulation material, m |
| b4: | thickness of well wall, m |
| de: | hydraulic diameter, m |
| h1: | convective heat transfer coefficient for inner wall of insulation tube, W/(m2 K) |
| h2: | convective heat transfer coefficient for outer wall of insulation tube, W/(m2 K) |
| h3: | convective heat transfer coefficient for well wall, W/(m2 K) |
| kL: | heat conductivity coefficient for unit length, W/(m K) |
| m: | mass flow rate, t/h |
| qL: | Heat transfer power per unit well depth, W/m |
| r: | distance from well wall, m |
| r1: | inner radius of insulation tube, m |
| r2: | outer radius of insulation tube, m |
| r3: | inner radius of well wall, m |
| r4: | outer radius of well wall, m |
| r∞: | the influence radius of rock, m |
| λ1: | thermal conductivity of insulation material, W/(m K) |
| λ3: | thermal conductivity for well wall, W/(m K) |
| λ4: | thermal conductivity of rock, W/(m K) |
| ρ: | water density, kg/m3 |
| ρ4: | density of rock, kg/m3 |
| α4: | rock thermal diffusivity, m2/s |
| τ: | simulation time, s |
| ΔT: | temperature difference, K |
| Acronyms | |
| COP: | coefficient of performance |
| DBHE: | deep borehole heat exchanger |
| EGS: | enhanced geothermal system |
| SWGH: | single well geothermal heating |
In northern China, coal accounts for 92% energy use for building heating systems, which contributes significantly to winter smog air pollution. As a consequence, there is a more pressing need to utilize renewable energy for building heating in order to reduce coal consumption and air pollution. Geothermal energy has shown significant potential because of its low environmental impact, low greenhouse gas emissions and technology feasible [1,2]. Geothermal energy has provided heat for 650 million m2 buildings by the end of 2017 in China [3].
Recently, without hydrothermal geothermal resource constrains, geothermal water reinjection, and corrosion and scaling, the single well geothermal heating (SWGH) is widely accepted. The most crucial part in SWGH is deep borehole heat exchanger (DBHE), which is also named coaxial borehole heat exchanger or wellbore heat exchanger, as shown in Fig. 1.
Some researchers studied the utilizations of geothermal energy from abandoned oil and gas wells owing to low drilling cost by retrofitting them into DBHE [4–13], and proposed mathematical models to analyze the influence factor on heat output [14–18]. In addition, some researchers conducted simulation studies on the shallow buried tube exchangers for building heating [19–24]. Morita et al. [25,26] firstly reported the DBHE experiment at the HGP-A well on the island of Hawaii. The performance of DBHE at Weissbad and Weggis in Switzerland was then reported by Kohl et al. [27,28]. A test measurement of DBHE with a relatively constant heat flow rate of 100 kW was reported in 2011 at Aachen University, Germany [29]. However, the geothermal well in references [25,28] is not drilled specially for installing DBHE and thus its structure is complicated, resulting in an increase in the thermal contact resistance between rock, cement and casing.
Some researchers have carried out experimental and numerical simulation researches on DBHE. However, there is very few studies reported on the heat transfer enhancement of DBHE for building heating through thermal resistance analysis. The main purpose of the current study is to propose some effective ways to enhance the heat transfer of DBHE using thermal resistance analysis method. First, a mathematical model describing the heat transfer between surrounding rocks, well tube and insulation tube as well as the circulating fluid is developed. And then the performance of DBHE and the key influence factors on heat extraction are discussed by thermal resistance analysis. The novelty of this research is as follows: enhancing heat transfer by analyzing and reducing thermal resistance; indicating that poor thermal conductivity of rocks is a major obstacle to the performance improvement of DBHE, and thus reducing rock thermal resistance is the most effective method for enhancing the heat extraction power; studying the effect of injection water temperature on heat extraction from DBHE and heat pump performance simultaneously; analyzing the relationship between heat extraction, injection mass flow rate and power consumption of circulating pump; and proposing some effective methods for the enhancement of heat transfer of the existing DBHE and the new geothermal well planning to drill to install DBHE respectively. Furthermore, two schemes are suggested in order to reduce the thermal resistance of rocks. One is the technology of enhanced geothermal system (EGS), which creates artificial fractures in the rocks by hydraulic fracturing technology and injecting fluid into them; the other is the technology of filling composite materials with high thermal conductivity into leakage formation, which is a common technology in oil and gas industry.
SWGH mainly consists of DBHE, circulating pump and heat pump system. The structure diagram of DBHE is shown in Fig. 1. The circulating water is injected into DBHE through the ring-shaped channel between well tube and insulation tube and extracted through the insulation tube. The circulating fluid is gradually heated by surrounding rocks when it flows into the injection channel.
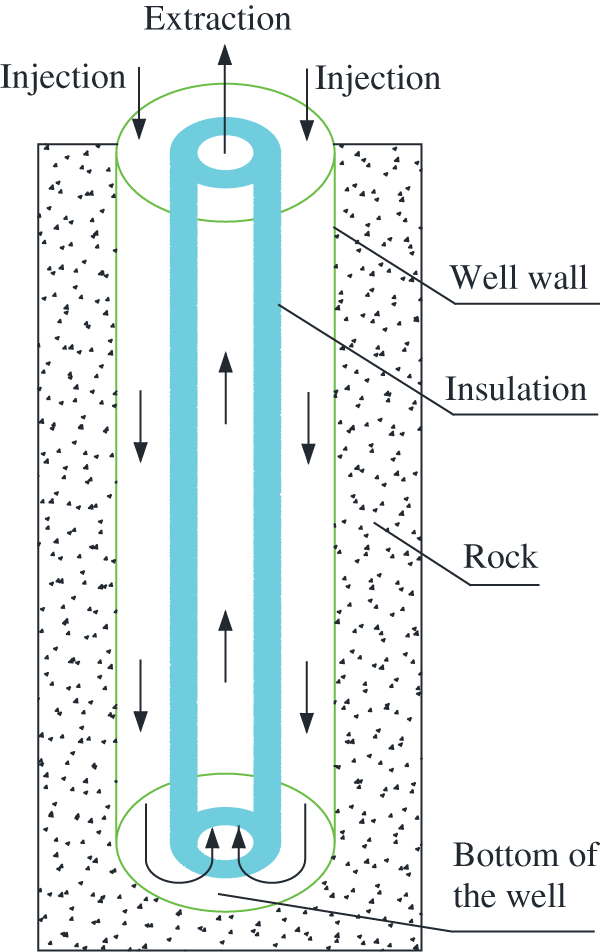
Figure 1: Structure diagram of DBHE
To simplify the mathematical model, some assumptions have been made as follows: The mathematical model of DBHE mainly includes heat conduction in rocks and heat convection in circulating fluid inside well tube and insulation tube [30–33].
Equations for extraction channel:
Equations for injection channel:
Energy equation for rocks:
The heat transfer in rocks is controlled by conduction, and the energy equation for rocks is given [4,5]:
Dittus-Boelter formula is used to calculate the convective heat transfer coefficient.
For injection channel:
For extraction channel:
Boundary conditions:
The heat transfer from well wall to injection fluid is expressed as:
The heat exchange between well wall and rock is determined by:
In Eq. (10), λ3 = 50 W/(mK).
Assuming that rock temperature keeps unchanged when r > 200 m.
Performance of heat pump unit:
Because the fluid does not touch with rocks, the extracted fluid flows directly into the evaporator of heat pump. With supply and return water temperature of 45/40°C in the user side, the relationship of coefficient of performance (COP) and Tout is given as follows by Liu et al. [34] which is fitted from the experimental results:
The output heating of the heat pump can be determined according to the following equation:
The heat extracted from the geothermal well is estimated as follows:
Finite volume method with the implicit scheme is used to discretize Eqs. (1), (4) and (6), and the algorithm of TDMA (Tri-diagonal matrix algorithm) is adopted to solve these equations.
2.3 Thermal Resistances Analysis
The process of heat transfer from rocks to fluid includes three thermal resistances as shown below [4]:
Heat transfer power per unit well depth is calculated as follows:
Thus, the heat extracted from the geothermal well can also be expressed by
2.4 Thermal Resistances Analysis
The geothermal well was drilled specially for installing DBHE in 2016 at Qingdao, China. At the first spudding section, the casing with size of Φ244.5 × 8.94 mm is installed from the ground down to 100 m, and the well tube with size of Φ177.8 × 6.91 mm is inserted to a depth of 2605 m. Insulation tube with size of Φ110 × 10 mm and length of 2600 m is installed in this well. The casing profile is shown in Fig. 2. Tab. 1 shows more detailed parameters for DBHE. The heat extracted from DBHE is used for building heating in the 2017/2018 heating season. The experimental test for DBHE began from November 19, 2017 to April 6, 2018. The experimental data can refer to [31,32]. As can be seen, the mathematical model is reliable and can be used to simulate and evaluate the performance of DBHE.
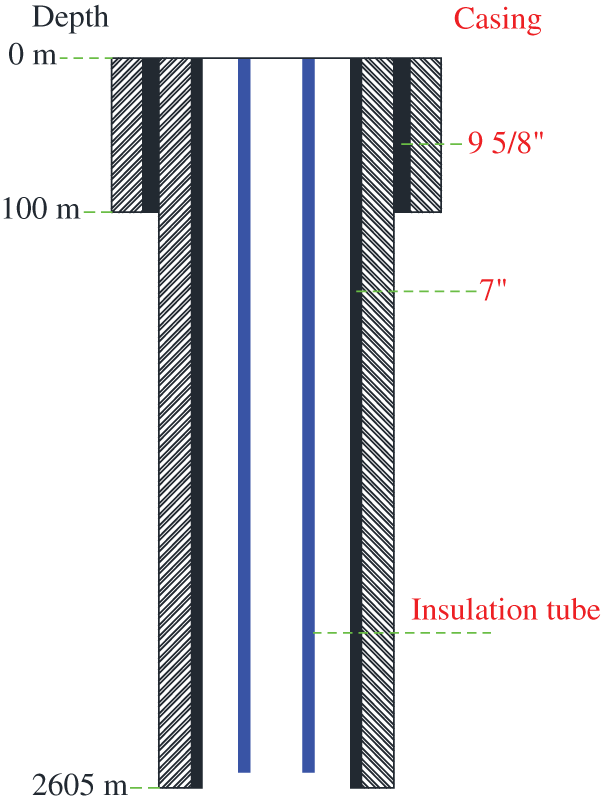
Figure 2: Casing profile of geothermal well in Qingdao, China
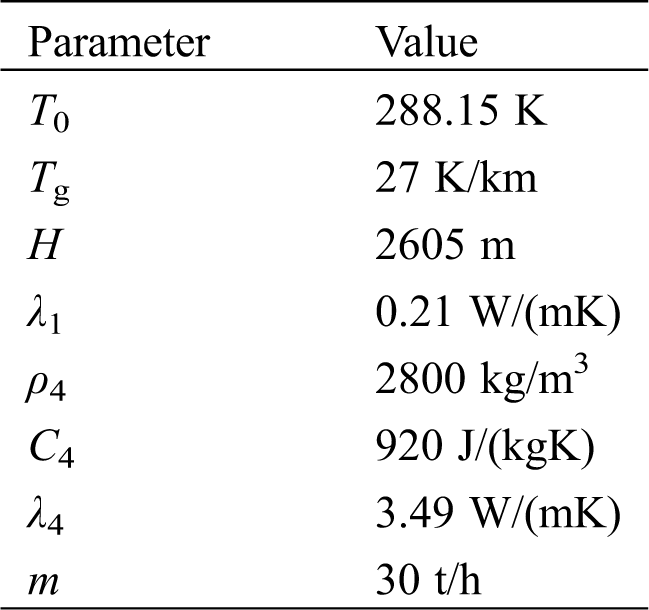
Table 1: Parameters of the geothermal well in Qingdao, China
The key performance indicators for geothermal single well include extraction temperature Tout, extraction power QE and performance attenuation. The main factors that affect the three key indicators include well depth H, well diameter D4, rock thermal conductivity λ4, geothermal gradient Tg, insulation material thermal conductivity λ1, injection temperature Tin and injection mass flow rate m. From view point of heat transfer principle, three main methods can be used to enhance heat transfer between rock and fluid. The first method is to reduce heat transfer resistance RT concerned with D4, λ4 and Vin. The second method is to increase the heat transfer temperature difference ΔT determined by H, Tg and Tin. The third method is to reduce heat loss decided by thermal conductivity of insulation material λ1. For a new geothermal well planning to drill, D4, λ4, H and Tg can be selected. While for an existing geothermal well, Vin, Tin and λ1 can be optimized to enhance heat transfer.
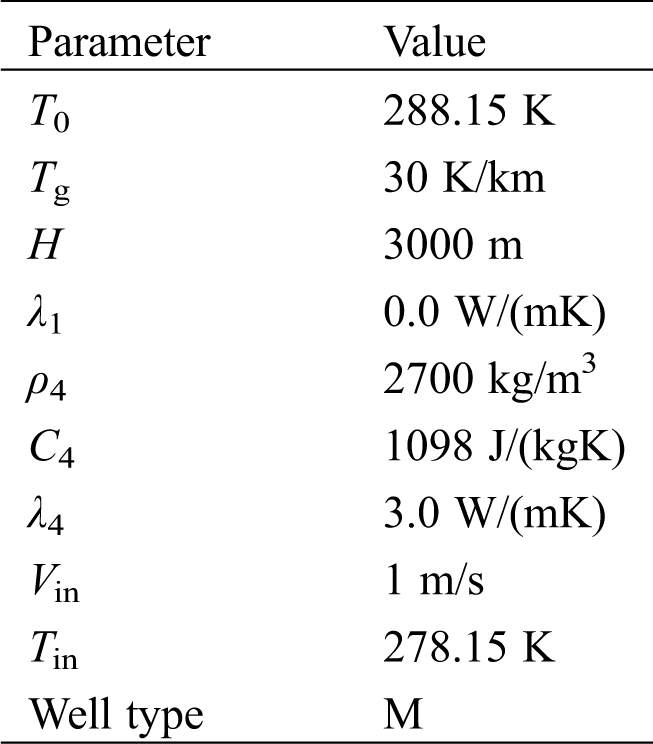
The T0, ρ4 and C4 are kept constant in the present simulations. The well type listed in Tab. 2, Tg, H, λ1, λ4, Vin and Tin are variables, and their effects on extraction temperature Tout and extraction power QE are evaluated. The basic parameters used in calculation are presented in Tab. 3. In Tab. 3, the parameter discussed is variable, and the others remain unchanged. Supposing that a typical heating season is five months in duration, and the rest of time (non-heating season) are used for thermal recovery of rock. The initial temperature of rocks is calculated using T0, Tg and H. The rock temperature keeps unchanged when r is larger than 200 m.
Table 2: Geothermal well structural and dimension parameter
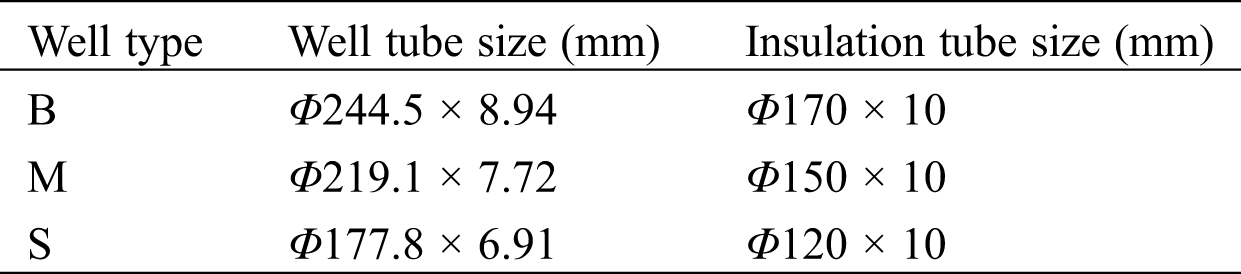
Table 3: Basic parameters used in calculation
3.1 Single Well Performance and Performance Attenuation
Fig. 3 describes the variations of the extracted water temperature Tout and the extracted heat power QE with time at the first heating season. As demonstrated in Fig. 3, Tout and QE firstly decrease sharply, and then drops slowly. The temperature of the rock is relatively high at the beginning, and the temperature difference between rock and fluid is large, thus resulting in a higher Tout and QE. Nevertheless, T4 drops as the heat extraction process proceeds, and the temperature difference between rock and fluid gradually becomes smaller, leading to a gradually decrease in Tout and QE. Tout is respectively 291.24, 290.2 and 289.23 K at the 5th, 10th and 21st weeks.
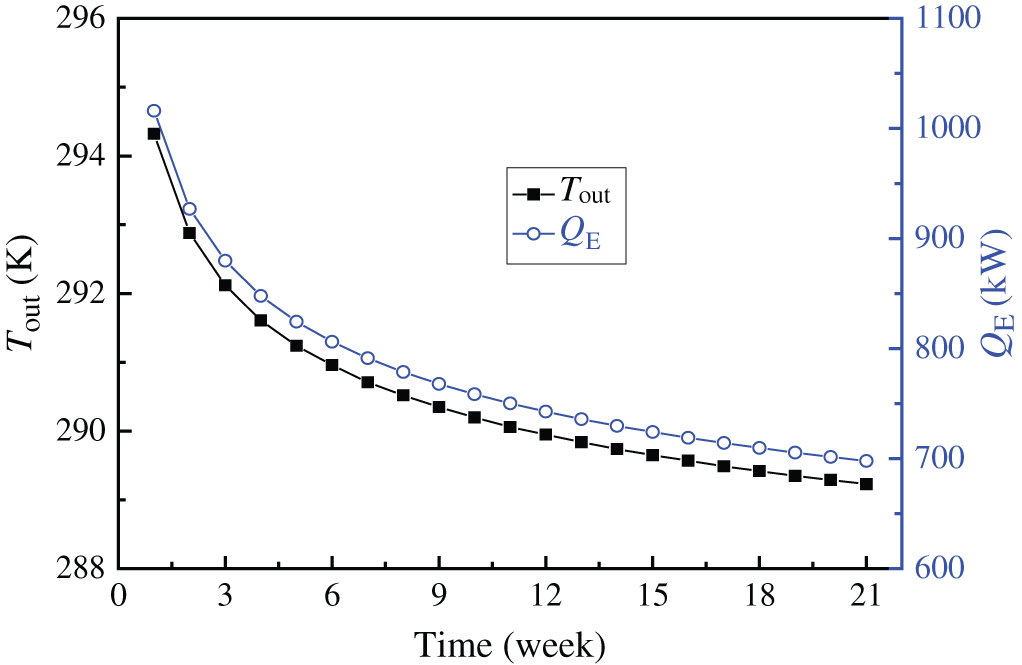
Figure 3: Variation of Tout and QE with time at the first heating season
Fig. 4 shows the variations of Tout and QE with the heating year. Tout and QE are the average value at each heating season. It is obvious that Tout and QE drop apparently with time, but the reduction rate becomes small gradually. Tout and QE are respectively 290.15, 288.61, 288.28 K and 755.01, 660.02, 639.42 kW at 1st, 10th and 20th heating season which will be helpful for the selection of heat pump.
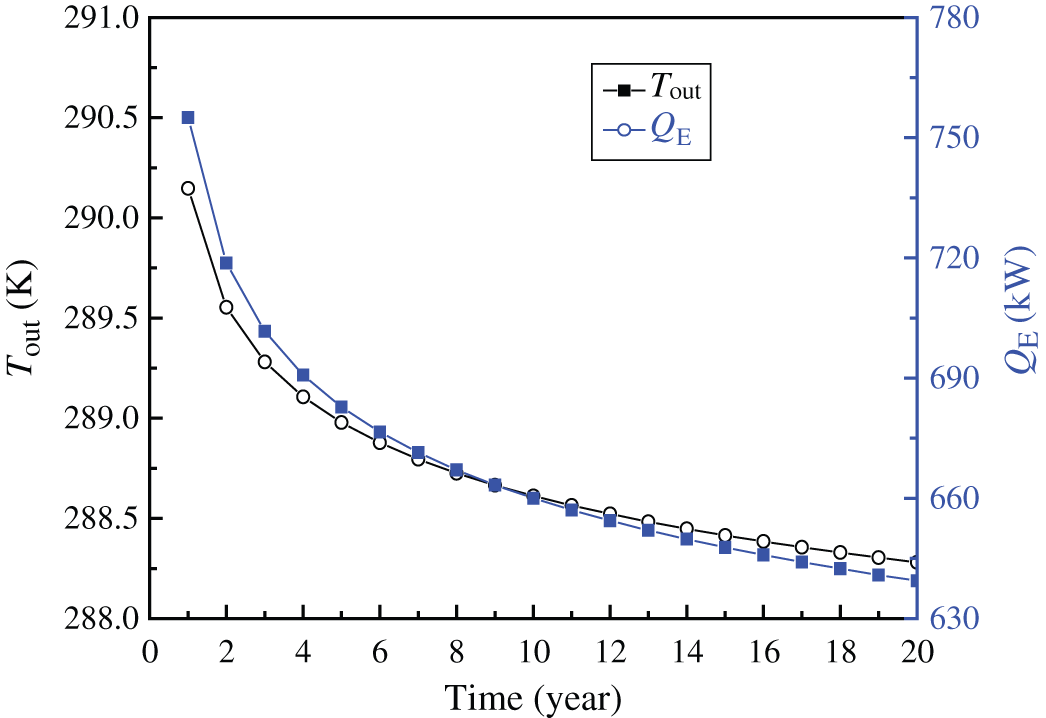
Figure 4: Variations of average Tout and QE with time for 20 heating seasons
3.2 Rock Temperature Variation
Fig. 5 shows the temperature distribution in rock with different distance from wellbore and different well depth at the end of the first heating season. As can be seen the rock temperature decreases as the heat is transferred to the injection water. Two conclusions can be drawn. One is that the temperature drops of rocks close to the well wall increase with well depth. The other is that temperature drop of rocks close to well wall is larger than that of rocks far away from well wall. That is to say the temperature gradient of rock near wellbore zone is larger than that of other zone. The reason is due to the fact that the temperature of the rock cannot rapidly be compensated by heat conduction owing to its poor thermal conductivity, resulting in a lower heat extraction from DBHE. As a consequence it can be concluded that reducing thermal resistance and improving heat transfer performance of the rocks, especially in near wellbore zone, are effective ways to enhance the heat transfer performance of DBHE.
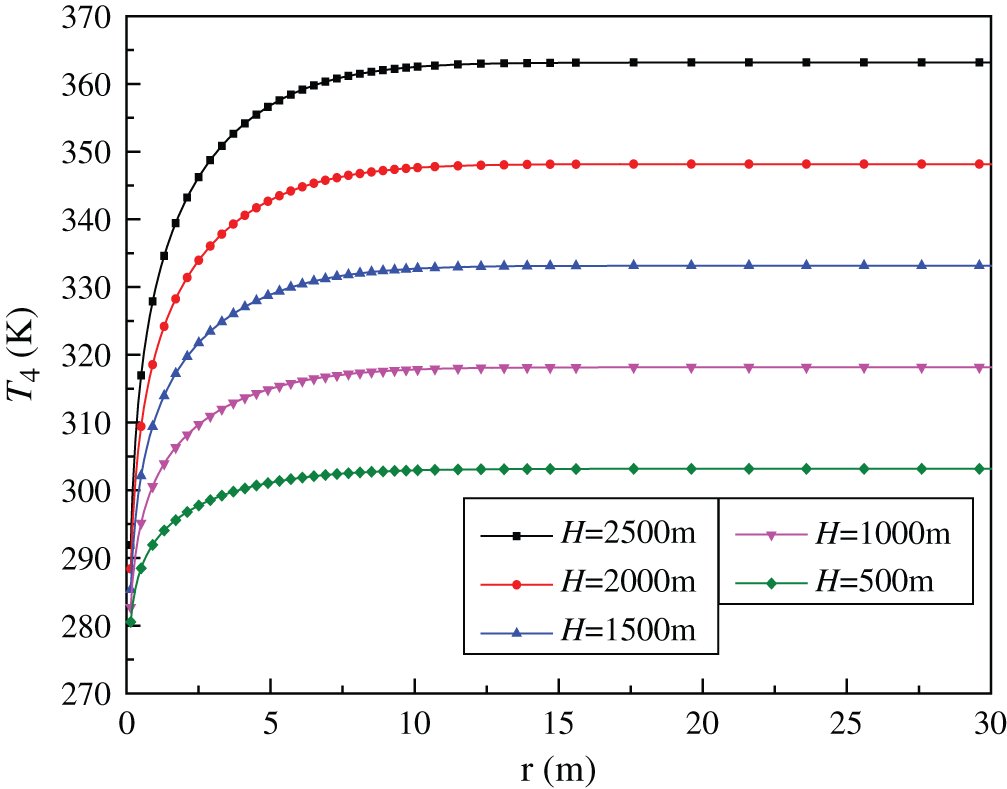
Figure 5: Temperature distribution in rock with different distance from wellbore at the end of the first heating season
The influence radius of rock is 7.24 m at the first heating season. According to Eqs. (14) and (17), RH, RS, RR, and RT is respectively 6.86 × 10⁻⁴, 7.14 × 10⁻⁴, 2.22 × 10⁻¹ and 22.34 × 10⁻² mK/W for M type geothermal well. It is clear that RR is much greater than RH and RS. According to Eq. (14), RR can be reduced by improving rock thermal conductivity and enlarging well tube diameter.
Figs. 6 and 7 describe the temperature distribution in rocks with different distance from wellbore at the beginning and end of the 20th heating season. It may be observed that at the beginning of the 20th heating season, the rocks especially close to well wall have a big temperature drop compared with the initial state before the first heating season. At H = 500, 1000, 1500, 2000 as well as 2500 m, the temperature drop of rocks compared with the initial state is respectively 0.92, 1.45, 1.96, 2.44, 2.91 K and 0.24, 0.32, 0.40, 0.47, 0.54 K for r = 30 and 50 m. According to Eq. (18), the influence radius of rock is 50.53 m for the 20 heating seasons. Although Eq. (18) takes no account of the heat power extracted from geothermal well, it can be used to describe the influence radius qualitatively. To sum up, it is indicated the influence radius reaches almost 50 m with heating time of 20 years. Consequently, it can be concluded that two geothermal wells distance proposed in the practical projects should not be less than 100 m to avoid interaction.
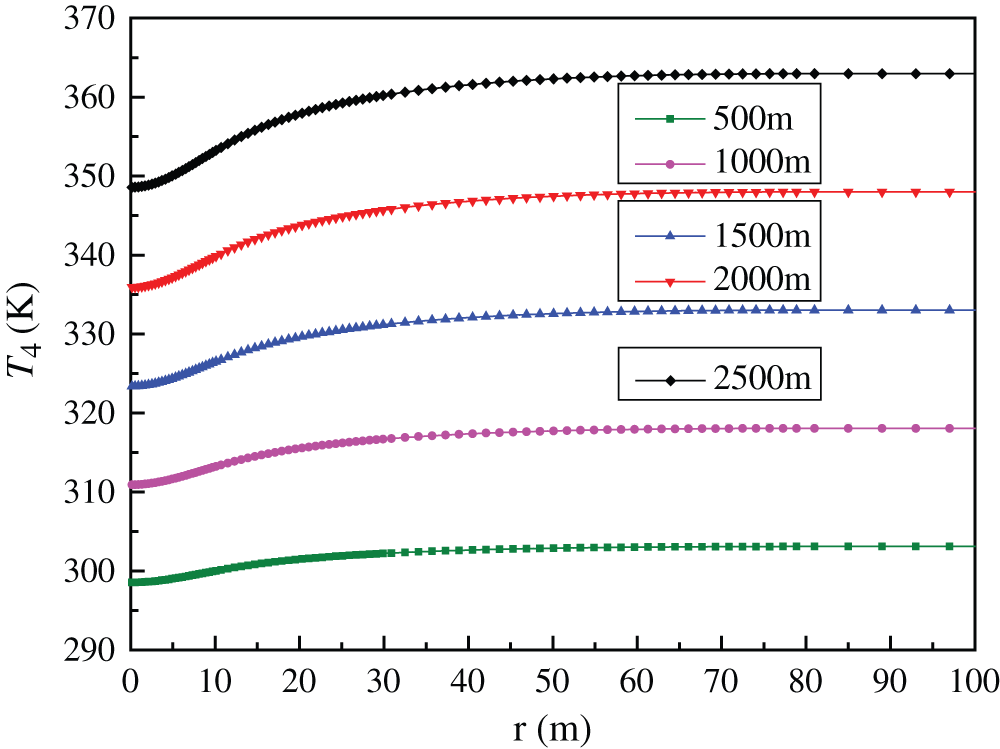
Figure 6: Temperature distribution in rock with different distance from wellbore at the beginning of the 20th heating season
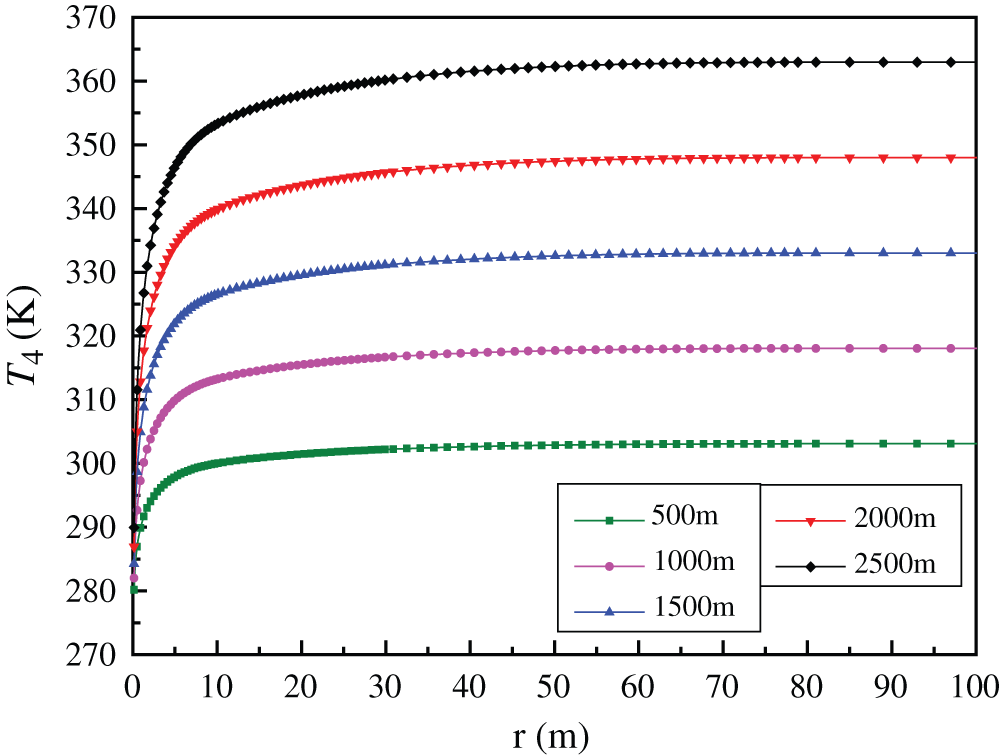
Figure 7: Temperature distribution in rock with different distance from wellbore at the end of the 20th heating season
3.3 Effect of Rock Thermal Conductivity
The effect of rock thermal conductivity λ4 on Tout and QE is illustrated in Fig. 8. As expected, increasing λ4 results in rises of Tout and QE. The average Tout and QE at each heating season are respectively 288.81, 290.50, 292.11 K and 672.71, 777.52, 877.62 kW for λ4 = 2.5, 3.0 and 3.5 W/(mK). QE increases by nearly 100 kW when λ4 increases by 0.5 W/(mK).
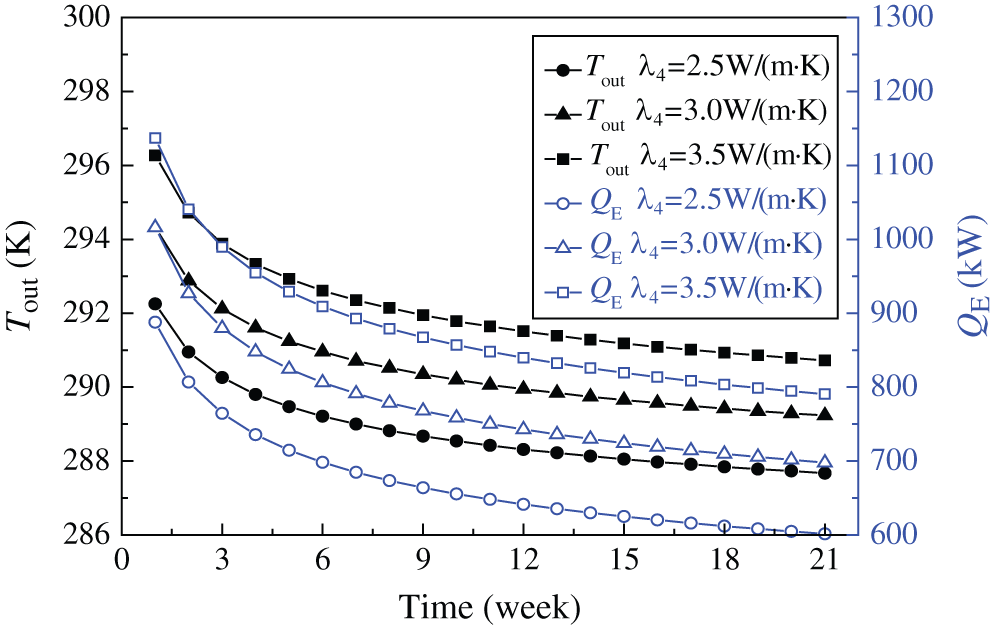
Figure 8: Tout and QE with respect to different rock thermal conductivity
The thermal conductivity of the rock has significant influence on the heat extraction rate and heat recovery. According to Eq. (14), RR is inversely proportional to λ4. The bigger λ4, the smaller RR. RR is 3.14 × 10⁻¹, 2.61 × 10⁻¹ and 2.24 × 10⁻¹ mK/W, respectively, for λ4 = 2.5, 3.0 and 3.5 W/(mK). The location with higher λ4 should be selected for drilling a new geothermal well in practical engineering. The λ4 is determined by natural conditions. Thus, filling composite material with high thermal conductivity into leakage formation is an effective measure to improve thermal conductivity and reduce thermal resistance of rocks.
3.4 Effect of Geothermal Gradient
Fig. 9 exhibits Tout and QE as a function of Tg. As can be discovered, Tout and QE depend largely on Tg, and increasing Tg will cause the increase of Tout and QE. ΔT increases with the increasing Tg, thus resulting in the corresponding increases in qL and QE when RT remains unchanged according to Eqs. (21) and (22). The average Tout and QE at the heating season are respectively 287.06, 290.50, 293.94 K and 563.97, 777.52, 991.06 kW for Tg = 20, 30 and 40 K/km. QE increases by 213.55 kW when Tg varies from 20 to 30 K/km. QE has the same variation trend as Tg varies from 30 to 40 K/km.
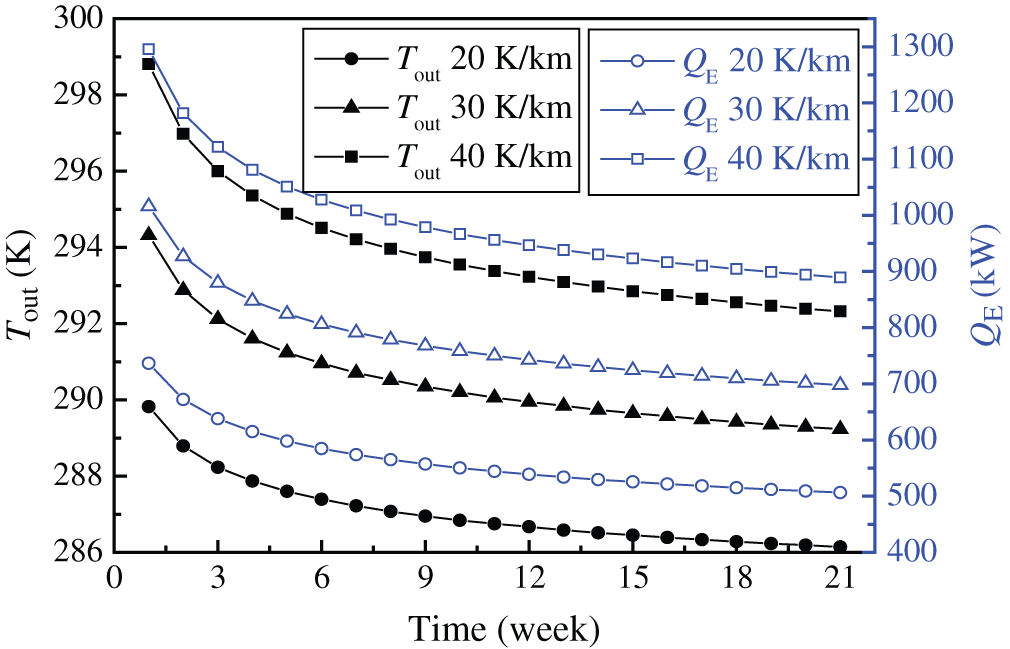
Figure 9: Tout and QE with respect to different geothermal gradient
The effect of well diameter on Tout and QE are shown in Fig. 10. As can be seen, QE increases with increasing well diameter. Average Tout and QE at the whole heating season are 295.17, 290.50, 289.07 K and 702.62, 777.52, 812.85 kW, respectively. QE for M and B type well increase by 74.90 and 110.23 kW compared with S type well. The cross sectional area for M and B type well is respectively 1.52 and 1.89 times larger than that of S type well, while QE of M and B type well is only 1.12 and 1.16 times larger than that of S type well. That is to say the smaller the well diameter, the deeper influence of well diameter on QE. RR, RH, RS and RT all vary with the well diameter according to Eqs. (14) and (17). RT of S, M and B type well is respectively 27.36 × 10⁻², 26.24 × 10⁻² and 25.74 × 10⁻² mK/W, and RT for M and B type well decreases by 4.09% and 5.92% respectively than that of S type well. It can be concluded that an increase in well diameter leads to increasing QE, however drilling cost also increases with the enlargement of well diameter. Therefore, the economic performance should be considered for the selection of well diameter.
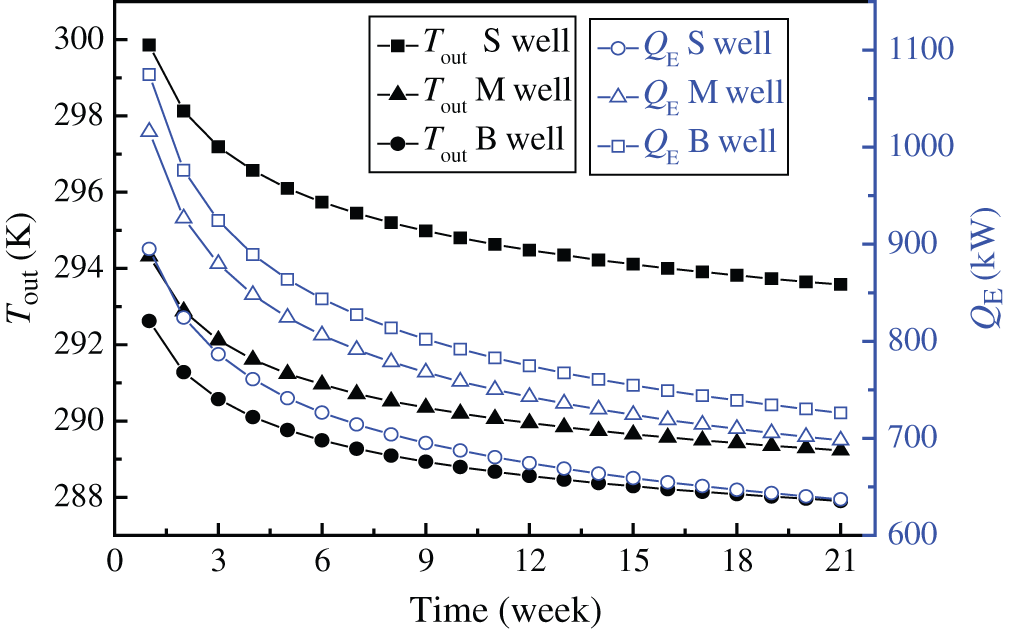
Figure 10: Effect of well diameter on Tout and QE
Tout and QE as a function of well depth are described in Fig. 11. It is obvious that well depth has a significantly effect on Tout and QE. The increasing well depth will lead to an increase in Tout and QE. This is because an increased H leads to the increase of rock temperature with the constant Tg, and thus the increase of ΔT and QE. Tout and QE are 284.33, 290.50, 298.66 K and 387.04, 777.52, 1285.85 kW, respectively, at H = 2000, 3000 and 4000 m. When H varies from 2000 to 3000 m and from 3000 to 4000 m, QE increases by 390.48 and 508.33 kW, respectively, indicating that the growth rate of QE becomes larger. But a deeper geothermal well will result in a higher drilling cost. To sum up, the system performance, drilling cost and payback period should be considered comprehensively so as to decide a reasonable well depth during practical design.
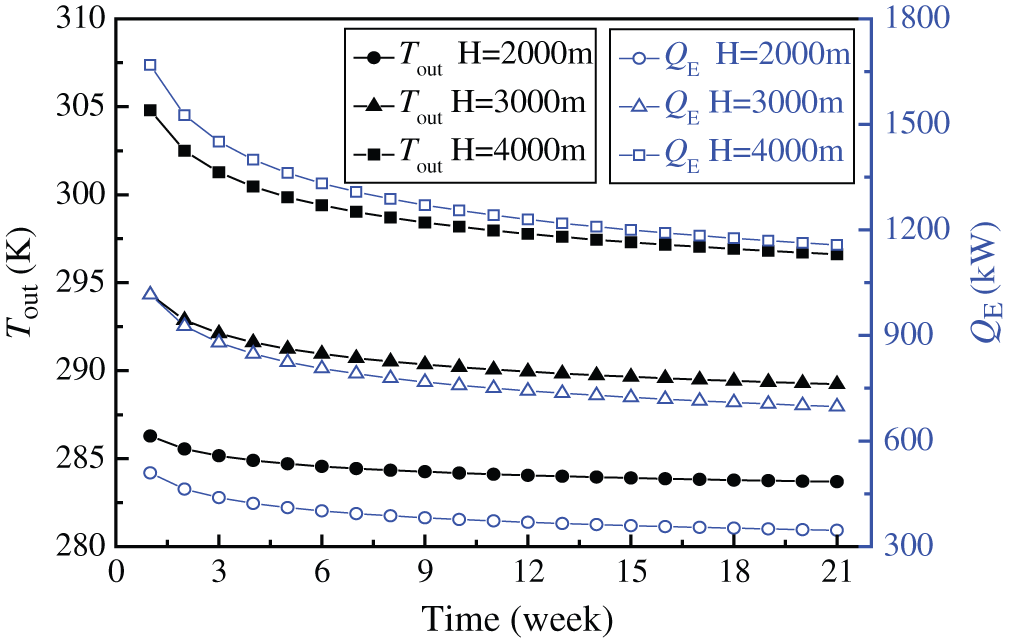
Figure 11: Effect of well depth on Tout and QE
3.7 Insulation Material Selection
In actual project, the insulator is easily replaced. It is particularly meaningful to analyze the effect of insulator on DBHE performance. Fig. 12 represents the influence of λ1 for insulator on QE at the first heating season. It can be observed that, the decreasing λ1 will cause an increase in QE, the smaller the λ1, the bigger the QE. More heat is prevented from extraction channel to injection channel with smaller λ1, thus resulting in a higher QE. Average QE at the whole heating season is respectively 777.49, 770.32, 763.27, 756.39 and 749.66 kW for λ1 = 0, 0.05, 0.1, 0.15 and 0.2 W/(mK). QE decreases by 13.61 kW when λ1 rises from 0.1 to 0.2 W/(mK), which implies that the thermal conductivity of insulator has little effect on QE.
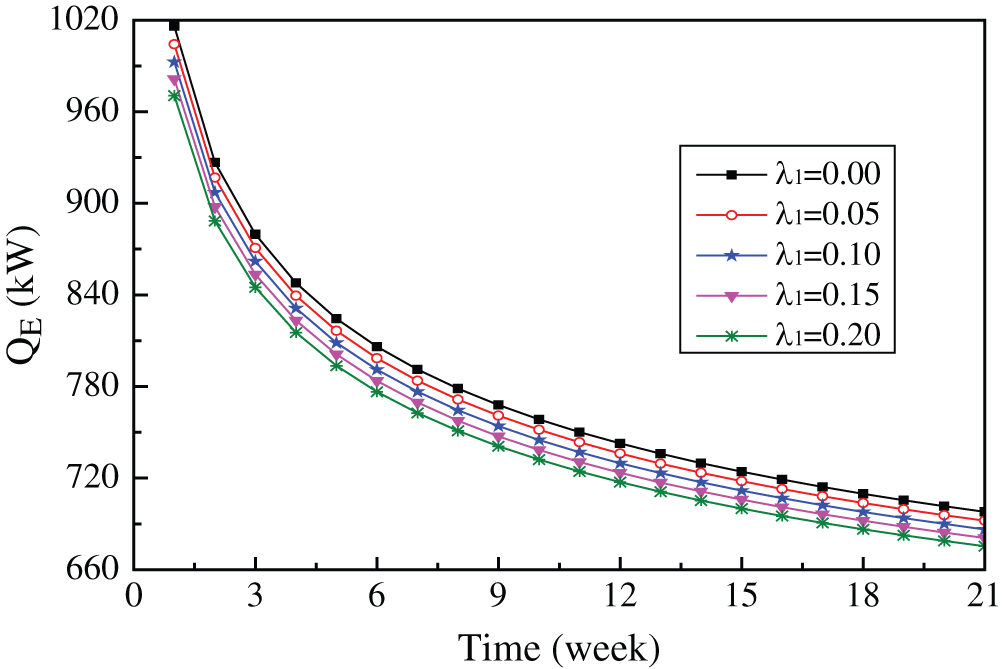
Figure 12: Relationship between QE and λ1
The fluid temperatures in injection and extraction channel vs. well depth are shown in Fig. 13. When the fluid moves downwards, the temperature rises and reaches the maximum at the bottom. The injection water is heated by the higher-temperature extraction water producing heat flux across the insulation tube, leading to a rise in temperature for T2 and thus a drop in temperature for T1 as well as Tout. It is obviously the bigger the λ1, the greater the heat loss, and hence, the lower the Tout. Tout is 289.40, 289.31, 289.22, 289.13 and 289.04 K, respectively, for λ1 = 0, 0.05, 0.1, 0.15 and 0.2 W/(mK). Compared to λ1 = 0 W/(mK), Tout drops by 0.36 K, and QE decreases by 27.22 kW with reduction ratio of 3.58% for λ1 = 0.2 W/(mK), implying that an ordinary insulator, such as polypropylene with thermal conductivity of 0.2 W/(mK), has met the need for insulation.
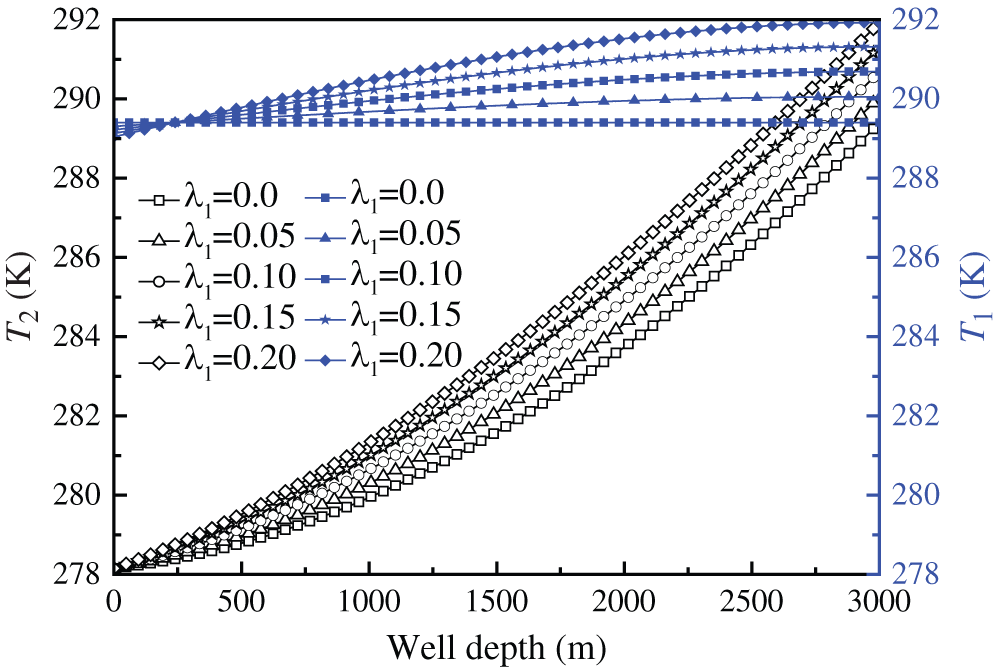
Figure 13: Fluid temperature vs. well depth
Fig. 14 depicts qL and T2 vs. well depth with λ1 = 0. It is evident qL and T2 increase rapidly with well depth. This is attributed to the fact that rock temperature increases with well depth, which leads to a rapid rise of T2 and thus a nearly linear increasing qL. The increasing well depth is an effective means for heat transfer enhancement between rock and geothermal well, but the economic performance needs to be considered.
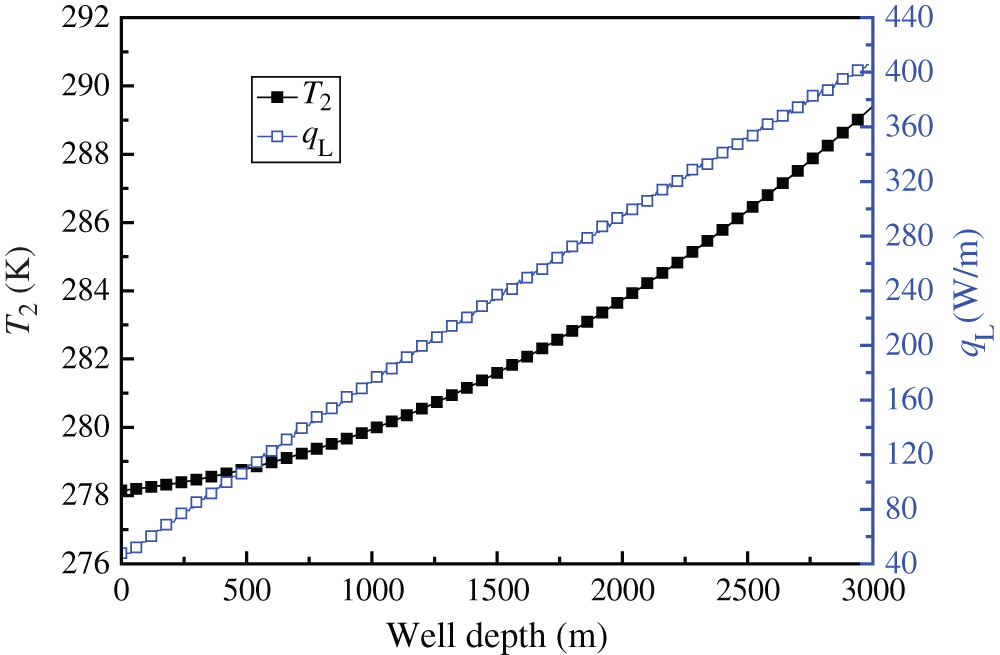
Figure 14: qL and T2 vs. well depth
3.8 Injection Water Temperature Selection
QE and QT vs. Tin is plotted in Fig. 15. The lower the Tin, the higher the QE and QT. The decrease in Tin causes the increase of ΔT, thus resulting in an increase in QE. QE is 812.40, 777.49 and 743.91 kW, respectively, for Tin = 275.65, 278.15 and 280.65 K. COP is respectively 4.51, 4.70 and 4.91 for Tin = 275.65, 278.15 and 280.65 K, indicating that COP increases with the increase of Tin. QT is respectively 1043.89, 987.86 and 934.29 kW for Tin = 275.65, 278.15 and 280.65 K, implying that QT increases with the decrease of Tin although COP decreases. The above analysis results show that under working conditions of heat pump, the lower the Tin, the higher the QE and QT.
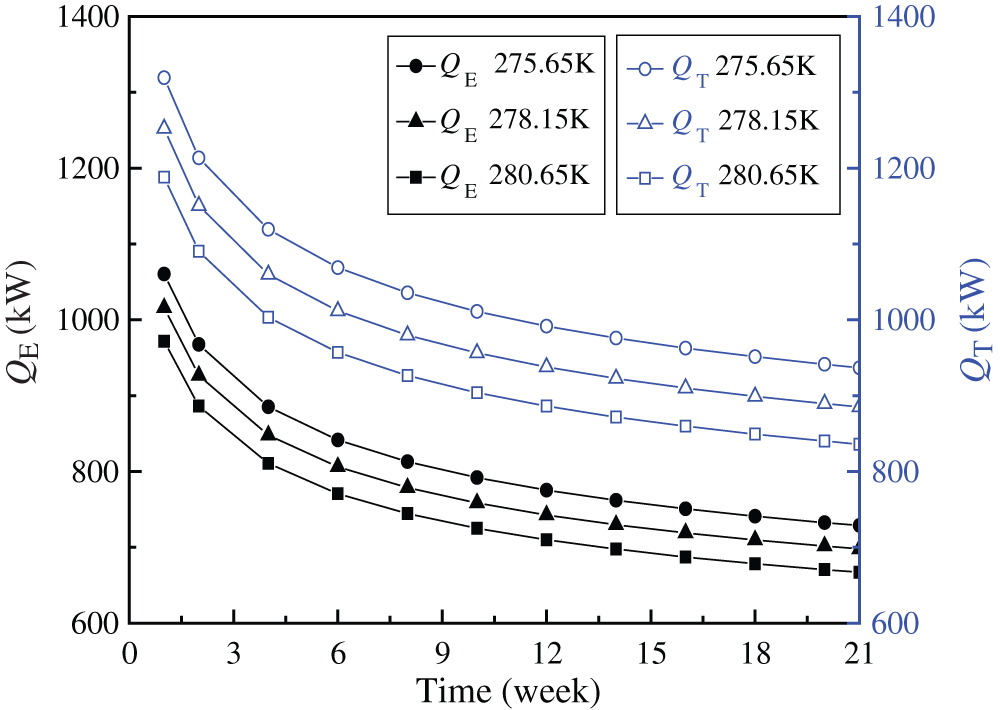
Figure 15: QE and QT vs. Tin
3.9 Injection Water Velocity Selection
QE as a function of Vin is plotted in Fig. 16. A higher injection velocity in geothermal well will lead to the increase of QE. Average QE at the whole heating season is respectively 715.44, 777.49 and 800.91 kW with Vin of 0.5, 1.0 and 1.5 m/s. An increase in Vin results in an increase in h3 according to Eq. (7) and thus a decrease in RH according to Eq. (15). RH is respectively 10.64 × 10⁻⁴, 8.46 × 10⁻⁴ and 7.07 × 10⁻⁴ mK/W at Vin = 0.5, 1.0 and 1.5 m/s, reflecting that the influence of Vin on QE becomes small with increasing Vin. Generally, increasing velocity leads to an increase in pump power consumption. The relationship between pump power consumption, Vin and QE is given as follows [35]:
where VOL is volume flow rate, m3/h; HP is the head of pump, m; ηp is the pump efficiency; QP is the power consumption of pump, kW.
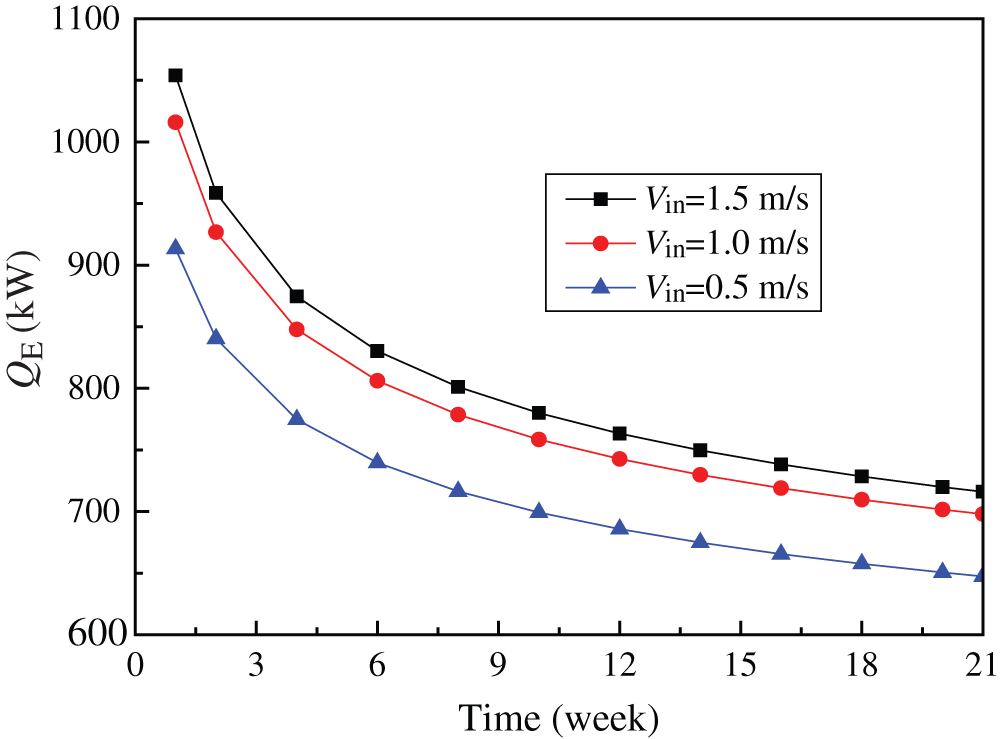
Figure 16: QE vs. Vin
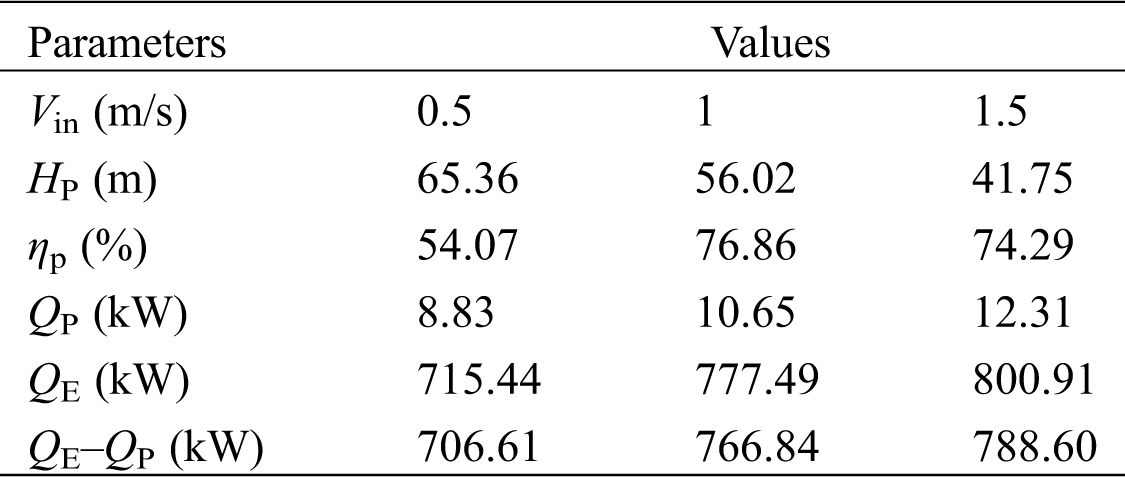
Tab. 4 presents the quantitative relationship between QP, Vin and QE. QP increases with the rising Vin, and they are respectively 8.83, 10.65 and 12.31 kW at Vin = 0.5, 1.0 and 1.5 m/s. The difference between QE and QP is respectively 706.61, 766.84 and 788.60 at Vin = 0.5, 1.0 and 1.5 m/s, which indicates that increasing Vin can cause the increase of net heat output from geothermal well and pump power consumption. The performance of heat pump should be considered to obtain the optimal Vin.
Table 4: The relationship of QE and pump power consumption
In the present study, a mathematical model describing heat conduction in rocks and heat convection in circulating fluid inside well tube and insulation tube is developed. And then some methods of heat transfer enhancement for SWGH are proposed and discussed by thermal resistance analysis. The main following conclusions can be drawn:
1. The extracted water temperature and extracted heat power both decrease with time, and the decreasing rate is decreased. For the 1st, 10th and 20th heating season, the average extracted water temperature is 290.15, 288.61 and 288.28 K, respectively, and the average extracted heat power is 755.01, 660.02 and 639.42 kW, respectively. The rock temperature always falls with time. The distance between two wells should not be less than 100 m to avoid interference.
2. The main factor affecting heating power is the thermal resistance of the rock, which is much larger than that of well wall and fluid. Reducing thermal resistance of rock is the most effective method to boost the extracted heat power. The thermal resistance of rock can be reduced by increasing well diameter and rock thermal conductivity. The extracted heat power increases by 100 kW when the rock thermal conductivity increases by 0.5 W/(mK).
3. The increasing well depth and geothermal gradient are also beneficially to promote extracted heat power. The heat transfer power per unit well depth increases with increasing well depth, and it is about 40 W/m at the top of the well and reaches almost 400 W/m at the bottom of the well. The extracted heat power is proportional to the geothermal gradient. The extracted heat power increases 213.54 kW with the increase of geothermal gradient of 10 K/km.
4. The thermal conductivity of insulation material has little impact on the extracted power. The extracted heat power decreases by 13.61 kW as the conductivity of insulation material rises from 0.1 to 0.2 W/(mK). The reduction ratio is just 1.78%. The decreasing injection water temperature is beneficial to the extracted heat power. The extracted heat power and output power of heat pump are respectively 812.40, 777.49, 743.91 kW and 1043.89, 987.86, 934.29 kW when injection water temperature is 275.65, 278.15 and 280.65 K.
5. Increasing injection velocity can cause the increase of pump power consumption, heat extraction from geothermal well and net heat output between them. The performance of heat pump should be considered when choosing injection velocity so as to get the optimal system performance.
Funding Statement: This research was funded by National Natural Science Foundation of China (No. 41972314).
Conflicts of Interest: The authors declare that they have no conflicts of interest to report regarding the present study.
1. Rubio-Maya, C., Ambríz Díaz, V. M., Pastor Martínez, E. (2015). Cascade utilization of low and medium enthalpy geothermal resources—A review. Renewable and Sustainable Energy Reviews, 52, 689–716. DOI 10.1016/j.rser.2015.07.162. [Google Scholar] [CrossRef]
2. Keçebas, A. (2016). Exergoenvironmental analysis for a geothermal district heating system: An application. Energy, 94, 391–400. DOI 10.1016/j.energy.2015.11.010. [Google Scholar] [CrossRef]
3. Hou, J., Cao, M., Liu, P. (2018). Development and utilization of geothermal energy in China: Current practices and future strategies. Renewable Energy, 125, 401–412. DOI 10.1016/j.renene.2018.02.115. [Google Scholar] [CrossRef]
4. Alimonti, C., Soldo, E. (2016). Study of geothermal power generation from a very deep oil well with a wellbore heat exchanger. Renewable Energy, 86, 292–301. DOI 10.1016/j.renene.2015.08.031. [Google Scholar] [CrossRef]
5. Bu, X. B., Ma, W. B., Li, H. S. (2012). Geothermal energy production utilizing abandoned oil and gas wells. Renewable Energy, 41, 80–85. DOI 10.1016/j.renene.2011.10.009. [Google Scholar] [CrossRef]
6. Caulk, R. A., Tomac, I. (2017). Reuse of abandoned oil and gas wells for geothermal energy production. Renewable Energy, 112, 388–397. DOI 10.1016/j.renene.2017.05.042. [Google Scholar] [CrossRef]
7. Cheng, W. L., Li, T. T., Nian, Y. L. (2013). Studies on geothermal power generation using abandoned oil wells. Energy, 59, 248–254. DOI 10.1016/j.energy.2013.07.008. [Google Scholar] [CrossRef]
8. Cheng, W. L., Li, T. T., Nian, Y. L. (2014). Evaluation of working fluids for geothermal power generation from abandoned oil wells. Applied Energy, 118, 238–245. DOI 10.1016/j.apenergy.2013.12.039. [Google Scholar] [CrossRef]
9. Cheng, W. L., Liu, J., Nian, Y. L. (2016). Enhancing geothermal power generation from abandoned oil wells with thermal reservoirs. Energy, 109, 537–545. DOI 10.1016/j.energy.2016.05.009. [Google Scholar] [CrossRef]
10. Cui, G. D., Ren, S. R., Zhang, L. (2017). Geothermal exploitation from hot dry rocks via recycling heat transmission fluid in a horizontal well. Energy, 128, 366–377. DOI 10.1016/j.energy.2017.04.027. [Google Scholar] [CrossRef]
11. Davis, A. P., Michaelides, E. E. (2009). Geothermal power production from abandoned oil wells. Energy, 34(7), 866–872. DOI 10.1016/j.energy.2009.03.017. [Google Scholar] [CrossRef]
12. Gharibi, S., Mortezazadeh, E., Bodi, S. J. H. A., Vatani, A. (2018). Feasibility study of geothermal heat extraction from abandoned oil wells using a U-tube heat exchanger. Energy, 153, 554–567. DOI 10.1016/j.energy.2018.04.003. [Google Scholar] [CrossRef]
13. Kujawa, T., Nowak, W., Stachel, A. A. (2006). Utilization of existing deep geological wells for acquisitions of geothermal energy. Energy, 31(5), 650–664. DOI 10.1016/j.energy.2005.05.002. [Google Scholar] [CrossRef]
14. Nian, Y. L., Cheng, W. L. (2018a). Evaluation of geothermal heating from abandoned oil wells. Energy, 142, 592–607. DOI 10.1016/j.energy.2017.10.062. [Google Scholar] [CrossRef]
15. Nian, Y. L., Cheng, W. L. (2018b). Insights into geothermal utilization of abandoned oil and gas wells. Renewable and Sustainable Energy Reviews, 87, 44–60. DOI 10.1016/j.rser.2018.02.004. [Google Scholar] [CrossRef]
16. Noorollahi, Y., Pourarshad, M., Jalilinasrabady, S., Yousefi, H. (2015). Numerical simulation of power production from abandoned oil wells in Ahwaz oil field in southern Iran. Geothermics, 55, 16–23. DOI 10.1016/j.geothermics.2015.01.008. [Google Scholar] [CrossRef]
17. Templeton, J. D., Ghoreishi-Madiseh, S. A., Hassani, F., Al-khawaja, M. J. (2014). Abandoned petroleum wells as sustainable sources of geothermal energy. Energy, 70, 366–373. DOI 10.1016/j.energy.2014.04.006. [Google Scholar] [CrossRef]
18. Wight, N. M., Bennett, N. S. (2015). Geothermal energy from abandoned oil and gas wells using water in combination with a closed wellbore. Applied Thermal Engineering, 89, 908–915. DOI 10.1016/j.applthermaleng.2015.06.030. [Google Scholar] [CrossRef]
19. Saadi, M. S., Gomri, R. (2017). Investigation of dynamic heat transfer process through coaxial heat exchangers in the ground. International Journal of Hydrogen Energy, 42(28), 18014–18027. DOI 10.1016/j.ijhydene.2017.03.106. [Google Scholar] [CrossRef]
20. Yang, M., Li, X., Deng, J., Meng, Y. F., Li, G. (2015). Prediction of wellbore and formation temperatures during circulation and shut-in stages under kick conditions. Energy, 91, 1018–1029. DOI 10.1016/j.energy.2015.09.001. [Google Scholar] [CrossRef]
21. Beier, R. A., Acuna, J., Mogensen, P., Palm, B. (2014). Transient heat transfer in a coaxial borehole heat Exchanger. Geothermics, 51, 470–482. DOI 10.1016/j.geothermics.2014.02.006. [Google Scholar] [CrossRef]
22. Fang, L., Diao, N. R., Shao, Z. K. (2018). A computationally efficient numerical model for heat transfer simulation of deep borehole heat exchangers. Energy & Buildings, 167, 79–88. DOI 10.1016/j.enbuild.2018.02.013. [Google Scholar] [CrossRef]
23. Song, X. Z., Wang, G. S., Shi, Y. (2018). Numerical analysis of heat extraction performance of a deep coaxial borehole heat exchanger geothermal system. Energy, 164, 1298–1310. DOI 10.1016/j.energy.2018.08.056. [Google Scholar] [CrossRef]
24. Yekoladio, P. J., Bello-Ochende, T., Meyer, J. P. (2013). Design and optimization of a downhole coaxial heat exchanger for an enhanced geothermal system (EGS). Renewable Energy, 55, 128–137. DOI 10.1016/j.renene.2012.11.035. [Google Scholar] [CrossRef]
25. Morita, K., Bollmeier, W. S., Mizogami, H. (1992a). Experiment to prove the concept of the downhole coaxial heat exchanger (DCHE) in Hawaii. Geothermal Resources Council, 16, 9–16. [Google Scholar]
26. Morita, K., Bollmeier, W. S., Mizogami, H. (1992b). Analysis of the results from the downhole coaxial heat exchanger (DCHE) experiment in Hawaii. Geothermal Resources Council, 16, 17–23. [Google Scholar]
27. Kohl, T., Salton, M., Rybach, L. (2000). Data analysis of the deep borehole heat exchanger plant Weissbad (Switzerland). Proceedings World Geothermal Congress, pp. 3459–3464. Kyushu-Tohoku. [Google Scholar]
28. Kohl, T., Brenni, R., Eugster, W. (2002). System performance of a deep borehole heat exchanger. Geothermics, 31(6), 687–708. DOI 10.1016/S0375-6505(02)00031-7. [Google Scholar] [CrossRef]
29. Huchtemann, K., Müller, D. (2014). Combined simulation of a deep ground source heat exchanger and an office building. Building and Environment, 73, 97–105. DOI 10.1016/j.buildenv.2013.12.003. [Google Scholar] [CrossRef]
30. Alfonso, G. G., Gilberto, E. P., Isaías, H. R. (2002). Study on the flow production characteristics of deep geothermal wells. Geothermics, 31(2), 141–167. DOI 10.1016/S0375-6505(01)00032-3. [Google Scholar] [CrossRef]
31. Bu, X. B., Ran, Y. M., Zhang, D. (2019). Experimental and simulation studies of geothermal single well for building heating. Renewable Energy, 143, 1902–1909. DOI 10.1016/j.renene.2019.06.005. [Google Scholar] [CrossRef]
32. Bu, X. B., Jiang, K. Q., Li, H. S. (2019). Performance of geothermal single well for intermittent heating. Energy, 186, 115858. DOI 10.1016/j.energy.2019.115858. [Google Scholar] [CrossRef]
33. Kim, E. J., Roux, J. J., Rusaouen, G., Kuznik, F. (2010). Numerical modeling of geothermal vertical heat exchangers for the short time analysis using the state model size reduction technique. Applied Thermal Engineering, 30(6–7), 706–714. DOI 10.1016/j.applthermaleng.2009.11.019. [Google Scholar] [CrossRef]
34. Liu, Y., Liu, J. X., Ding, G. (2007). Mathematical model of water-source heat pump units under variant working conditions. Heating Ventilating & Air Conditioning, 37, 21–24. [Google Scholar]
35. Arribas, E. J. (2010). Thermodynamic model of a cascaded organic rankine cycle power plant (Dissertation). Technische Universität München, Munich. [Google Scholar]
 | This work is licensed under a Creative Commons Attribution 4.0 International License, which permits unrestricted use, distribution, and reproduction in any medium, provided the original work is properly cited. |