| Energy Engineering |
DOI: 10.32604/EE.2021.014655
ARTICLE
Research on Reliability of Desorption Indexes of Drilling Cuttings (K1 and ∆h2): A Case-Based on Pingdingshan Mining Region, China
1State Key Laboratory of Coking Coal Exploitation and Comprehensive Utilization, China Pingmei Shenma Group, Pingdingshan, 467009, China
2Laboratory of Gas and Fire Control for Coal Mines (China University of Mining and Technology), Ministry of Education, Xuzhou, 221116, China
3Pingdingshan Tian’an Coal Mining Co., Ltd., Pingdingshan, 467000, China
*Corresponding Author: Biao Hu. Email: hubiao@cumt.edu.cn
Received: 17 October 2020; Accepted: 30 November 2020
Abstract: To accurately predict the risk of coal and gas outburst and evaluate the reliability of desorption indexes of drilling cuttings (K1 and ∆h2) in No. 16 coal seam of Pingmei No. 12 coal mine, two sets of coal samples were selected from the target coal seams for proximate analyses, methane adsorption/desorption tests, and desorption indexes of drilling cuttings tests. The results indicated that the desorption volume in the initial stage of desorption is large, and increases slowly in the later stage. The methane desorption volume of PMD1 and PMD2 coal samples accounts for 15.14%–18.09% and 15.72%–18.17% respectively in the first 1 min, and 43.92%–48.55% and 41.87%–52.25% respectively in the first 10 min in the 120 min desorption tests. Both K1 and ∆h2 present power function relationships with methane pressure. Similarly, the power function relationships also can be found between the initial desorption characteristics (Q1 and Q4–5) and the methane pressure. Finally, the average relative error between the measured value and the calculated value of Q1 based on K1 is less than that of Q4–5 based on ∆h2, which indicates that K1 is a more reliable index than ∆h2 to predict the risk of coal and gas outburst in the No. 16 coal seam of Pingmei No. 12 coal mine.
Keywords: Coal and gas outburst; methane; desorption; desorption indexes of drilling cuttings
Coal and gas outburst, a kind of dynamic disaster, not only affects coal production but also threatens the lives of coal mine workers [1–4]. Since the first reported coal and gas outburst occurred in Isaac coal mine, Lule coalfield, France, in 1843, more than 40000 outburst accidents have been reported worldwide [5]. In China, the first coal and gas outburst occurred in the Liaoyuan coal administration in 1950 [6]. After that, at least 20000 outburst accidents occurred in more than 600 coal mines, causing thousands of deaths [7]. Among countries affected by coal and gas outburst across the world, China ranks first in both frequency and intensity. In recent years, although many prevention and control measures have been taken in China, coal and gas outburst still occurs frequently due to the increase of mining depth and intensity [8,9].
Many prediction techniques have been employed in China and abroad to prevent coal and gas outbursts [10–13]. Considering the influence of gas occurrence and fast desorption characteristic on the development of coal and gas outbursts, many studies were conducted and some helpful indexes for coal and gas outburst forecasting were proposed. These indexes correspond to the desorption volume in different time intervals after the coal is exposed to the atmosphere [14–16]. One such index, D, is related to the depth of coal seam, Protodyakonov coefficient of coal, and gas pressure. Comprehensive index, K, is related to the Protodyakonov coefficient and the initial diffusion speed of gas. Desorption indexes of drilling cuttings (K1 and ∆h2) reflect the initial desorption capacity of coalbed gas, which are closely related to the damage degree of coal structure and desorption capacity and can effectively predict the outburst risk of coal seams. And desorption indexes (K1 and ∆h2) were carried out a lot of experimental research on this index and applied to areas with severe outburst disasters in China [17,18]. Japanese researchers gave importance to the laboratory research of outburst prediction and made the gas flow from the borehole to be the prediction index [19]. The ∆P index, based on the initial desorption rate of gas in coal was widely used to predict the instantaneous outburst tendency of coal mines [12,20]. According to previous research, the initial desorption indexes of drilling cuttings are closely related. Pingdingshan mining region, the 13th largest coal bases in China, producing over 50 million tons of coal per year, is composed of 12 coal and gas outburst prone mines [5]. The No. 12 coal mine of Pingdingshan have a complex geological structure, high gas pressure, and gas content, this coal mine was also identified as a high outburst risk coal mine. To ensure the accuracy of outburst predictions at No. 12 coal mine, it is necessary to study the relationship between gas desorption characteristics and coal and gas outburst indicators.
Owing to convenience and efficiency of the desorption indexes of drilling cuttings (K1 and ∆h2) in both engineering and laboratory, the indexes that reflect the initial desorption amount of gas in first (K1) and fourth to fifth (∆h2) minutes are widely used indexes in coalfields where the coal and gas outburst disasters are prominent (e.g., Pingdingshan, Huainan). In this paper, investigation and analysis on gas desorption law were carried out. A laboratory study on K1 and ∆h2 under different gas pressures was carried out. The gas adsorption/desorption properties and K1 and ∆h2 were analyzed under different gas pressures. The reliability test on K1 and ∆h2 was conducted. Finally, the experimental results were used for engineering and the critical values of indexes were calculated. The obtained results will be advantageous to predict coal and gas outburst hazards and provide safe working environment to coal mine workers in Pingdingshan mining region.
2.1 Materials Collection and Preparation
The cataclastic samples were taken from 31020 working faces in Pingmei No. 12 coal mine for the experimental study of outburst sensitive index and its critical values. Two samples were kept in canisters and labeled as PMD1 and PMD2, respectively. Then, the coal samples were sieved to 1.0–3.0, 0.18–0.25 and 0.075–0.18 mm in size for different experiments.
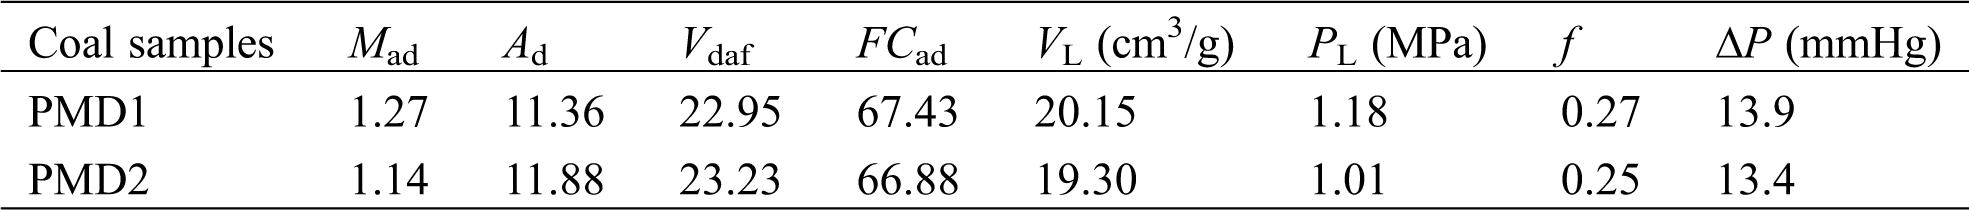
According to the China National Standard GB/T 212-2008 for the proximate analysis, a piece of automated industrial analyzer equipment (5E-MAG6600 MAG6600; Changsha Kaiyuan Instruments, China) was used to determine the moisture content (Mad), ash content (Ad), volatile matter (Vdaf) and fixed carbon (FCad) in coal. The size and weight of the coal sample for proximate analysis were 0.075–0.18 mm and 1 g, respectively. Three replicate analyses were performed, and the proximate analysis and vitrinite reflectance results for the coal samples are listed in Tab. 1.
According to the China National Standard GB/T 19560-2008 for the methane adsorption test, gas adsorption and desorption kinetics measurement equipment (KDXJ II; Jiangsu Kedi Instruments, China) was used to obtain methane adsorption isotherm at a constant temperature of 303 K. The Langmuir volume (VL) and Langmuir pressure (VP) were calculated by linear fitting of the adsorption data using the Langmuir equation [21,22].
According to the China Safety Production Industry Standard AQ/T 1080-2009 for the initial velocity index of diffusion of coal gas (∆P), a WT-1 initial velocity of diffusion of coal gas analyzer was used to measure the ∆P index. Meanwhile, according to the China National Standard GB/T 23561-2010 for the Protodyakonov coefficient (f), the f index of coal samples was also measured, as shown in Tab. 1.
The coal samples were placed in a sample container and then evacuated for 12 h at a constant temperature of 333 K for the desorption test. After the evacuation, the water bath was set to a constant temperature of 303 K. Then, the container was connected to high-purity methane with the desired methane pressure for 48 h. The process of desorption starts when the equilibrium stage completes. The free gas in the tank was released until the reading reduced to zero, and the tank was connected with a desorption tube quickly. The adsorption tank was then put into the water bath of 303 K. The experimental data was recorded in 120 min, and a timer was used to record the time.
According to the China Safety Production Industry Standard AQ/T 1065-2008 for K1 and ∆h2 test, the laboratory simulation tests of K1 and ∆h2 were conducted by the coal and gas outburst parameter testers of WTC (Zhengzhou Aidikeji Instruments, China) and MD-2 (Coal Research Institute of Fushun, China) respectively. The desorption index K1 was measured by taking transfer of the coal sample in the adsorption tank to WTC container immediately and filled within one minute. The button on the main engine of WTC was pressed exactly after one minute to start the desorption analysis. The values of K1 were obtained when the analyses were completed. The simulation test for Δh2 was performed by loading the glass bottle with coal, the scale mark of MD-2 was leveled. The adsorbed gas was allowed to desorb at the fourth minute. The desorption amount was calculated by the difference of water level on both sides of MD-2 instrument.
Table 1: Physical parameters of the samples
3.1 Methane Desorption Characteristics in Coal
Methane exists in coal in form of both free and adsorbed states. Coal fractures act as channels for gas migration. The migration process of methane is usually as follows. Firstly, the adsorbed gas on pore surface desorbs. Then, the desorbed gas diffuses from coal matrixes to fractures. Finally, the gas leaves the coal body and flows out [23]. Actually, methane desorption is the main factor of coalbed methane production. Most of the gas occurs as an absorbed state, only a small part occurs as a free state [21]. Gas desorption is affected by various factors such as gas content, gas pressure, the permeability of coal, initial gas desorption property, and coal firmness. All of these affecting factors can be studied in the laboratory as well as in coalfield [20]. In this study, methane desorption properties of coal samples were studied using the desorption experimental apparatus. To reduce the effect of atmospheric pressure and temperature on results, the raw data collected from laboratory test was converted to standard conditions of temperature and pressure. The conversion formula is shown as Eq. (1).
where, Qt,st is the desorption quantity under standard conditions at time t; cm3/g; Qt is the cumulative amount of desorbed gas measured at room temperature, cm3/g; Tat is the water temperature in the measuring tube, K; Tst is the gas temperature at standard condition, 273.15 K; Pat is the atmospheric pressure in the laboratory, Pa; Pst is gas pressure at standard condition, 101325 Pa; hw is the height of the water column in the tube, mm; Ps is the vapor pressure of saturated water at Tat K, Pa.
Fig. 1 shows the gas desorption curves of coal samples (PMD1 and PMD2) at equilibrium pressures of 0.6 MPa, 1.0M Pa, 2.0 MPa, 3.0 MPa, and 4.0 MPa. The desorption curves of coal samples are different but have certain regularity. The gas desorption volume increases gradually with time. The desorption volume in the initial stage of desorption is large, and the desorption volume increases slowly in the later stage. The methane desorption amount of coal samples over time and gas pressure are approximately parabolic and positive. The desorption curves at high pressure are located above the curves at low pressure during different desorption times, and its initial gradient is relatively large, which indicates that higher equilibrium pressure causes a greater initial methane desorption rate. The common feature of the curves is that with the desorption time increasing, the methane desorption amount and speed gradually increase and decrease respectively. At the initial moment, the methane desorption speed is large. Then, the speed decays rapidly. The greater the adsorption equilibrium pressure, the greater the methane desorption volume at the same time.
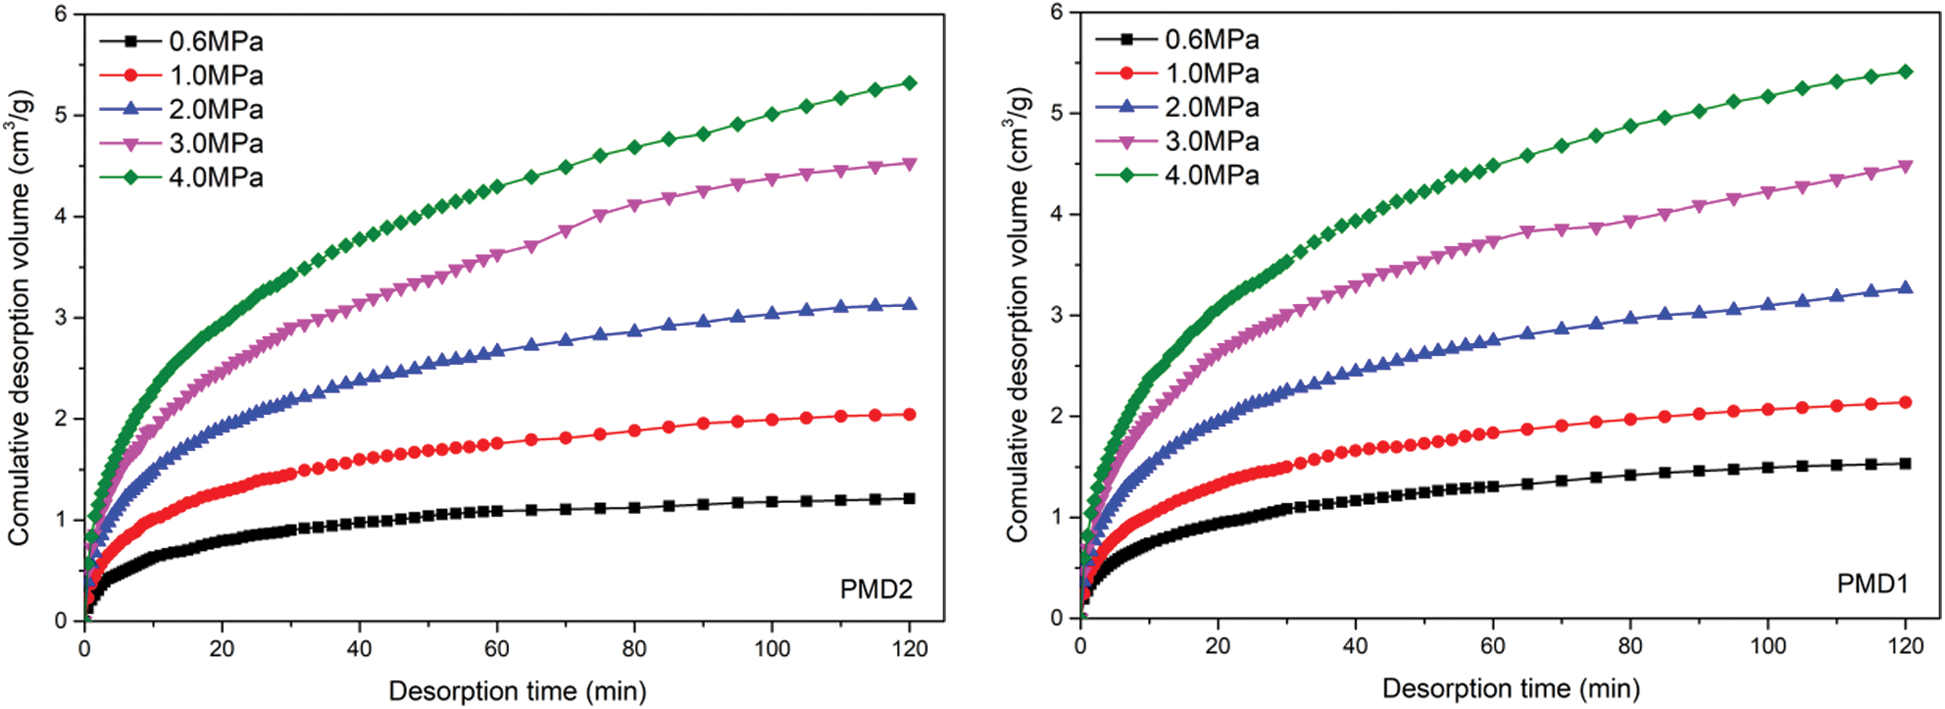
Figure 1: Methane desorption characteristic curves in coal under different equilibrium pressures
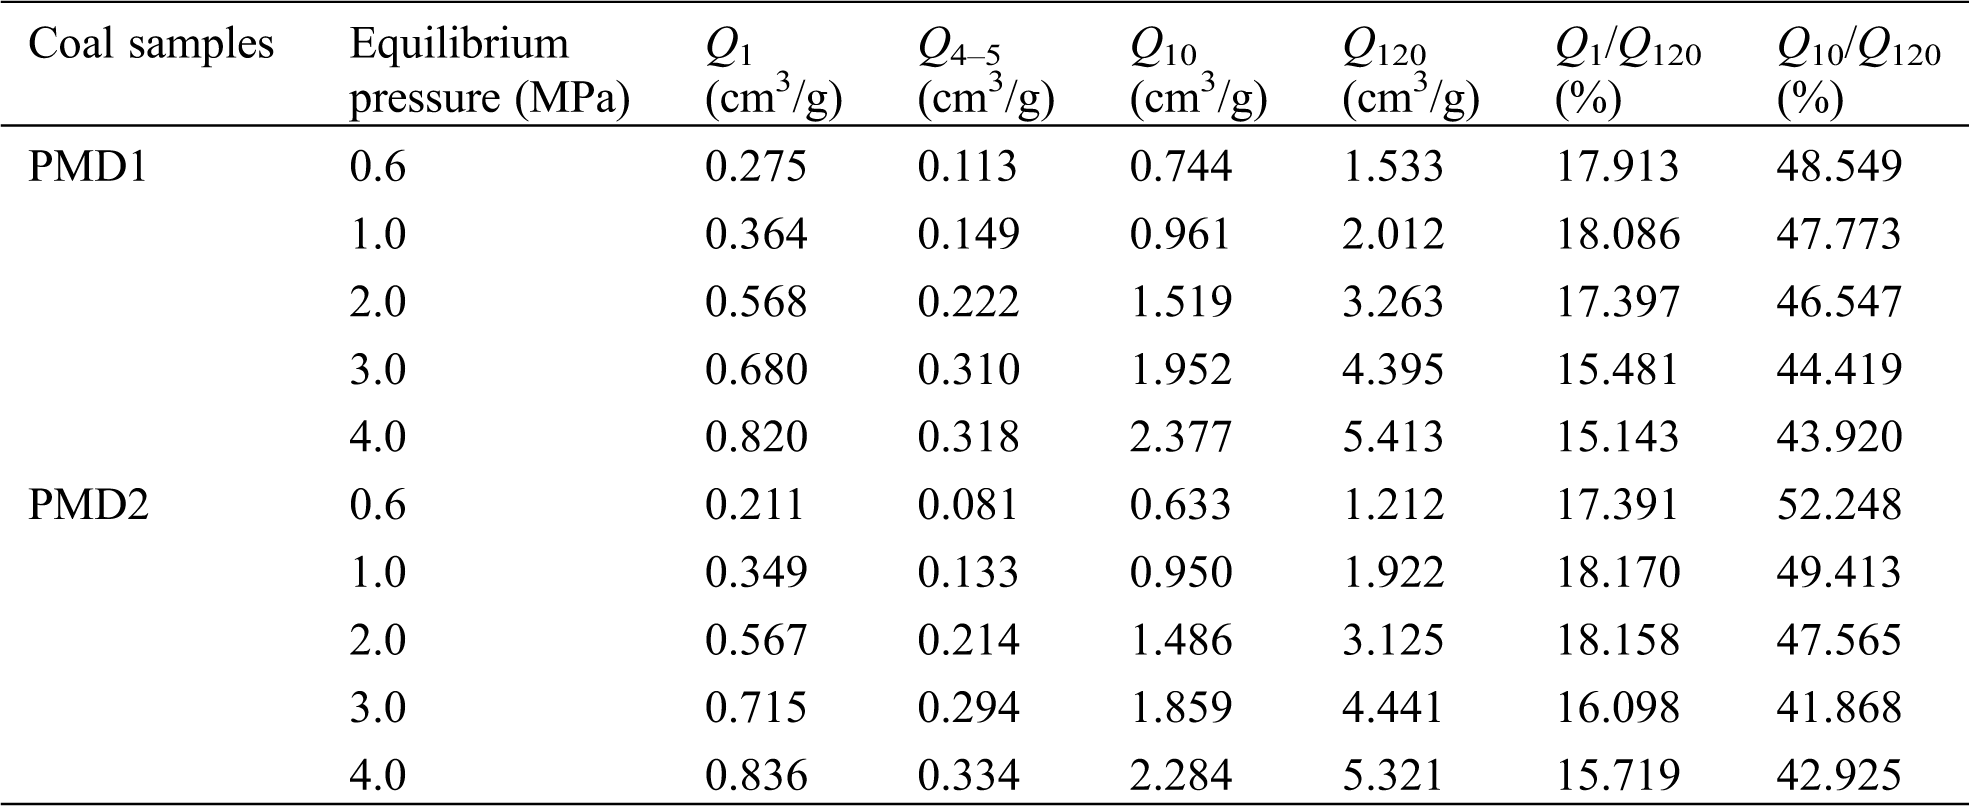
Tab. 2 shows the desorption amount in the first minute (Q1), 4th to 5th min (Q4–5), the first 10 min (Q10), and the whole desorption process (Q120) of the coal samples under different equilibrium pressure conditions. They were analyzed by the methane desorption amount proportion of the first 1 min and the first 10 min to the total desorption process. It can be found that the initial methane desorption capacity of the two samples is relatively large, and their attenuation is rapid. The proportions of Q1 and Q10 to Q120 are 15.14%–18.09% and 43.92%–48.55% respectively for PMD1, and 15.72%–18.17% and 41.87%–52.25% respectively for PMD2. It further verifies that methane desorption behavior in coal has the characteristics of large initial desorption capacity and fast initial desorption speed. The initial methane desorption characteristics of two coal samples also verify the reliability of the initial gas release speed results.
Table 2: Methane desorption data in coal at different times
3.2 K1 and ∆h2 at Different Adsorption Equilibrium Pressures
China coal research institute proposed that K1 and ∆h2 are prominent prediction indexes reflecting the initial desorption capacity of coalbed methane, which is closely related to the damage degree of coal structure and adsorption/desorption capacity [24]. The laboratory simulation tests of gas desorption index of drill cuttings were carried out and the results of K1 and ∆h2 indexes are displayed in Tab. 3.
Table 3: Simulation results of desorption indexes of drilling cuttings under different equilibrium pressures
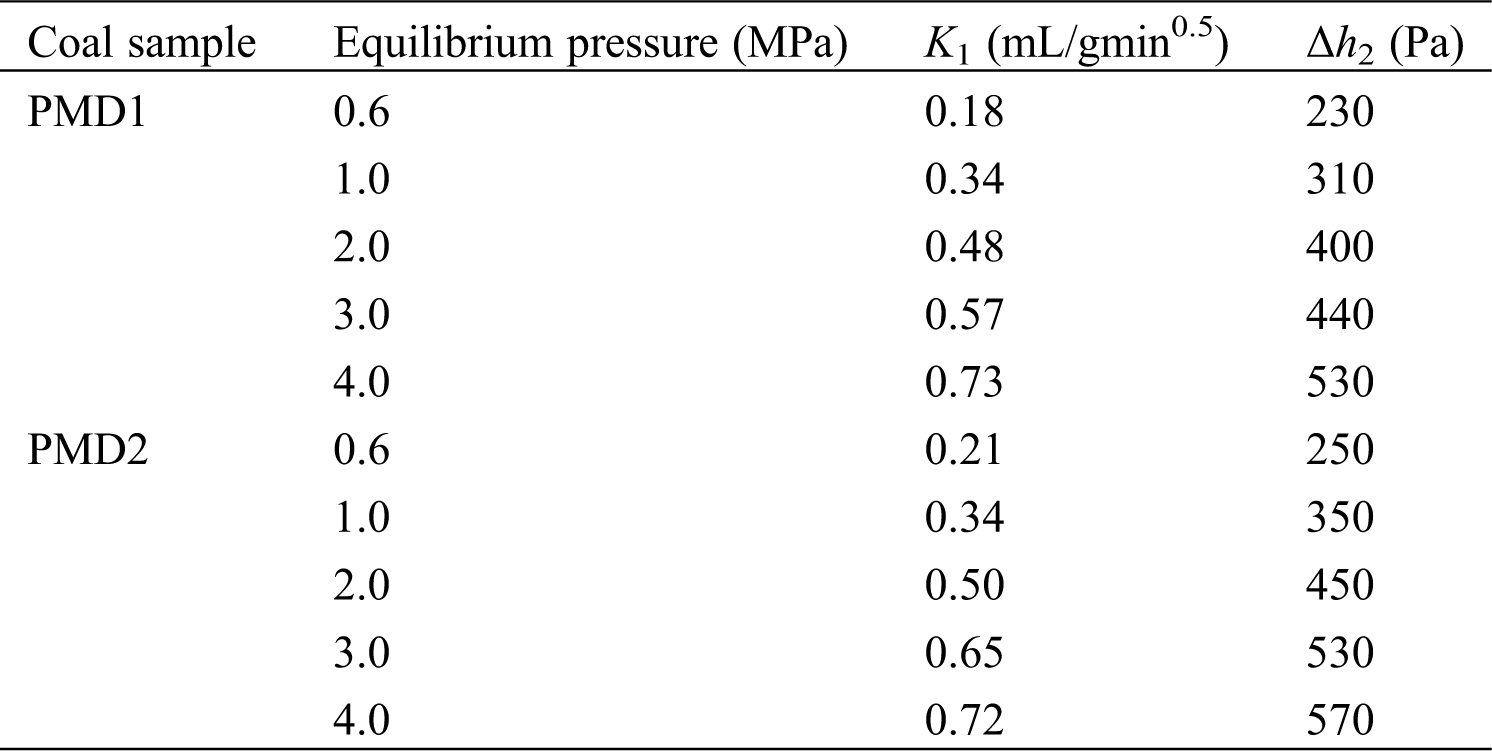
According to measuring methods of K1 and ∆h2 in the laboratory, simulation tests were carried out on coal samples of the same size. The K1 values of PMD1 and PMD2 coal samples under different adsorption equilibrium pressures are 0.18–0.73 mL/g min0.5 and 0.21–0.72 mL/g min0.5, respectively. The ∆h2 values of PMD1 and PMD2 coal samples are 230–530 Pa and 250–570 Pa, respectively. The results of desorption indexes of coal samples (Fig. 2) indicate that, with the increase of adsorption equilibrium pressure, the value of gas desorption indexes of drill cuttings gradually increase. Many scholars found power relationships between equilibrium gas pressure and both K1 and ∆h2 [20]. The simulation results of K1 and ∆h2 of coal samples are analyzed comprehensively. The fitting relationship between desorption index of drilling cuttings measured under different equilibrium pressures and gas pressure conforms to a power function, and the average correlation coefficient R2 is 0.982, which is consistent with the research results of other scholars [19,20].
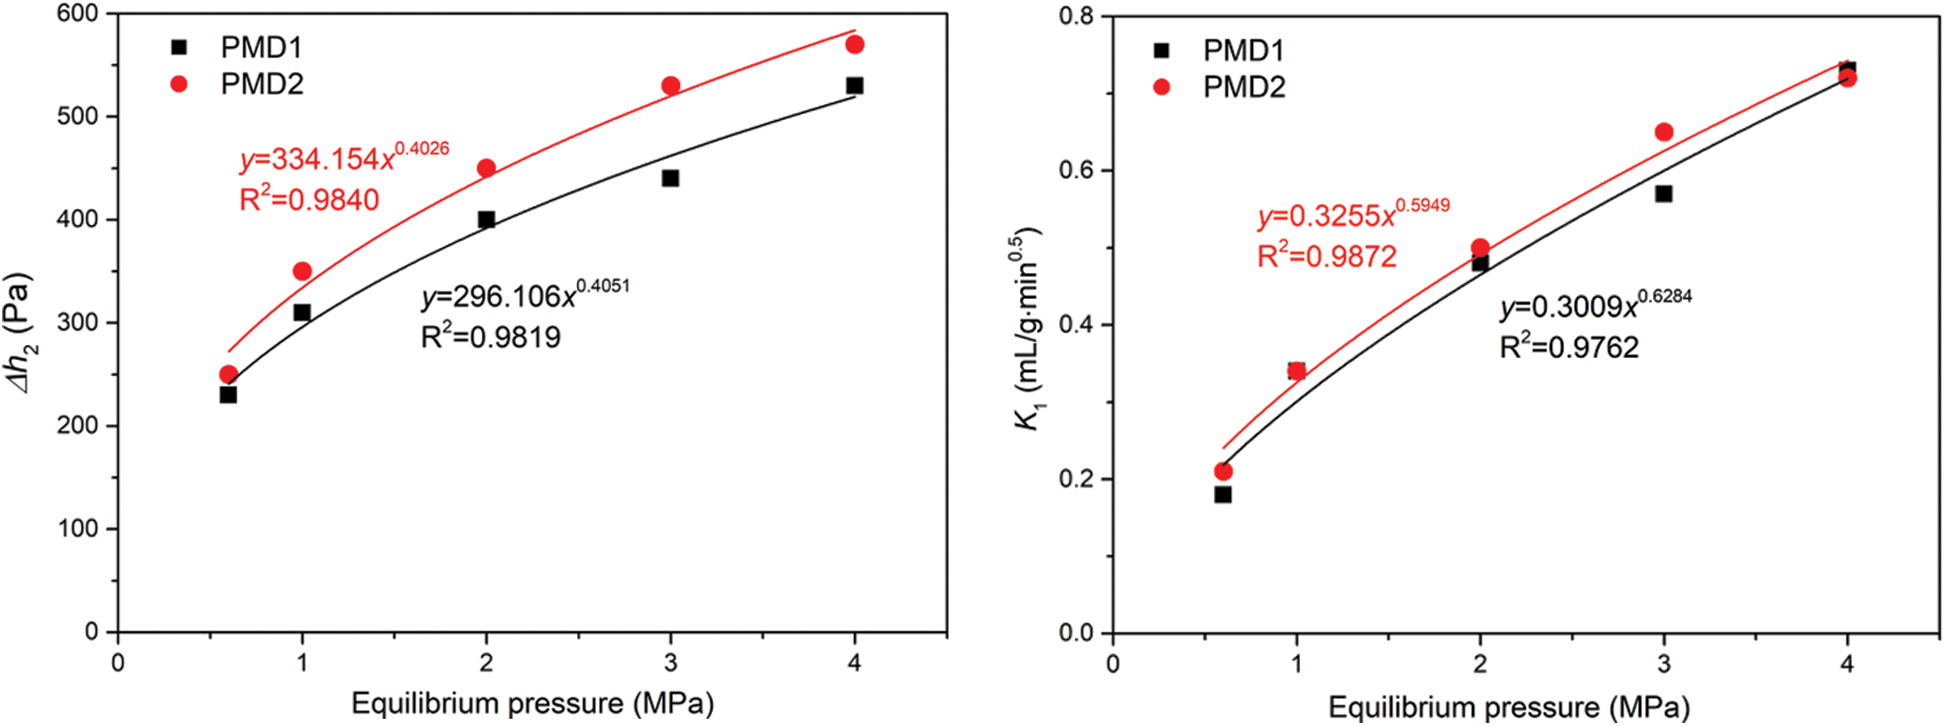
Figure 2: Fitting curves of desorption indexes of drill cuttings under different equilibrium pressures
3.3 Initial Desorption Characteristics (Q1 and Q4–5) for Different Adsorption Equilibrium Pressures
The research on the development of coal and gas outburst shows that the process of coal and gas outburst is accompanied by the rapid desorption of a large amount of gas in a very short time [1,4], which indicates that the risk of coal and gas outburst is closely related to the initial desorption behavior of coal samples. According to the amount of gas desorption of coal samples under different gas equilibrium pressures in Section 3.1, the initial desorption characteristics are studied, as shown in Fig. 3.
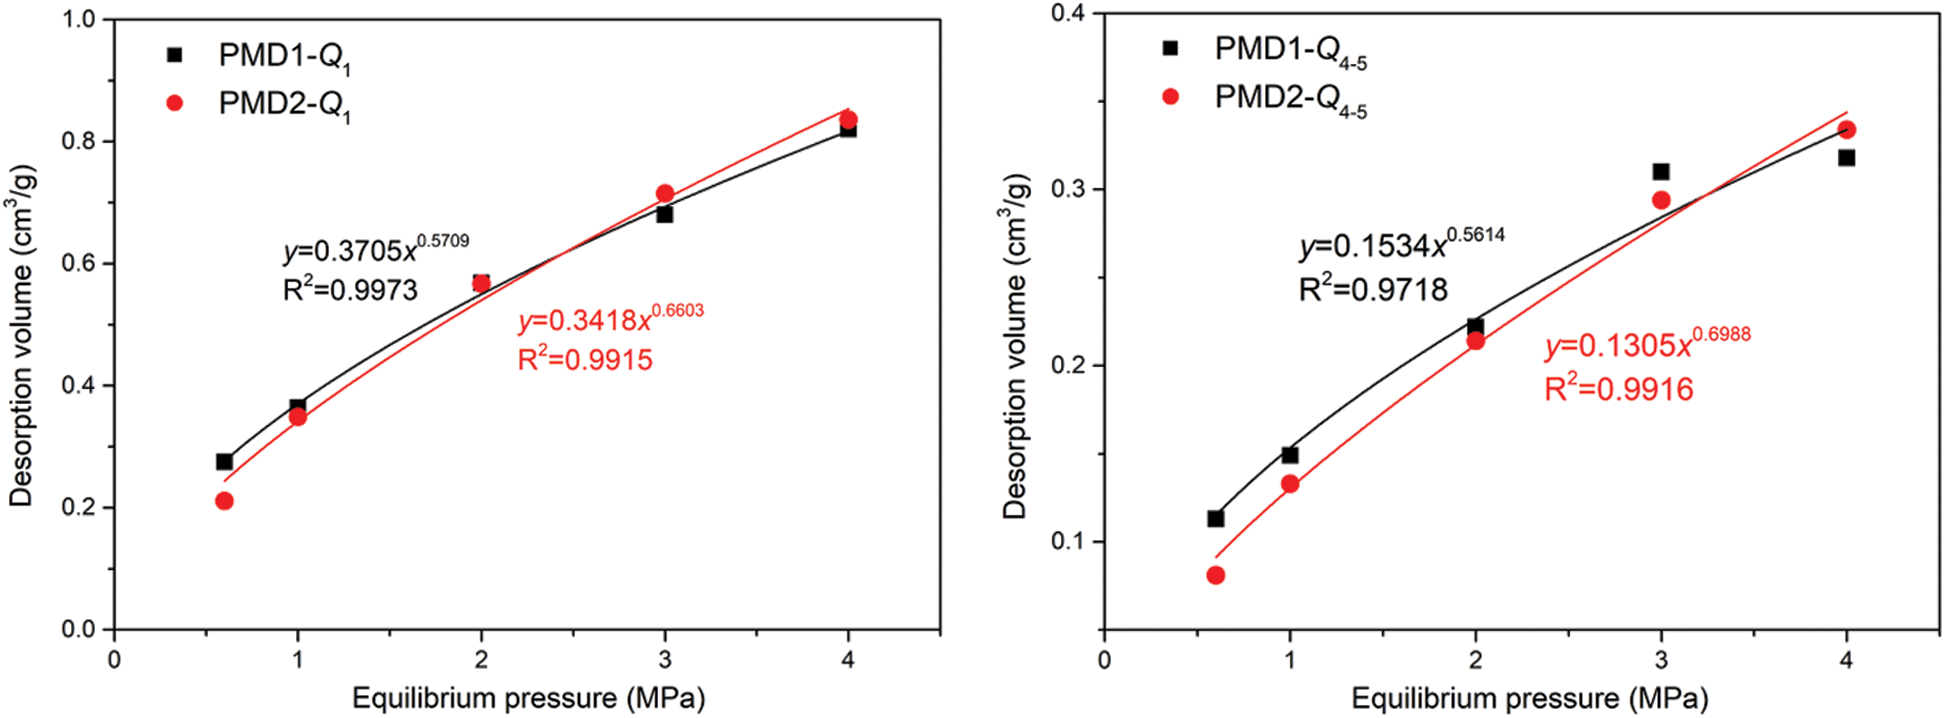
Figure 3: Fitting relationship between initial desorption characteristics (Q1 and Q4–5) and equilibrium pressure
The simulation results of Q1 and Q4–5 of coal samples are analyzed comprehensively, and the variation between them and gas pressure is similar to that of K1 and ∆h2 in Section 3.2. The analysis of desorption law for the first minute (Q1) and the 4th to 5th min (Q4–5) is used to check the pressure variations on K1 and ∆h2. The power functions can also well show the relationship between initial desorption characteristics and equilibrium pressure, and the average correlation coefficient R2 is 0.988, which is consistent with the research results of other scholars [14,19].
3.4 Comparative Analysis of Measured and Calculated Value of Q1 and Q4–5
K1 and ∆h2 characterize the gas desorption characteristics of coal samples. Previous experiments showed that K1 and ∆h2 are closely related to coal seam gas pressure, gas desorption rate, gas content, etc. The indexes (K1 and ∆h2) have a functional relationship with the gas pressure and content and reflect the magnitude of the outburst danger ahead of the working face. Therefore, the values of K1 and ∆h2 were obtained by simulation tests in the laboratory due to their close relation with the initial desorption of gas. Then, the obtained values were used to calculate Q1 and Q4–5 of coal samples.
where, Q1 represents the calculated value of desorption amount in the first 1 min, cm3/g; t is the desorption time, 1 min.
where, Q4–5 represents the calculated value of cumulative desorption amount from the 4th to 5th min, cm3/g; 0.0083 is constant of MD-2 instrument [14,19]; 10 is the weight of coal sample. Eq. (2) and Eq. (3) were used to calculate Q1 and Q4–5, and the results are displayed in Tab. 4.
Table 4: Comparison between the measured and the calculated value of Q1 and Q4–5 based on K1 and ∆h2
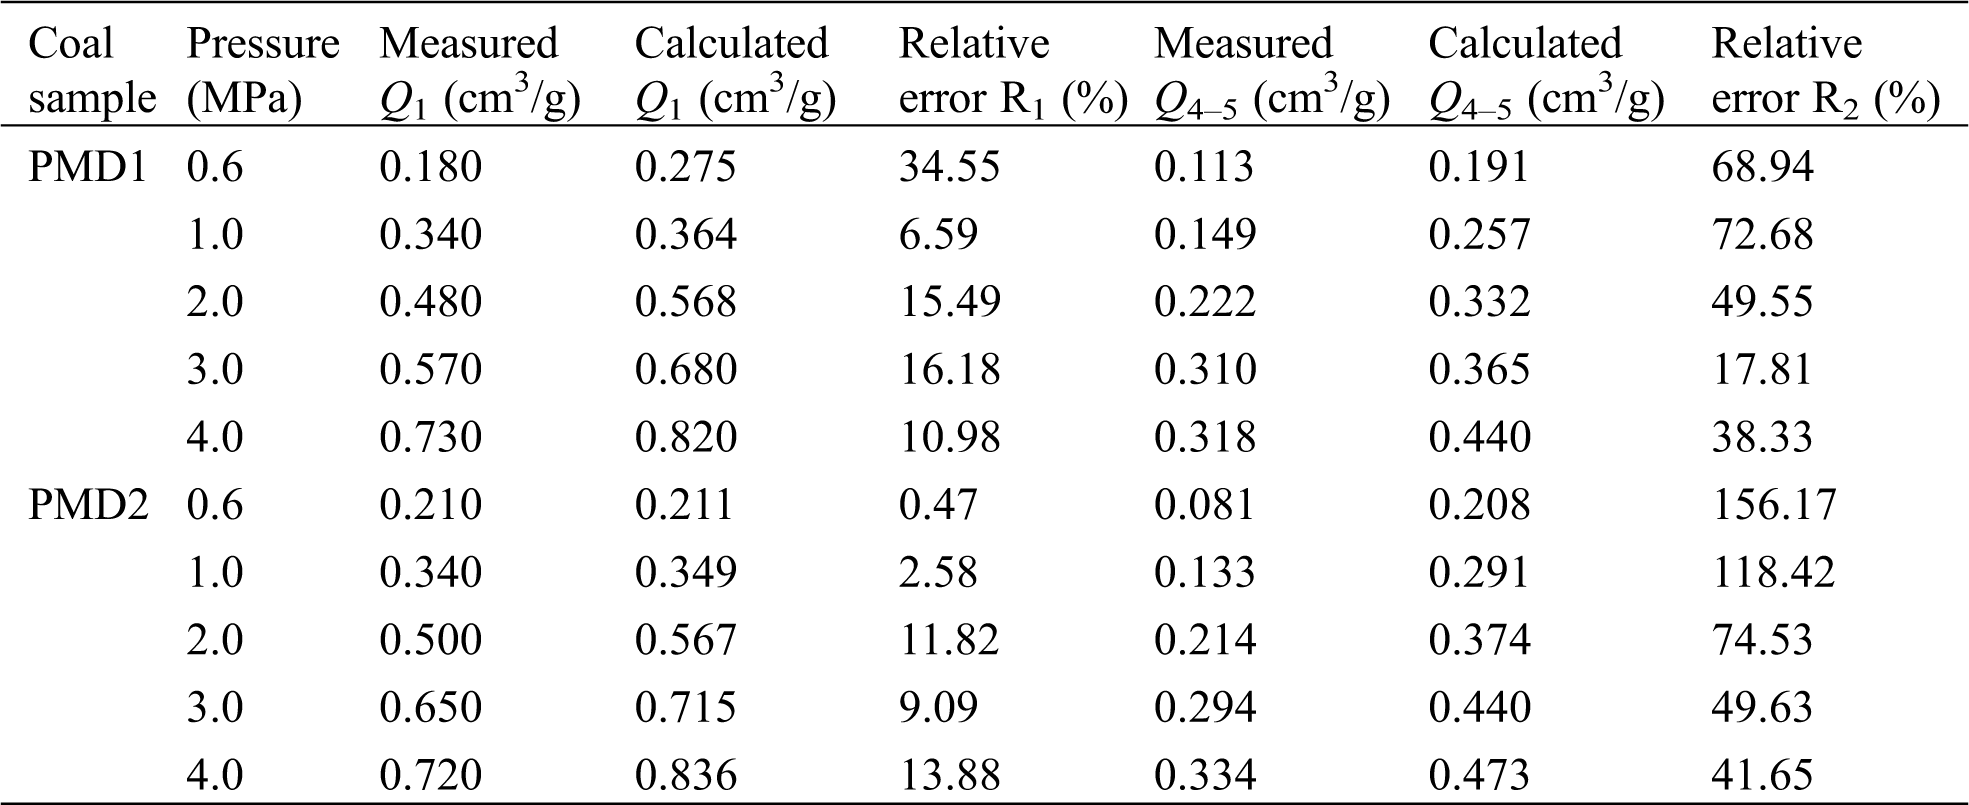
By comparing the relative error between the measured value and the calculated value of Q1 and Q4–5 in Fig. 4, it can be found that the error of K1 value is smaller (0.47%–34.55%), the error of ∆h2 value is large (17.81%–156.17%), and the average relative error of K1 and ∆h2 values are 17.51% and 86.99%. It indicates that the actual calculated value of desorption amount in the first 1 min has a small difference. Therefore, it can be found that index ∆h2 cannot accurately describe the gas desorption characteristics of coal samples in the 4th and 5th min, while index K1 can accurately reflect the gas desorption characteristics of coal samples in the first 1 min, which means that the critical value of K1 is a more reliable index to predict the risk of coal and gas outburst for the No. 16 coal seam of Pingmei No. 12 coal mine.
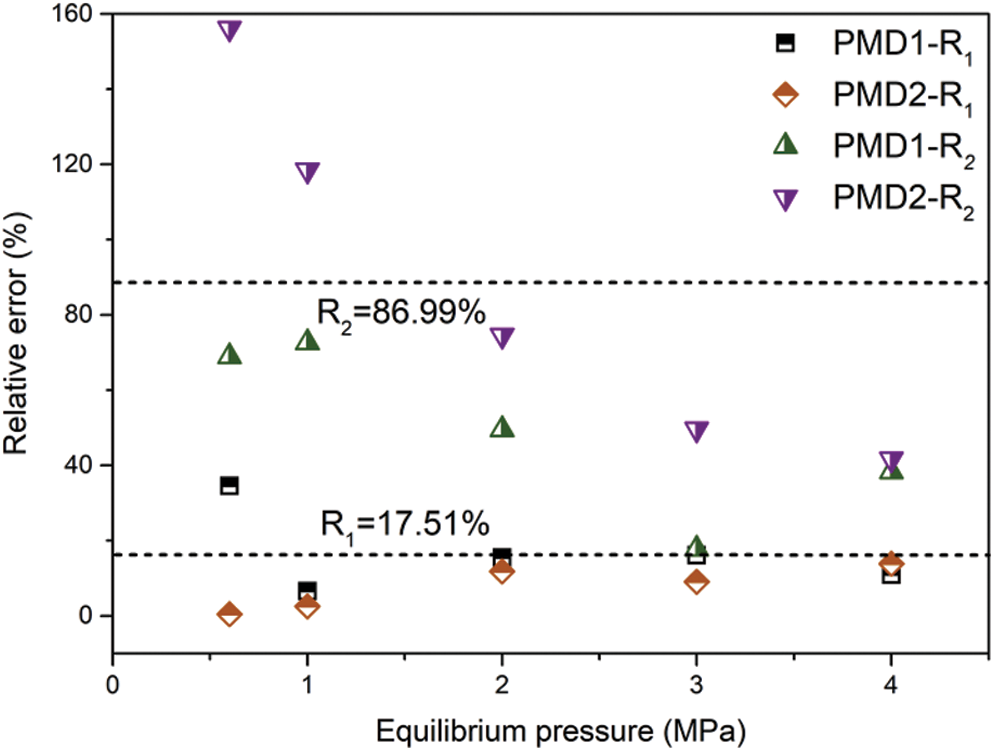
Figure 4: Relative error between the measured value and the calculated value of Q1 and Q4–5
In this study, desorption indexes of drill cuttings (K1 and ∆h2) under different methane adsorption equilibrium pressures (0.6, 1.0, 2.0, 3.0, and 4.0 MPa) were studied. Additionally, the initial desorption amount in the first 1 min (Q1), and 4th to 5th min (Q4–5) of coal samples were theoretically obtained and analyzed. Finally, tests were performed between the measured value and the calculated value of Q1 and Q4–5 to judge whether K1 and ∆h2 can correctly characterize the risk of coal and gas outbursts. The conclusions can be summarized as follows:
(1) The relationships between methane desorption volume and both time and gas pressure are approximately parabolic and positive. At the initial moment, the gas desorption speed is large, and then the speed decays rapidly. The proportions of Q1 and Q10 to Q120 are 15.14%–18.09% and 43.92%–48.55% respectively for PMD1, and 15.72%–18.17% and 41.87%–52.25% respectively for PMD2.
(2) Q1 and Q4–5 are closely related to K1 and ∆h2. There are positive power function relationships between those indexes (Q1, Q4–5, K1, and ∆h2) and equilibrium pressure.
(3) The average relative error between the measured value and the calculated value of Q1 based on K1 is 17.51%, and the average relative error of Q4–5 based on ∆h2 is 86.99%, which indicates that K1 is a more reliable index to be the critical value to predict coal and gas outburst for the No. 16 coal seam of Pingmei No. 12 coal mine.
Acknowledgement: The authors sincerely thank the assistance of Chenghao Wang for the translation of the article.
Funding Statement: The authors are grateful to for the financial support from the National Natural Science Foundation of China (No. 51874294, 52034008).
Conflicts of Interest: The authors declare that they have no known competing financial interests or personal relationships that could have appeared to influence the work reported in this paper.
1. Jin, K., Cheng, Y., Ren, T., Zhao, W., Tu, Q. et al. (2018). Experimental investigation on the formation and transport mechanism of outburst coal-gas flow: Implications for the role of gas desorption in the development stage of outburst. International Journal of Coal Geology, 194, 45–58. DOI 10.1016/j.coal.2018.05.012. [Google Scholar] [CrossRef]
2. Li, Z., Wang, F., Shu, C., Wen, H., Wei, G. et al. (2020). Damage effects on coal mechanical properties and micro-scale structures during liquid CO2-ECBM process. Journal of Natural Gas Science and Engineering, 83, 103579. DOI 10.1016/j.jngse.2020.103579. [Google Scholar] [CrossRef]
3. Fisne, A., Esen, O. (2014). Coal and gas outburst hazard in Zonguldak Coal Basin of Turkey, and association with geological parameters. Natural Hazards, 74(3), 1363–1390. DOI 10.1007/s11069-014-1246-9. [Google Scholar] [CrossRef]
4. Wang, C., Zang, Y., Wang, L., Chen, Z., Cui, G. et al. (2019). Interaction of cleat-matrix on coal permeability from experimental observations and numerical analysis. Geofluids, 2019, 1–15. DOI 10.1155/2019/7474587. [Google Scholar] [CrossRef]
5. Zhai, C., Xiang, X., Xu, J., Wu, S. (2016). The characteristics and main influencing factors affecting coal and gas outbursts in Chinese Pingdingshan mining region. Natural Hazards, 82(1), 507–530. DOI 10.1007/s11069-016-2195-2. [Google Scholar] [CrossRef]
6. Fan, C., Li, S., Luo, M., Du, W., Yang, Z. (2017). Coal and gas outburst dynamic system. International Journal of Mining Science and Technology, 27(1), 49–55. DOI 10.1016/j.ijmst.2016.11.003. [Google Scholar] [CrossRef]
7. Liu, M. J., Mitri, H., Wei, J. (2008). In Recent trends of coal and gas outburst accidents in China. Proceedings of the 27th International Conference on Ground Control in Mining, pp. 29–31. West Virginia: WV University. [Google Scholar]
8. Cheng, Y., Pan, Z. (2020). Reservoir properties of Chinese tectonic coal: A review. Fuel, 260, 116350. DOI 10.1016/j.fuel.2019.116350. [Google Scholar] [CrossRef]
9. Yan, F., Xu, J., Lin, B., Peng, S., Zou, Q. et al. (2019). Changes in pore structure and permeability of anthracite coal before and after high-voltage electrical pulses treatment. Powder Technology, 343, 560–567. DOI 10.1016/j.powtec.2018.11.083. [Google Scholar] [CrossRef]
10. Yu, B., Su, C., Wang, D. (2015). Study of the features of outburst caused by rock cross-cut coal uncovering and the law of gas dilatation energy release. International Journal of Mining Science and Technology, 25(3), 453–458. DOI 10.1016/j.ijmst.2015.03.020. [Google Scholar] [CrossRef]
11. Toraño, J., Torno, S., Alvarez, E., Riesgo, P. (2012). Application of outburst risk indices in the underground coal mines by sublevel caving. International Journal of Rock Mechanics and Mining Sciences, 50, 94–101. DOI 10.1016/j.ijrmms.2012.01.005. [Google Scholar] [CrossRef]
12. Tu, Q., Cheng, Y., Guo, P., Jiang, J., Wang, L. et al. (2016). Experimental study of coal and gas outbursts related to gas-enriched areas. Rock Mechanics and Rock Engineering, 49(9), 3769–3781. DOI 10.1007/s00603-016-0980-6. [Google Scholar] [CrossRef]
13. Li, Z., Wei, G., Liang, R., Shi, P., Wen, H. et al. (2021). LCO2-ECBM technology for preventing coal and gas outburst: Integrated effect of permeability improvement and gas displacement. Fuel, 285, 119219. DOI 10.1016/j.fuel.2020.119219. [Google Scholar] [CrossRef]
14. Chen, E., Wang, L., Cheng, Y., Guo, H., Liu, F. (2017). Pulverization characteristics of coal affected by magmatic intrusion and analysis of the abnormal gas desorption index on drill cuttings. Adsorption Science & Technology, 36(1-2), 805–829. DOI 10.1177/0263617417724276. [Google Scholar] [CrossRef]
15. Yang, W., Lin, B., Zhai, C., Li, X., An, S. (2012). How in situ stresses and the driving cycle footage affect the gas outburst risk of driving coal mine roadway. Tunnelling and Underground Space Technology incorporating Trenchless Technology Research, 31, 139–148. DOI 10.1016/j.tust.2012.04.015. [Google Scholar] [CrossRef]
16. Li, H., Tian, L., Huang, B., Lu, J., Shi, S. et al. (2020). Experimental study on coal damage subjected to microwave heating. Rock Mechanics and Rock Engineering, 53(12), 5631–5640. DOI 10.1007/s00603-020-02230-z. [Google Scholar] [CrossRef]
17. Gui, X., Xu, Y., Meng, X., Yu, Z. (2009). Application of the value of drilling cuttings weight and desorption index for drill cuttings to preventing coal and gas outburst. Journal of University of Science and Technology Beijing, 31(3), 285–289. [Google Scholar]
18. Tan, Z., Cheng, W., Niu, J., Zhang, X., Wang, Q. (2006). Determinating methane pressure in coal seam application with the method of desorption of drill-cuttings. Journal of North China Institute of Science and Technology, 3(1), 17–19. [Google Scholar]
19. Cheng, L., Wang, L., Cheng, Y., Jin, K., Zhao, W. et al. (2016). Gas desorption index of drill cuttings affected by magmatic sills for predicting outbursts in coal seams. Arabian Journal of Geosciences, 9(1), 83. DOI 10.1007/s12517-015-2133-8. [Google Scholar] [CrossRef]
20. An, F., Cheng, Y., Wu, D., Wang, L. (2013). The effect of small micropores on methane adsorption of coals from Northern China. Adsorption, 19(1), 83–90. DOI 10.1007/s10450-012-9421-3. [Google Scholar] [CrossRef]
21. Hu, B., Cheng, Y., He, X., Wang, Z., Jiang, Z. et al. (2020). New insights into the CH4 adsorption capacity of coal based on microscopic pore properties. Fuel, 262, 116675. DOI 10.1016/j.fuel.2019.116675. [Google Scholar] [CrossRef]
22. Yang, Y., Liu, S., Zhao, W., Wang, L. (2019). Intrinsic relationship between Langmuir sorption volume and pressure for coal: Experimental and thermodynamic modeling study. Fuel, 241, 105–117. DOI 10.1016/j.fuel.2018.12.008. [Google Scholar] [CrossRef]
23. Hu, B., Cheng, Y., He, X., Wang, Z., Jiang, Z. et al. (2020). Effects of equilibrium time and adsorption models on the characterization of coal pore structures based on statistical analysis of adsorption equilibrium and disequilibrium data. Fuel, 281, 118770. DOI 10.1016/j.fuel.2020.118770. [Google Scholar] [CrossRef]
24. Wang, Z., Cheng, Y., Zhang, K., Hao, C., Wang, L. et al. (2018). Characteristics of microscopic pore structure and fractal dimension of bituminous coal by cyclic gas adsorption/desorption: An experimental study. Fuel, 232, 495–505. DOI 10.1016/j.fuel.2018.06.004. [Google Scholar] [CrossRef]
 | This work is licensed under a Creative Commons Attribution 4.0 International License, which permits unrestricted use, distribution, and reproduction in any medium, provided the original work is properly cited. |