| Energy Engineering |
DOI: 10.32604/EE.2021.014590
ARTICLE
Energy and Cost Analysis of Processing Flat Plate Solar Collectors
1Sustainable and Renewable Energy Engineering Department, University of Sharjah, Sharjah, United Arab Emirates
2Mechanical Engineering Department, Aalto University, Espoo, Finland
3Mechanical and Nuclear Energy Engineering Department, University of Sharjah, Sharjah, United Arab Emirates
4Electrical Engineering Department, University of Sharjah, Sharjah, United Arab Emirates
*Corresponding Author: Mamdouh El Haj Assad. Email: massad@sharjah.ac.ae
Received: 10 October 2020; Accepted: 19 November 2020
Abstract: In this work, a life cycle analysis is accomplished for flat plate solar collectors. The purpose of this investigation is to predict the energy consumption during the manufacturing processes that results in carbon dioxide emissions. Energy consumption and system efficiency enhancement will be studied and predicted. CES EduPack software is used to perform the analysis of the currently commercial system, and the suggested changes are implemented to increase the efficiency and make the comparison. Even though cost analysis is done, the priority of selection is given to the most energy conserving and environmentally friendly alternative. However, if the compared alternatives result in the same energy consumption and CO2 emissions, the cost analysis would be a better approach. It can be stated that flat plate solar collectors are sustainable and renewable energy systems that do not produce CO2 emissions during their active usage, but the manufacturing processes they undergo during the design contribute to the greenhouse gasses emission.
Keywords: Life cycle; solar collector; renewable energy; solar thermal; CO2 emission; economic analysis
As world energy consumption is dramatically increasing and the scarcity of the existing energy sources are happening simultaneously in a problem known as supply/demand problem [1,2]. Renewable energy sources are considered as a satisfying alternative to increase the energy supply rate and compensate for the continuous decreasing of fossil fuels and different old energy generation systems with low greenhouse gas emissions [3,4]. Ellabban [5] defined renewable energy as an energy that is provided by natural sources such as sunlight, wind, rain, tides, waves, and geothermal heat. Accordingly, renewable energy systems cannot only solve the existing scarcity of energy problem but it offers a permanent solution to the problem which defines why renewable energy sources are named sustainable energy systems as well. Renewable Energy and Efficiency Partnership (REFP) defines a sustainable energy system as an energy system that serves the needs of the present without affecting the energy sources that are need for future generations. Moreover, renewable energy systems are all clean energy generation systems while they are in use, they are not accompanied with carbon dioxide or any other chlorofluorocarbon emissions and the usage of such systems may play a vital role in decreasing pollution and CO2 generation rates and accordingly reduce global warming another issue that cannot be solved using existing sources [6,7]. Environmental Protection Agency (EPA) [8] estimated that 10% of the energy used in the U.S. were used for water heating and cooling purposes and accordingly they contributed in 10% of the overall CO2 emissions. However, a flat plate collector that converts incident sunlight to heat can offer a more environment friendly alternative to the usage of electric or fuel heaters. It might have a lower efficiency but as long as the input energy is free it can compete with other heat exchangers.
However, the judgment that Sustainable and Renewable Energy systems (RESs) systems do not produce any pollution is not technically true. In fact the processes that RESs undergo before and after their usage and even during their lifetime contribute in pollutants emission [9]. Life cycle assessment (LCA) which is defined as a technique to assess environmental impacts associated with all the stages of a product’s life from cradle to grave (i.e., from raw material extraction through materials processing, manufacture, distribution, use, repair and maintenance, and disposal or recycling) [10]. The five main processes are material extraction, manufacture, transportation, maintenance and recycle or disposal shows that a RES emits CO2 and other pollutants even though it is using a clean source usually the sun [11]. Life cycle analysis is a great procedure where you can determine which process of overall system design that consumes more energy and produces more CO2 by knowing the details about each process designers and researchers can know where to put their effort in order to decrease energy usage and pollutants production which results in a higher system efficiency and less harm to the environment [12]. Sustainable facilities tool (SFtool) defines the scope of LCA is used to compare the full range of environmental effects assignable to products and services by quantifying all inputs and outputs of material flows and assessing how these material flows affect the environment. There are two main categories of LCA which are (a) Attributional LCAs establish the burdens associated with the production and use of a product at a point in time (typically the recent past) and (b) Consequential LCAs identify the environmental consequences of a decision or a proposed change in a system under study (oriented to the future), which means that market and economic implications of a decision may have to be taken into account. LCA is widely used in industrial analysis according to a survey done by Cooper et al. [12]. LCA is generally used to support business strategy (18%) and Research and Development (18%), in addition, it is used as input in process design (15%), in education (13%) and for labeling or product declarations (11%) [11]. So far, many studies have been presented to analyze the life cycle of solar collectors. Kumar et al. [13] investigated the life cycle cost of single slope hybrid (PV/T) active solar still. This work estimated the paybackperiod of active and passive solar still-PV/T in the range of 3.3 to 23.9 years and 1.1 to 6.2 years, respectively. Araya et al. [14] analyzed the life cycle saving for a flat-plate solar water collector in Chile. The study presented the analysis of LCA flat plate solar water collector using genetic algorithms (GAs) to optimize the solar collector area and the volume of water storage tank that result in the maximum life-cycle savings. The results showed that the consumption of water and water temperature had a great influence flat plate solar water collector. Ozturk et al. [15] developed a thermodynamic and life cycle assessment of flat-plate, photovoltaic and photovoltaic thermal collector, where they proposed an energy and exergy analysis along with LCA for these collectors. The results of their study showed that the energy and CO2 payback time for these three collectors types were 2, 12, 3.8 and 1.6, 3.6 and 1.8 years, respectively. All these mentioned studies, anaylzed the life cycle analysis when the solar collector is in use with energy storage systems, which make them different from out work.
In this work, the LCA for the current properties of solar flat plate collectors is considered to investigate and then a consequential LCA is done for a proposed change in the current system that enhances the system efficiency. The main objective of this work is to investigate which parts of the flat plate solar collector system materials consume more energy and produces more greenhouse gases during their manufacturing phase.
The materials properties and environmental output/input data, which are needed in this work, can be easily accessed in the CES EduPack software database. Transportation is another important aspect in the analysis of this work. Factories that produce and manufacture each one of the materials needed in constructing the flat plate solar collector (Fig. 1) are chosen. Though, going through these factories will be done under the assumption that they produce raw materials and manufacture them in a non complicated manufacturing process. The flat plate solar collector is a static device which means only low maintenance is needed and only a yearly checkup cycle is done. The maintenance might include removal of any corrosion that might take place over time as well as the inspection of the activity of the device itself.
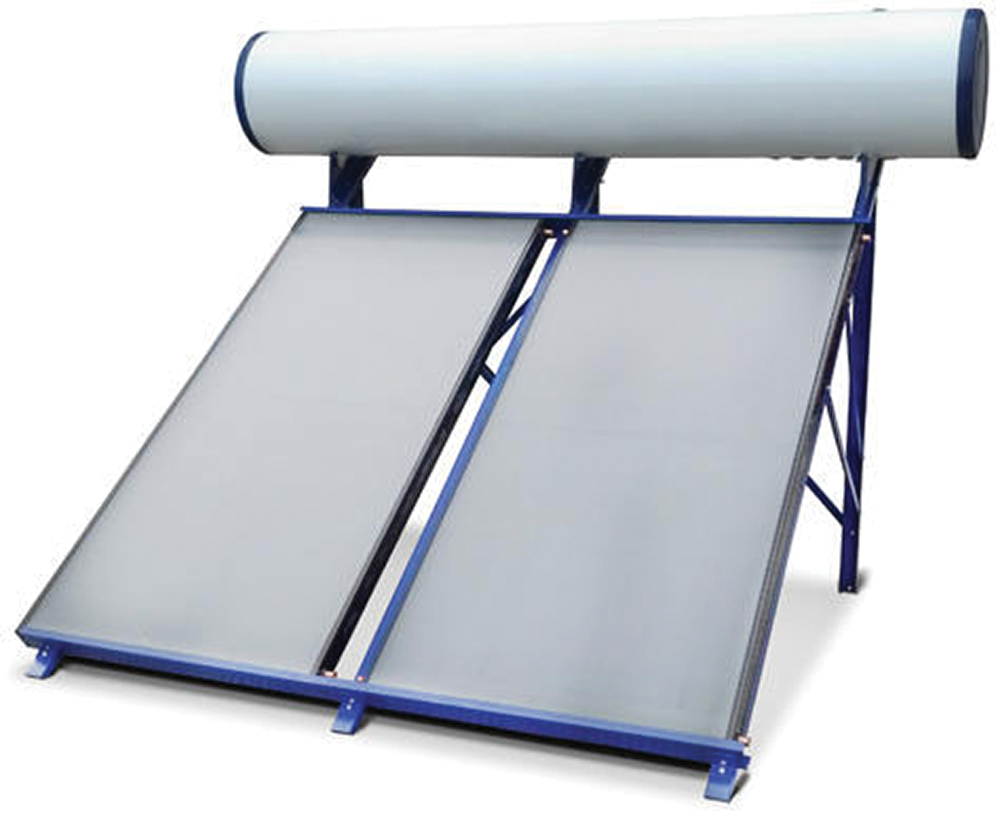
Figure 1: Solar flat plate collector
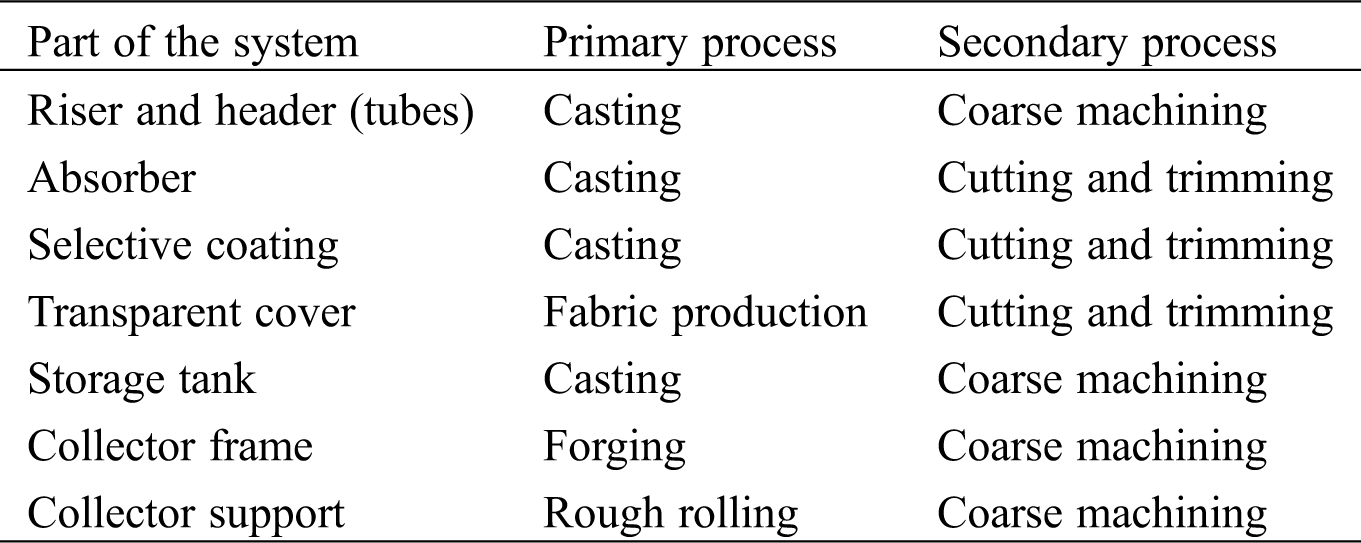
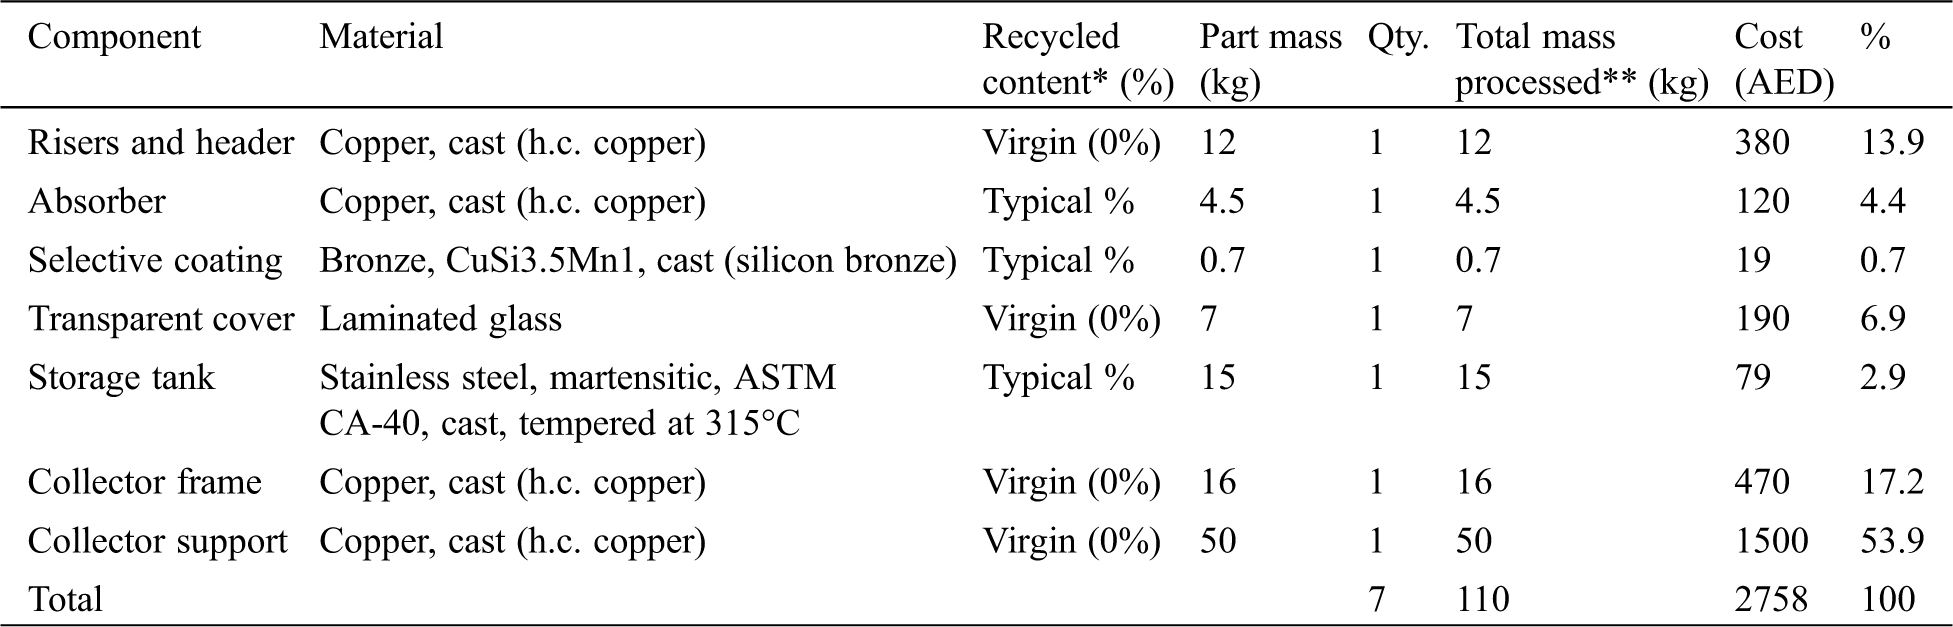
A life cycle analysis is done by using the CES EduPack software which includes all the information needed. It includes how much energy is used, the CO2 emissions and also the cost for each process of designing the device. Each process that consumes highest amount of energy and results in toxic gasses emissions will be investigated. After that, alternatives will be suggested and will be compared with the commercial materials that are used, and based on that select the best option. The alternatives will be advised in a way that they lower the energy use and the CO2 emissions without any alteration in the system overall efficiency or, what would be ideal, increasing it. Tab. 1 summarizes various materials that are used in the production process of different part of solar collector. In addition, the production method for each segment of the solar collector is presented in Tab. 2.
Table 1: Different parts of the solar collector accompanied with corresponding materials
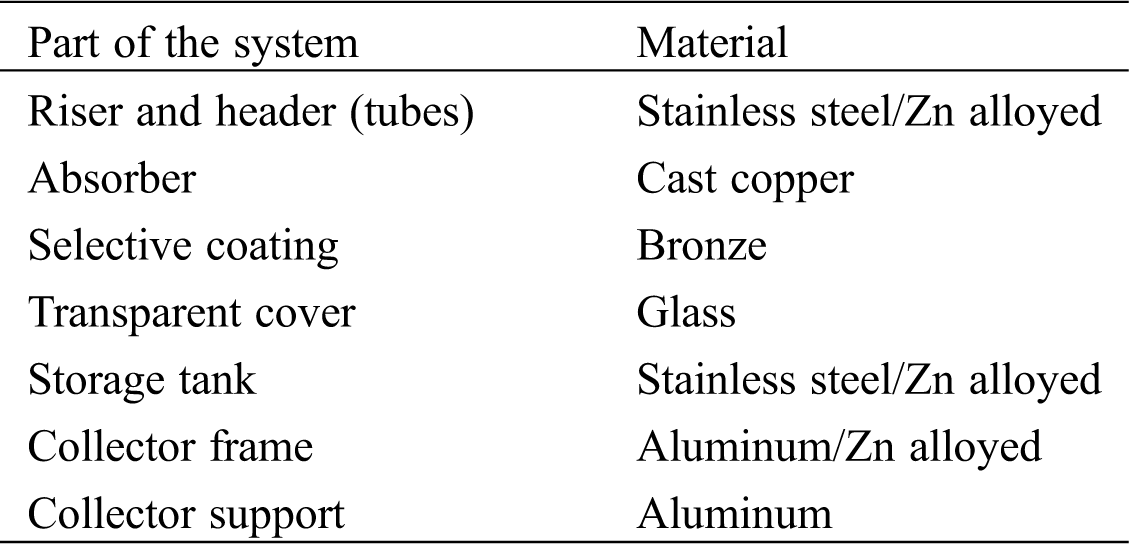
Table 2: Production method for each part of the solar collector
It is noteworthy to mention that the maintenance of the solar collector is considered to be 3 hours per year (only for cleaning & electroplating the frames, which include repair, inspection and planned preventive maintenance.
The LCA of the solar collectors was analyzed using the CES EduPack software, employing the mentioned above materials. The following assumptions are taken into account:
1. All Zn alloyed materials were considered of high corrosion resistance for this reason a high Zn percentage material have been chosen. Accordingly, no electroplating (galvanizing) is needed. Except for the collector frame which has to be both Zn alloyed and galvanized.
2. The back-insulation material (melamine foam) will be neglected from analysis since it has to be shipped from factory in china. However, this assumption is accepted in our case because the mass fraction of the foam is (1/200) kg/kg (kg of foam per kg of solar collector). Note that for commercial projects, it has to be implemented in the life cycle analysis.
3. The maintenance power rating was assumed to be 1000 W which is as low as power consumed by 10 electric bulbs because the system consists of static parts which dramatically decrease failure probabilities.
The energy consumption versus designing process bar chart below (Fig. 2) which cosnists of materials extraction, manufacturing, transporation, materials use, material disposal and end of life (EoL). The figure clearly states that raw materials production was the dominating process regarding energy consumption and accordingly CO2 emission (Fig. 3) when it is compared to other processes of overall design. Figs. 2 and 3 show that the distributions of energy consumption and CO2 emission have the same trend which can be explained by the fact the more energy onsumed results in more CO2, hence they are directly proportional to each other. Fig. 2 shows that the most of energy is consumed during the preparation of the materials for PV and then followed by the manufacturing process required for the solar collector. Fig. 3 shows the distribution of CO2 emission, which shows the highest amount of CO2 emission also occurs the preparation of the materials for the solar collectors.
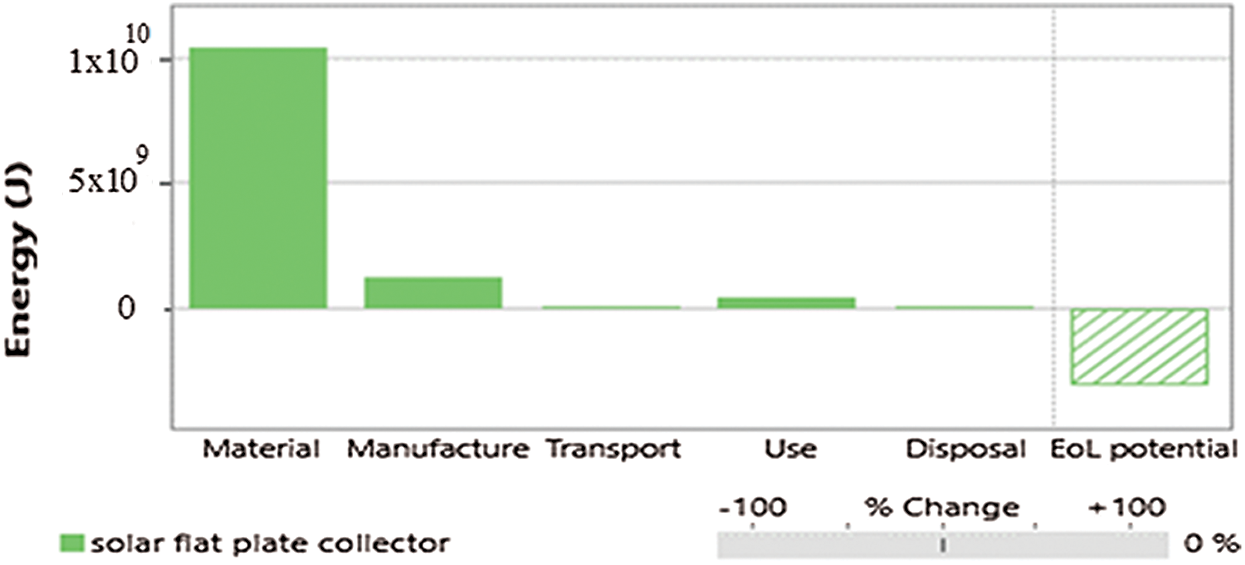
Figure 2: Energy consumption
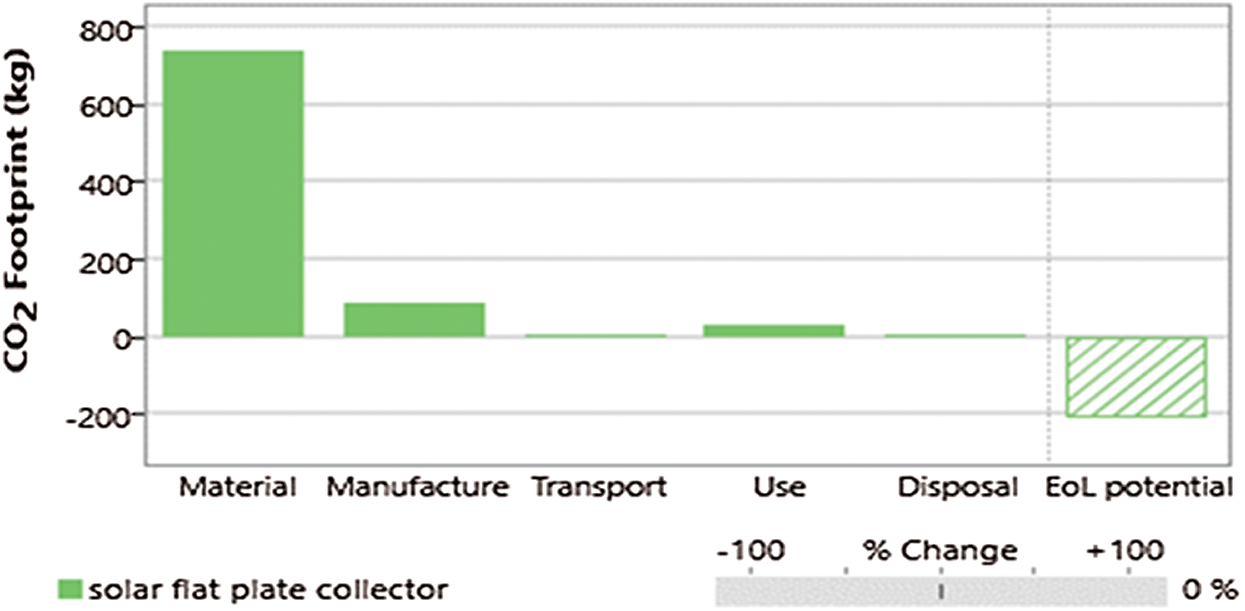
Figure 3: CO2 emission
To investigate which parts of the flat plate solar collector during materials production, consume more energy and produces more CO2, a detailed report from the software was extracted (Tabs. 3 and 4).
Table 3: Energy consumption details for material production process in different part of the solar collector
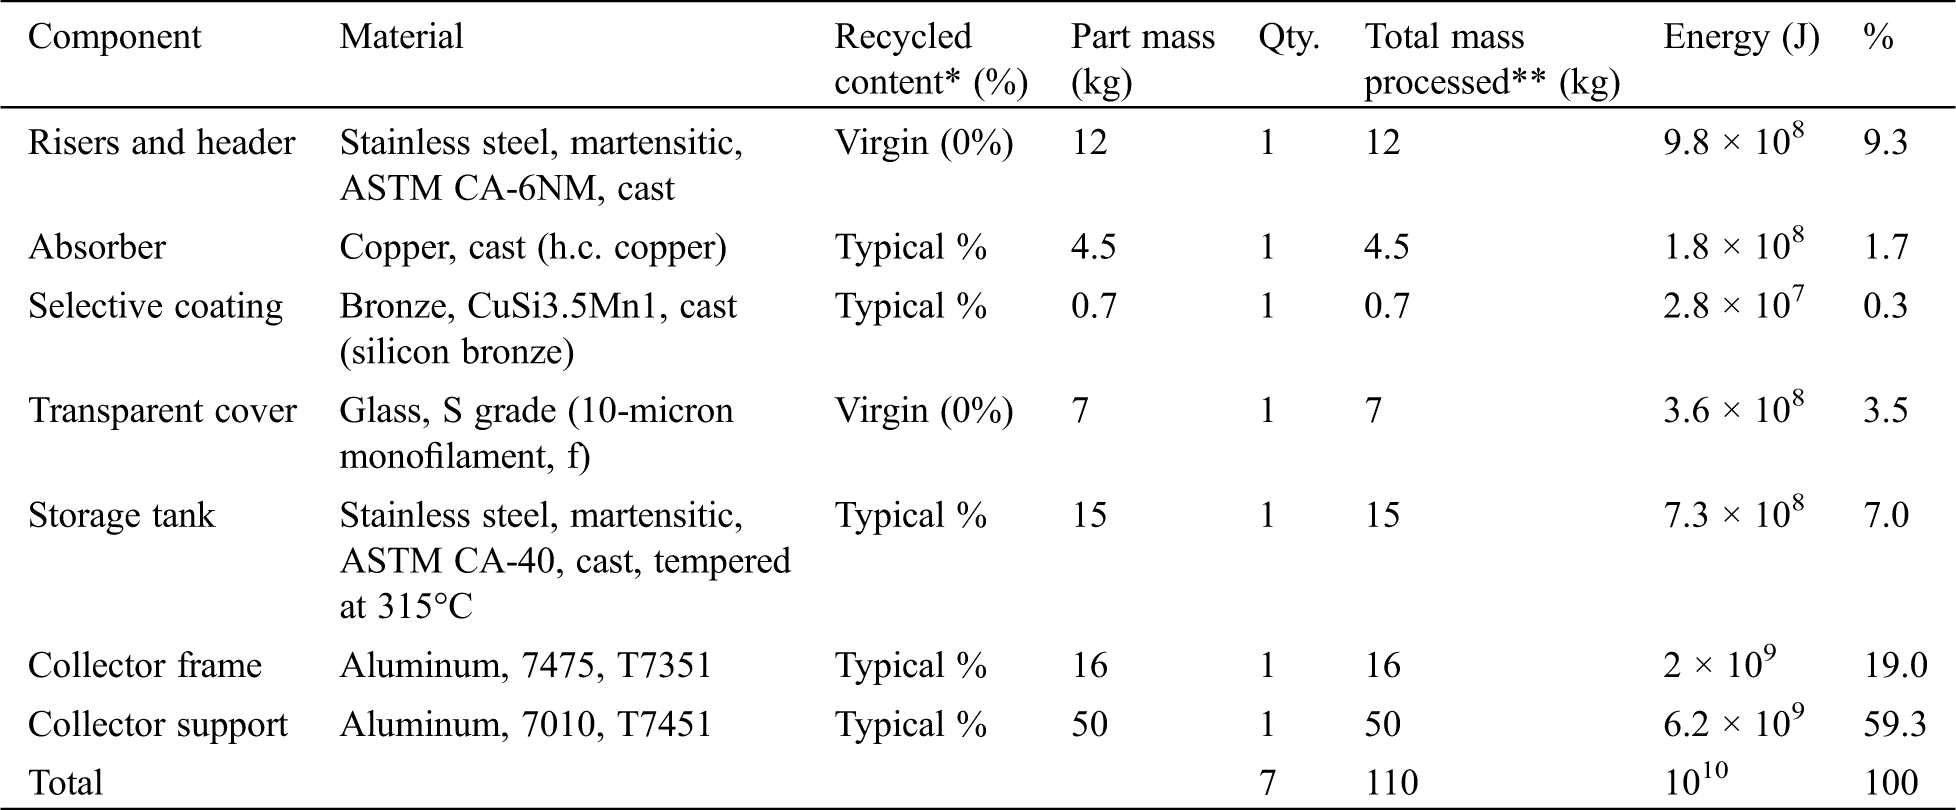
Table 4: CO2 emision for the production process
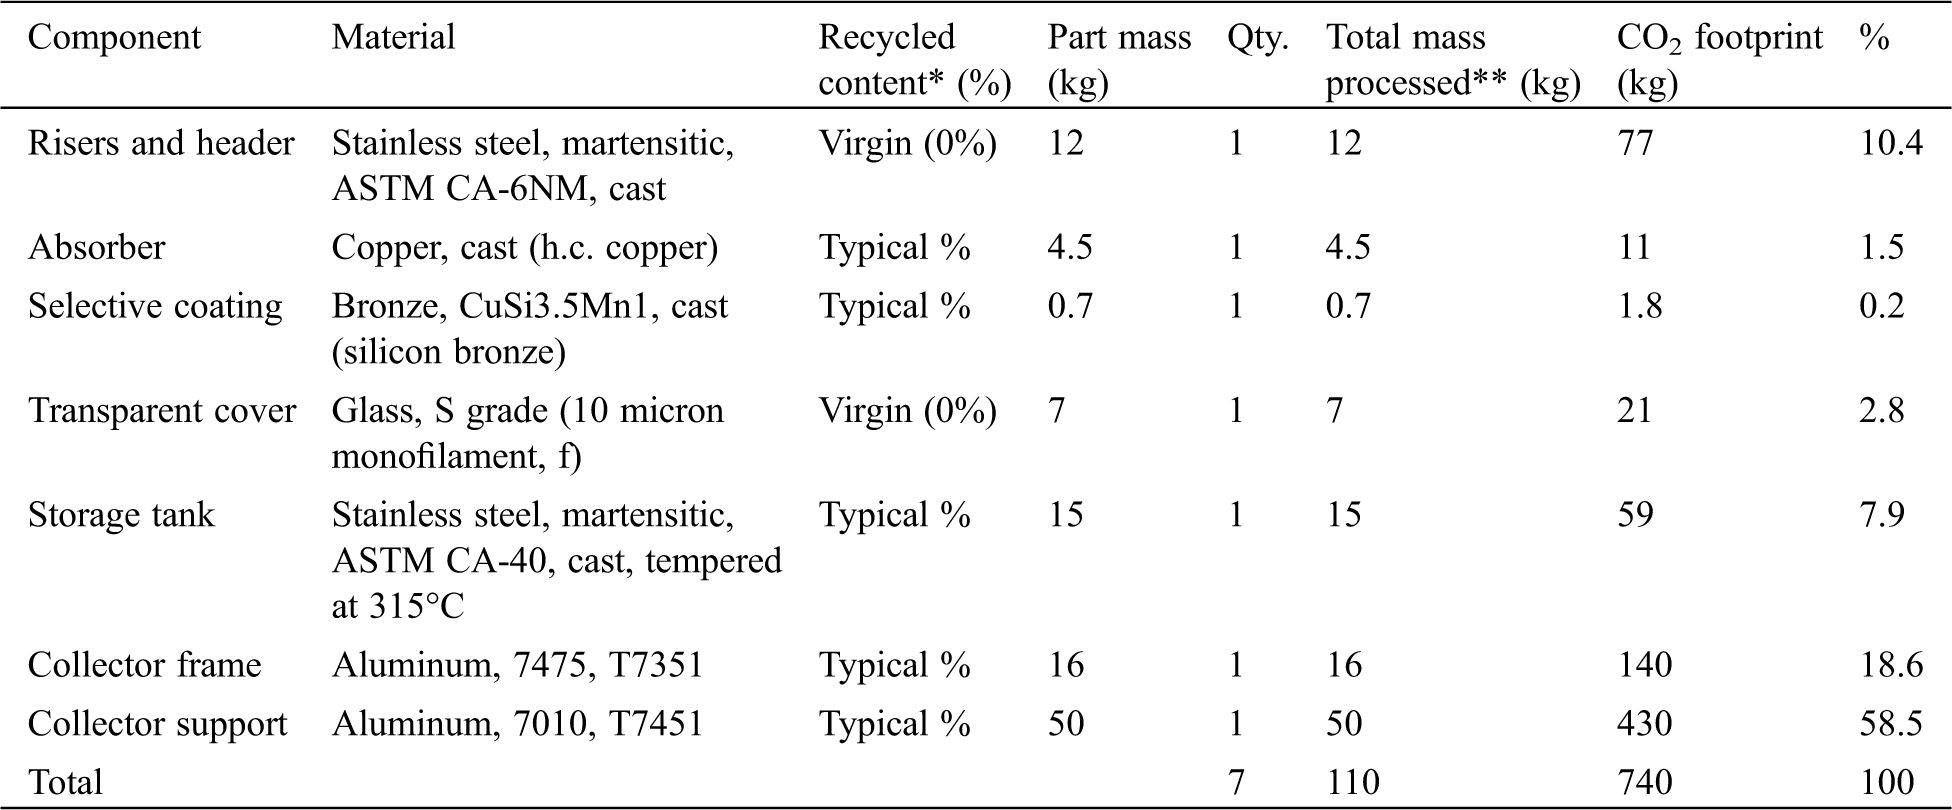
Tabs. 3 and 4 clearly show that collector support and collector frame consume most of the energy for production of their materials and most of CO2 emissions 59% and 19% respectively. Those values were predicted since aluminium has a relatively high embodied energy in the range 181–202 MJ per kg of materials and the collector support and frame have a high mass fractions of 0.55 and 0.38, respectively. This fraction is defined as the mass of the component devided by the total mass of the solar collector. In order to decrease the energy consumed by those parts and decrease CO2 emission, another type of material has to be used however there are some restrictions to change those materials which are:
1. Since the two parts are used to carry functional parts weight, the new material must have a high young modulus and share close mechanical properties with aluminium.
2. The density of the new materials must be close to aluminium density in order to maintain the volume of those parts.
Zn alloyed Stainless steel was suggested as a good alternative for the two parts. Tab. 5 below compares the mechanical properties of the two materials.
Table 5: Mechanical properties comparison of aluminium and stainless steel
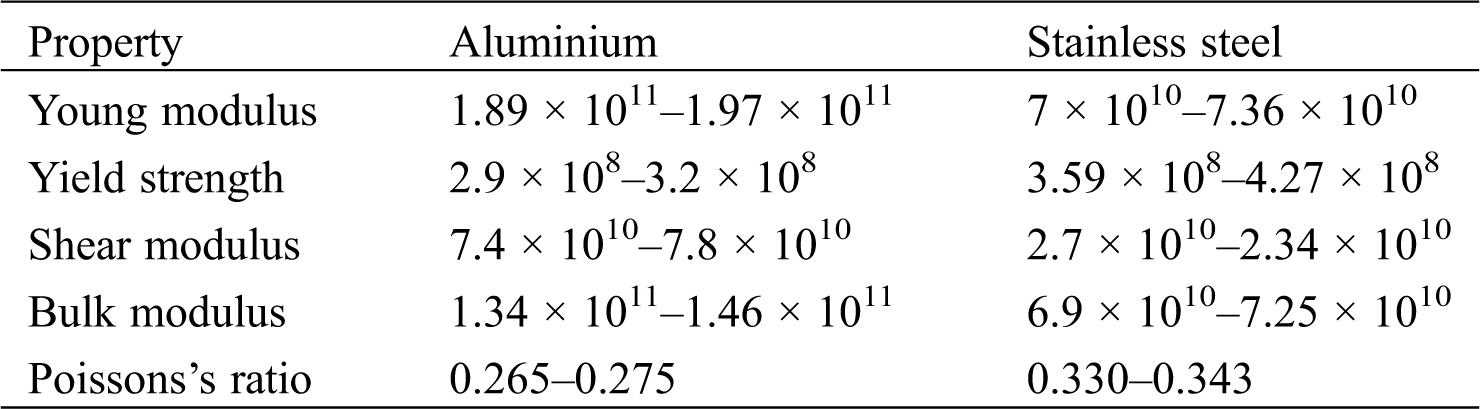
From the comparison we can see that stainless steel is a good alternative for aluminium because most of the mechanical properties of them are close.
Another suggested changes were to use copper for the risers and header (tubes) instead of stainless steel since copper has a lower embodied energy and more thermal conductivity, also laminated glass were suggested to replace fibre glass transparent cover to lower embodied energy. After these changes have been made, energy consumption by materials production was drastically decreased and also CO2 footprint. They are dropped approximately by 40% (Figs. 4 and 5).
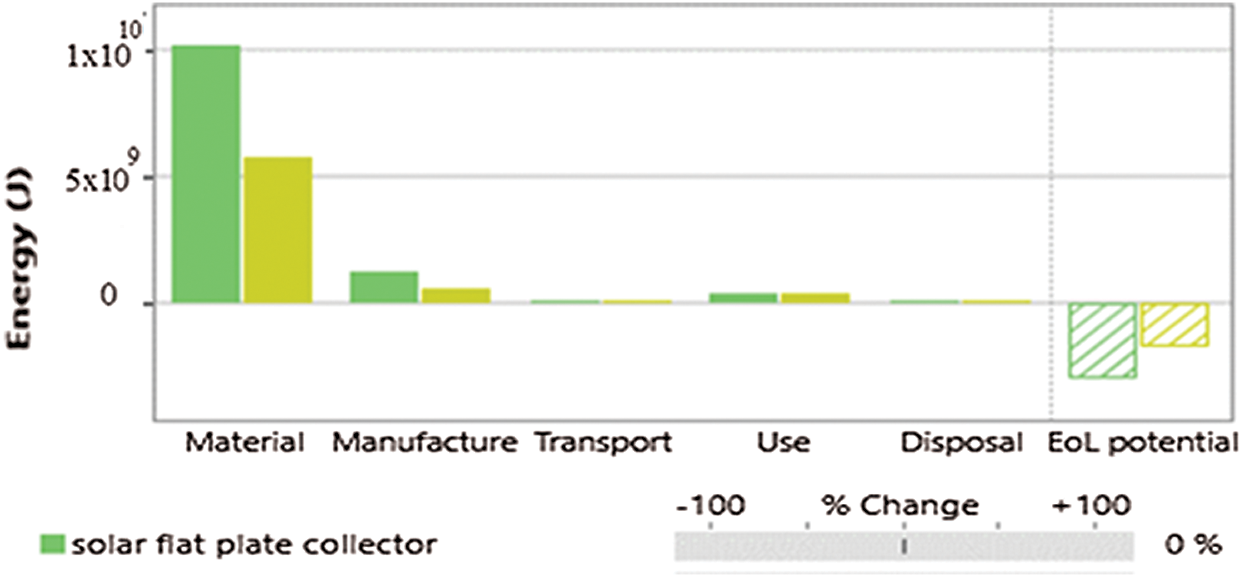
Figure 4: Comparison of energy consumption between the two scenarios
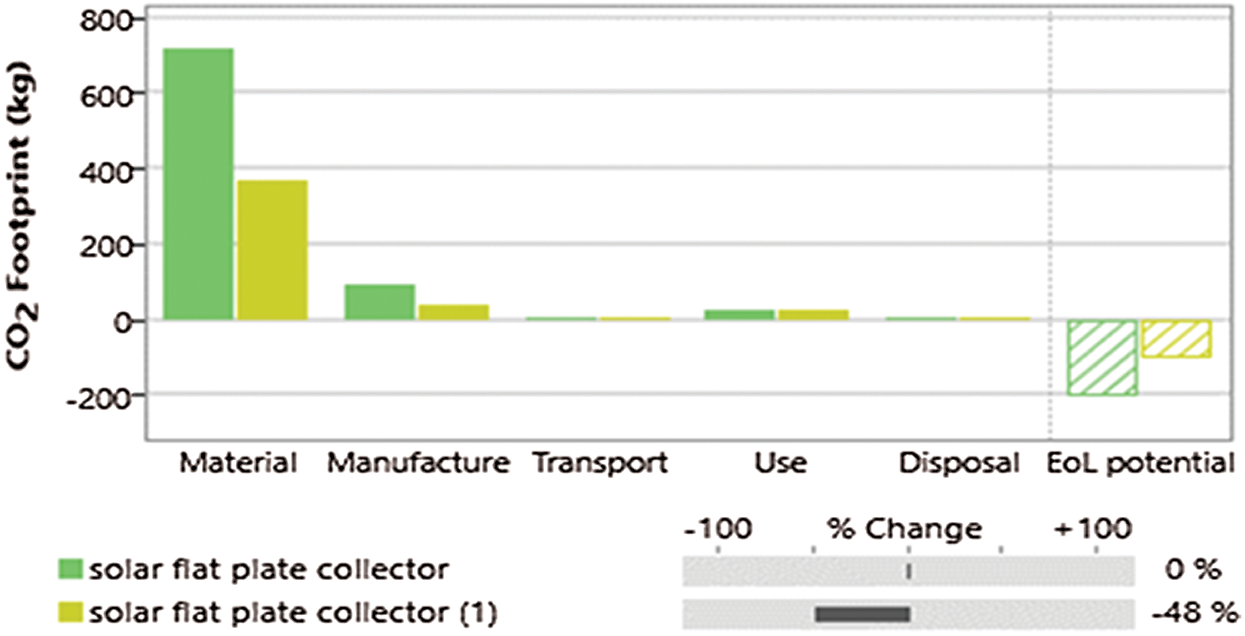
Figure 5: Comparison of CO2 production between the two scenarios
Note that second column represents energy consumption/CO2 footprint by materials production after materials change. Obviously, manufacturing process consumption also decreases with changing the materials. The reason of this is copper can be easily handled resulting in easier manufacturing process. However, the end of life potential (EoL) is reduced because most of the new materials recyclable content are decreased.
From Tabs. 6–9, it is possible to compare energy consumption and CO2 emissions for materials that have been changed. After changing the collector frame and support, the energy that has been saved is about 40 MJ. Also, changing risers and header, absorber plate and transparent cover materials result in excess of 430 MJ of savings.
Table 6: Energy consumption details of production process after changing materials
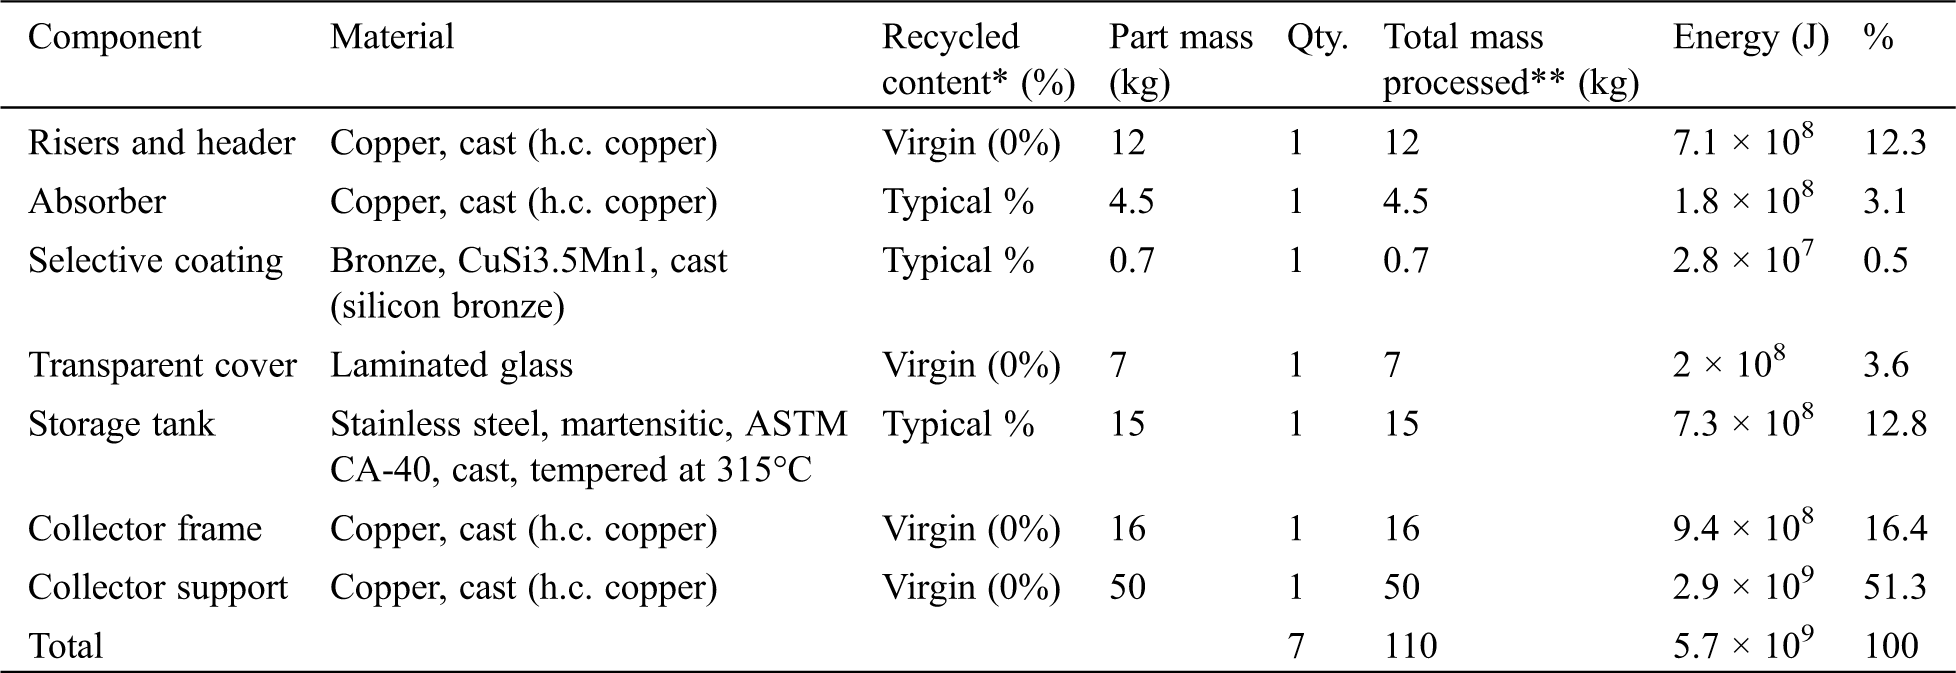
Table 7: CO2 footprint details for production process after changing materials
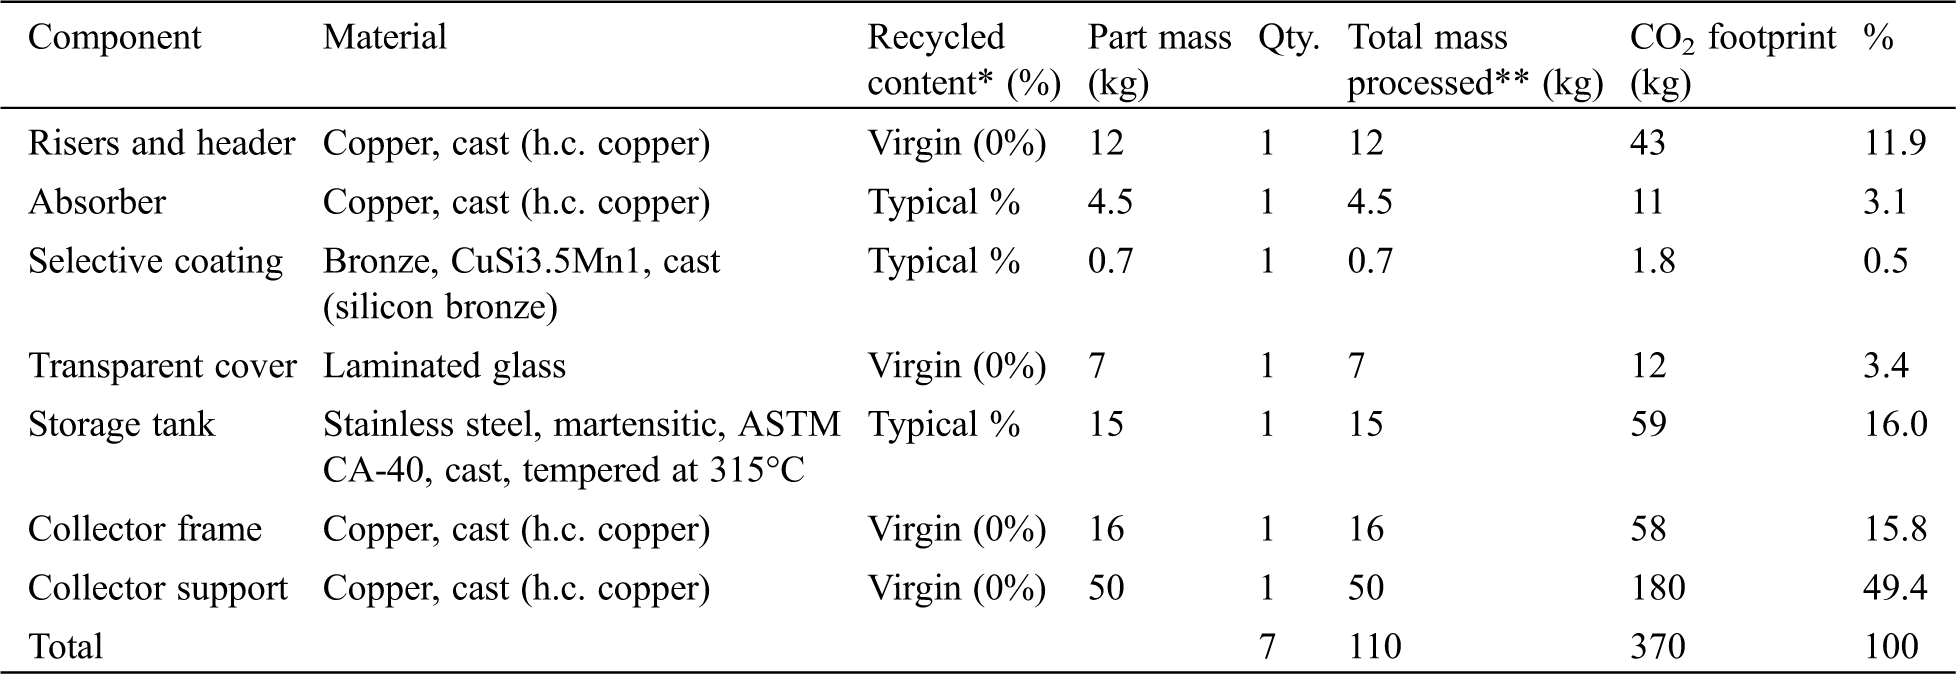
Table 8: End of life potential details for material production
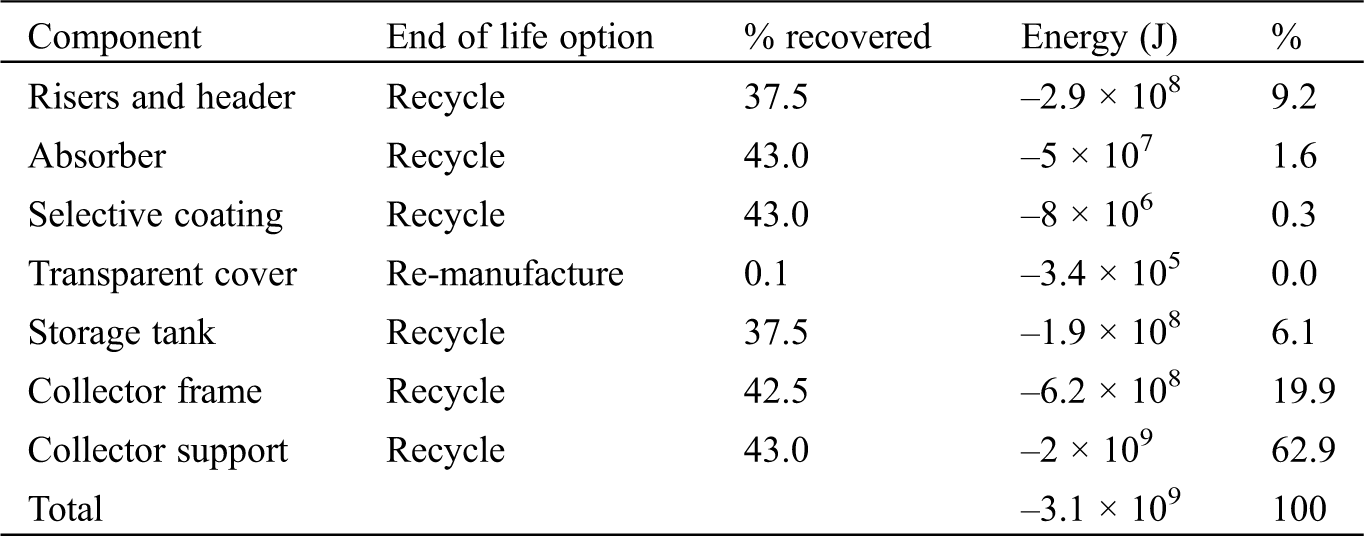
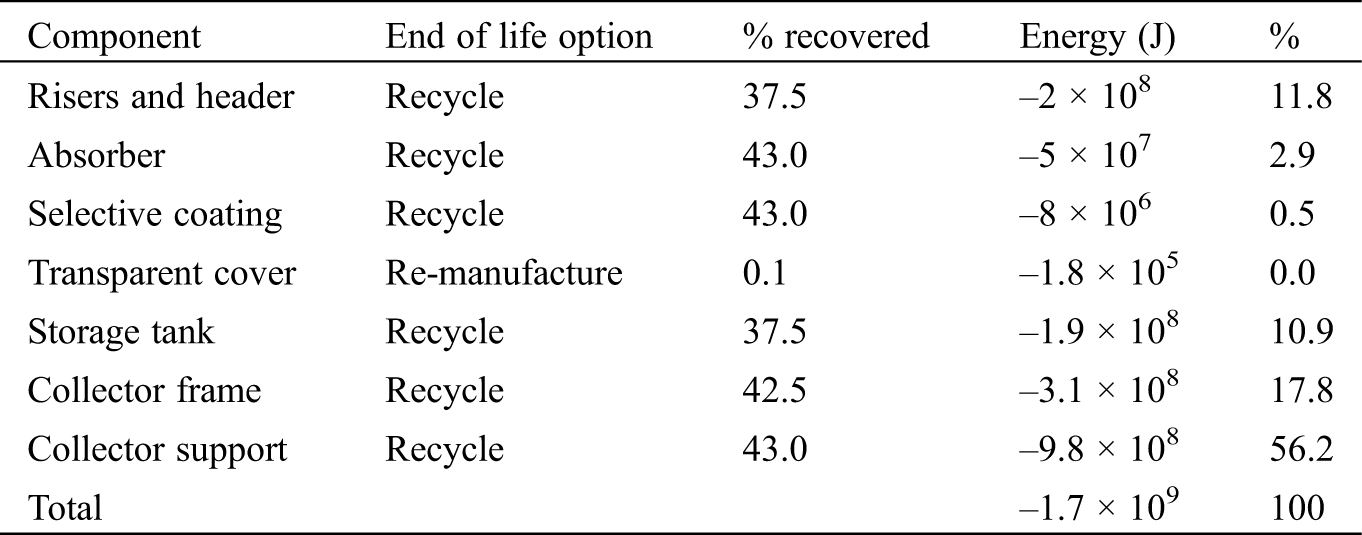
Table 9: End of life potential details after changing materials
From the CO2 perspective, the total savings are 375 kg which reduce the pollution in the environment. These calculations are only applied for a single mid-sized flat plate collector. Yet, for a commercial production of collectors, the savings will be multiplied by the number of units of production.
From Fig. 4, we notice that EoL potential after changing the materials has been decreased and the lower recyclable content of the new materials is the reason behind this decrease. However, the actual effect of changing the materials can be better understood by calculating the end of life potential to the energy consumption ratio. The EoL potential (Tab. 8) to energy consumption ratio of the first scenario is 0.31, while the second scenario (Tab. 9) results in (
The economic analysis which turned to be the determining factor to choose the best alternative is summarized in Fig. 6.
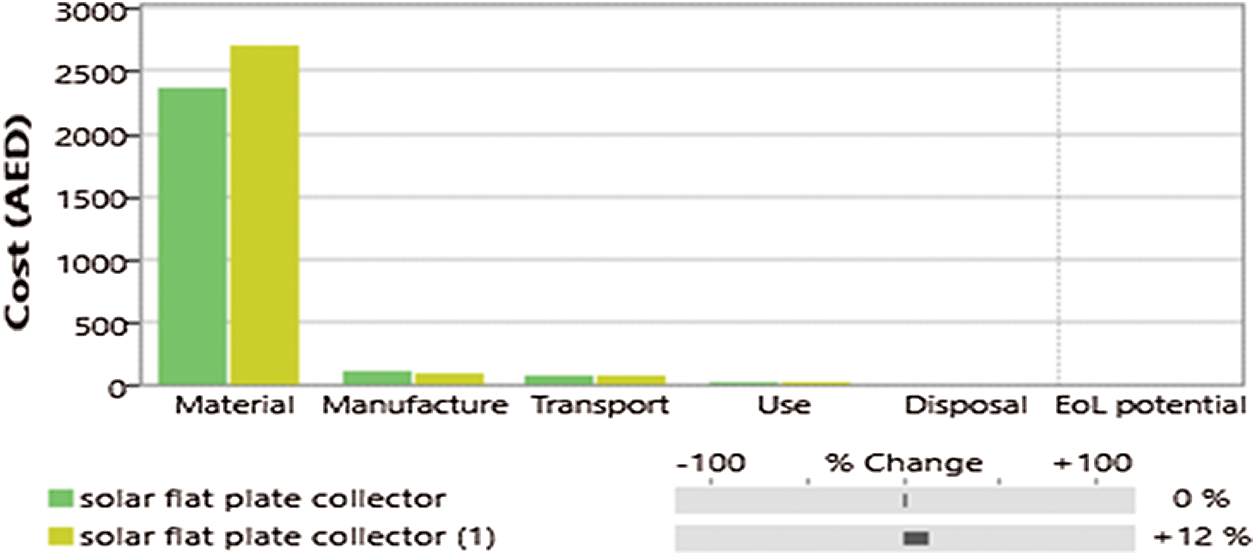
Figure 6: Comparison of total costs between the two scenarios
It is obvious that the current commercial used materials would result in less capital costs and accordingly they are preferred. The detailed cost analysis for the two situations are tabulated below, Tabs. 10 and 11.
Table 10: Detailed cost analysis for materials production
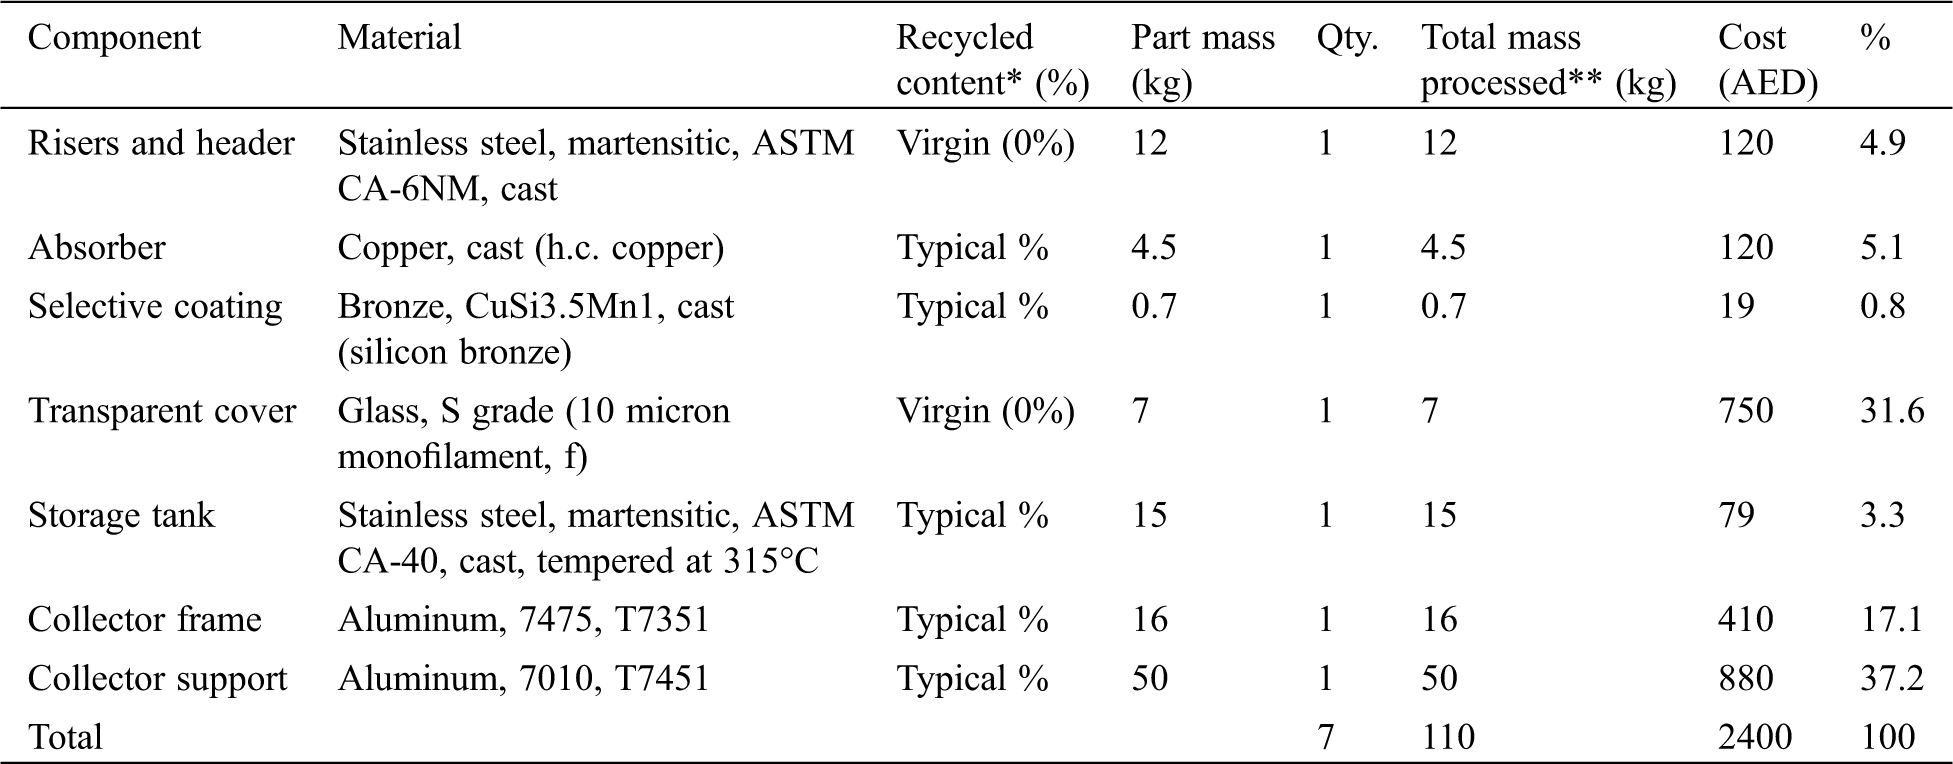
Table 11: Detailed cost analysis after changing the materials
The difference in cost of collector frame using aluminium and copper is (470–410) = 60 AED, for the collector support the difference is (1500–880) = 620 AED, for the pipes the difference is (380–120) = 260 AED, for the glazing material (190–750) = –560 AED (the negative sing here represents cost saving). The total result is 380 AED. However, manufacturing process results in 20 AED savings which reduces the result to 360 AED.
In this work, the lifecycle of a flat plate collector for solar heating was analyzed using the CES-Edupack software to know total cost, carbon dioxide emission and total energy consumption. After completing the design for all steps materials, manufacturing, transport, use (maintenance) and end of lifecycle, it was found that the step that consumed most of the energy and had the largest CO2 emission was the materials production process. It was also found that the parts that consumed the most energy and produced the largest amount of CO2 in material production were the collector frame and the support. So, in order to decrease the energy production and the CO2 emissions in the material production copper was used instead of using aluminum for the collector frame and the support, because the energy used to produce 1 kg of copper was much less than the energy consumed for producing 1 kg of aluminum, and hence resulting in less CO2 emissions than the Aluminum production. The percentage decrease in the total energy consumption in the materials production was nearly 40%, but using copper would cause the cost to increase by almost 30%. However, the end of life potential to energy consumption ratio of using copper is approximately the same of the EOL potential to energy consumption ratio of aluminum frame and support.
To conclude, the equivalence of the two EOL potential to energy consumption ratio seems to be cost dependent and as it was found, the cost of using copper frame and support would be less than using aluminum frame and support. Hence, it is recommended to use the copper frame and support.
The major outcomes of this work are:
• Even though solar flat plate collectors are sustainable and renewable energy systems that do not produce CO2 emissions during their active usage, the processes they undergo during the design contribute to the greenhouse gasses emission.
• Materials production are usually the phase where most of energy consumption takes place.
• By looking to the direct energy or CO2 production rate savings, you cannot determine whether changing the materials would be beneficial to the system, EoL potential to energy consumption ratios should be the main factor of judgment.
• When changing materials of the system is desirable to achieve less energy consumption and CO2 emissions in materials production process, new materials must share the same properties.
• Usually, environmental-friendly materials are more expensive. For this reason, commercial firms avoid such materials in designing such systems.
• Taking the cost analysis as an approach is suitable for our situation since the EoL potential to energy consumption ratios were approximately equal.
Acknowledgement: The second author acknowledges Aalto University, Department of Mechanical Engineering, Energy Efficiency and Systems, Finland.
Funding Statement: The authors received no specific funding for this study.
Conflicts of Interest: The authors declare that they have no conflicts of interest to report regarding the present study.
1. Khosravi, A., Rodriguez, O. R. S., Talebjedi, B., Laukkanen, T., Pabon, J. J. G. et al. (2020). New correlations for determination of optimum slope angle of solar collectors. Energy Engineering: Journal of the Association of Energy Engineers, 117(5), 249–265. [Google Scholar]
2. Mohammed, O. H., Amirat, Y., Benbouzid, M., Elbast, A., Mohammed, O. H. et al. (2014). Optimal design of a PV/fuel cell hybrid power system for the city of brest in France optimal design of a PV/fuel cell hybrid power system for the city of Brest in France. IEEE ICGE, Sfax, Tunisia, pp. 119–123. [Google Scholar]
3. Khosravi, A., Olkkonen, V., Farsaei, A., Syri, S. (2020). Replacing hard coal with wind and nuclear power in Finland—Impacts on electricity and district heating markets. Energy, 203, 117884. DOI 10.1016/j.energy.2020.117884. [Google Scholar] [CrossRef]
4. Khosravi, A., Syri, S. (2020). Modeling of geothermal power system equipped with absorption refrigeration and solar energy using multilayer perceptron neural network optimized with imperialist competitive algorithm. Journal of Cleaner Production, 276, 124216. [Google Scholar]
5. Ellabban, O., Abu-Rub, H., Blaabjerg, F. (2014). Renewable energy resources: Current status, future prospects and their enabling technology. Renewable and Sustainable Energy Reviews, 39, 748–764. DOI 10.1016/j.rser.2014.07.113. [Google Scholar] [CrossRef]
6. Pabon, J. J. G., Khosravi, A., Malekan, M., Sandoval, O. R. (2020). Modeling and energy analysis of a linear concentrating photovoltaic system cooled by two-phase mechanical pumped loop system. Renewable Energy, 157, 273–289. DOI 10.1016/j.renene.2020.05.039. [Google Scholar] [CrossRef]
7. Khosravi, A., Koury, R. N. N., Machado, L., Pabon, J. J. G. (2018). Energy, exergy and economic analysis of a hybrid renewable energy with hydrogen storage system. Energy, 148, 1087–1102. DOI 10.1016/j.energy.2018.02.008. [Google Scholar] [CrossRef]
8. US EPA (2020). About the U.S. electricity system and its impact on the environment. https://www.epa.gov/energy/about-us-electricity-system-and-its-impact-environment. [Google Scholar]
9. US EPA (2020). Design for the environment life-cycle assessments. https://archive.epa.gov/epa/saferchoice/design-environment-life-cycle-assessments.html. [Google Scholar]
10. Sustainable Facilites Tool (2020). Life cycle assessment–GSA sustainable facilites tool. https://sftool.gov/plan/400/life-cycle-assessment. [Google Scholar]
11. Hang, Y., Qu, M., Zhao, F. (2012). Economic and environmental life cycle analysis of solar hot water systems in the United States. Energy Build, 45, 181–188. DOI 10.1016/j.enbuild.2011.10.057. [Google Scholar] [CrossRef]
12. United Nations Environment Programme. (2009). Guidelines for social life cycle assessment of products. http://www.unep.fr/shared/publications/pdf/DTIx1164xPA-guidelines_sLCA.pdf. [Google Scholar]
13. Kumar, S., Tiwari, G. N. (2009). Life cycle cost analysis of single slope hybrid (PV/T) active solar still. Applied Energy, 86(10), 1995–2004. DOI 10.1016/j.apenergy.2009.03.005. [Google Scholar] [CrossRef]
14. Araya, R., Bustos, F., Contreras, J., Fuentes, A. (2017). Life-cycle savings for a flat-plate solar water collector plant in Chile. Renewable Energy, 112, 365–377. DOI 10.1016/j.renene.2017.05.036. [Google Scholar] [CrossRef]
15. Ozturk, M., Ozek, N., Batur, H., Koc, M. (2012). Thermodynamic and life cycle assessment of flat-plate collector, photovoltaic system and photovoltaic thermal collector. International Journal of Exergy, 11(2), 229–251. DOI 10.1504/IJEX.2012.049745. [Google Scholar] [CrossRef]
 | This work is licensed under a Creative Commons Attribution 4.0 International License, which permits unrestricted use, distribution, and reproduction in any medium, provided the original work is properly cited. |