| Energy Engineering |
DOI: 10.32604/EE.2021.014532
ARTICLE
Operation Strategy Analysis and Configuration Optimization of Solar CCHP System
1Photothermal Energy Storage Integrated Energy System Engineering Research Center, Lanzhou Jiaotong University, Lanzhou, 730070, China
2School of Automation and Electric Engineering, Lanzhou Jiaotong University, Lanzhou, 730070, China
*Corresponding Author: Xiaojuan Lu. Email: luxj@mail.lzjtu.cn
Received: 06 October 2020; Accepted: 28 December 2020
Abstract: This paper proposed a new type of combined cooling heating and power (CCHP) system, including the parabolic trough solar thermal (PTST) power generation and gas turbine power generation. The thermal energy storage subsystem in the PTST unit provides both thermal energy and electrical energy. Based on the life cycle method, the configuration optimization under eight operation strategies is studied with the economy, energy, and environment indicators. The eight operation strategies include FEL, FEL-EC, FEL-TES, FEL-TES&EC, FTL, FTL-EC, FTL-TES, and FTL-TES&EC. The feasibility of each strategy is verified by taking a residential building cluster as an example. The indicators under the optimal configuration of each strategy are compared with that of the separate production (SP) system. The results showed that the PTST-CCHP system improves the environment and energy performance by changing the ratio of thermal energy and electric energy. The environment and energy indicators of FEL-TES&EC are superior to those of FTL-TES&EC in summer, and the results are just the opposite in winter. The initial annual investment of the PTST-CCHP system is higher than that of the SP system, but its economic performance is better than that of the SP system with the increase of life-cycle.
Keywords: Combined cooling heating and power (CCHP) system; trough solar thermal power generation; operation strategy; optimization configuration; hill-climbing algorithm (HCA)
Nomenclature
| | the installation cost of the system |
| | system operation and maintenance costs |
| | fuel cost |
| | interaction cost between the PTST-CCHP system and the large power grid |
| | the price of natural gas |
| | power purchase prices |
| | the price of electricity for sale |
| | the specific heat capacity of the heat storage medium |
| | the interest rate and is equal to 0.08 |
| | purchased in electricity |
| | sold electricity |
| | the output electricity of the PTST power generation unit |
| | the difference between mean solar time and true solar time |
| | unit time consumption of gas turbine |
| | gas consumption per unit time of gas-fired boiler |
| | solar constant and is a value of 1353 W·m−2 |
| | solar radiation |
| | solar radiation outside the atmosphere |
| | total number of days per quarter |
| | the longitude of the desired location |
| | the Longitude of Beijing |
| | the life expectancy of the system, which is a value of 50 years |
| | unit time and unit capacity operation cost of each unit |
| | the number of units |
| | the unit capacity installation cost of each unit |
| | the installation capacity of each unit |
| | the output power of each unit |
| | useful energy gains for solar thermal systems |
| | solar thermal storage tank may provide heat storage capacity |
| | air quality |
| | solar energy collection area of the PTST power generation unit |
| | the heated time of the heat storage medium |
| | the inlet temperature of heat storage tanks |
| | the outlet temperature of heat storage tanks |
| | solar time (Beijing time in 24 hours system) |
| | total investment cost over the life cycle of the system |
| | the annual investment cost |
| | natural gas consumption |
| | carbon dioxide emissions |
| Greek Symbols | |
| | the generation efficiency of the PTST power generation unit and it is equal to 0.37 |
| | efficiency whose plus sign shows the heat storage, and minus sign shows the heat release, and it is a value of 0.75 |
| | the solar energy collection efficiency of the PTST power generation unit and is equal to 0.38 |
| | the heat transfer efficiency between the solar energy collection subsystem and generation subsystem and it is equal to 0.95 |
| | the generation efficiency of thermal power plants |
| | direct radiation atmospheric transparency |
| | scattered atmospheric radiation transparency |
| | the sequence number of the desired day in a year |
| | zenith angle |
| | the latitude of the desired location |
| | declination angle |
| | the solar altitude |
| | solar hour angle |
| | the primary energy conversion coefficient for each kilowatt-hour of electricity generated by thermal power plants |
| | a carbon dioxide conversion coefficient for natural gas |
| | a carbon dioxide conversion coefficient for coal |
| Subscripts | |
| | the sequence number of each unit |
| | the sequence number of hours in a day |
| | the sequence number of seasons |
| | the sequence number of one day in one of the seasons |
| | the heat storage medium quantity of flow |
CCHP system has developed rapidly in recent years because of its prominent role in energy utilization. Scholars study CCHP systems extensively due to its advantages of higher efficiency of primary energy utilization, reduction of pollution gas emission, and flexible adjustment of electrothermal ratio [1–4]. In references [5,6], a hotel and a residential building were respectively taken as examples to study the performance of the traditional CCHP systems under different operation strategies. Jiang et al. [7] designed a calculation model of reliability index for traditional CCHP systems. The results showed that reliability analysis could reduce the total cost of a CCHP system and improve the utilization rate of energy. In reference [8], a model combining the multi-objective optimization genetic algorithm was established, through which the optimal installed capacity of power generation unit (PGU) and absorption refrigerator were given. The model has verified practicability and multi-objective prediction ability through a project in Changsha, China. Zhang et al. [9] evaluated three aspects of a CCHP system with different refrigeration modes, including economy, energy, and environment. The performance of the system under two operating strategies is respectively analyzed. It is proved that the general performance of the CCHP systems is better than that of the conventional separate heat and power systems. Tataraki et al. [10] compared three CCHP systems with different heating and cooling devices. The investment feasibility and business feasibility area of the existing CCHP system were determined by establishing an analysis formula and an operational feasibility diagram has been given. Zhu et al. [11] put forward a two-layer programming approach which can solve the optimal design and dispatch problem simultaneously and have the advantage of incorporating a variety of factors into optimization variables, including equipment type, equipment capacity, operation strategy, aiming to achieve the lowest cost and the least emission in the life-cycle of CCHP systems.
Currently, most cogeneration systems inevitably consume fossil fuel, but excessive consumption of fossil fuels is not recommended [12]. The flexibility of the CCHP system promotes the increasing research on its combination with renewable energy sources. Zhu et al. [13] established an integer nonlinear programming model for renewable energy and the CCHP systems. The optimization design and operation strategies of the system are studied by taking five different buildings as examples. Lv et al. [14] proposed a hybrid system combining a CCHP system with a river source heat pump. The advantages of the two technologies were combined. The optimization configuration of the combined system was studied, and the practicability of the optimization model was evaluated through case analysis. Wang et al. [15] designed a CCHP system coupled with a ground source heat pump (GSHP). Adjustable performance distribution was analyzed through a case to guide operation regulation of the system. The results showed that the GSHP system can effectively improve system performance and reduce primary energy consumption. In references [16–18], detailed research on a new CCHP system based on synthetic utilization of biogas and solar energy was presented. The results showed that the overall performance of the hybrid CCHP system is better than the reference system with higher technical maturity and performance. In reference [19], a new co-supply system was designed which integrated photovoltaic power generation and ground source heat pump in a traditional CCHP system. They proposed a new seasonal operation strategy considering the non-perennial difference of each load. On this basis, the integrated energy system is optimized with multiple objectives. The results showed that the system had a higher comprehensive benefit and could better meet the building load. Wang et al. [20] proposed a stochastic-CVaR (conditional value at risk) optimization model for CCHP microgrid operation with a consideration of EM participation, wind power accommodation, and multiple DRPs, and the validity of the model is verified by simulation. Yang et al. [21–24] have studied the method of combining traditional CCHP systems with solar energy [21–24]. Different operation strategies were analyzed. Performance indexes of economics, environment, and energy were studied.
Among so many kinds of new energy, solar energy is the most widely combined with traditional CCHP systems [25]. Besides, parabolic-trough-solar-thermal power generation has more unique advantages than other power generation [26,27].
It can be seen from the studies above that the operation strategies can affect the performance of CCHP systems, but the single application form of the new energy leads to the few operation strategies available for the CCHP systems. This paper established a new PTST-CCHP system that introduced the PTST power generation technology based on the traditional CCHP systems. The energy utilization forms are various, which can provide both electrical and thermal energy. Eight operation strategies were studied, and configuration optimization was performed for each strategy. The advantages and disadvantages of each strategy were analyzed by comparing the performance of each strategy under the optimal configuration. Then, the performance indexes of each strategy were compared with those of the SP system.
Fig. 1 clearly described the energy structures of the PTST-CCHP system and SP system. In Fig. 1(a), the electric load (EL) is met by the large power grid. The cooling load (CL) is satisfied by electric refrigeration. The heating load (HL) is filled by a gas boiler which consumes natural gas.
In Fig. 1(b), there is a PTST power generation unit that is powered by solar energy. The PTST power generation unit provides electricity Eptro which includes the electricity directly generated by the energy from the solar collector and the electricity indirectly generated by the energy from the thermal storage tank. The thermal storage tank can also supply thermal Ehtro to the load directly. The gas turbine uses natural gas as fuel to convert chemical energy into electricity Eptur. The total electricity of Eptro and Eptur meets the electric load (EL) of the system. Insufficient electricity Ebuy is purchased from the large power grid, and surplus electricity Esell is exported to the large power grid. The waste heat boiler recycles the heat energy Ehtur carried by the high-temperature flue gas from the gas turbine. Gas boiler takes natural gas as fuel to provide heat energy Ehbio for the system. The partial heat Ehtro1, Ehtur1, and Ehbio1 meet the heat load (HL) of the system. The cooling load (CL) of the system is satisfied by another partial heat Ehtro2, Ehtur2, and Ehbio2, besides the load from electric refrigeration.
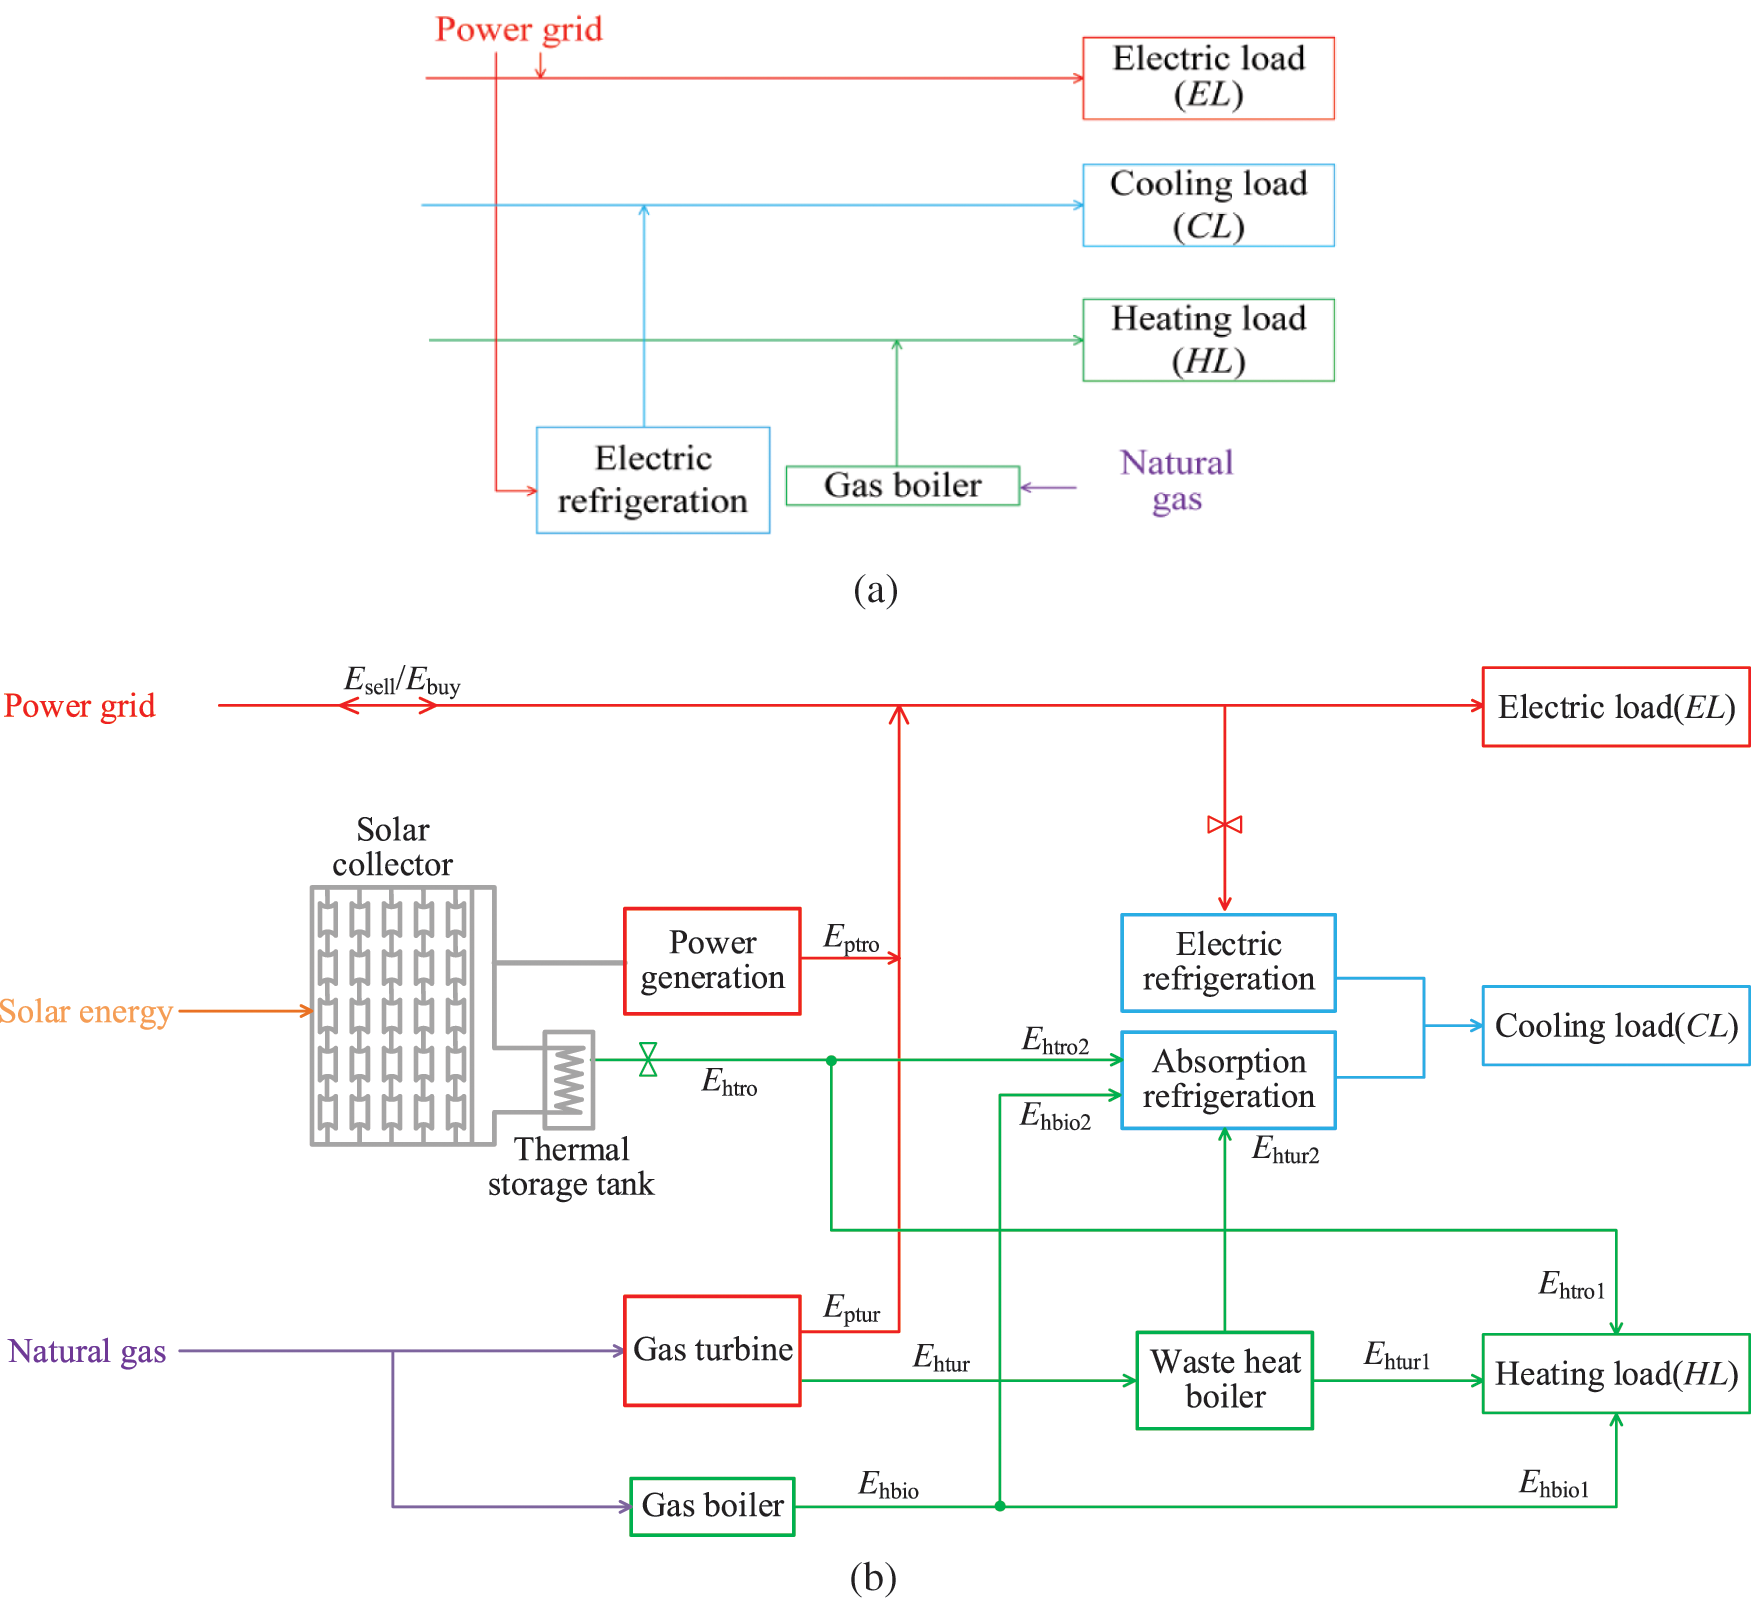
Figure 1: Energy structure of cooling heating and power system (a) Energy structure of separate production (SP) system (b) Energy structure of PTST-CCHP system
3 Optimization Objective Model
This paper established mathematical models for life-cycle costs [28–31], non-renewable energy consumption, and CO2 emissions. The total life-cycle costs are translated into corresponding annual investment values.
The economic model of the PTST-CCHP system consists of four parts, including installation cost, operation, and maintenance cost, fuel cost as well as interaction cost. The economic model can be calculated as:
where
where
The PTST power generation unit determines the cost of interaction between the system and the large power grid. The mathematical model of the PTST power generation unit is shown as:
where
where
where
Heat storage tanks are designed to extend the time it takes to generate electricity after the sun sets at night and to store excess solar radiation during the day when solar energy is surplus. Therefore, after adding the heat storage tanks, the available heat collection of PTST power generation system will increase. Although it will increase the cost of system investment and maintenance, it will also increase the annual net power generation.
The
where
where
where
The total investment cost in the whole life-cycle can be converted into annual investment cost, which can be expressed as:
where
3.2 Natural Gas Consumption Model
Primary energy can be further divided into two categories: Renewable energy and non-renewable energy. Non-renewable energy cannot be recovered in the short term, and the reserves become less and less because of its large-scale development and utilization. Non-renewable energy consumption can be expressed as:
where
In this paper, the environmental performance index of the PTST power generation system is evaluated by calculating the CO2 emission of the system and comparing it with those of conventional separate heat and power systems. The emissions of carbon dioxide can be calculated by:
where
The output characteristics of the system can be analyzed from a clear perspective after determining that the system is operating with a particular strategy. In general, there are two basic operation strategies for CCHP systems, which are following the thermal load (FTL) and following the electric load (FEL) [33–36]. FTL gives priority to meeting the heat and cold load of the system, and then meets the electric load on this basis. The large power grid supplements the insufficient electric, and the excess electricity is sold to the large power grid. FEL gives priority to meeting the electric load of the system and then meets the heat and cold load on this basis. The insufficient thermal is supplemented by the gas boiler, and the excess thermal is discharged to the atmosphere. Based on these two basic strategies, this paper sets eight strategies for the PTST-CCHP system.
4.1 Following the Electric Load (FEL)
Under this operation strategy, priority is given to the electricity generated by the PTST power generation unit to meet the EL. The surplus electricity is sold to the large power grid, and the gas turbine supplements insufficient electricity. On this basis, the heat generated by the gas turbine is provided to the HL and CL. The gas boiler supplements the insufficient heat, and the surplus heat escapes into the atmosphere.
4.2 Following the Electric Load with Electric Cooling (FEL-EC)
Under this operation strategy, electric cooling is introduced into the system. Priority is given to the electricity generated by the PTST power generation unit to meet the EL and electric cooling load. The surplus electricity is sold to the large power grid, and the gas turbine supplements insufficient electricity. On this basis, the heat generated by the gas turbine is provided to HL and absorption refrigerator load. The gas boiler supplements the insufficient heat, and the surplus heat escapes into the atmosphere.
4.3 Following the Electric Load with Thermal Energy Storage (FEL-TES)
This operation strategy introduces thermal energy-storage subsystem heating mode into the system. The electricity generated by the PTST power generation unit has the priority of meeting the EL. The surplus electricity is sold to the large power grid, and insufficient electricity is supplemented by the gas turbine. On this basis, the heat generated by the gas turbine and thermal energy storage subsystem is provided to HL and CL. The gas boiler supplements the insufficient heat, and the surplus heat escapes into the atmosphere.
4.4 Following the Electric Load with Thermal Energy Storage and Electric Cooling (FEL-TES&EC)
Under this operation strategy, thermal energy-storage subsystem heating mode and electric cooling are introduced into the system concurrently. Priority is given to the electricity generated by the PTST power generation unit to meet the EL and electric cooling load. The surplus electricity is sold to the large power grid, and the gas turbine supplements insufficient electricity. The heat generated by the gas turbine and thermal energy storage subsystem is provided to HL and absorption refrigerator load. The insufficient heat is supplemented by the gas boiler, and the surplus heat escapes into the atmosphere.
4.5 Following the Thermal Load (FTL)
Under this operation strategy, priority is given to the heat generated by the gas turbine to meet the HL and CL. On this basis, the electricity generated by the gas turbine and the PTST power generation unit is provided to the EL. The large power grid supplements the insufficient electricity, and the surplus electricity is sold to the large power grid.
4.6 Following the Thermal Load with Electric Cooling (FTL-EC)
Under this operation strategy, electric cooling is introduced into the system. The heat generated by the gas turbine has the priority to meet the HL and absorption refrigerator load. On this basis, the electricity generated by the gas turbine and the PTST power generation unit is provided to the EL and electric cooling load. The large power grid supplements the insufficient electricity, and the surplus electricity is sold to the large power grid.
4.7 Following the Thermal Load with Thermal Energy Storage (FTL-TES)
Under this operation strategy, the thermal energy-storage subsystem heating mode is introduced into the system. Priority is given to the heat generated by the gas turbine and thermal energy storage subsystem to meet the HL and CL. On this basis, the electricity generated by the gas turbine and the PTST power generation unit is provided to the EL. The large power grid supplements the insufficient electricity, and the surplus electricity is sold to the large power grid.
4.8 Following the Thermal Load with Thermal Energy Storage and Electric Cooling (FTL-TES&EC)
Under this operation strategy, thermal energy-storage subsystem heating mode and electric cooling are introduced into the system concurrently. Priority is given to the heat generated by the gas turbine and thermal energy storage subsystem to meet the HL and absorption refrigerator load. On this basis, the electricity generated by the gas turbine and the PTST power generation unit is provided to the EL and electric cooling load. The large power grid supplements the insufficient electricity, and the surplus electricity is sold to the large power grid.
In this paper, a residential building cluster in Beijing requiring a lot of energy is studied. Taking one year as the research interval and dividing it into three quarters, summer, winter, and transition seasons, to analyze the operation of a typical day in each quarter with a time interval of one hour.
The annual hourly load of the buildings cluster is shown in Fig. 2. Different colors represent the load curves of a typical day of winter, summer, and transition season, respectively.
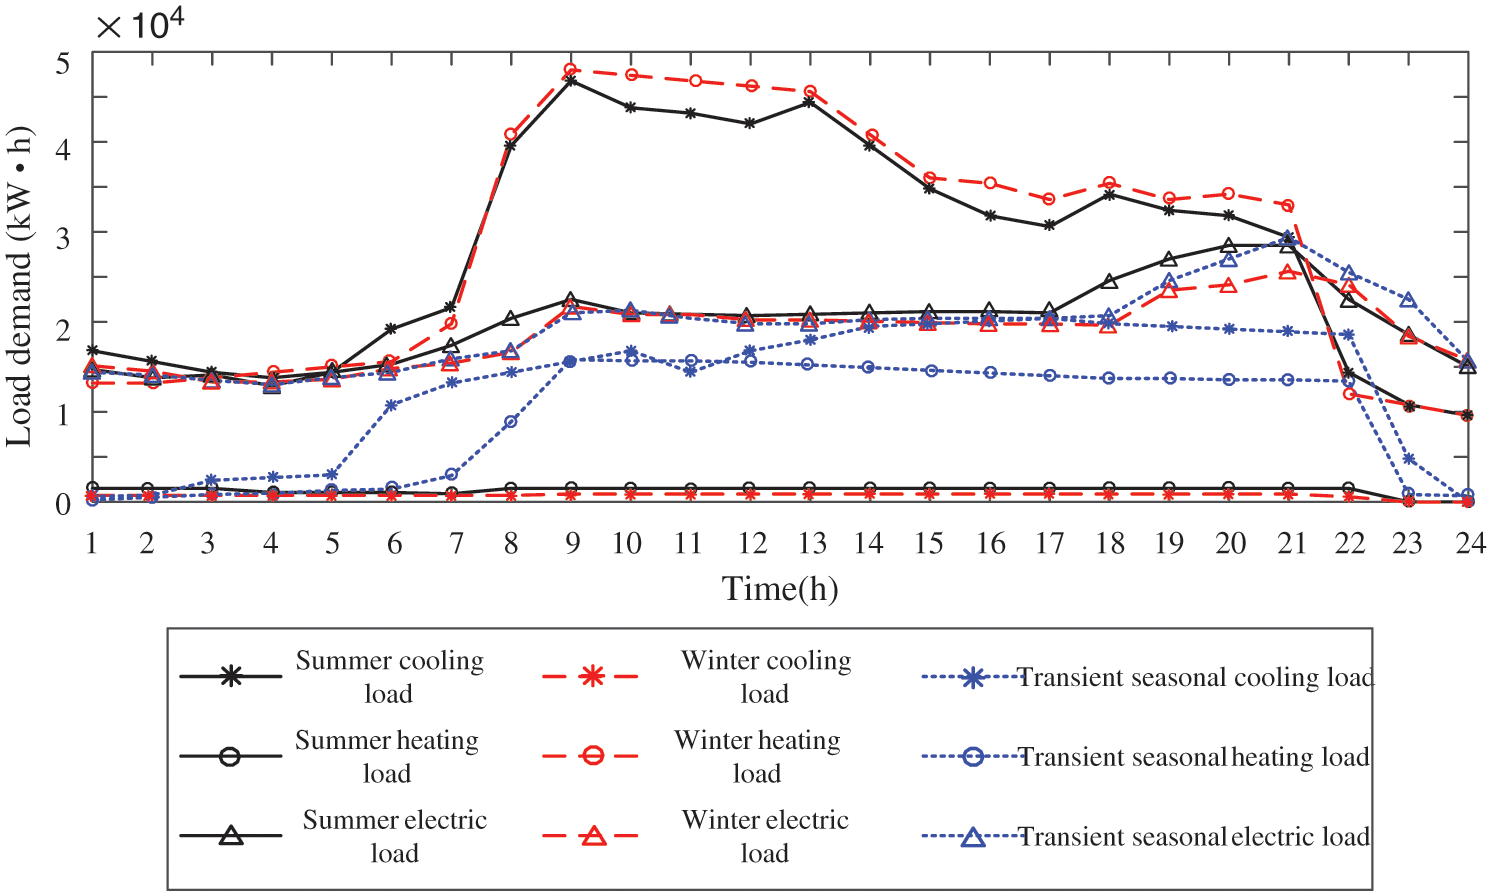
Figure 2: Hourly load curve of a typical day
Annual hourly solar radiation in Beijing is shown in Fig. 3. There is a gap in solar radiation between each quarter, which will inevitably lead to a change in the generating capacity of the PTST power generation unit, affecting various evaluation indexes. Therefore, it is necessary to study the operation of the system quarterly. The amount of solar radiation on a typical day in each quarter is shown in Fig. 4.
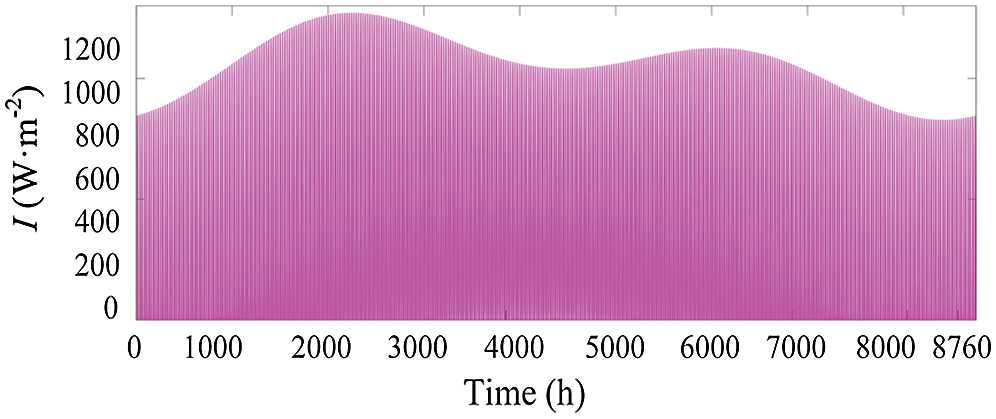
Figure 3: Annual solar irradiance in Beijing
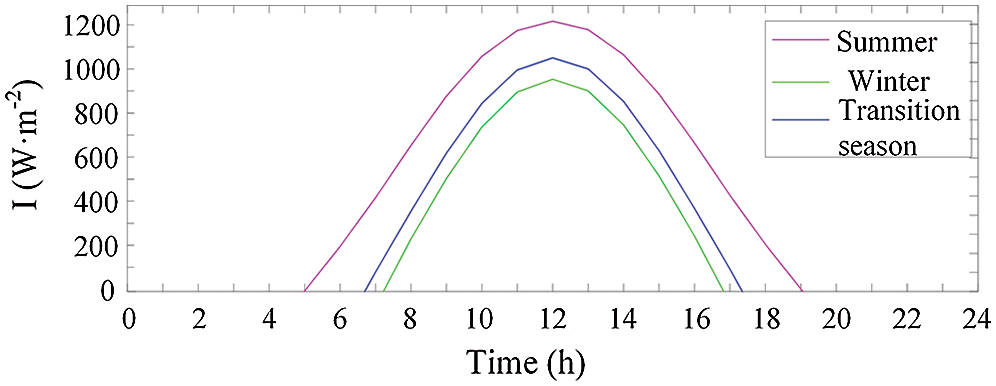
Figure 4: Solar irradiance of a typical day in Beijing
5.3 Configuration Optimization
The hill-climbing algorithm (HCA) [37–40] is adopted to find the optimal solutions for the PTST-CCHP system. Hill climbing algorithm (HCA) is a local optimal method that adopts a heuristic method and is an improvement of depth-first search. It uses feedback information to help generate decisions about solutions. The main ideas of HCA are as follows:
Step 1: Choose a starting point at random.
Step 2: Each time, the adjacent point is compared with the current point, and the better one is taken as the next step of climbing.
Step 3: Repeat Step 2 until the point is no longer adjacent to any point larger than it.
Step 4: This point is selected as the peak of the climbing, which is the optimal solution obtained by the algorithm.
5.3.1 Optimal Configuration of FEL

Figure 5: The optimization results of FEL (a) Non-renewable energy consumption (b) CO2 emissions (c) Annual investment
Ycon and Yrel in Figs. 5(a) and 5(b) gradually increase with the increase of K, and decrease first and then remain unchanged with the growth of S. In Fig. 5(c), Ycost decreases first and then increases with the increase of K, and increases gradually with the rise of S. It can be seen that, under this operation strategy, the gas turbine will not be involved in the operation when S increases to a specific value. The EL demand can be completely satisfied by the PTST power generation unit, and the HL and CL demand can be satisfied by the gas boiler so that Ycon and Yrel will no longer change with S.
5.3.2 Optimal Configuration of FEL-EC

Figure 6: The optimization results of FEL-EC (a) Non-renewable energy consumption (b) CO2 emissions (c) Annual investment
As shown in Figs. 6(a) and 6(b), Ycon and Yrel gradually increase with the increase of K and decrease with the rise of S, but the slope changes. In Fig. 6(c), Ycost decreases first and then increases with the increase of K, and increases gradually with the rise of S. It can be seen that, under this operation strategy, the intervention of electric cooling makes the demand ratio of thermal and electricity change. The output rate of the gas turbine changes when S increases to a specific value.
5.3.3 Optimal Configuration of FEL-TES

Figure 7: The optimization results of FEL-TES (a) Non-renewable energy consumption (b) CO2 emissions (c) Annual investment
In Figs. 7(a) and 7(b), Ycon and Yrel increase with the increase of K, but the slope changes. And they gradually decreased with the rise of S. In Fig. 7(c), Ycost decreases first and then increases with the growth of K, and increases gradually with the increase of S. It can be seen that, under this operation strategy, the intervention of the thermal energy storage subsystem heating mode leads to the change of the heating capacity. The output rate of the gas boiler changes when K increases to a certain value.
5.3.4 Optimal Configuration of FEL-TES&EC

Figure 8: The optimization results of FEL-TES&EC (a) Non-renewable energy consumption (b) CO2 emissions (c) Annual investment
Ycon and Yrel in Figs. 8(a) and 8(b) increase with the increase of K with a slight change in slope and decreased with the rise of S with a significant change in slope. In Fig. 8(c), Ycost decreases first and then increases with the increase of K, and increases gradually with the increase of S. It can be seen that, under this operation strategy, the intervention of electric cooling makes the demand ratio of thermal and electricity change. The intervention of the thermal energy-storage subsystem heating mode leads to the change of the heating capacity. The output rate of the gas turbine and gas boiler both changes.
5.3.5 Optimal Configuration of FTL

Figure 9: The optimization results of FTL (a) Non-renewable energy consumption (b) CO2 emissions (c) Annual investment
As shown in Figs. 9(a) and 9(b), Ycon and Yrel increase gradually with the increase of K and remain unchanged with the growth of S. In Fig. 9(c), Ycost decreases first and then increases with the rise of K, and increases gradually with the increase of S. It can be seen that the change of S does not affect the environment and energy indicators. Therefore, it is meaningless to introduce new energy into the PTST-CCHP system under this strategy.
5.3.6 Optimal Configuration of FTL-EC
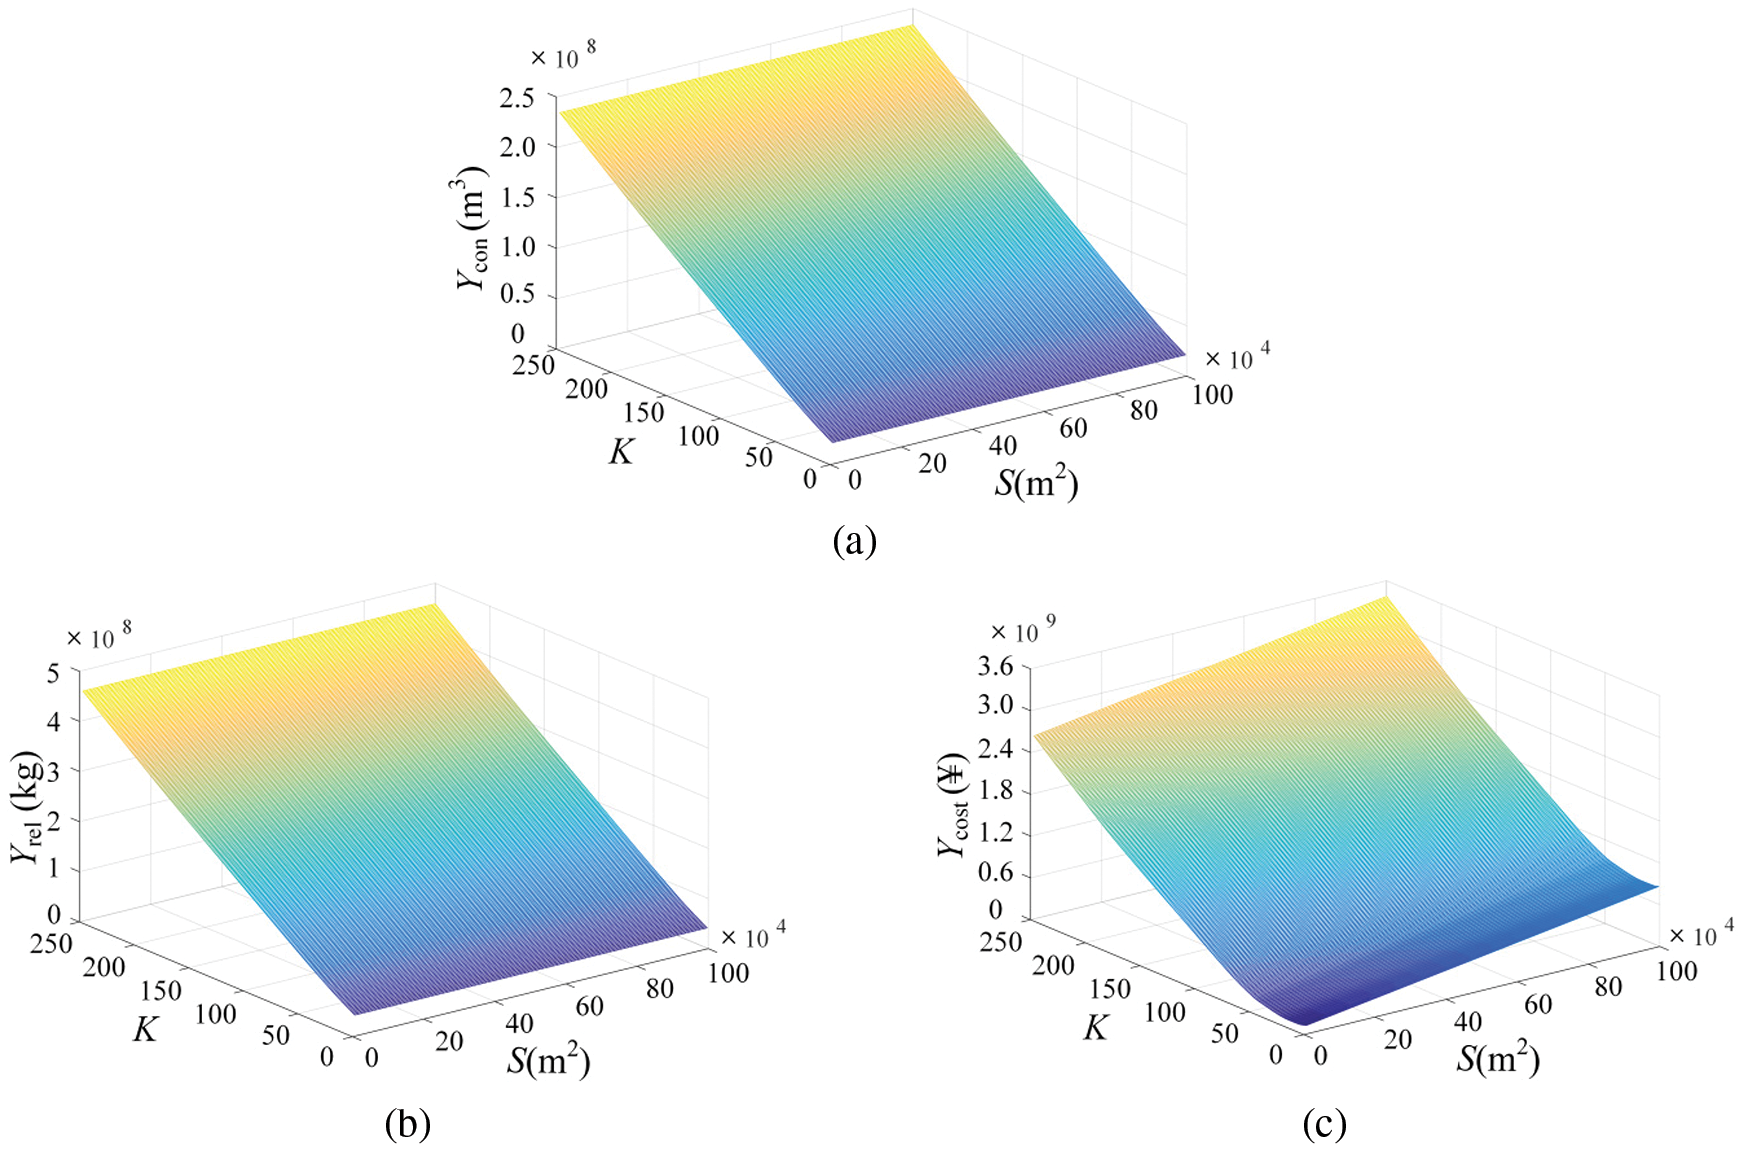
Figure 10: The optimization results of FTL-EC (a) Non-renewable energy consumption (b) CO2 emissions (c) Annual investment
Figs. 10(a) and 10(b) show that Ycon and Yrel increase gradually with the increase of K and remain unchanged with the addition of S. In Fig. 10(c), Ycost decreases first and then increases with the rise of K, and increases gradually with the increase of S. It can be seen that the only difference between this strategy and FTL strategy is that the demand ratio of the thermal and electric changes. The change of S does not affect the environment and energy indicators either. Therefore, it is also meaningless to introduce new energy into the PTST-CCHP system under this strategy.
5.3.7 Optimal Configuration of FTL–TES

Figure 11: The optimization results of FTL-TES (a) Non-renewable energy consumption (b) CO2 emissions (c) Annual investment
Ycon and Yrel in Figs. 11(a) and 11(b) gradually increase with the increase of K and decrease with the rise of S. In Fig. 11(c), Ycost first decreases and then increases with the rise of K, and gradually increases with the rise of S, but there are apparent fluctuations. It can be seen that, under this operation strategy, the demand of HL and CL need to be satisfied first, and the electricity generated by the PTST-CCHP system will interact with the large power grid frequently due to capacity constraints so that Ycost will fluctuate with the change of S. The change of S affects the environmental index and energy index due to the intervention of the thermal energy-storage subsystem heating mode.
5.3.8 Optimal Configuration of FTL-TES&EC
Figure 12: The optimization results of FTL-TES&EC (a) Non-renewable energy consumption (b) CO2 emissions (c) Annual investment
As shown in Figs. 12(a) and 12(b), Ycon and Yrel gradually increase with the increase of K and decrease with the increase of S, but the slope changes. In Fig. 12(c), Ycost first falls and then increases with the rise of K, and gradually increases with the increase of S, but there are obvious fluctuations. It can be seen that, under this operation strategy, Ycost will still fluctuate with S due to frequent electricity exchange between the PTST-CCHP system and the large power grid. The change of S affects the environmental index and energy index due to the intervention of the thermal energy-storage subsystem heating mode. Besides, the intervention of electric cooling makes the demand ratio of thermal and electricity change. The output rate of the gas turbine changes when S increases to a certain value.
5.4 Comparison of Optimal Indicators under Each Strategy
From the analysis of 5.3, it can be concluded that strategy FTL and strategy FTL-EC are meaningless for the introduction of solar energy in this PTST-CCHP system. Therefore, the remaining six strategies are analyzed. In addition to economic, energy, and environmental indicators, comprehensive indicators have been added. To get the comprehensive indicators, the natural gas consumption in the energy indicator is converted into the required RMB. The price of natural gas for power generation in Beijing is 2.31 RMB/m3 (Data from BEIJING GAS [41]). The marginal abatement costs of CO2 in Beijing in 2019 are 19326 RMB/ton [42]. Finally, the comprehensive indicator is equal to the value of the economic indicator plus the costs of natural gas consumption and the marginal abatement costs of CO2.
5.4.1 Annual Indicators Comparison

Figure 13: Annual indicators comparison (a) Energy indicators (b) Environmental indicators (c) Economic indicators (d) Composite indicators
As shown in Figs. 13(a) and 13(b), the environmental indicators and energy indicators of FEL, FEL-EC, FEL-TES, FEL-TES&EC were decreased successively. The environmental indicators and energy indicators of FTL-TES, FTL-TES&EC were successively reduced. It is proved that the intervention of thermal energy-storage subsystem heating mode and electric cooling can improve the environmental and energy performance of the system. In Fig. 13(c), the economic indicators of FEL-EC and FEL-TES are both higher than those of the FEL strategy. This proved that adding the thermal energy-storage subsystem heating mode or electric cooling alone will increase the cost; the economic indicator of FEL-TES&EC is lower than that of FEL-EC but higher than that of FTL-TES. This proved that the cost would be reduced by introducing the thermal energy-storage subsystem heating mode based on adding the electric cooling; the economic indicator of FTL-TES is lower than that of FEL-TES, while the economic indicator of FTL-TES&EC is higher than that of FEL-TES&EC. It is proved that it is more cost-saving to introduce the thermal energy-storage subsystem heating mode alone when running in the mode of power determined by heat but it is more cost-saving to introduce the thermal energy-storage subsystem heating mode and the electric cooling simultaneously when running in the style of heat determined by power. As shown in Fig. 13(d), in the mode of heat determined by power, FEL-TES&EC has the lowest composite indicator in the four effective strategies. In the style of power determined by heat, FTL-TES&EC has the lowest composite indicator in the two effective strategies. It is also proved that the integrated performance of the system can be improved by the intervention of thermal energy-storage subsystem heating mode and electric cooling.
5.4.2 Quarterly Indicators Comparison
Due to the vast difference in thermal load demand between winter and summer, it is necessary to compare the optimal performance indicators of each strategy quarterly.

Figure 14: Quarterly indicators comparison (a) Energy indicators (b) Environmental indicators (c) Economic indicators (d) Composite indicators
As shown in Figs. 14(a) and 14(b), the environmental and energy indicators of FTL-TES are higher than those of FEL-TES in summer, while the environmental and energy indicators of FTL-TES are lower than those of FEL-TES in winter. The same is true for the comparison of FEL-TES&EC and FTL-TES&EC. It is proved that the mode of power determined by heat has advantages in environmental and energy performance when the thermal demand is higher than electric demand.
As shown in Fig. 14(c), in terms of economic indicators, the situation of three quarters is consistent with the whole year.
As shown in Fig. 14(d), FTL-TES&EC has the lowest composite indicator in summer, FTL-TES has the lowest composite indicator in winter, and FTL-TES&EC has the lowest composite indicator in the transition season.
5.4.3 System Output Comparison on Typical Days in Different Quarters of Different Strategies
The optimal operation strategy is to increase the heat storage subsystem heating mode of PTST generator set and the cooling mode of the electric refrigerator. However, electric heating and electric heating have their advantages under different thermal load demands. The following is to compare the strengths and weaknesses of the FEL-TES&EC strategy and FTL-TES&EC strategy by analyzing the output of the subsystems in each quarter.
Figs. 15 to 17 show the power output of a typical gas turbine, solar generator set, and a large grid in each quarter.

Figure 15: Power output in summer (a) FEL-TES&EC strategy (b) FTL-TES&EC strategy

Figure 16: Power output in winter (a) FEL-TES&EC strategy (b) FTL-TES&EC strategy

Figure 17: Power output in the transition season (a) FEL-TES&EC strategy (b) FTL-TES&EC strategy
As seen from Figs. 15–17. First, the power output of solar power generators under the FEL-TES&EC strategy and FTL-TES&EC strategy is consistent. Second, output of the gas turbine of the FEL-TES&EC strategy is stable, while of FTL-TES&EC strategy changes frequently. The number of parallel gas turbines in this system is large, so the frequent output change is not conducive to the efficient use of fuel, and is not conducive to the unit life extension. Third, the power purchased from the large power grid under the strategy of FEL-TES&EC is significantly lower than that under the strategy of FTL-TES&EC. And the power purchased from the large power grid in large quantities violates the original design intention of the CCHP systems. Therefore, the FEL-TES&EC policy is more suitable for this system.
Figs. 18–20 show the thermal energy output of a typical gas turbine, solar thermal generator, and gas-fired boiler in each quarter.

Figure 18: Thermal energy output in summer (a) FEL-TES&EC strategy (b) FTL-TES&EC strategy

Figure 19: Thermal energy output in winter (a) FEL-TES&EC strategy (b) FTL-TES&EC strategy

Figure 20: Thermal energy output in the transition season (a) FEL-TES&EC strategy (b) FTL-TES&EC strategy
As seen from Figs. 18–20. First, the thermal energy output of solar power generators under the FEL-TES&EC strategy and FTL-TES&EC strategy is consistent. Second, the thermal energy output of the gas-fired boiler under the two strategies remains the same, with only slight differences in the output force at some time. Third, similar to the power output, the thermal energy output of gas turbines in the FTL-TES&EC strategy is also less stable than that of the FEL-TES&EC strategy. Therefore, the FEL-TES&EC policy is more suitable for this system.
5.5 Compared with the Indicators of the SP System
In Fig. 21, the annual investment cost of the FEL-TES&EC strategy decreases with the increase of the life-cycle. In Fig. 22, the saving rate of investment cost is negative in the first few years of the life-cycle, indicating that the annual investment cost of the FEL-TES&EC strategy is higher than that of the SP system. With the increase of the life-cycle, the saving rate of investment cost is positive, indicating that the annual investment cost of the FEL-TES&EC strategy is lower than that of the SP system.

Figure 21: The annual investment

Figure 22: The saving rate of investment cost
Table 1: Index comparison of FEL-TES&EC strategy and SP system
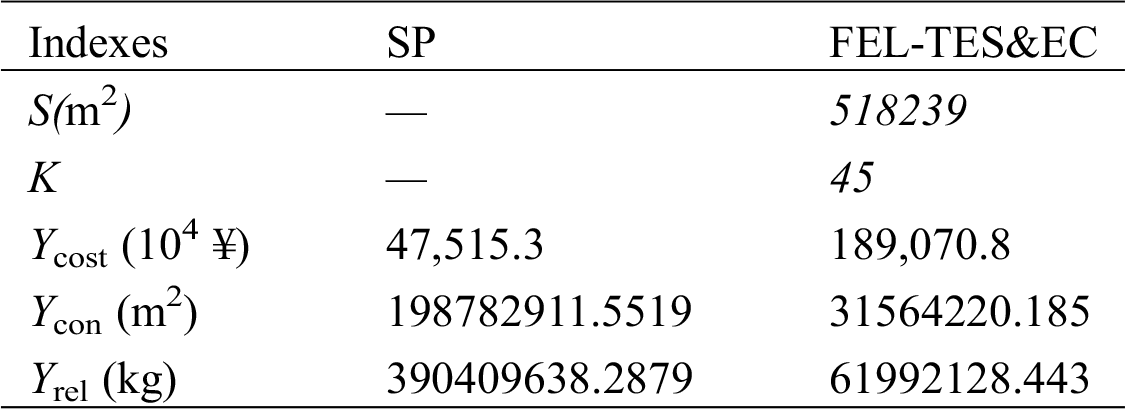
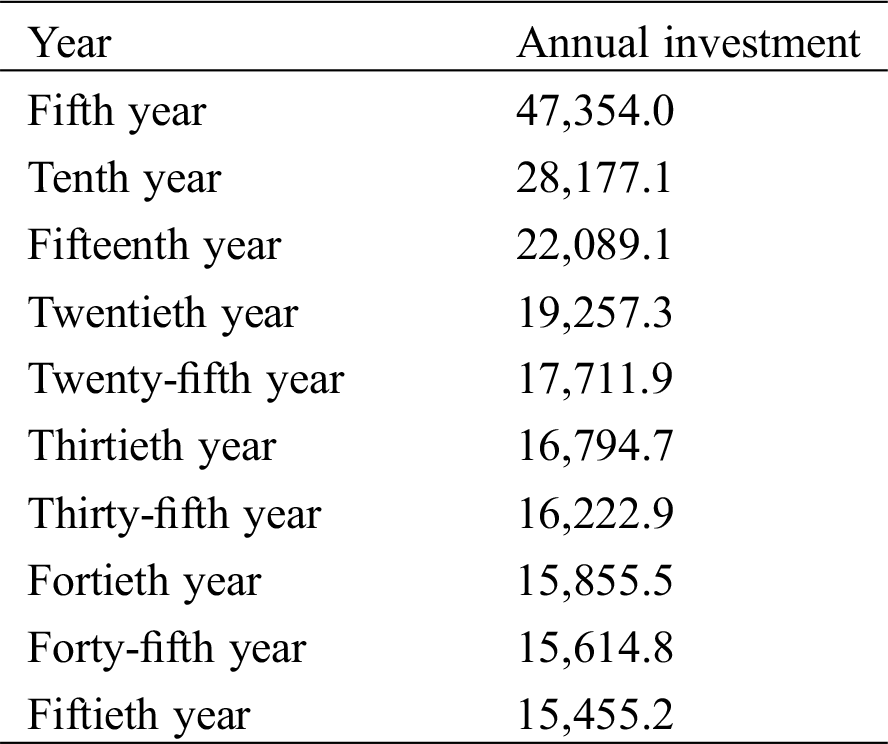
Table 2: Annual investment of FEL-TES&EC every five years (104 ¥)
Tab. 1 shows the economic indicators of the FEL-TES&EC strategy are higher than that of the SP system in the initial years, but the environmental indicators and energy indicators are lower than that of the SP system.
Tab. 2 shows the economic indicators of FEL-TES&EC every five years. The PTST-CCHP system can achieve better economic performance than SP systems in 5 years.
This paper established a new PTST-CCHP system that introduced the PTST power generation technology based on the traditional CCHP system. The energy utilization forms are various, which can provide both electrical and thermal energy. Eight operation strategies were studied, and configuration optimization is performed for each strategy. The advantages and disadvantages of each strategy were studied by comparing the performance of each strategy under the optimal configuration. Then, the performance indexes of each strategy were compared with those of the SP system. The conclusions were as follows:
The combination of traditional CCHP and PTST power generation technology can greatly improve the environmental performance and energy performance of the system. As the cost of the PTST generator set is high, the overall construction cost of the system will also increase, which mainly comes from the installation cost of the initial PTST. However, in the life cycle, with the increase of the operating life of the system, the benefits brought by the improvement of system environmental performance and energy performance are more than the later operation and maintenance costs of PTST. Therefore, in the case of long-term production, the overall performance of the PTST-CCHP system is better than the distributed supply system.
At the same time, the use of heat storage subsystem heating mode and electric cooling mode is the best choice. The choice of strategy depends on who is in great demand for electricity or heat. When the power demand is greater than the thermal demand, FEL-TES&EC has the advantage, while when the thermal demand is greater than the power demand, FTL-TES&EC has the advantage.
Acknowledgement: The authors acknowledge the reviewers providing valuable comments and helpful suggestions to improve the manuscript
Funding Statement: This research is supported by the National Natural Science Foundation of China (Grant No. 51667013) and the Research on Scheduling Control Technology of Photothermal Power Generation of The Power System with High Proportion New Energy on The Supply End (Grant No. SGGSKY00FJJS1900273).
Conflicts of Interest: The authors declare that they have no conflicts of interest to report regarding the present study.
1. Lu, S., Li, Y., Xia, H. (2018). Study on the configuration and operation optimization of CCHP coupling multiple energy system. Energy Conversion and Management, 177, 773–791. DOI 10.1016/j.enconman.2018.10.006. [Google Scholar] [CrossRef]
2. Wang, L., Lu, J., Wang, W., Ding, J. (2017). Feasibility analysis of CCHP system with thermal energy storage driven by micro turbine. Energy Procedia, 105, 2396–2402. DOI 10.1016/j.egypro.2017.03.688. [Google Scholar] [CrossRef]
3. Li, M., Mu, H., Li, N., Ma, B. (2016). Optimal design and operation strategy for integrated evaluation of CCHP (combined cooling heating and power) system. Energy, 99(6), 202–220. DOI 10.1016/j.energy.2016.01.060. [Google Scholar] [CrossRef]
4. Gao, Y., Liu, Q., Wang, S., Ruan, Y. (2018). Impact of typical demand day selection on CCHP operational optimization. Energy Procedia, 152(3), 39–44. DOI 10.1016/j.egypro.2018.09.056. [Google Scholar] [CrossRef]
5. Zhang, T., Wang, M., Wang, P., Gu, J., Zheng, W. (2019). Bi-stage stochastic model for optimal capacity and electric cooling ratio of CCHPs—A case study for a hotel. Energy and Buildings, 194(1), 113–122. DOI 10.1016/j.enbuild.2019.04.004. [Google Scholar] [CrossRef]
6. Abbasi, M. H., Sayyaadi, H., Tahmasbzadebaie, M. (2018). A methodology to obtain the foremost type and optimal size of the prime mover of a CCHP system for a large-scale residential application. Applied Thermal Engineering, 135(5), 389–405. DOI 10.1016/j.applthermaleng.2018.02.062. [Google Scholar] [CrossRef]
7. Jiang, J., Gao, W., Wei, X., Kuroki, S. (2019). Reliability and cost analysis of the redundant design of a combined cooling, heating and power (CCHP) system. Energy Conversion and Management, 199, 111988. DOI 10.1016/j.enconman.2019.111988. [Google Scholar] [CrossRef]
8. Lin, H., Yang, C., Xu, X. (2020). A new optimization model of CCHP system based on genetic algorithm. Sustainable Cities and Society, 52, 101811. DOI 10.1016/j.scs.2019.101811. [Google Scholar] [CrossRef]
9. Zhang, J., Cao, S., Yu, L., Zhou, Y. (2018). Comparison of combined cooling, heating and power (CCHP) systems with different cooling modes based on energetic, environmental and economic criteria. Energy Conversion and Management, 160, 60–73. DOI 10.1016/j.enconman.2018.01.019. [Google Scholar] [CrossRef]
10. Kalliopi, G. T., Kavvadias, K., Maroulis, Z. B. (2018). A systematic approach to evaluate the economic viability of combined cooling heating and power systems over conventional technologies. Energy, 148, 283–295. DOI 10.1016/j.energy.2018.01.107. [Google Scholar] [CrossRef]
11. Zhu, C., Xu, B., P., Nie, Z. (2019). An integrated design and operation optimal method for CCHP system. Energy Procedia, 158(1), 1360–1365. DOI 10.1016/j.egypro.2019.01.334. [Google Scholar] [CrossRef]
12. Rath, B. N., Akram, V., Bal, D. P., Mahalik, M. K. (2019). Do fossil fuel and renewable energy consumption affect total factor productivity growth? Evidence from cross-country data with policy insights. Energy Policy, 127(C), 186–199. DOI 10.1016/j.enpol.2018.12.014. [Google Scholar] [CrossRef]
13. Zhu, X., Zhan, X. Y., Liang, H., Zheng, X., Qiu, Y. (2020). The optimal design and operation strategy of renewable energy-CCHP coupled system applied in five building objects. Renewable Energy, 146(5), 2700–2715. DOI 10.1016/j.renene.2019.07.011. [Google Scholar] [CrossRef]
14. Lv, Y. X., Si, P. F., Rong, X. Y., Yan, J. Y. (2018). An optimization method for CCHP and river water source heat pump combined system. Energy Procedia, 145, 592–597. DOI 10.1016/j.egypro.2018.04.088. [Google Scholar] [CrossRef]
15. Wang, J. J., Chen, Y. Z., Dou, C., Gao, Y. F., Zhao, Z. (2018). Adjustable performance analysis of combined cooling heating and power system integrated with ground source heat pump. Energy, 163, 475–489. DOI 10.1016/j.energy.2018.08.143. [Google Scholar] [CrossRef]
16. Yang, G., Zhai, X. Q. (2019). Optimal design and performance analysis of solar hybrid CCHP system considering influence of building type and climate condition. Energy, 174, 647–663. DOI 10.1016/j.energy.2019.03.001. [Google Scholar] [CrossRef]
17. Villarroel-Schneider, J., Malmquist, A., Araoz, J. A., Martí-Herrero, J., Martin, A. (2019). Performance analysis of a small-scale biogas-based trigeneration plant, an absorption refrigeration system integrated to an externally fired microturbine. Energies, 12(20), 3830. DOI 10.3390/en12203830. [Google Scholar] [CrossRef]
18. Su, B., Han, W., Chen, Y., Wang, Z., Qu, W. et al. (2018). Performance optimization of a solar assisted CCHP based on biogas reforming. Energy Conversion and Management, 171, 604–617. DOI 10.1016/j.enconman.2018.05.098. [Google Scholar] [CrossRef]
19. Ma, W., Fang, W., Liu, S. G. (2017). Hybrid optimization method and seasonal operation strategy for distributed energy system integrating CCHP, photovoltaic and ground source heat pump. Energy, 141(6), 1439–1455. DOI 10.1016/j.energy.2017.11.081. [Google Scholar] [CrossRef]
20. Wang, Y. W., Yang, Y., Tang, J., Sun, L., Zhao, W. et al. (2019). A stochastic-CVaR optimization model for CCHP micro-grid operation with consideration of electricity market, wind power accommodation and multiple demand response programs. Energies, 12(20), 3983. DOI 10.3390/en12203983. [Google Scholar] [CrossRef]
21. Yang, C., Wang, X. S., Huang, M. M., Ding, S., Ma, X. Q. (2017). Design and simulation of gas turbine-based CCHP combined with solar and compressed air energy storage in a hotel building. Energy and Buildings, 153(6), 412–420. DOI 10.1016/j.enbuild.2017.08.035. [Google Scholar] [CrossRef]
22. Wang, J. J., Lu, Z. R., Li, M., Lior, N., Li, W. H. (2019). Energy, exergy, exergoeconomic and environmental (4E) analysis of a distributed generation solar-assisted CCHP (combined cooling, heating and power) gas turbine system. Energy, 175(5), 1246–1258. DOI 10.1016/j.energy.2019.03.147. [Google Scholar] [CrossRef]
23. Yang, G., Zhai, X. Q. (2018). Optimization and performance analysis of solar hybrid CCHP systems under different operation strategies. Applied Thermal Engineering, 133(4), 327–340. DOI 10.1016/j.applthermaleng.2018.01.046. [Google Scholar] [CrossRef]
24. Li, X., Shen, Y., Kan, X., Hardiman, T. K. Dai, Y. et al. (2018). Thermodynamic assessment of a solar/autothermal hybrid gasification CCHP system with an indirectly radiative reactor. Energy, 142(5), 201–214. DOI 10.1016/j.energy.2017.09.149. [Google Scholar] [CrossRef]
25. Bai, J. W., Ding, T., Wang, Z., Chen, J. H. (2019). Day-ahead robust economic dispatch considering renewable energy and concentrated solar power plants. Energies, 12(20), 3832. DOI 10.3390/en12203832. [Google Scholar] [CrossRef]
26. Jorge, M. L., David, B., Manuel, R., de Adana, R. (2019). Optimization of 100 MWe parabolic-trough solar-thermal power plants under regulated and deregulated electricity market conditions. Energies, 12(20), 3973. DOI 10.3390/en12203973. [Google Scholar] [CrossRef]
27. Ma, L. R., Xu, E. S., Li, J., Xu, L., Li, X. L. (2018). Analysis and validation of a thermal hydraulic dynamic model for the parabolic trough solar field. Energy, 156(1–3), 430–443. DOI 10.1016/j.energy.2018.05.090. [Google Scholar] [CrossRef]
28. Fu, R. H., He, Z. G., Zhang, X. (2018). Life cycle cost based optimization design method for an integrated cooling system with multi-operating modes. Applied Thermal Engineering, 140(2), 432–441. DOI 10.1016/j.applthermaleng.2018.05.082. [Google Scholar] [CrossRef]
29. Huang, Z. Y., Lu, Y. J., Wong, N. H., Poh, C. H. (2019). The true cost of “greening” a building: life cycle cost analysis of vertical greenery systems (VGS) in tropical climate. Journal of Cleaner Production, 228(3), 437–454. DOI 10.1016/j.jclepro.2019.04.275. [Google Scholar] [CrossRef]
30. Aikaterini, T., Kostas, L., Pedro, M., Fausto, F., Nikos, H. (2019). Life cycle assessment of locally manufactured small wind turbines and pico-hydro plants. International Conference on Smart Energy Systems and Technologies, pp. 1–6. [Google Scholar]
31. Kasereka, N., Jackson, G. N., Wanjiru, E. M. (2020). Multi-objective optimal sizing of grid connected photovoltaic batteryless system minimizing the total life cycle cost and the grid energy. Renewable Energy, 148(6), 1256–1265. DOI 10.1016/j.renene.2019.10.065. [Google Scholar] [CrossRef]
32. Abunima, H., Teh, J., Jabir, H. J. (2019). A new solar radiation model for a power system reliability study. IEEE Access, 7, 64758–64766. DOI 10.1109/ACCESS.2019.2916168. [Google Scholar] [CrossRef]
33. Feng, L. J., Dai, X. Y., Mo, J., Ma, Y. Z., Shi, L. (2019). Analysis of energy matching performance between CCHP systems and users based on different operation strategies. Energy Conversion and Management, 182, 60–71. DOI 10.1016/j.enconman.2018.12.006. [Google Scholar] [CrossRef]
34. Barun, K. D., Yasir, M. A. A., Ganes, H. K. (2018). Effect of load following strategies, hardware, and thermal load distribution on stand-alone hybrid CCHP systems. Applied Energy, 220(12), 735–753. DOI 10.1016/j.apenergy.2018.03.068. [Google Scholar] [CrossRef]
35. Li, L., Yu, X., W., S., Mu, H., Li, L. et al. (2018). Optimization and evaluation of CCHP systems considering incentive policies under different operation strategies. Energy, 162, 825–840. DOI 10.1016/j.energy.2018.08.083. [Google Scholar] [CrossRef]
36. Long, W. C., Luck, R., Mago, P. J. (2016). Uncertainty based operating strategy selection in combined heat and power systems. Applied Thermal Engineering, 98, 1013–1024. DOI 10.1016/j.applthermaleng.2015.12.131. [Google Scholar] [CrossRef]
37. Liu, H. D., Lin, C. H., Pai, K. J., Lin, Y. L. (2018). A novel photovoltaic system control strategies for improving hill climbing algorithm efficiencies in consideration of radian and load effect. Energy Conversion and Management, 165, 815–826. DOI 10.1016/j.enconman.2018.03.081. [Google Scholar] [CrossRef]
38. Li, H., Li, Q., Jiang, X., Ruan, Y., Huang, W. H. (2013). The application of improved hill-climb search algorithm in wind power generation. IFAC Proceedings, 46(20), 263–267. [Google Scholar]
39. He, H. L., Wu, Y., Liu, W. W., Rong, M. Z., Fang, Z. X. et al. (2019). Comprehensive modeling for geometric optimization of a thermoelectric generator module. Energy Conversion and Management, 183, 645–659. DOI 10.1016/j.enconman.2018.12.087. [Google Scholar] [CrossRef]
40. Si, L., Yu, J., Wu, W., Ma, Y., Wu, J. et al. (2017). RMHC-MR: Instance selection by random mutation hill climbing algorithm with MapReduce in big data. Procedia Computer Science, 111(1), 252–259. DOI 10.1016/j.procs.2017.06.061. [Google Scholar] [CrossRef]
41. IEA (2017). Prospects for distributed energy systems in China. http://www.bjgas.com/default.aspx. [Google Scholar]
42. Wang, Z. H., Chen, H. T., Huo, R., Wang, B., Zhang, B. (2020). Marginal abatement cost under the constraint of carbon emission reduction targets: an empirical analysis for different regions in China. Journal of Cleaner Production, 249(5), 119362. DOI 10.1016/j.jclepro.2019.119362. [Google Scholar] [CrossRef]
 | This work is licensed under a Creative Commons Attribution 4.0 International License, which permits unrestricted use, distribution, and reproduction in any medium, provided the original work is properly cited. |