| Energy Engineering |
DOI: 10.32604/EE.2021.014554
ARTICLE
Factor Decomposition and Regression Analysis of the Energy Related Carbon Emissions in Shandong, China: A Perspective of Industrial Structure
1School of Economics, Qufu Normal University, Rizhao, 276826, China
2College of Economics and Management, Nanjing University of Aeronautics and Astronautics, Nanjing, 211106, China
3School of Marxism, Fudan University, Shanghai, 200433, China
4Department of Accounting, Zhengzhou Business University, Zhengzhou, 451200, China
*Corresponding Author: Chuanhui Wang. Email: wangch2015@qfnu.edu.cn
Received: 07 October 2020; Accepted: 25 November 2020
Abstract: An in-depth study of the energy related carbon emissions has important practical significance for carbon emissions reduction and structural adjustment in Shandong Province and throughout China. Based on the perspective of industrial structure, the expanded KAYA equation to measure the energy related carbon emissions of the primary industries (Resources and Agriculture) and secondary industries (Manufacturing and Construction) and tertiary industries (Retail and Service) was utilized in Shandong Province from 2011 to 2017. The carbon emissions among industries in Shandong Province were empirically analyzed using the Logarithmic Mean Divisia Index decomposition approach. The results were follows: (1) Under the three industrial dimensions, the energy structure effect and the energy intensity effect have a restraining influence on the carbon emissions of the three industries. (2) The development level effect and the employment scale effect play a pulling role in carbon emissions. (3) From the perspective of the employment structure effect of the primary industry, there is a restraining effect on carbon emissions, while the employment structure effects of the secondary and tertiary industries play a pulling role in carbon emissions, and the employment structure effect of the tertiary industry has a greater pulling effect on carbon emissions than the secondary industry.
Keywords: Carbon emissions; industrial structure; expanded KAYA equation; LMDI decomposition; regression analysis
As the largest developing country in the world, China is also a major consumer of energy and carbon dioxide emitter. In order to cope with the increasingly constrained energy constraints limitations and increasingly severe climate warming, the Chinese government and local governments are committed to the development of a low-carbon economy and a green economy. On October 27, 2016, the State Council issued the Work Plan for Controlling Greenhouse Gas Emissions in the “13th Five-Year Plan” stating that it is necessary to accelerate the development of green and low-carbon development, ensure the completion of the low-carbon development goals and tasks defined in the “13th Five-Year Plan” and promote a national carbon dioxide peak around 2030 and strive to reach that peak as early as possible.
The scale of economy and population of Shandong Province ranks among the highest in China, making it a province with large energy needs and high carbon emissions. In response to this outstanding problem, Shandong Province has actively introduced and implemented local policies in response to the national call. In December 2011, the Shandong Provincial Government issued the “12th Five-Year Plan” for Environmental Protection in Shandong Province, proposing the goal and task of “changing mode and adjusting structure” by means of total emission reduction. Further, in April 2017, the “13th Five-Year Plan” for Ecological Environment Protection in Shandong Province emphasized the importance of ecological environmental protection and carbon emission reduction. In February 2018, the Shandong Provincial Government issued the Implementing Planning of New and Old Kinetic Energy Conversion Major Projects in Shandong Province, which proposed the main objectives of “comprehensive improvement of the ecological environment” including efficient use of energy resources, significant improvement of natural environmental quality, green and low carbonization of production and lifestyle, and so on. Since the energy consumption structure is the carrier of and manifested through the industrial structure, in-depth research and policy discussion on the relationship between industrial structure and energy related carbon emissions has important practical significance for Shandong Province. This is to accelerate the transformation process of new and old kinetic energy, and promote the transformation and upgrading of industrial structure.
Therefore, from the perspective of industrial structure, the energy related carbon emissions were calculated using the carbon emission coefficient method. And the driving factors of carbon emissions were analyzed using the expanded the KAYA equation and the LMDI (Logarithmic Mean Divisia Index) decomposition method. On this basis, it focuses on the relationship between industrial structure and carbon emissions of energy consumption using econometric analysis. And specifically, this is reflected in the contribution rate of energy related carbon emissions of the three industries and the test of fixed effects.
While the energy related carbon emissions problem caused by the rapid economic development has become increasingly prominent, the relationship between industrial structure and carbon emissions has become a hot issue for scholars.
2.1 The Decomposition of Driving Factors of Energy Consumption Carbon Emissions
There are many ways to study the factors affecting carbon emissions. Among them, the decomposition method is an important method to study the driving factors of energy and pollutants. Liang et al. [1] used the Logarithmic Mean Divisia Index (LMDI) decomposition method to explore the main factors affecting the cost of CO2 emissions in the five countries, and compared the reasons for the differences in the key influencing factors of the five countries. Liu et al. [2] used the logarithmic average Die decomposition method to establish a carbon emission model for energy consumption in the manufacturing sector, and analyzed that the output scale is the biggest driving factor for the increase in carbon emissions, and energy intensity is a strong inhibitor of carbon emissions. The influence of the two factors of energy structure is relatively small. Wang et al. [3] proposed a new carbon dioxide emission performance evaluation index using common frontier and non-radial DEA (Data Envelopment Analysis) methods. They conducted empirical analysis on the carbon dioxide emission performance and loss status of 58 countries and regions, and realized Decomposition of the sources of carbon dioxide emissions performance loss. Wang et al. [4] used pulse response and variance decomposition analysis to explore the driving effects of technological changes characterized by carbon emission intensity and energy intensity, and structural adjustments characterized by the proportion of renewable energy and industrialization rate, so as to be studied. The carbon emission reduction practices of 34 typical countries with different income levels provide references. With the help of factor decomposition models, scholars also conducted decomposition analysis on domestic energy consumption carbon emissions. Research methods include non-parametric distance function method, LMDI decomposition method, vector regression model decomposition, etc. For example, Zhu et al. [5] comprehensively considered the impact of economic output scale, population scale, industrial structure, energy structure and energy efficiency on carbon emissions, established a factor decomposition model based on the extended Kaya identity, and applied the LMDI decomposition method to energy consumption carbon The emission factor is decomposed, the mechanism of its main influencing factors is discussed and the contribution rate is quantified. Wang et al. [6] used the LMDI index decomposition method to dynamically decompose the carbon emission driving factors in the process of my country’s economic growth from time and space dimensions. Sun et al. [7] first used quantile regression to test the elastic coefficient relationship between changes in the composition of energy, industry, and population and CO2 emissions, and then used the LMDI index decomposition method to analyze CO2 emissions in the three major areas of overall, production, and life. Decomposed into scale, structure and intensity drivers, and use quantile regression method to verify the Kuznets curve characteristics of CO2 emissions under different driving incentives and different points. In addition, there are many scholars who analyze the driving factors of carbon emissions from different angles by industry, department, and region. Liu et al. [8] proposed a new generalized PDA (Production decomposition analysis) method to measure the driving factors of China's aviation industry’s carbon dioxide emissions, and consider the impact of scale efficiency changes on carbon dioxide. Wang et al. [9] used the LMDI method to identify and decompose the key factors affecting the changes in carbon emissions of my country’s service industry and their contribution values within the research sample interval. Zhu et al. [10] analyzed the impact of 14 driving factors in seven sectors on changes in carbon emissions based on the Kaya identity and its extended LMDI decomposition method. The effects of economic growth and energy intensity are the main factors leading to the continuous increase of my country’s carbon emissions.
2.2 The Relationship between Industrial Structure and Energy Related Carbon Emissions
The research on industrial structure and carbon emissions is reflected in the optimization and prediction of industrial structure.
Firstly, investigating industrial structure optimization, Jiang et al. [11] used a multi-layer LMDI decomposition analysis, to decompose and analyze the driving factors of CO2 emissions under the regional industrial transfer of the Yangtze River Economic Belt from 2000 to 2017. Niu et al. [12] used the input-output multi-objective optimization model to measure the low-carbon effect of industrial structure changes. Huang [13] established an evaluation system for industrial structure adjustment performance for Nanjing based on the rationality of industrial structure adjustment and ecological sustainability. Zhang et al. [14] constructed the carbon emission model of the industrial system based on the impact of upgrading the produce factors on the development of low-carbonization of the industrial system, through the factor decomposition of the carbon emissions of the industrial system. Shi et al. [15] took the manufacturing industry in China as a sample, and systematically optimized its industrial structure. Deng et al. [16] used static and dynamic panel models to study the impact of industrial structure upgrading and international trade on energy related carbon emissions, pointing out that the upgrading of industrial structure and the expansion of dependence on foreign trade can help reduce energy related carbon emissions.
Secondly, though researching industrial structure prediction, Zhang et al. [17] used the Markov chain prediction method to predict the industrial structure of China’s Eastern, Central and Western regions, and found that their industrial structure is still “secondary-tertiary-primary” type. Zhu et al. [18] adopted the Markov model to predict the future industrial structure of China, and further analyzed the contribution of China’s future energy intensity and industrial structure evolution to the reduction of energy intensity. Niu [19] reclassified industry and predicted the carbon emission effect of China’s industrial restructuring in the next five years based on the dynamic multi-objective optimization model. Zhang [20] predicted China’s energy consumption in 2020 from four dimensions: Total energy consumption, per capita energy consumption, industrial structure, and urban and rural population structure. Han et al. [21] established industrial restructuring, technological progress, and energy structure optimization models, and analyzed its contribution to the goal of “energy saving and emission reduction”.
Based on the existing research literature, the research objects mainly focus on energy consumption, carbon emissions, and economic growth. The research methods include factor decomposition, decoupling analysis, and others. The data processing covers panel regression, VAR (Vector Auto Regression) Model, DEA, and others. In addition, most of the research on energy structure and industrial structure is based on economic growth, and the analysis of industrial structure itself is relatively lacking in combination with energy related carbon emissions. Therefore, this article takes Shandong Province as an example. From the perspective of the industrial structure, the energy related carbon emissions of the primary, secondary and tertiary industries would be measured. Decomposition and empirical research on the driving factors of carbon dioxide emissions of three industries would be analyzed. The influence degree of driving factors under each industry through regression analysis would be analyzed further.
3.1 Calculation of Carbon Emissions
According to the availability of data and consistency of statistical quality, this paper selects the energy consumption and its composition of coal and oil products in Shandong Province from 2010 to 2017 based on the Statistical Yearbook of Shandong Province, which does not include natural gas in the calculation of carbon emissions. There are two reasons: Firstly, since 2014, energy consumption was no longer distinguished between primary energy consumption and terminal energy consumption in Shandong Province, and in 2016 the proportion of natural gas consumption was added to the energy consumption and its composition. Secondly, by intercepting the proportion of coal products and oil products, and the sum of the two data (as shown in Fig. 1) from 2010 to 2017, the sum of the energy consumption of coal and oil in Shandong Province is quite large. Although it has been declining in recent years, it is still above 87%, so it remains the main source of carbon emissions.
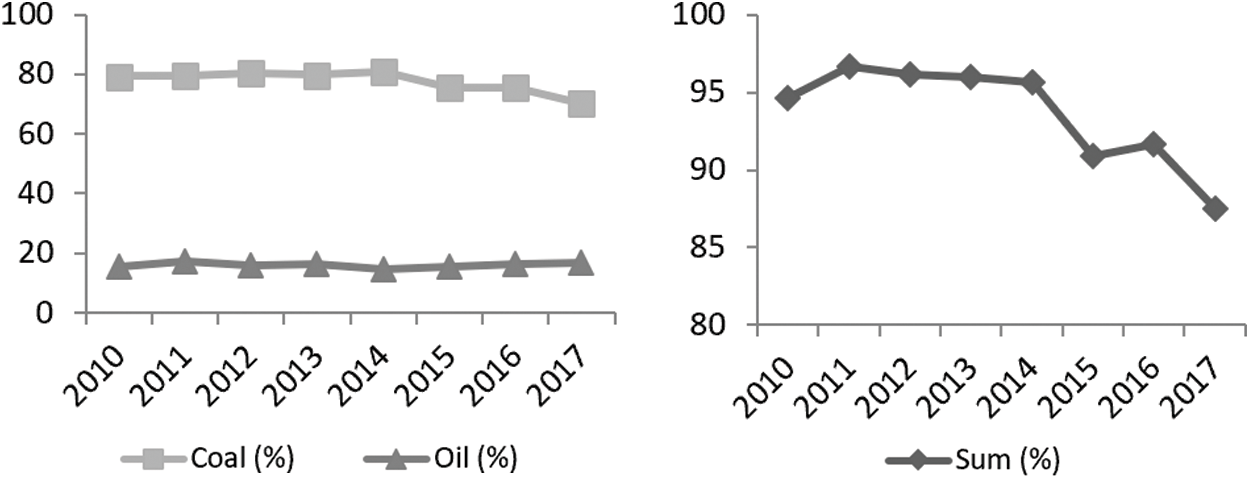
Figure 1: Trends in coal and oil consumption
Therefore, after removing natural gas, the calculation formula for carbon emissions is:
In the above formula,
It can be seen from Eq. (2) that carbon emissions can be estimated by the carbon emission coefficient of energy, energy structure, and total energy consumption.
3.2 LMDI Decomposition Based on Extended KAYA Equation
For the decomposition of energy related carbon emissions, the main methods are Structural Decomposition Analysis (SDA) and Index Decomposition Analysis (IDA). The commonly used one is IDA. In order to avoid the possibility of residuals, which allows the occurrence of 0 and negative values, this paper uses the LMDI addition decomposition method proposed by Liang et al. [1] to decompose carbon emissions in Shandong Province.
Based on the extended KAYA identity, the established carbon emissions relationship is as follows:
In Eq. (3),
Therefore, energy related carbon emissions can be decomposed into seven factors: Energy carbon emission coefficient effect, energy structure effect, energy intensity effect, industrial structure effect, development level effect, employment structure effect and employment scale effect. Using the method of LMDI addition decomposition, the decomposition formula of the change in carbon consumption ∆C from energy consumption can be obtained as follows:
In Eq. (5), the effect values of the respective decomposition factors are expressed as:
The common weights in the above formulas (6)–(12) are as follows:
where
3.3 The Formula of Contribution Rates of Industrial Carbon Emissions
In addition to the energy carbon emission coefficient effect, the contribution rates of the other six decomposition factors can be expressed as:
3.4 Regression Models of Driving Factors of Carbon Emissions
For exploring the degree of influence of each decomposition factor on carbon emissions under each industrial dimension, based on the total carbon emission effects of the three industries, the following panel models were constructed:
In the above formula,
Furthermore,
4.1 Decomposition Results of the Industrial Carbon Emissions
The decomposition results of the industrial carbon emission factors in Shandong Province by the method of LMDI addition decomposition from 2011 to 2017 are shown in Tabs. 1–3, which keep one digit after the decimal point.
Table 1: Decomposition results of primary industry

Table 2: Decomposition results of secondary industry

Table 3: Decomposition results of tertiary industry

After using the LMDI method of addition decomposition to decompose factors of the industrial carbon emissions, it can be found that:
From the perspective of energy structure effect, the driving effects of energy structure on carbon emissions during the “12th Five-Year Plan” period have decreased compared with the previous year. Except for the temporary boost to carbon emissions in 2011 and 2016, the energy structure effects are all less than 0 in the remaining years, i.e., negative effects. In general, the optimization of energy structure can be considered to inhibit carbon emissions. It can also be found from Tab. 1 that the coal accounts for the highest proportion of energy consumption, but the use of coal and the combined use of coal and oil have declined by 6% in the past seven years, since the beginning of the “13th Five-Year Plan”. This shows that the optimization of the energy consumption structure in Shandong Province has achieved remarkable results during the “12th Five-Year Plan” period. And the energy consumption mainly based on coal and oil will gradually decline from the perspective of the proportion of energy consumption structure.
From the perspective of the energy intensity effect, the effect value of the tertiary industry is always negative, inhibiting carbon emissions. The primary and secondary industries had positive effects on carbon emissions in 2015 and 2016, but cause negative effects in the remaining years. In general, reducing energy intensity can inhibit carbon emissions. Combined with the definition of energy intensity, when the economic aggregate (i.e., GDP) in Shandong Province is increasing year by year, the decline in energy intensity means that energy consumption is declining, or is slower than the rate of economic growth, so the carbon emissions from energy use will also decline. The reason is that economic progress inevitably involves technological updates, and new technologies usually mean low energy consumption.
From the perspective of the development level and employment scale effects, the development level effect values of the primary, secondary and tertiary industries are all positive, indicating that they play a strong role in producing carbon emissions. At the level of development, this paper is based on the per capita GDP of the employed people in the primary industries and secondary industries and tertiary industries, as the economy grows, the per capital GDP grows with it. Economic growth will bring about an increase in income and employment rate. In other words, the effect of development level and scale of employment will naturally increase, which means that people’s production and living activities will increase accordingly. In addition, the increase in population and consumption in production and living activities will also play a role in driving the increase in carbon emissions. The population scale effect is consistently positive with the exception of the negative effects in 2017. Therefore, the development level effect and employment scale effect can promote the growth of carbon emissions overall.
From the perspective of the employment structure effect, the effect of the primary industry is negative, which restrains carbon emissions; although the employment structure of the secondary industry shows positive effects, it also showed a downward trend in 2011–2017. The employment structure of the tertiary industry is characterized by a positive effect of gradual increase, and has a greater pulling effect on carbon emissions than the secondary industry. This shows that, on the one hand, the type of employment structure in Shandong Province is “tertiary-secondary-primary”, which means the tertiary industry has the most employees, followed by the second industry and the primary industry. On the other hand the employment structure of Shandong Province and the industrial structure based on it are developing well during the “12th Five-Year Plan” and the “13th Five-Year Plan” period.
Based on the industrial structure effect, from the perspective of the total effect, the primary and secondary industries have a restraining effect. The tertiary industry plays a driving role in carbon emissions, demonstrating that the tertiary industry in Shandong Province is developing well. The transformation and upgrading of industrial structure are proceeding in an orderly manner. The overall trend of carbon emissions from Shandong Province is strongly downward in 2011 to 2017. The carbon emissions reduction during the “13th Five-Year Plan” period is progressing well.
4.2 Analysis of Contribution Rate of the Industrial Carbon Emissions
The trends of the contribution rates of carbon emission from energy consumption of the primary industries and secondary industries and tertiary industries calculated according to the formulas (13)–(18) are shown in Figs. 2–4.
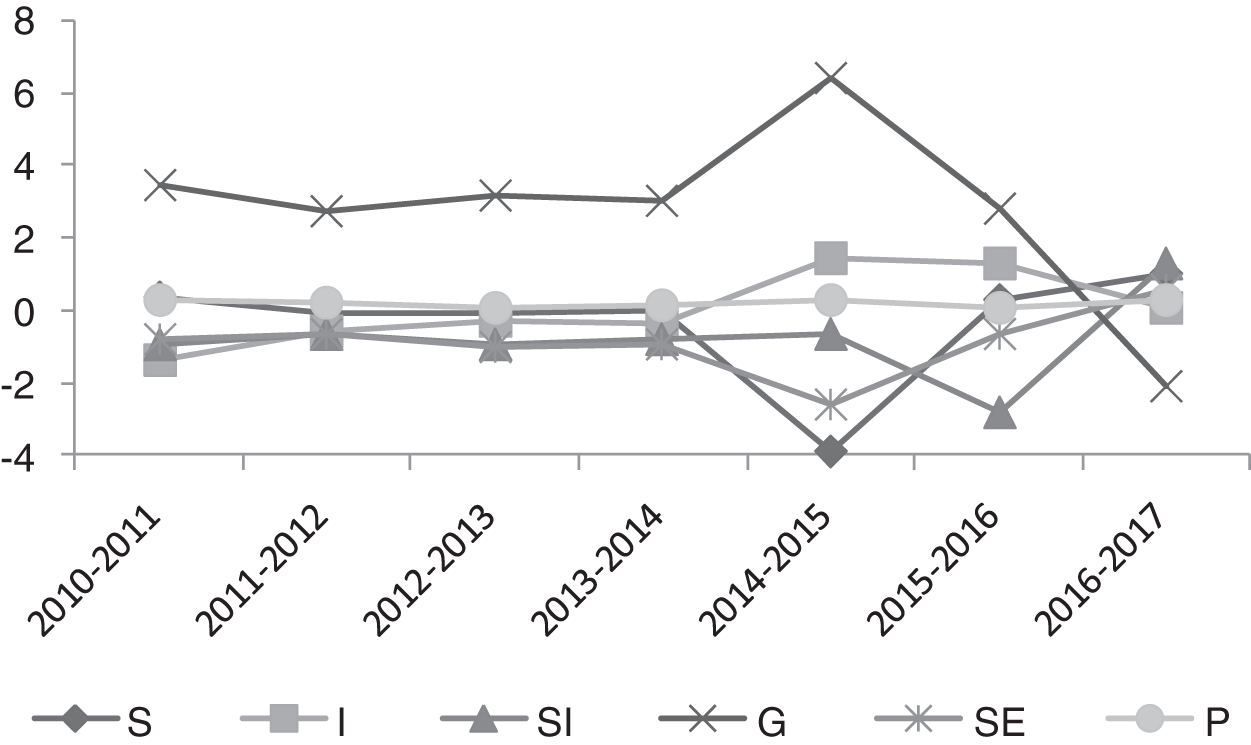
Figure 2: Contribution rate of factors in the primary industry
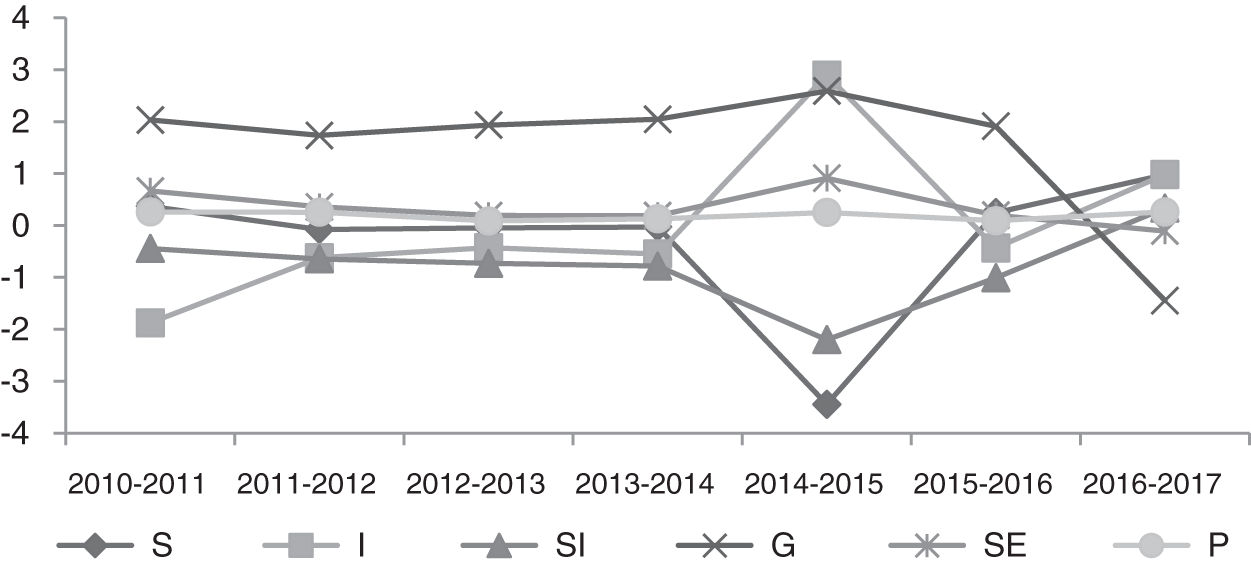
Figure 3: Contribution rate of factors in the secondary industry
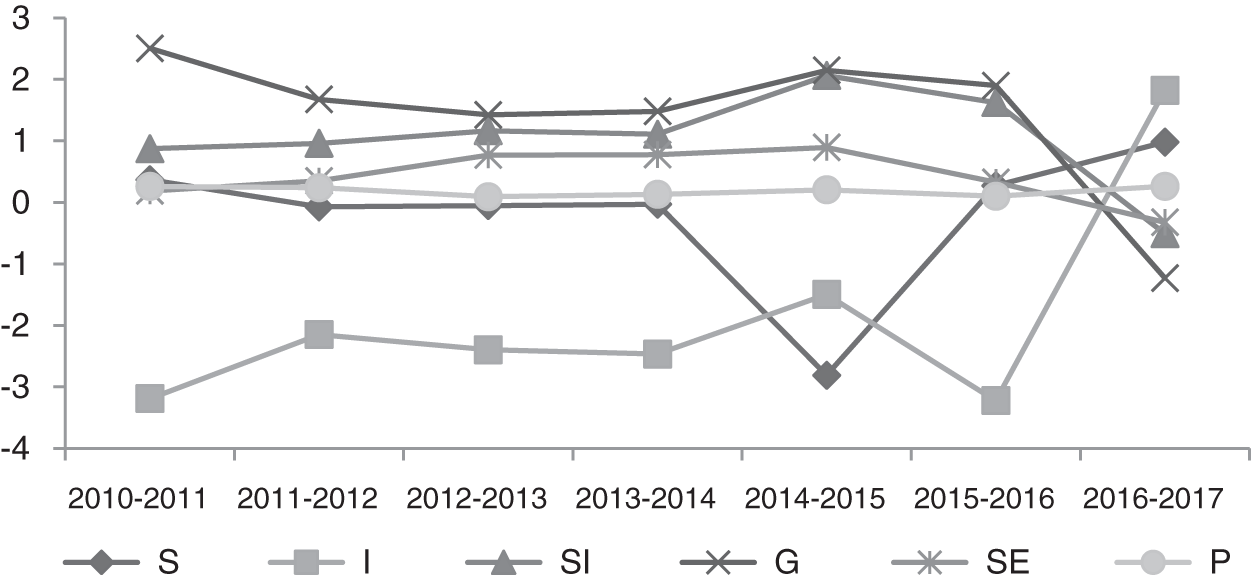
Figure 4: Contribution rate of factors in the tertiary industry
It can be seen from Figs. 2–4 that the changing trend of the contribution rate of energy structure and employment scale effects is consistent among the primary industries and secondary industries and tertiary industries; the contribution rate of the development level effect to carbon emission was greater than 0 during the period of the “12th Five-Year Plan”.
By the beginning of the “13th Five-Year Plan” (2016), there was a relatively noticeable downward trend. The primary industry began to show a downward trend in 2015, and the development level effect is the lowest among the contribution rate of the six drivers among the primary industries and secondary industries and tertiary industries in 2017; the energy intensity effect of the primary industry has not changed much. Due to the high energy-consuming industries in the secondary industry, the energy intensity of the secondary industry has changed significantly, reaching a peak in 2015. The energy intensity effect of the tertiary industry has fluctuated and risen rapidly from 2016. By 2017, the contribution rate of the energy intensity effects in the primary industries and secondary industries and tertiary industries is ranked as “tertiary-secondary-primary.” This shows that, on the one hand, some achievements have been made in the transformation and upgrading of industrial structure. On the other hand, it shows that the energy intensity of the tertiary industry is still affected by other aspects such as employment structure, employment scale, and so on, resulting in a significant increase in its contribution rate to carbon emissions.
4.3 Basic Regression and Results Analysis
Because the panel data used in this article has a short time span, it is a short panel. It may have omitted variables that do not change over time, and there are differences due to factors affecting carbon emissions of various industries. In addition, the fixed-effect model can estimate the errors of the disturbance terms, individual heterogeneity, time heterogeneity, and endogenous problems that may lead to endogenous problems, and improve the consistency of the estimation results. Therefore, this article chooses the fixed effects model. The regression results are shown in Tab. 4.
Table 4: Fixed effect test results

In Tab. 4, “FE” means fixed effect. It can be seen from the test results that the energy structure, energy intensity, and employment scale have passed the test. Among them, the energy structure and employment scale are significant at the 1% level, and the energy intensity is significant at the 10% level.
Using the basic regression method, the results are shown in Tab. 5. Three columns of the a/c/e represent the regression results of the three industries when the control variables are not added, and b/d/f are the results after adding the control variables.
Table 5: Regression results of three times industry

Tab. 5 shows the influence coefficient of various factors on carbon emissions under the industrial structure dimension. Through R2, it can be found that the model is significant and the fitting degree is high. The specific analysis is as follows:
Before adding the control variables, the energy structure, energy intensity and employment scale have a positive impact on the carbon emissions of each industry. After the basic regression of the three industries, regardless of whether or not the control variable is added, the employment scale effect is positive and the coefficient is large from the perspective of employment scale, indicating that the employment scale has the greatest impact on carbon emissions.
From the perspective of the development level effect, the coefficient of the primary and tertiary industries is negative, and the secondary industry is positive. This shows that the primary and tertiary industry activities correlate negatively with carbon emissions, and the secondary industry activities correlate positively. Because the secondary industry includes heavy industry and other processing and manufacturing industries, the use of energy and the corresponding carbon emissions are both higher than those of the primary and tertiary industry. This results in it being positively correlated. The carbon emissions generated by the primary and tertiary industrial activities are relatively small. Considering the absolute value of the model regression coefficient, the tertiary industry is 1.371 and the primary industry is 0.402, which shows that the tertiary industry has a greater negative impact on carbon emissions, i.e., the relationship of reverse change, which illustrates the necessity of industrial structure transformation and the transition from the primary and secondary industries to the tertiary industry structure.
From the perspective of employment structure effect, the coefficient of the primary industry is negative, and the coefficient of the secondary and tertiary industries is positive. The explanation is as follows: The primary industry is mainly agriculture, forestry, animal husbandry and fishery. The impact of this industrial activity on carbon emissions is the smallest compared to the secondary and tertiary industries, or it can be considered that there is effectively no carbon emission, so the greater the employment in the primary, the fewer overall carbon emissions. With the development of industrialization and urbanization, the employment within the secondary industries and tertiary industries are higher than that of the primary industry, so the impact on carbon emissions is also greater. But it can be seen from the coefficient that although the secondary and tertiary industry are all positive, the secondary industry coefficient (0.390) is higher than the tertiary industry coefficient (0.091), which also shows that the employment structure effect of the secondary industry has a greater impact on its carbon emissions than the tertiary industry. At the same time, on the premise that the total number of employed persons remains unchanged, the more employment in the secondary industry, the greater the impact on carbon emissions. Since the employment structure takes employment structure as carrier, it is not only to promote the transformation of the employment structure, but also the inevitable requirement for the transformation and upgrading of the industrial structure, while encouraging and supporting people to engage in the tertiary industry.
Achieving environmental protection and high-quality economic development is the goal of various regions in China. This article takes Shandong Province as an example. From the perspective of the industrial structure, the carbon dioxide emissions from energy consumption of the three industries are measured. Decomposition and regression analysis on the driving factors of carbon dioxide emissions of three industries are analyzed. The following conclusions are drawn:
First of all, energy structure and energy intensity have a depressing effect on the carbon emissions of the three industries. It shows that Shandong Province has achieved good results in energy structure adjustment and energy consumption conservation from the “12th Five-Year Plan” period to the “13th Five-Year Plan” period. Secondly, from the perspective of development level and employment scale, the three industries all play a role in driving their respective carbon emissions. It shows that the impact of living activities on carbon emissions is positive. Combined with the regression result coefficients, it can be further found that this pulling effect is especially the secondary industry, and the primary and tertiary industries have a small pulling effect. Finally, from the perspective of the employment structure and the industrial structure relying on it, the employment structure effect of the primary industry is negative, which has a restraining effect on carbon emissions. Although the employment structure of the secondary and tertiary industries shows a positive effect, which is consistent with the model regression coefficient. However, the employment structure effect of the tertiary industry has a greater reduction effect on carbon emissions than the secondary industry.
The above research conclusions have important policy implications. Considering the overall technological progress, the development and use and promotion of new energy should be accelerated. Under the new situation of the conversion of new and old kinetic energy, the energy structure should be further optimized. And energy intensity should be reduced, which means energy efficiency should be improved. From the perspective of carbon emission reduction policies, employment in the tertiary industry should be encouraged and supported and consumers’ living standards should be improved accordingly, including raising wages and improving welfare.
Acknowledgement: This paper benefited from years of thinking about these issues and the discussion with many colleagues related to economics at that time. In particular, I would like to thank the chief editor of this journal and the anonymous reviewers for their helpful comments on future drafts.
Funding Statement: The research is supported by the National Natural Science Foundation of China under Grants 71804089 and 71771138, Humanities and Social Sciences Youth Foundation of Ministry of Education of China under Grants 18YJCZH034 and 19YJC790128, Jiangsu Post-doctoral Research Funding Plan (2018K195C), Natural Science Foundation of Shandong Province, China under Grant ZR2018LG003, and Social Science Planning Project Foundation of Shandong Province, China under Grant 16CGLJ09.
Conflicts of Interest: The authors declare that they have no conflicts of interest to report regarding the present study.
1. Liang, D. P., Liu, T. S., Li, Y. J. (2015). A comparative study on the cost of carbon dioxide emissions and its influencing factors in the five BRIC countries based on the LMDI model. Resources Science, 37(12), 2319–2329. [Google Scholar]
2. Liu, Q. C., Kong, L. Q., An, Z. Y. (2014). Analysis of energy-related carbon emission factors in China’s manufacturing industry. China Population, Resources and Environment, 24(S2), 14–18. [Google Scholar]
3. Wang, Q. W., Zhou, P., Zhou, D. Q. (2014). Production technology heterogeneity, carbon dioxide emissions and performance loss: An international comparison based on common frontiers. Science Research, 35(10), 41–48. [Google Scholar]
4. Wang, X. N., Duan, Z. Y., Wang, P. B., Song, J. N., Wang, S. et al. (2018). Measurement of carbon emission driving effects of typical national technological transformation and structural adjustment from 1990 to 2014. Resources Science, 40(11), 231–2327. [Google Scholar]
5. Zhu, Q., Peng, X. Z., Liu, Z. M., Wu, K. Y. (2009). Factor decomposition and empirical analysis of carbon emission changes in China’s energy consumption. Resources Science, 31(12), 2072–2079. [Google Scholar]
6. Wang, X. F., Yu, J. B. (2014). Research on dynamic trajectory of driving factors of carbon emission in China. Economics, (4), 40–48. DOI 10.16158/j.cnki.51-1312/f.2014.04.007. [Google Scholar] [CrossRef]
7. Sun, Z. R., Zhou, D. Q., Zhou, P., Bai, J. H. (2015). Research on Kuznets curve characteristics of structural changes and carbon dioxide emissions—Based on the method of combining quantile regression and exponential decomposition. Mathematical Statistics and Management, 34(1), 59–74. [Google Scholar]
8. Liu, X., Zhou, D. Q., Zhou, P., Wang, Q. W. (2017). What drives CO2 emissions from China’s civil aviation? An exploration using a new generalized PDA method. Transportation Research Part A: Policy and Practice, 99, 30–45. [Google Scholar]
9. Wang, K., Li, J., Tang, Y. L., Liu, H. L. (2013). Energy consumption carbon emission calculation and analysis of influencing factors in China's service industry. China Population, Resources and Environment, 23(5), 21–28. [Google Scholar]
10. Zhu, B. Z., Wang, K. F., Wang, P. (2015). Research on the driving factors of China’s carbon emission growth in different stages. Economic Perspectives, (11), 79–89. [Google Scholar]
11. Jiang, H., Geng, Y., Tian, X., Zhang, X., Chen, W. et al. (2020). Uncovering CO2 emission drivers under regional industrial transfer in China’s Yangtze river economic belt: A multi-layer LMDI decomposition analysis. Frontiers in Energy, 1–16. DOI 10.1007/s11708-020-0706-z. [Google Scholar] [CrossRef]
12. Niu, H. L., Jiang, K. S. (2012). Low carbon effect measurement of industrial structure adjustment—Based on NSGA-II genetic algorithm. Industrial Economics Research, (1), 62–69+94. DOI 10.13269/j.cnki.ier.2012.01.007. [Google Scholar] [CrossRef]
13. Huang, N. (2013). Research on performance evaluation and improvement countermeasures of industrial structure adjustment in Nanjing. Nanjing Journal of Social Sciences, (3), 148–154. DOI 10.15937/j.cnki.issn1001-8263.2013.03.020. [Google Scholar] [CrossRef]
14. Zhang, W., Zhu, Q. G., Gao, H. (2016). Industrial structure upgrading, energy structure optimization and industrial system low carbon development. Economic Research Journal, 51(12), 62–75. [Google Scholar]
15. Shi, D., Zhang, C. (2017). Systematic optimization of China’s manufacturing industry structure—Analysis from the perspective of output structure optimization and factor structure matching. Economic Research Journal, 52(10), 158–172. [Google Scholar]
16. Deng, G. Y., Han, J., Zhang, Z. J. (2018). The dynamic evolution of industrial structure upgrading, international trade and carbon emissions of energy consumption. Soft Science, 32(4), 35–38+48. [Google Scholar]
17. Zhang, H., Wang, F. L., Suo, R. X., Shen, L. M. (2010). Prediction of industrial structure in eastern, central and western China based on Markov model. Mathematics in Practice and Theory, 40(14), 39–44. [Google Scholar]
18. Zhu, Y. B., Liu, C. X., Wang, Z., Wang, Y. J. (2013). Analysis of the evolution trend of China's industrial structure and its emission reduction potential. China Soft Science, (2), 35–42. [Google Scholar]
19. Niu, H. L. (2016). Prediction of carbon emission effect of industrial structure adjustment in China—Based on dynamic multi-objective optimization model. Journal of Technical Economics & Management, 11, 17–21. [Google Scholar]
20. Zhang, S. (2017). Feasibility analysis of the energy consumption “13th Five-Year Plan” target—Based on multidimensional prediction detection. Journal of Industrial Technological Economics, 36(9), 78–84. [Google Scholar]
21. Han, Z. H., Qi, C., Liu, M. H. (2018). Research on the realization path of the goal of “energy saving and emission reduction” in the 13th Five-Year Plan. Journal of Arid Land Resources and Environment, 32(3), 23–27. [Google Scholar]
 | This work is licensed under a Creative Commons Attribution 4.0 International License, which permits unrestricted use, distribution, and reproduction in any medium, provided the original work is properly cited. |