| Energy Engineering |
DOI: 10.32604/EE.2021.014650
ARTICLE
Will Coal Price Fluctuations Affect Renewable Energy Substitution and Carbon Emission? A Computable General Equilibrium-Based Study of China
1College of Economics and Management, Shanghai University of Electric Power, Shanghai, 200090, China
2Zhejiang Electric Power Construction Co., Ltd., Ningbo, 315000, China
3Zhejiang Huayun Electric Power Engineering Design Consulting Co., Ltd., Hangzhou, 310014, China
4Fintech Research Institute & School of Information Management and Engineering, Shanghai University of Finance and Economics, Shanghai, 200433, China
5State Key Joint Laboratory of Environment Simulation and Pollution Control (SKLESPC), School of Environment, Tsinghua University, Beijing, 10084, China
6State Grid Integrated Energy Planning and D&R Institute, Beijing, 10084, China
*Corresponding Author: Yibo Yin. Email: yiboyin@163.com
Received: 18 October 2020; Accepted: 10 December 2020
Abstract: Changes in the energy price system will determine the direction of evolution of the energy industry structure. As a country where coal is the dominant energy source, what is the effect of coal price fluctuations on China’s industry development costs and energy consumption structure? To investigate this problem, this paper utilized an economy–energy–environment computable general equilibrium model. In this study, four aspects were analyzed: Energy supply side, proportion of renewable energy consumption, macroeconomy, and changes in CO2 emissions. The results of this study show that an increase of 10%–20% in coal prices contributes to a shift into using renewable energy, which leads to energy saving and emission reduction. Renewable energy and clean energy rose by 0.57%–4.47% in the energy structure, but this has a certain negative impact on the macroeconomy. The gross domestic product (GDP) fell by 0.07%–0.18%. As a result, the decline in coal prices became an obstacle to renewable energy substitution and energy conservation. In addition, we put forward policy suggestions according to the results in energy, economic, and environmental effects.
Keywords: Coal price; computable general equilibrium; multi-scenario simulation; renewable energy
Fossil energy is an important foundation for economic and social development, and it played a key role in the progress of human civilization. However, the depletion of fossil energy and the greenhouse gas it emits are becoming increasingly prominent and becoming an important issue affecting the sustainable development of human civilization [1]. The development of renewable energy has become an essential means to solve the aforementioned problems. Furthermore, because of greenhouse gas emissions, climate change has become a global problem [2]. As the world advances, the development of clean renewable energy is essential [3]. In the United States, natural gas and photovoltaic systems are used instead of coal [4] or thermal power [5]. Germany, Spain, and Poland are gradually replacing thermal energy with renewable energy. In Japan, policy reforms have been accelerated to encourage the use of renewable energy and lessen coal dependence. As a result, Japan has made great effort in investing in clean energy technologies. In 2018, Germany’s renewable energy generation reached more than 40%, and the United States’ renewable energy generation reached 17.6%. In addition, the Netherlands’ solar power generation increased by 50% compared to the previous year, and the country’s renewable energy generation reached 17%. As the world’s largest developing country, China is also actively promoting the production of clean energy and electricity. As a result, China’s renewable energy generation reached 26.5% in 2018 [6].
As coal prices are closely related to thermal energy prices [7,8], rising coal prices will increase the cost of thermal energy, leading to higher thermal energy prices. Therefore, coal price is an important factor affecting the energy market and the renewable energy substitution. However, existing research on coal prices focused more on its impact on macroeconomics, industry development, and industrial structure adjustment. He et al. [9] believe that coal prices are closely related to China’s economy, and Jiao et al. [10] believe that the coal–electricity price linkage mechanism has a great impact on the profitability of Chinese power generation companies. Other authors believe that the adjustment of industrial structure can be achieved through the coal price elimination mechanism of backward production capacity [11].
As the world’s largest coal producer and consumer, China’s current energy use pattern is still dominated by coal and other fossil energy sources [12]. Owing to various factors such as China’s resource characteristics, renewable energy technology level, and stable economic growth, coal will continue to dominate in the next two decades. According to BP’s 2019 Energy Outlook, coal will still account for 36% of China’s energy structure by 2040 [6]. In China, the total electricity output consists of thermal power, hydroelectricity, nuclear power, and others. Thermal power accounts for over 62% of the total generating capacity. Over 60% of the total coal output in China is supplied to generate electricity. Therefore, the fluctuation of coal prices has a great impact on the electric power industry. China’s second round of power market reform has established a good market environment, and various types of power are fully competitive [13]. Since the marketization of China’s coal prices in 2013 and since the second round of electricity market reforms in 2015, coal prices and electricity prices have been effectively linked [14]. Some research shows that coal and the renewable energy market have a close relationship in China [15]. Fuel cost is the biggest cost item in thermal power plants, accounting for 70% of the variable costs. The rise in coal prices, especially the coal price for electricity generation, directly increases the operating costs of the enterprise and reduces corporate profits [16]. Therefore, the price of coal will inevitably affect the cost of thermal power generation and thus the on-grid price of thermal power, and the quotations of thermal power companies will directly affect the quotations of other renewable energy generators. And ultimately have an impact on the development of renewable energy [17].
Meanwhile, reducing the carbon emission in the power sector can play a crucial role to limit global warming [18]. The coal prices have a great impact on the carbon emission [19], but most of the current research on carbon emissions is about carbon taxes and carbon trading. Studies have shown that the reasonable price range of carbon tax is 18.37~38.25 yuan/ton and that carbon tax has a strong correlation effect with coal [20]. The total amount of carbon emission decreases while the carbon tax is levied, and a positive correlation is found between the tax rate and the emission reduction amount [21]. Coal prices are closely related to thermal power [22], and thermal power plants are one of the main sources of carbon emissions, so coal prices also have a great impact on carbon emissions.
In this study, the computable general equilibrium (CGE) model is used to analyze policy impact [23–25]. Compared with other models, the CGE model has a more reliable parameter estimation and faster calculation speed. Li et al. [26] and Li et al. [27] proposed a dynamically CGE model embedded in a carbon trading module to study the economic impact of the implementation of emissions trading system (ETS). Tang et al. [28] proposed an ETS policy design, including carbon emission caps, permit allocation, and supplementary policies (punishment and subsidy policies). Liang et al. [29] used the CGE model to study the impact of different tax plans on China’s macroeconomics, sector profits, and carbon emissions. Based on the characteristics of the CGE model, our model is suitable for studying the impact of coal prices on renewable energy substitution. Our study fills the gap in the application of the CGE method.
Although coal price is an important factor that affects the market, there are only a few literatures that have studied the impact of coal price increases on the power industry or on China’s economy [30]. In addition, this study assessed the relationship between fluctuations in coal prices and renewable energy substitution and carbon emissions. The suggestions to policy makers are of reference to countries with similar energy structures.
The main contributions of this study are as follows:
1. This study investigates the impact of coal price fluctuations on renewable energy substitution in the context of a new round of market reform in China, which is an exploration of new laws in the new environment.
2. In this study, a CO2 emission module is added to the traditional CGE model, and a 7-layer nesting function is established according to the energy structure of the production module.
3. This study set the coal price change range according to the historical coal price changes and regulatory policies and analyzed the four aspects, including energy supply side, energy consumption ratio, macroeconomics, and pollution emission, that has important policy significance and reality value.
The remainder of this study is organized as follows: Section 2 introduces the establishment of the CGE model and the specific parameters and data of the model. Section 3 analyzes the coal price, energy supply side, renewable energy consumption, carbon emissions, and impact of coal price on China’s macroeconomy. Section 4 gives the study’s conclusions and policy implications.
The CGE model established in this study has two parts: the standard CGE model that includes production activities, income and consumption, investment and savings, and the trade sector, as well as the equilibrium and closure of the model, and the pollutant emission model. In this study, a CO2 emission module was established, and the emission factor method was used to measure the amount of CO2 emission.
This study is based on China’s 2017 input–output table [31], with actual requirements summarized into agriculture, coal industry, oil industry, gas industry, metal smelting industry, chemical industry, light industry, manufacturing, energy sector, transportation industry, service industry, and other departments. At the same time, according to China’s energy generation in 2017, the energy sector is subdivided into thermal power, wind and solar power, nuclear power, and hydropower. The parameters and variables used in this research are obtained from the 2017 Input–Output Table, China Energy Statistics Yearbook [32], and China Financial Yearbook [33]. The method structure is shown in Fig. 1.
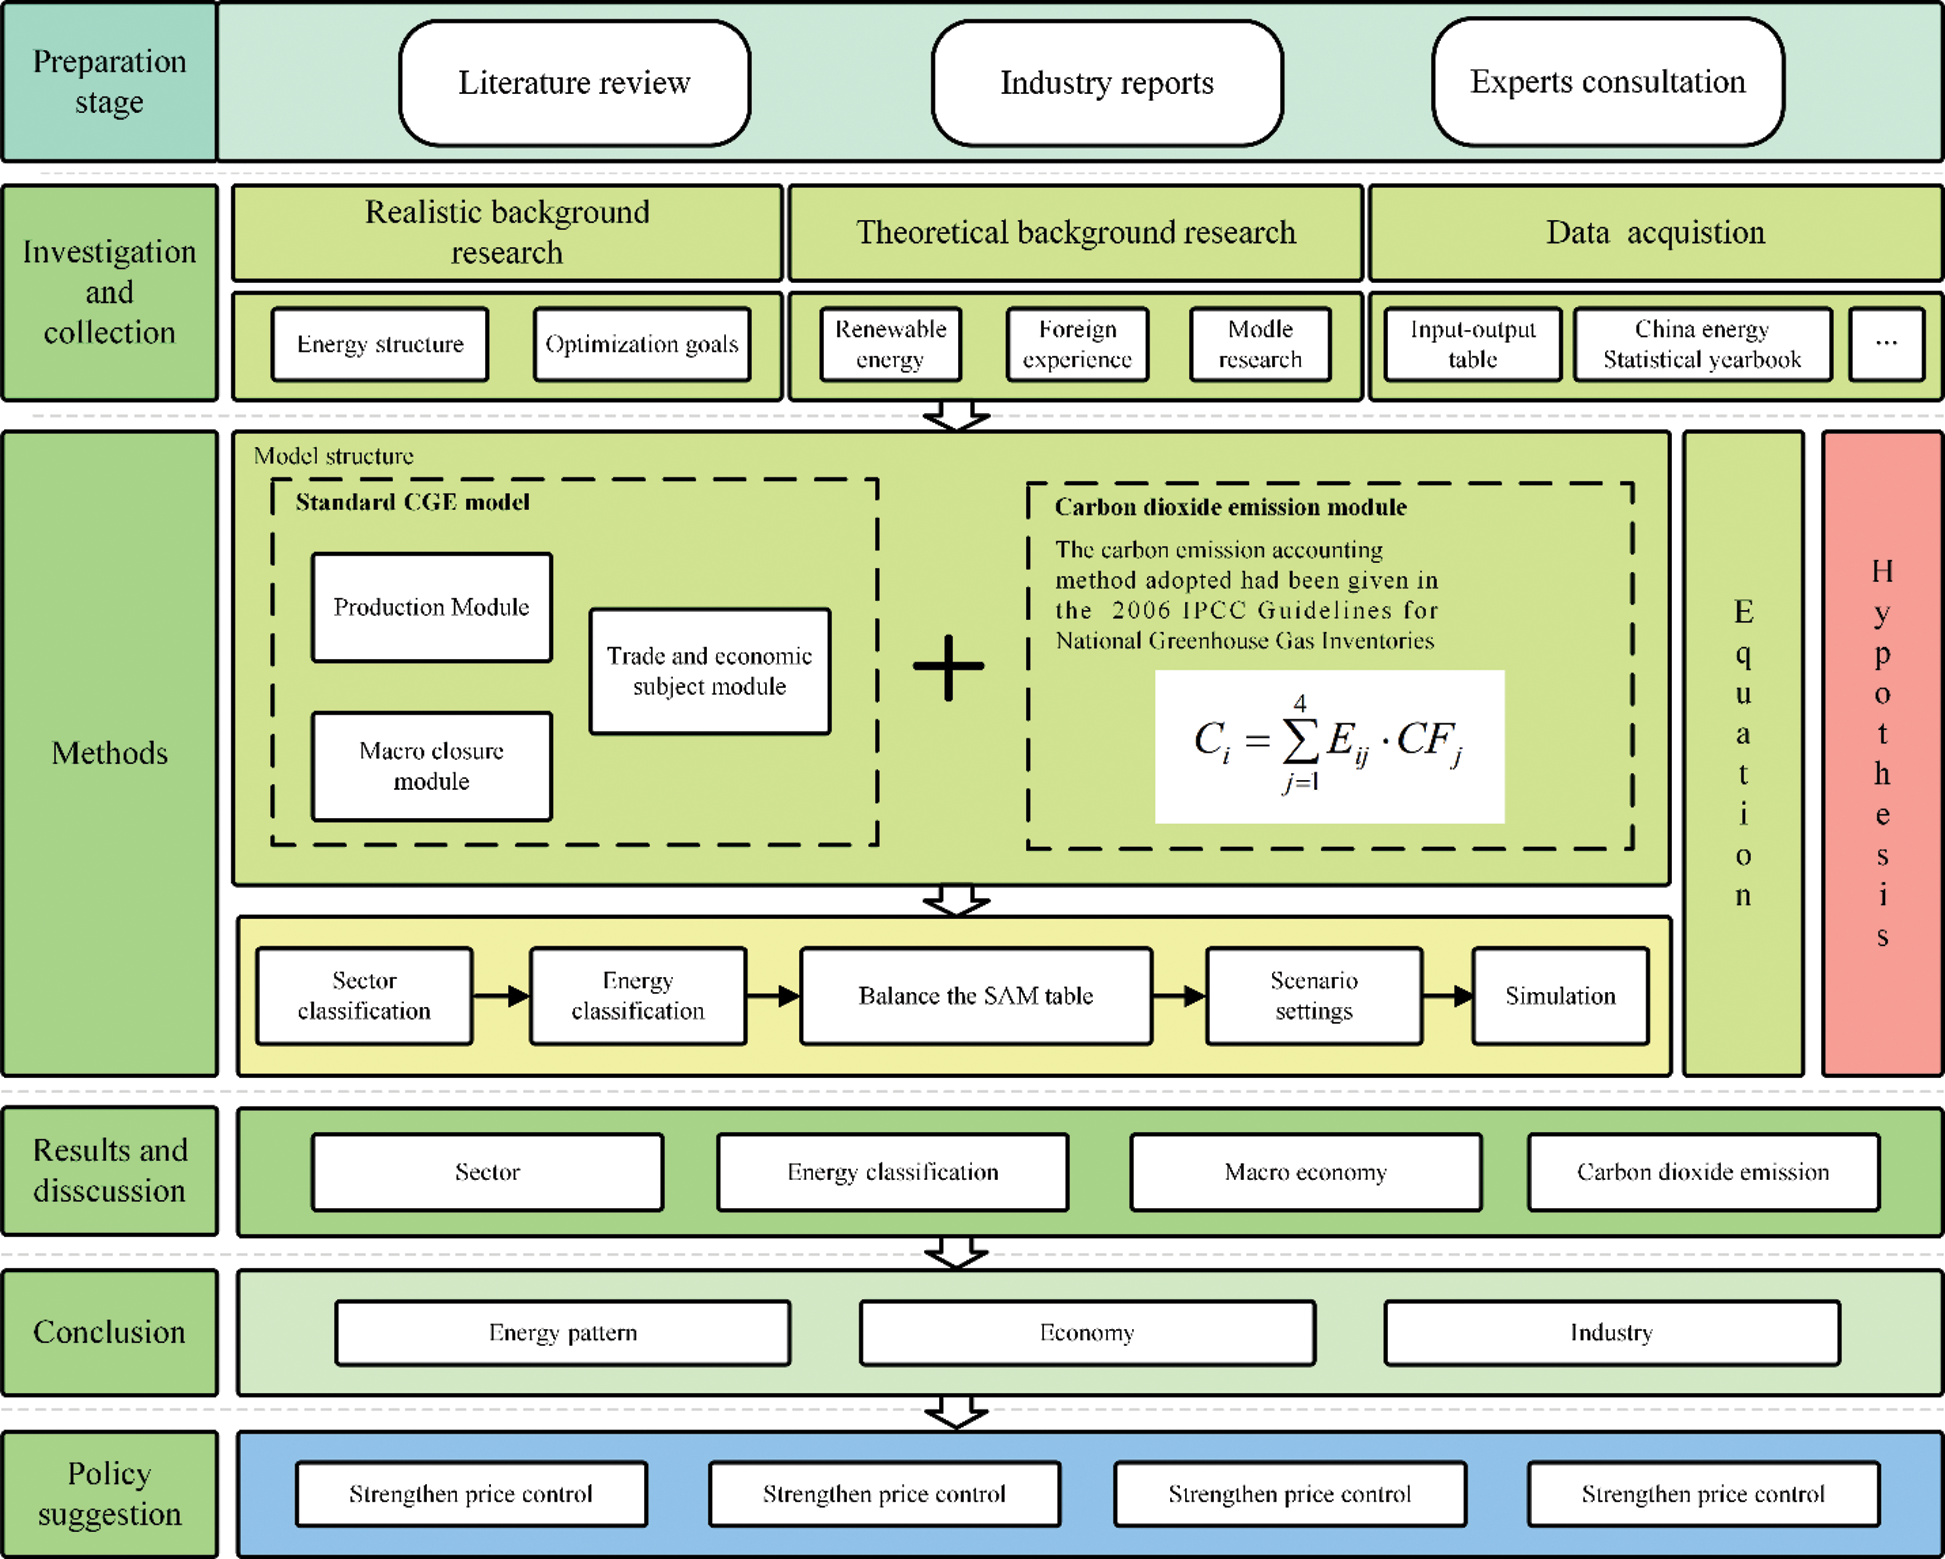
Figure 1: The structure of the methods
The structure of the production module is shown in Fig. 2.
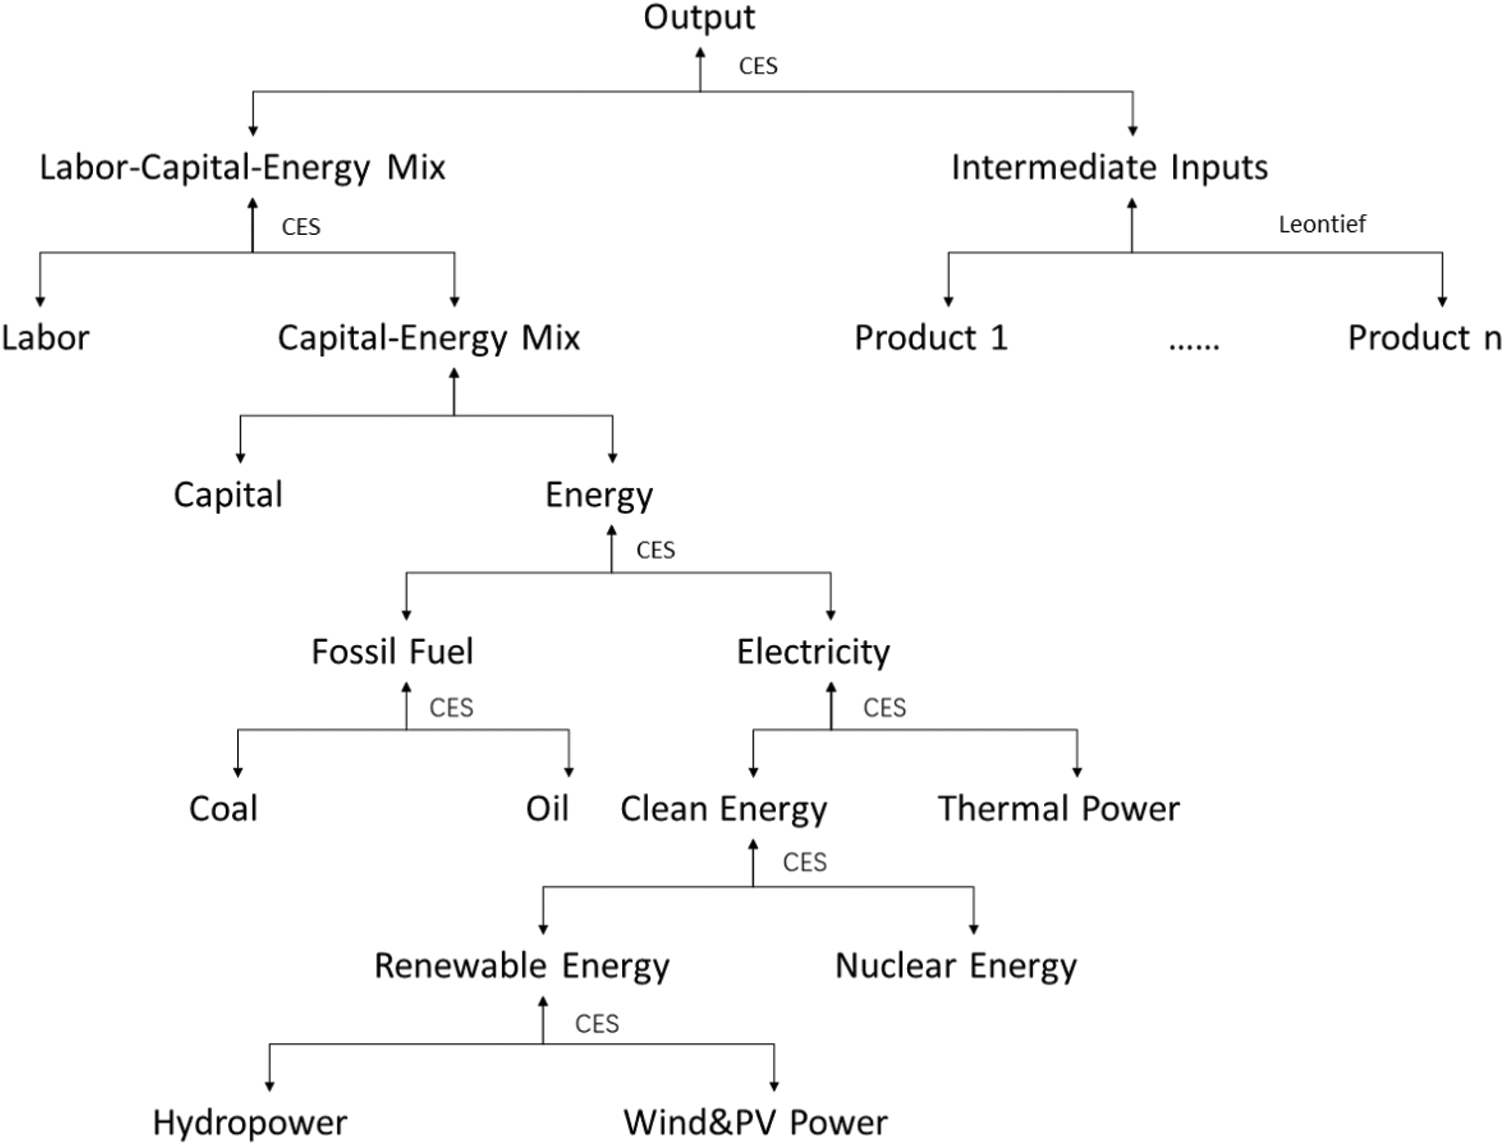
Figure 2: Production module structure
In the production module, the most common constant elasticity of substitution (CES) function in the CGE model and the Leontief function are used to model the input. The total output in the production module is synthesized using seven levels of nested production functions. According to the principle of minimizing production costs, the production module takes various renewable energy sources as a production factor and initial input, using energy, capital, and labor. Incomplete substitution is aggregated as the added value of the basic elements of the labor–capital–energy bundle. Both power and energy products are aggregated using the CES function: the fifth layer fossil energy composite function is shown in Eqs. (1)–(4). To study the impact of fossil energy price changes on renewable energy substitution, an energy change factor k is added, and the change factor k is used to simulate the impact of coal energy price changes on renewable energy.
where
Fossil energy price changes are mainly reflected in the production function of fossil energy. When the coal price change rate changes from −20% to 20% and the oil price change rate is 0, the coal price changes to
2.1.2 Trade Module and Economic Subject Module
This module mainly describes the demand for products in the domestic market. According to basic economic theory, the final demand of the economy in the model includes three parts: consumption, investment, and export.
Consumer demand can be divided into resident consumption and government consumption. Among them, resident consumption is determined by the residents’ disposable income and marginal propensity to save. The total consumption of residents is allocated to different consumer goods using an expanded linear expenditure system. The income of residents comes from the return of labor and capital factors owned by residents in the production process. Government consumption is determined by government revenue, and similarly, an extended linear expenditure system is allocated to different consumer goods. In addition, government revenue comes from various taxes. In the model, it includes indirect taxes in the production sector, tariffs on imported products, and income taxes from the corporate sector and the resident sector.
Similar to other CGE models, the CGE model we used in this study adopts the Armington hypothesis in the trade module. There is no complete replacement between domestic production and imported production, but there is a certain amount of substitution. China is a typical developing country [9], and its import prices are exogenous, determined by world prices. Assuming that there is an incomplete substitution relationship between domestic sales and export products, the export part uses a constant elastic transformation (CET) function to allocate domestic output between domestic sales and exports. The structure of the module is shown in Fig. 3.
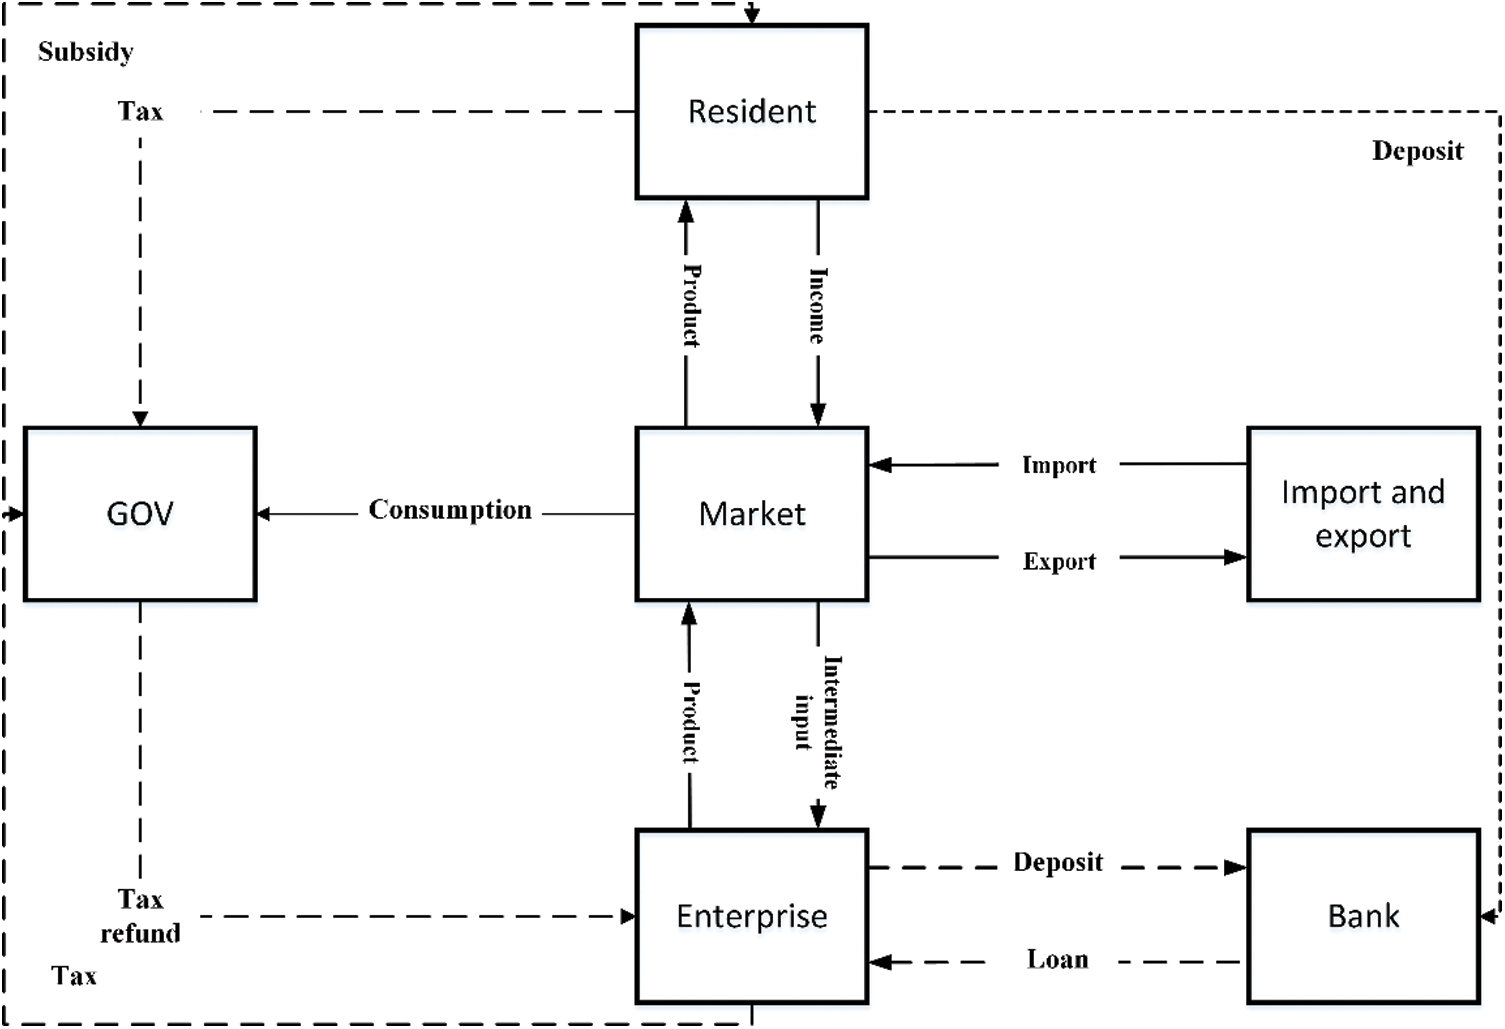
Figure 3: Circular connection diagram among various economic agents
This module defines the system constraints the model must meet. The macro-closed part of the model includes three aspects. First, suppose that the exchange rate is given exogenously, the savings in the foreign sector are endogenous, and the foreign savings are equal to the difference between foreign income and expenditure. Second, assume that the tax rate of the government department is given exogenously and the savings of the government department are endogenously determined. Third, the neoclassical macro-closure criterion was adopted, that is, the total social investment and the total social savings were equal.
General equilibrium refers to a relatively balanced and stable state where the production quantities and market prices of various markets and various commodities in the economic system are under certain technical conditions, including factor market equilibrium, commodity market equilibrium, and savings–investment balance, government balance of payments, and international balance of payments [9].
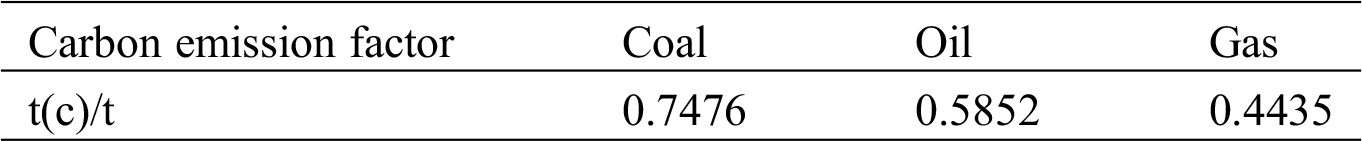
In addition to the standard CGE module, the CO2 emission module is also crucial. The calculation methods for emission factors are widely accepted in the macroeconomic analysis [1]. Therefore, we adopt this carbon emission-accounting method. The calculation idea is to estimate the carbon emissions through the carbon dioxide emission coefficients released during the combustion of various energy types. The carbon emission-accounting method adopts the method given in the 2006 IPCC Guidelines for National Greenhouse Gas Inventories [34], and the calculation formula is shown in Eq. (5):
where
The consumption data of various types of energy in the energy industry were derived from the China Energy Statistical Yearbook. The carbon emission coefficients of various energy sources in this study are shown in Tab. 1.
Table 1: The carbon emission coefficient
With the continuous deepening of market-oriented reforms, China’s coal industry has formed a nationwide and orderly coal trading market system, and coal prices have gradually entered the market-oriented trading stage. China’s coal prices showed an upward trend from 2009 to 2011. The average price of coal per ton reached the peak of 819.00 yuan in 2011, a 9.71% increase from the previous year, but there was a significant downward trend in coal prices from 2012 to 2015. The rate of decline was faster. In 2015, the national coal price per ton fell to 424.80 yuan, a 18.46% decrease (Fig. 4).
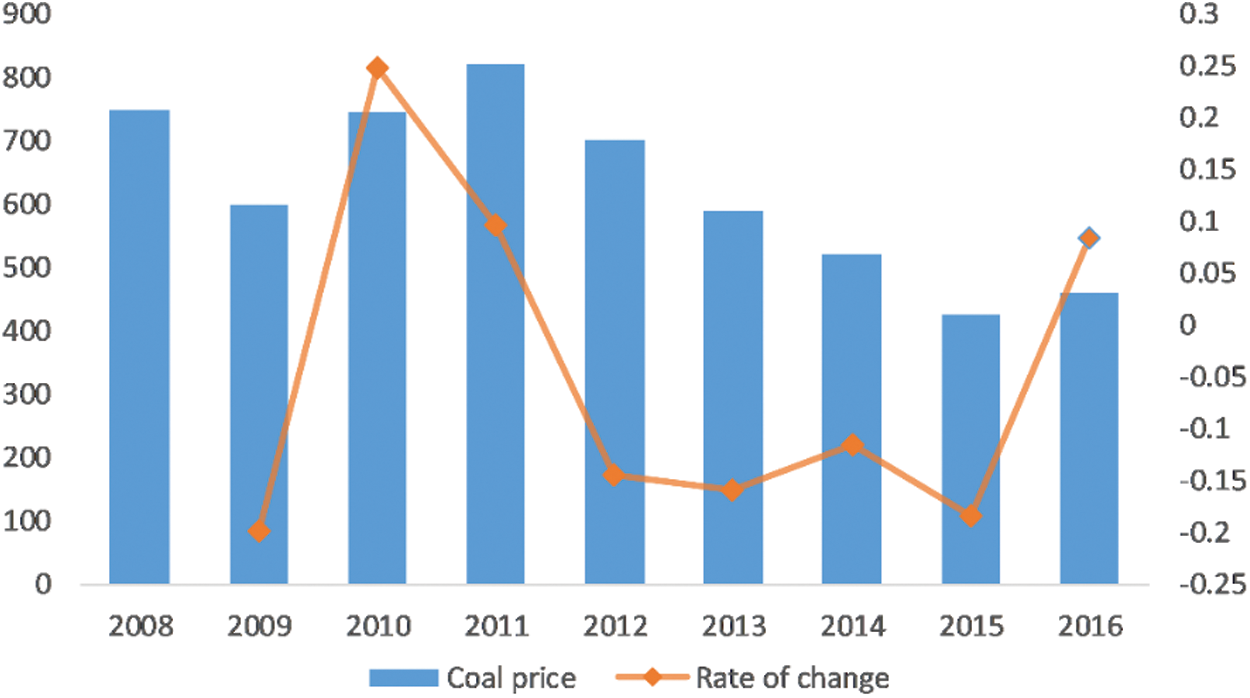
Figure 4: Coal price and its rate of change from 2008 to 2016
The marketization of coal prices began in 2012. In order to more comprehensively observe the fluctuations in coal prices before and after marketization, we selected the average coal market prices from 2008 to 2016 and set four scenarios, which are coal price increases of 10% and 20% and declines of 10% and 20%, according to the rate of change in coal price. The maximum increase and maximum decrease are both around 20%.
To study the impact of coal price on renewable energy substitution, the same four scenarios were set up for each abovementioned situation (Tab. 2).

This study analyzed the economic and environmental impact of the relative price of coal on renewable energy substitution from four perspectives. First, the differences in the energy structure from changes in the total domestic production and domestic production prices of renewable energy and other sectors are analyzed. Second, the changes in the total consumption of renewable and clean energy are analyzed. Furthermore, the differences in the proportion of domestic energy consumption in various energy sources in the energy mix are analyzed. Third, the macroeconomic changes caused by changes in coal prices are analyzed. Fourth, CO2 emissions are used to analyze the impact of coal price changes on the environment. Tabs. 3 and 4 for the abbreviation of terms used in this study.
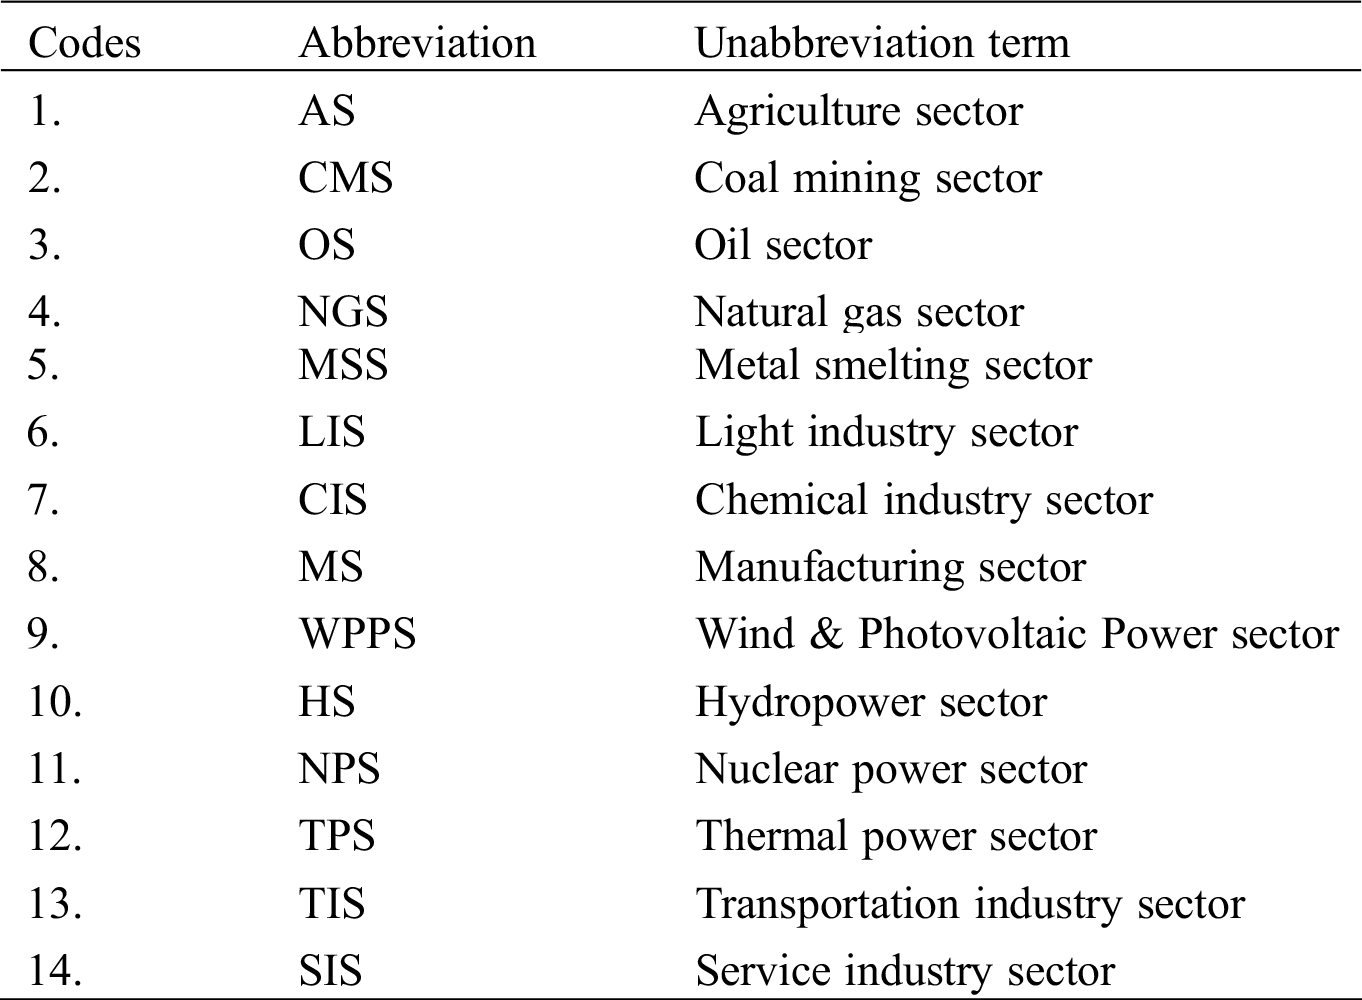
Table 4: Main abbreviations in this paper
3.1 Changes in Energy Supply-Side Output and Sector Product Prices
The results simulated from the energy supply side according to the changes in the sector output and the prices of sector products are shown in Tab. 5, Figs. 5 and 6.
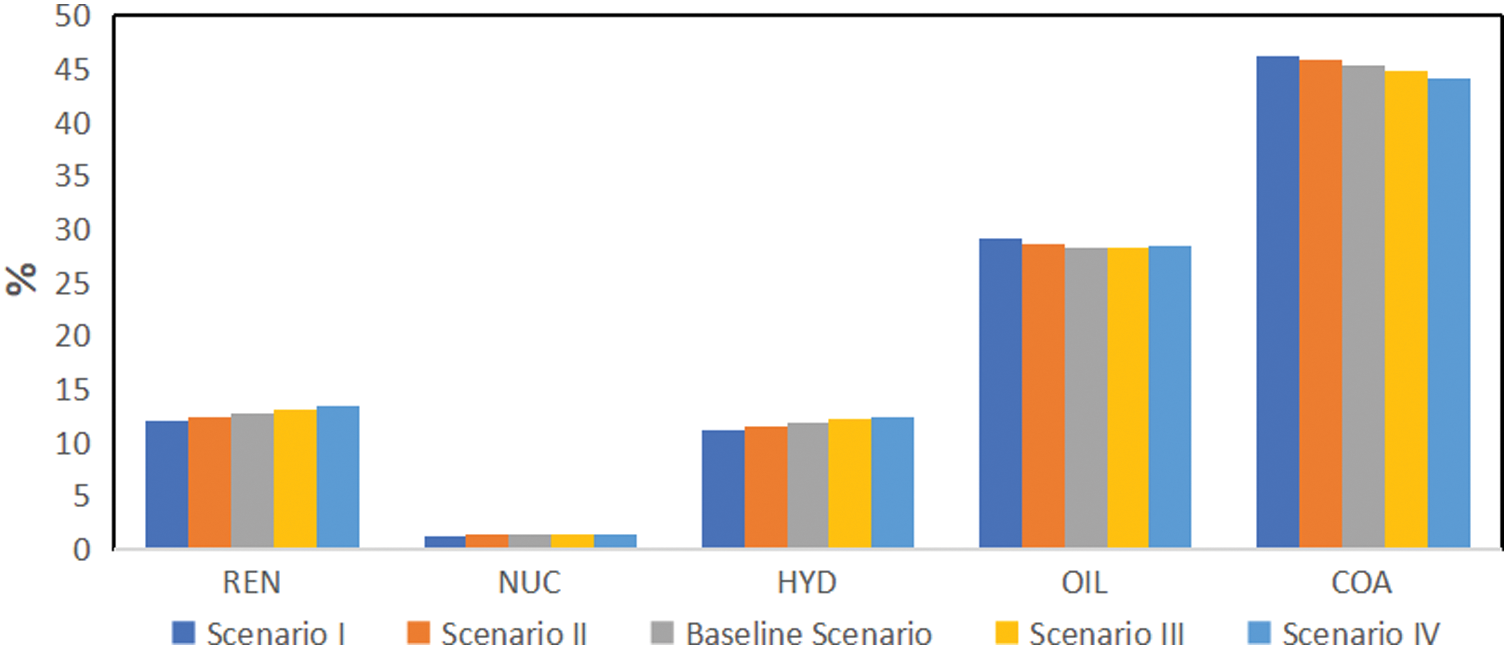
Figure 5: The changes in the energy structure compared to baseline scenario
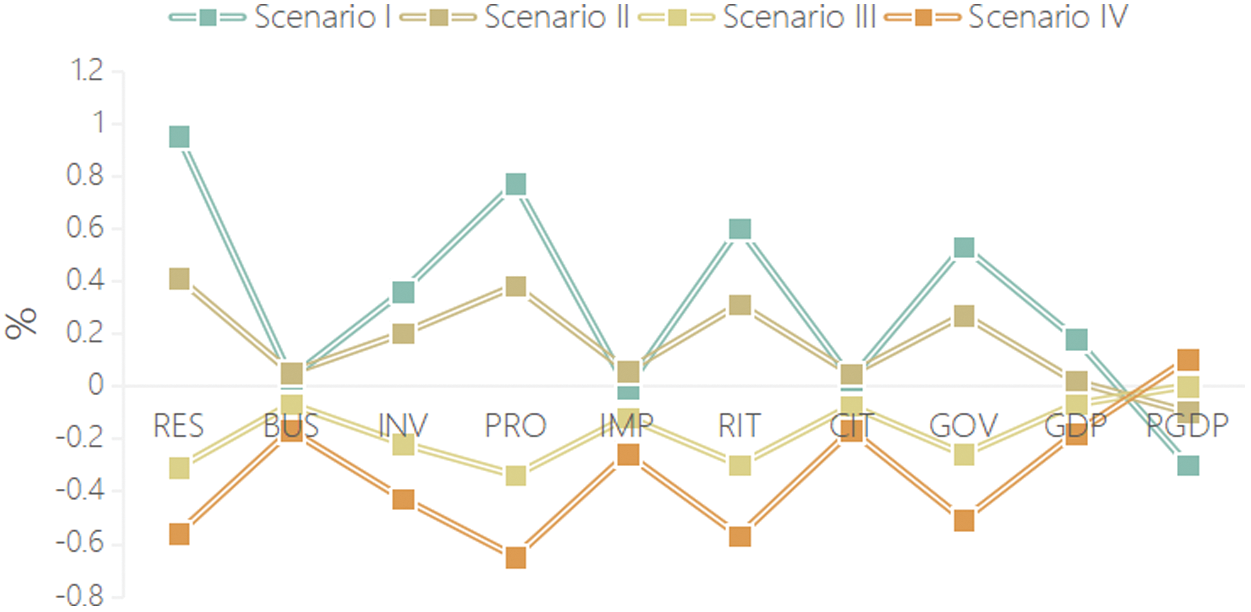
Figure 6: The impact of coal price on the macroeconomy
Table 5: The impact of the coal price on the output and price of each sector (%)
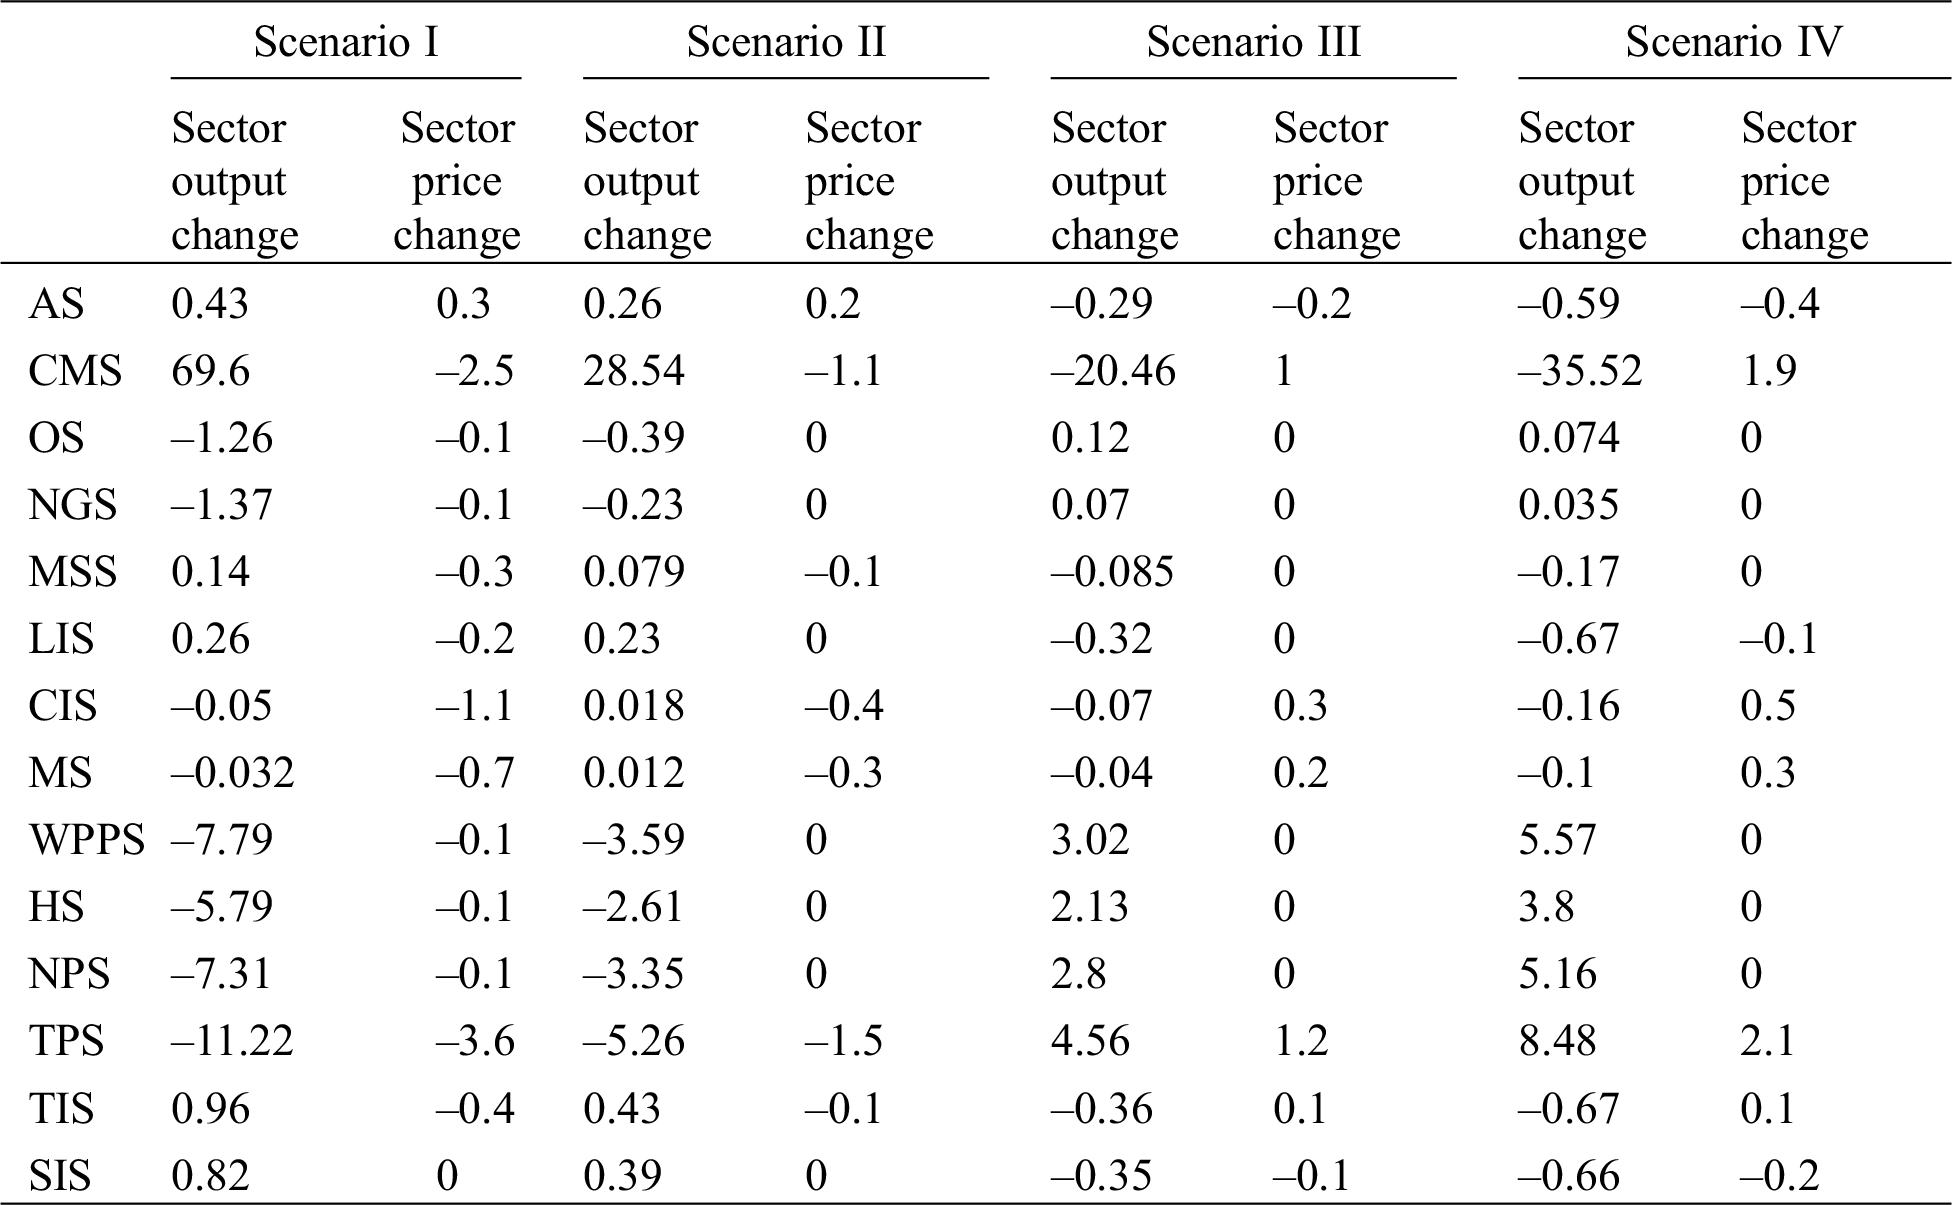
The trend in coal price change is similar to the traditional energy industry, contrary to the new energy industry, and sector output is more sensitive to changes than sector price. As shown in Tab. 5, in Scenario I and Scenario II, the coal sector prices fell slightly by 2.5% and 1.1% compared with the baseline scenario, but the output of the corresponding coal sector increased by 69.6% and 28.54%. In Scenario III and Scenario IV, the price of the coal sector increased by 1% and 1.9% compared with the baseline scenario, and the output of the coal sector decreased by 20.46% and 35.52%, respectively. The output of the renewable energy sector has increased slightly. In Scenario IV, wind power, hydropower, and solar power have increased by 5.57%, 3.8%, and 8.48%, respectively, from the baseline. In Scenario III and Scenario IV, the output and supply of wind and solar power, nuclear power, and hydropower all show a clear upward trend with the rise in coal prices, and the increase is greater than that of the oil sector. The production prices of the renewable energy sector and the petroleum sector remain unchanged, while the coal price continues to increase. The rise in coal prices increased the output of renewable energy, which is consistent with the results of earlier studies.
The increase in coal prices increased the production costs in the downstream industrial sector, of which the thermal power generation sector has the largest increase in production costs, followed by the coal sector. Among the sectors, the light industry, manufacturing industry, and chemical industry have the greatest impact on output. Among downstream industries, the transportation and service industries have the largest impact on output, and the two have similar changes. The drop in coal demand has actively responded to the national energy conservation and emission reduction policies and accelerated the optimization of the process structure of the coal-consuming industry. In the steel industry, for example, despite increasingly severe forms of energy conservation and emission reduction, the elimination of backward capacity of steel companies needs to be accelerated. The increase in coal prices will cause the renewable energy sector to increase production; however, the production price will remain unchanged. This will greatly benefit the development of the renewable energy sector, inhibit the consumption of coal by various supply-side sectors, and promote renewable energy substitution.
Our study on the impact of coal prices on renewable energy substitution has found an interesting phenomenon from the industry aspects. Lowering the price of coal increased the supply of downstream sectors that rely heavily on coal production, such as the metal smelting industry, light industry, transportation industry, and service industry. From our analysis, the decline in coal prices will significantly increase the consumption of coal, thereby increasing the production and supply of coal and alternately reducing the production and supply of alternative energy. The conclusion is as same as, which believes that the impact of coal prices on the primary and tertiary industries is not as great as that on the secondary industry. The production output of the supply-side downstream companies such as the metal smelting industry, light industry, manufacturing industry, transportation industry, and service industry will increase with the decline in coal prices because coal is its primary initial energy input. The decrease in prices will cause a drop in energy costs.
3.2 Changes in Energy Consumption
The simulation results of different types of energy shock scenarios from coal price changes are shown in Tab. 6 and Fig. 5.
Table 6: The impact of the coal price on the energy consumption of each sector (%)
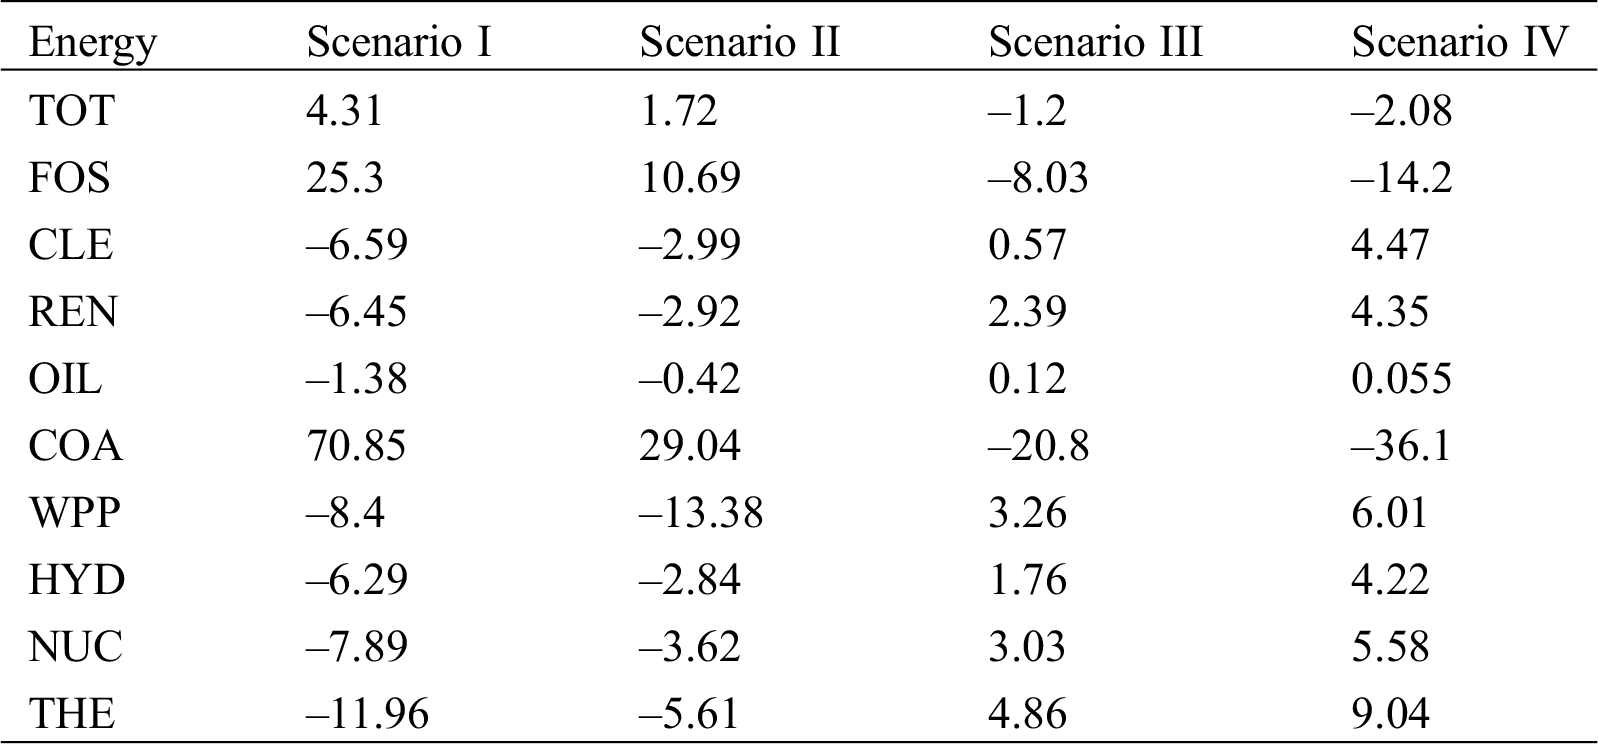
Although the increase in coal prices has caused a decline in the amount of coal in the energy structure, it cannot completely change China’s “coal-based, oil-assisted” energy structure. However, it is conducive in optimizing the energy structure and increasing the proportion of renewable energy in the energy structure, thereby helping accelerate renewable energy substitution (Fig. 5). Furthermore, the amount of renewable energy in the energy structure has increased greatly with the increase in coal prices.
Changes in coal prices have the greatest impact on coal consumption, followed by clean energy and renewable energy. Among them, it has a greater impact on the proportion of wind power and photovoltaic consumption, followed by nuclear power, and has a relatively small impact on hydropower. As shown in Tab. 6, Scenario I, coal consumption increased by 70.85% compared with the baseline scenario. Coal occupies a dominant position in China’s energy structure, thus driving the increase in fossil energy and total energy consumption by 25.3% and 4.31%, respectively, as coal prices decrease. Renewable energy consumption fell by 6.45%, nuclear power by 7.89%, wind and solar power by 8.4%, and hydropower by 6.29%. When the price of coal rises, as in Scenario III, coal consumption is reduced by 20.8% compared with the baseline scenario, so the total energy consumption and fossil energy consumption also decreased by 1.2% and 8.03%, respectively. Oil, clean and renewable energy, wind and solar power, hydropower, and nuclear power consumption show a clear upward trend as coal prices rise. Taking Scenario IV as an example, when the price of coal rises by 20%, oil consumption increases by 0.055%, and the consumption of clean energy and renewable energy increases by 4.47% and 4.35%, respectively. Because of the substitution effect between energy sources, compared with clean energy and renewable energy, the increase in oil consumption is relatively small. Domestic oil consumption and production are relatively stable. The increase in oil consumption in Scenario IV is smaller than that in Scenario III. This is because some downstream sectors using coal, such as the metal smelting industry, light industry, manufacturing industry, and thermal power industry, are also downstream sectors that use petroleum. The large energy cost has reduced the total output of these sectors. The decline in total output has caused a decline in oil consumption.
The simulation results from the impact of coal price changes on different types of economic indicators are shown in Tab. 7 and Fig. 6.
Table 7: The impact of coal price on the macroeconomy (%)
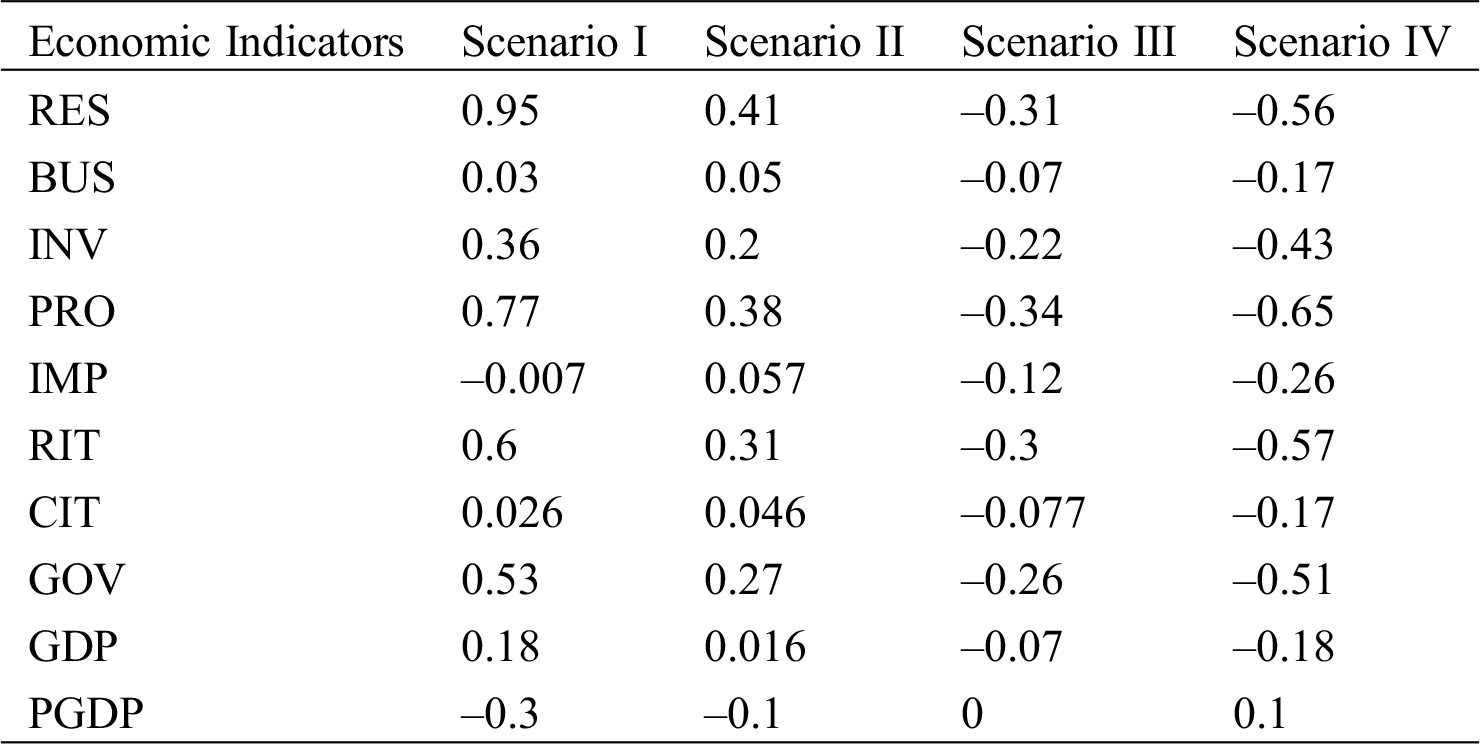
Resident income, corporate income, investment, and taxation rose slightly as coal prices fell, and GDP fell as coal prices rose. Tab. 7 shows that when coal prices changed, from Scenario I to Scenario IV, the decline in coal prices causes its downstream sectors to expand production and supply because of lower production costs, increasing the input of basic elements (including labor and capital), investment, and income of residents and businesses. The increase in income will cause an increase in residents’ income tax and corporate income tax and ultimately an increase in government income. Because of the large reduction in domestic coal prices, import tariffs in Scenario IV have been reduced. As a result, the price advantage of better domestic commodity prices reduces the activity of the international commodity market. The decline in coal prices has caused a decline in the prices of various commodities. Furthermore, although PGDP has declined, real GDP has shown an upward trend.
As shown in Fig. 6, in Scenario III and Scenario IV, PGDP in the macroeconomy shows an upward trend because of the rise in coal prices. In contrast, real GDP shows a downward trend because of the decrease in the total output value of various sectors, which is consistent with economic theory and economic spillover theory. All economic activities do not change in isolation or happen simultaneously, but various economic activities, such as intra-industry, interindustry, and inter-region, spread and penetrate each other. As a result, the rise in coal prices not only inhibits the development of various economic activities but also has an absolute negative effect on the macroeconomy.
The impact of coal decline on industry can be inferred from a microscopic perspective. First, the decline in coal prices will lead oligopolistic coal companies to cut prices and promote sales, lowering sales prices. As a result, middle and lower coal companies have followed suit to lower prices, and to maintain their market share, they continue to sell coal, causing small- and medium-sized coal companies to lose money or even close down. Second, lower coal prices have greatly increased the profits of thermal power-based generation groups. Third, ports and railways are the beneficiaries of coal price reductions. The increase in shipments has allowed the transportation industry to develop. The number of ships pulling coal from northern ports to the port has increased, coal turnover has accelerated at the site, port throughput has increased significantly, and rail transportation has been smooth.
The impact of changes in coal prices on CO2 emissions is carried out through changes in coal prices that cause changes in coal consumption. The emission coefficient of coal is different from oil. As a result, the CO2 emissions produced are also different. We discuss the changes in the CO2 emissions of coal and oil separately here. The results are shown in Tab. 8.
Table 8: The impact of the coal price on CO2 emissions (%)
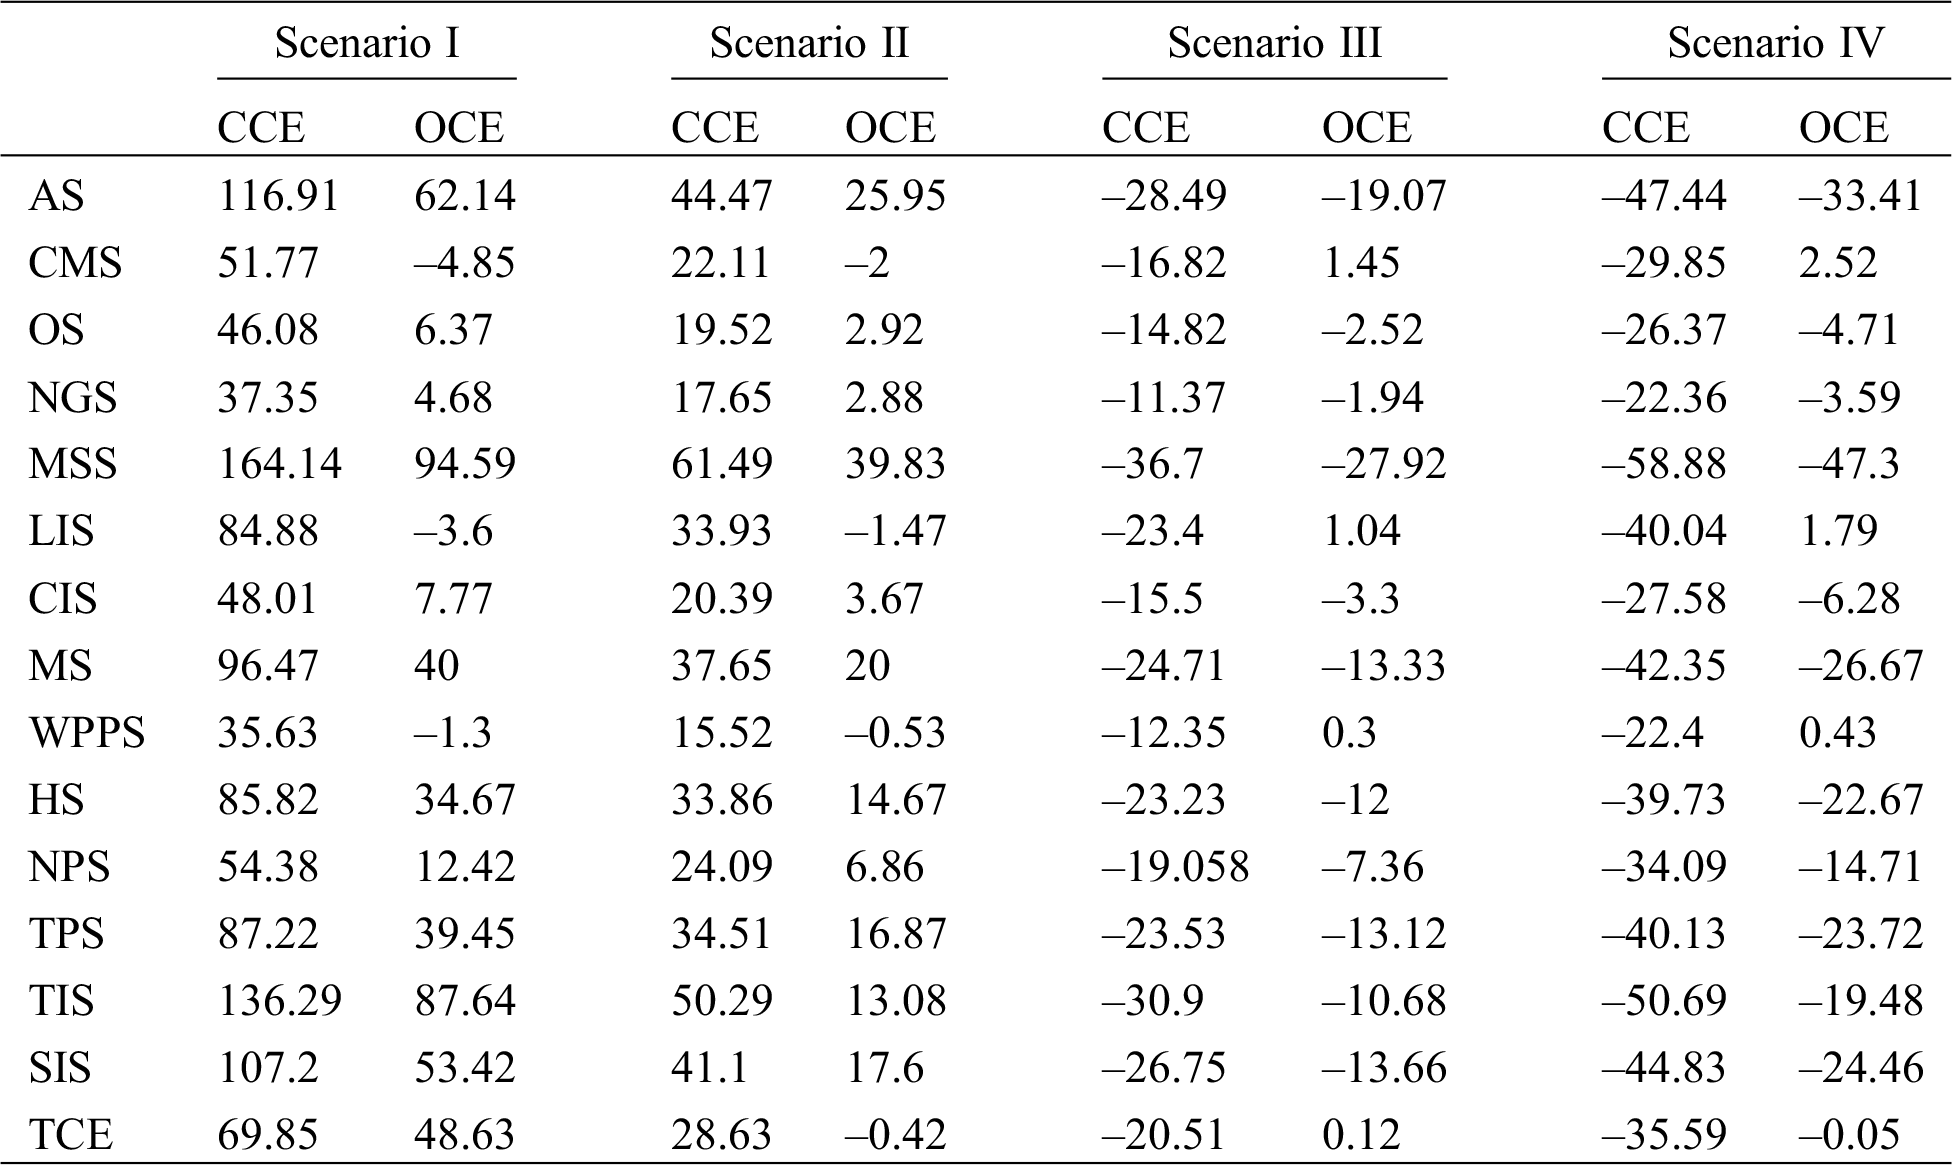
Decreased coal prices lead to a significant increase in CO2 emissions. As shown in Tab. 8, when the coal price changes from Scenario I to Scenario IV, the impact is different for different sectors. In Scenario I, the change of coal CO2 emissions in each sector is significantly bigger than oil CO2 emissions, and the decrease in coal price had significant impact on emissions from the coal industry, light industry, wind and solar power industry, transportation industry, and service industry. The growth rate of coal CO2 emissions in the coal industry, light industry, transportation industry, and service industry was all greater than 1, increasing by 116.94%, 164.13%, 136.29%, and 107.2%, respectively. The CO2 emissions in other sectors also increased to varying degrees.
The rise in coal prices has led to a reduction in CO2 emissions. The total CO2 emissions of coal have also risen sharply because of the increase in coal consumption, while the CO2 emissions of oil have declined because of the decrease in oil consumption. In Scenario IV, the price of coal increased by 20%, decreasing both coal CO2 emissions and petroleum CO2 emissions in each sector, but the decline was less than the increase in coal CO2 emissions caused by the drop in coal prices. Because of energy substitution, the total coal CO2 emissions decreased by 35.59%, and the total oil CO2 emissions decreased by 0.05%. It is evident that the increase in coal prices can significantly reduce CO2 emissions and is conducive to the realization of China’s energy conservation and emission reduction goals.
For the industrial sector, rising coal prices can promote the transformation of the energy consumption structure of the industrial sector, leading to less CO2 emission to meet the national energy saving and emission reduction requirements. For example, improved energy consumption structure in the metallurgical industry can reduce CO2 emissions and accelerate the elimination of backward enterprises with high carbon emissions. Thermal power in the power sector is most affected by coal prices, so CO2 emissions are closely affected by coal prices. Excessively high coal prices will cause the thermal power sector to cut production to reduce emissions. It can also lead to a reduction in the economic efficiency of the thermal power sector or even a loss.
4 Conclusions and Policy Implications
This study is based on the CGE model of the 3E system and innovatively links coal prices with renewable energy alternatives. We studied the effects of the energy supply side, the changes in renewable energy consumption, the impact of coal prices on the macroeconomy, and the CO2 emissions from four scenarios. The conclusions are as follows:
1. Coal prices are closely related to the energy pattern. Coal prices have a huge impact on fossil energy production and consumption. For example, in Scenarios I to IV, the consumption of renewable energy has changed by 10.8%. Therefore, the increase in coal prices will increase the proportion of renewable energy, which greatly promotes the development of wind power and photovoltaic power generation sectors and is conducive to renewable energy substitution and CO2 emission reduction.
2. Coal prices are closely related to the economy. For example, as coal prices changed from Scenario I to Scenario IV, GDP fell by 0.36% and PGDP increased by 0.4%. The increase in coal prices inhibits the occurrence of various economic activities, so it has a certain negative effect on the macroeconomy. However, based on several other indicators, it is conducive in promoting the development of renewable energy and promoting the completion of China’s energy structure transformation. The increase in coal prices has lowered various tax rates. Taking Scenario IV as an example, production value-added tax, import tariffs, resident income tax, and corporate income tax were reduced by 0.65, 0.26, 0.57, and 0.17 percentage points, respectively, which contributed to domestic and international trade. The effect can promote economic development and provide employment, so in the long run, the increase in coal prices will help the economy.
3. The impact of coal prices on the industrial sector cannot be ignored. The decline in coal prices has stimulated coal consumption, increasing the CO2 emissions level of the industrial sector. Because of the high carbon emission coefficient of coal and its share leading position, CO2 emissions will rise with the decrease in coal prices. The CO2 emission change rate of coal with a price decrease of 20% is 116.91%, which is about twice that of oil. At the same time, coal prices have a subtle effect on the output of the industrial sector. For example, the output of the light industry sector increased by 0.26% in Scenario I. In addition, the increase in coal prices will increase the production costs of the downstream industrial sectors other than the renewable energy sector, with the largest increase in the production costs of the thermal power generation sector. Lower coal prices have the opposite effect. Therefore, the rise in coal prices has a positive effect on the industry’s emission reduction work and promotes the completion of the energy structure conversion.
4. Under the premise of using thermal power as the main energy source, if the degree of power marketization is insufficient, the linkage between coal prices and electricity prices is not obvious, which will affect our analysis results. At the same time, the adjustment of China’s industrial structure will also affect the conclusions of this study. Because of the coronavirus disease 2019 (COVID-19), coal prices have been falling; however, according to the statistics of the National Energy Administration, in the first quarter of 2020, photovoltaic and wind power generation increased by 19.9% and 10.4% year-on-year, respectively, while thermal power decreased by 5.9%. Because the development of new energy can drive a new industrial chain and stimulate economic development from a new perspective, in the short term, some black swan events or sudden events may produce conclusions contrary to this article.
Excessively high coal prices will cause greater losses to the economy, while excessively low coal prices will hinder the pace of renewable energy substitution. This paper proposes policy recommendations for decision makers based on the simulation results. The policy recommendations are as follows:
1. The huge fluctuations in coal prices will have a huge impact on the energy landscape. Therefore, it is necessary for policymakers to make reasonable interventions on coal prices to control them within a reasonable range. For example, set a price range to allow coal prices to fluctuate by 20%. This plays a vital role in stabilizing coal prices and achieving renewable energy substitution and the establishment of a clean energy structure.
2. To promote the development of renewable energy, the Chinese government has set specific development goals and divided the tasks into various provinces. However, because of technical and cost reasons, the price of renewable energy will be higher than that of thermal power in the short term, which in turn has pushed down coal prices to a certain extent. To not impose too much burden on the costs of enterprises, especially because of the epidemic that already had a great impact on macroeconomic growth and employment, it is recommended that the Chinese government moderately relax the substitution rate for thermal power.
3. Coal is the primary source of energy consumption in China. To mitigate the negative impact of its price on China’s economy and reduce the risk of economic operations in China, the government should reasonably use macro control functions to improve China’s coal futures market system and accelerate the improvement of China’s coal futures market. The state should focus on attracting institutional investors to participate in market transactions, supplemented by attracting individual investors to ensure that China’s future coal market functions better.
Overall, the realization of renewable energy substitution should be achieved together with carbon emissions reduction and steady economic growth. This is not only the final goal of China’s development of renewable energy but also the direction of the efforts of countries around the world.
This study has several shortcomings. First, in the analysis of environmental effects, we concentrated only on CO2 emissions and did consider the emissions of other pollutant and greenhouse gases. This is because the technical emission parameters are difficult to obtain, and the emission model is challenging to quantify. However, this can be explored in future research. Second, we have not considered the renewable energy subsidy policy and the reduction of renewable energy investment. This is a new point worth exploring in subsequent studies. Third, we failed to take force majeure factors into account, such as the impact of COVID-19.
Funding Statement: The authors gratefully acknowledge the financial support from the Humanities and Social Science Fund of Ministry of Education of China (Project No. 18YJAZH138), the National Natural Science Foundation of China (No. 71403163) and National Social Science Foundation of China (No. 20BJL036).
Conflicts of Interest: The authors declare that they have no conflicts of interest to report regarding the present study.
1. Xue, Y. (2020). Empirical research on household carbon emissions characteristics and key impact factors in mining areas. Journal of Cleaner Production, 256, 120470. DOI 10.1016/j.jclepro.2020.120470. [Google Scholar] [CrossRef]
2. Liu, H., Rodrı́guez, G. (2005). Human activities and global warming: A cointegration analysis. Environmental Modelling & Software, 20(6), 761–773. DOI 10.1016/j.envsoft.2004.03.017. [Google Scholar] [CrossRef]
3. Lucas, P. L., van Vuuren, D. P., Olivier, J. G. J., den Elzen, M. G. J., (2007). Long-term reduction potential of non-CO2 greenhouse gases. Environmental Science & Policy, 10(2), 85–103. DOI 10.1016/j.envsci.2006.10.007. [Google Scholar] [CrossRef]
4. Lueken, R., Klima, K., Griffin, W. M., Apt, J. (2016). The climate and health effects of a USA switch from coal to gas electricity generation. Energy, 109, 1160–1166. DOI 10.1016/j.energy.2016.03.078. [Google Scholar] [CrossRef]
5. Emily, W. P., Joshua, M. P. (2017). Potential lives saved by replacing coal with solar photovoltaic electricity production in the U.S. Renewable and Sustainable Energy Reviews, 80, 710–715. DOI 10.1016/j.rser.2017.05.119. [Google Scholar] [CrossRef]
6. BP (2019). BP Energy Outlook. https://www.bp.com/en/global/corporate/energy-economics/energy-outlook.html. [Google Scholar]
7. Scholz, D., Zundel, S., Musgens, F. (2019). Price and employment effects triggered by a german coal phase-out-a discourse analysis. International Conference on the European Energy Market, pp. 1–7. IEEE, New York. [Google Scholar]
8. Zhao, Z., Zhu, J., Xia, B. (2016). Multi-fractal fluctuation features of thermal power coal price in China. Energy, 117, 10–18. DOI 10.1016/j.energy.2016.10.081. [Google Scholar] [CrossRef]
9. He, Y. X., Zhang, S. L., Yang, L. Y., Wang, Y. J., Wang, J. (2010). Economic analysis of coal price–electricity price adjustment in China based on the CGE model. Energy Policy, 38(11), 6629–6637. DOI 10.1016/j.enpol.2010.06.033. [Google Scholar] [CrossRef]
10. Jiao, J., Ge, H., Wei, Y. (2010). Impact analysis of China’s coal-electricity price linkage mechanism: Results from a game model. Journal of Policy Modeling, 32(4), 574–588. DOI 10.1016/j.jpolmod.2010.05.002. [Google Scholar] [CrossRef]
11. Chen, Z., Chen, P., Ma, Z., Xu, S., Hayat, T. et al. (2019). Inflationary and distributional effects of fossil energy price fluctuation on the Chinese economy. Energy, 187, 115974. DOI 10.1016/j.energy.2019.115974. [Google Scholar] [CrossRef]
12. Chen, X., Liang, Q., Liu, L., Wang, C., Xue, M. (2019). Critical structural adjustment for controlling China's coal demand. Journal of Cleaner Production, 235, 317–327. DOI 10.1016/j.jclepro.2019.06.315. [Google Scholar] [CrossRef]
13. Guo, H., Davidson, M. R., Chen, Q., Zhang, D., Jiang, N. et al. (2020). Power market reform in China: Motivations, progress, and recommendations. Energy Policy, 145, 111717. DOI 10.1016/j.enpol.2020.111717. [Google Scholar] [CrossRef]
14. Xu, R., Song, X., Tang, Q., Yu, Z. (2018). The cost and marketability of renewable energy after power market reform in China: A review. Journal of Cleaner Production, 204, 409–424. DOI 10.1016/j.jclepro.2018.09.018. [Google Scholar] [CrossRef]
15. Webb, J., de Silva, H. N., Wilson, C. (2020). The future of coal and renewable power generation in Australia: A review of market trends. Economic Analysis and Policy, 68, 363–378. DOI 10.1016/j.eap.2020.10.003. [Google Scholar] [CrossRef]
16. Zhou, A., Hu, J., Wang, K. (2020). Carbon emission assessment and control measures for coal mining in China. Environmental Earth Sciences, 79(19), 47. DOI 10.1007/s12665-020-09189-8. [Google Scholar] [CrossRef]
17. Hu, X., Cheng, X., Qiu, X. (2020). Impact of carbon price on renewable energy using power market system. Lecture Notes in Electrical Engineering, 634, 671–677. [Google Scholar]
18. Li, X., Yao, X. (2020). Can energy supply-side and demand-side policies for energy saving and emission reduction be synergistic?— A simulated study on China's coal capacity cut and carbon tax. Energy Policy, 138, 111232. DOI 10.1016/j.enpol.2019.111232. [Google Scholar] [CrossRef]
19. Jiang, P., Yang, H., Ma, X. (2019). Coal production and consumption analysis, and forecasting of related carbon emission: Evidence from China. Carbon Management, 10(2), 189–208. DOI 10.1080/17583004.2019.1577177. [Google Scholar] [CrossRef]
20. Fu, Y., Huang, G., Liu, L., Zhai, M. (2020). A factorial CGE model for analyzing the impacts of stepped carbon tax on Chinese economy and carbon emission. Science of the Total Environment, 143512, 143512. DOI 10.1016/j.scitotenv.2020.143512. [Google Scholar] [CrossRef]
21. Liu, J., Bai, J., Deng, Y., Chen, X., Liu, X. (2020). Impact of energy structure on carbon emission and economy of China in the scenario of carbon taxation. Science of the Total Environment, 143093. DOI 10.1016/j.scitotenv.2020.143093. [Google Scholar] [CrossRef]
22. Zhang, Z., Yang, W., Ye, J. (2021). Why sulfur dioxide emissions decline significantly from coal-fired power plants in China? Evidence from the desulfurated electricity pricing premium program. Energy Policy, 148, 111996. DOI 10.1016/j.enpol.2020.111996. [Google Scholar] [CrossRef]
23. Böhringer, C., Löschel, A. (2006). Computable general equilibrium models for sustainability impact assessment: Status quo and prospects. Ecological Economics, 60(1), 49–64. DOI 10.1016/j.ecolecon.2006.03.006. [Google Scholar] [CrossRef]
24. Guo, Z., Zhang, X., Zheng, Y., Rao, R. (2014). Exploring the impacts of a carbon tax on the Chinese economy using a CGE model with a detailed disaggregation of energy sectors. Energy Economics, 45, 455–462. DOI 10.1016/j.eneco.2014.08.016. [Google Scholar] [CrossRef]
25. Zhang, W., Yang, J., Inc, D. E. P. (2016). Impact of carbon emission reduction on the economy and energy consumption in China based on the CGE model. Joint 2016 International Conference on Social Science and Environmental Science, pp. 231–238. Lancaster: Destech Publications, Inc. [Google Scholar]
26. Li, W., Zhang, Y., Lu, C. (2018). The impact on electric power industry under the implementation of national carbon trading market in China: A dynamic CGE analysis. Journal of Cleaner Production, 200, 511–523. DOI 10.1016/j.jclepro.2018.07.325. [Google Scholar] [CrossRef]
27. Li, Y., Su, B. (2017). The impacts of carbon pricing on coastal megacities: A CGE analysis of Singapore. Journal of Cleaner Production, 165, 1239–1248. DOI 10.1016/j.jclepro.2017.07.206. [Google Scholar] [CrossRef]
28. Tang, L., Shi, J., Bao, Q. (2016). Designing an emissions trading scheme for China with a dynamic computable general equilibrium model. Energy Policy, 97, 507–520. DOI 10.1016/j.enpol.2016.07.039. [Google Scholar] [CrossRef]
29. Liang, Q., Wang, T., Xue, M. (2016). Addressing the competitiveness effects of taxing carbon in China: Domestic tax cuts versus border tax adjustments. Journal of Cleaner Production, 112, 1568–1581. DOI 10.1016/j.jclepro.2015.02.092. [Google Scholar] [CrossRef]
30. Li, J., Xie, C., Long, H. (2019). The roles of inter-fuel substitution and inter-market contagion in driving energy prices: Evidences from China’s coal market. Energy Economics, 84, 104525. DOI 10.1016/j.eneco.2019.104525. [Google Scholar] [CrossRef]
31. NBS, N. B. O. S. (2019). China Input-Output Tables 2017. http://data.stats.gov.cn/files/html/quickSearch/trcc/trcc01.html. [Google Scholar]
32. NBS, N.B.O.S. (2017). China energy statistical yearbook 2017. Beijing, China: China Statistics Press. [Google Scholar]
33. NBS, N.B.O.S. (2017). Finance yearbook of China 2017. Beijing, China: China Statistics Press. [Google Scholar]
34. Eggleston, H. S. B. L., Tanabe, K. (2006). 2006 IPCC guidelines for national greenhouse gas inventories. Institute for Global Environmental Strategies (IGESHayama, Japan on behalf of the IPCC. http://www.ipcc-nggip.iges.or.jp/public/2006gl/index.htm. [Google Scholar]
 | This work is licensed under a Creative Commons Attribution 4.0 International License, which permits unrestricted use, distribution, and reproduction in any medium, provided the original work is properly cited. |