| Energy Engineering |
DOI: 10.32604/EE.2021.016082
ARTICLE
Biochemical and Thermal Analysis of Spirulina Biomass through FTIR, TGA, CHN
1Energy Centre, Maulana Azad National Institute of Technology, Bhopal (M.P), India
2Department of Mechanical Engineering, Maulana Azad National Institute of Technology, Bhopal (M.P), India
3Faculty of Mechanical and Automotive Engineering Technology, Universiti Malaysia Pahang, Pahang, 26600, Malaysia
4Centre for Automotive Engineering, Universiti Malaysia Pahang, Pahang, 26600, Malaysia
*Corresponding Authors: Ruma Arora Soni. Email: ruma.manit@gmail.com; K. Sudhakar. Email: sudhakar@ump.edu.my
Received: 04 February 2021; Accepted: 10 May 2021
Abstract: Spirulina is a sort of algae that grows in both fresh and seawater. It is considered the Earth’s most nutritionally dense food. Certain claims about Spirulina’s beneficial health properties are attributed to the relatively high protein content of the cells. Spirulina’s lipid, fatty acid profile, and biochemical composition have received little attention. The purpose of this study is to investigate the nature and decomposition of spirulina biomass at various temperatures. In the present investigation, Fourier transforms infrared spectroscopy, thermogravimetric analysis, and elemental analysis were used to study spirulina biomass biochemical characteristics. The optimal content of spirulina protein, lipid, and the amino acid was identified and reported. In this study, the various frequency ranges corresponding to functional groups are evaluated and reported. Spirulina FT-IR spectra were recorded and reported at different frequency ranges from 3870–3448 cm−1 to 695–545 cm−1. FTIR studies for spirulina biomass affirmed the occurrence of –OH, –COOH, NH, C–H, and C=O groups. Protein (3453 and 1645 cm−1) and carbohydrate (1032 and 1033 cm−1) were the main components with distinct IR spectra fingerprint characteristics. Results indicate that Spirulina sp. biomass is viable green energy and the biggest protein source. The mechanism underlying the high rate of protein accumulation of spirulina may aid in not only elucidating the biochemistry but also in modifying the chemical composition and strain selection for the production of specific chemicals and products.
Keywords: Microalgae; protein; energy content; vitamins; carbohydrates
Spirulina platensis is a multicellular [1] filamentous, spiral-shaped algae. Microalgae are studied for food and biofuels based on high-protein and low-lipid content that is cultivated and harvested around the globe. Spirulina’s growth and biomass production depend entirely on the availability of nutrients, pH, light intensity, and medium and surrounding temperature. Media cost and composition are challenging factors in Spirulina’s viable and mass production.
Spirulina is now a kind of universal health food product. Spirulina has essential vitamins such as Vitamin A, Vitamin B12. Phycocyanin is spirulina’s primary active and antioxidative compound. It has strong antioxidant and anti-inflammatory characteristics. Phycocyanin gives blue-green color to spirulina microalgae are still an excellent source of aquaculture feed, nutritional supplements, and pharmaceuticals [2–4] and are also appreciated as a very helpful energy storage option [5]. Several researchers have demonstrated the ability to use thermogravimetric analysis (TGA) to study species of microalgae. Authors conducted TGA analysis in the air atmosphere and studied temperature impacts and evaluated growth stages in the method aligned with the presence of various molecules generated during the spirulina growth development and the thermal characteristics change of certain intracellular molecules [6,7]. The authors recognized three measures at different temperature levels in the TGA weight loss graphs [8–11]. Biomass drying is an efficient and low cost method of drying the sample before further processing [12].
Fourier-transform infrared spectroscopy (FTIR) is an extensively used technique of fingerprinting to identify chemical constituents and to illustrate compound structures, and this has been used as a required method often to identify medicinal compounds in several countries [13]. IR spectroscopy research started in the 1940s when IR spectroscopy techniques first being used for biological analysis. To specify biochemical composition, protein, or lipid content, characterization of algae biomass is extremely important. Large-scale economies of microalgae agriculture rely heavily on algal biomass biochemical composition [14]. In attempts to interpret microalgal nannochloropsissp, thermogravimetric research (TGA) and FTIR were conducted [7]. In this research, Spirulina sp., Blue-green algae were cultivated in different media to assess their potential as a source of protein as well as pharmaceuticals.
The aim of this research is also to discover simple, quick, and reliable analytical methods to assess the biochemical and thermal characteristics of Spirulina sp. This was achieved by study of algal biomass’ thermal and biochemical components; and study of algae protein content;
Therefore, the preceding five techniques were included in the assessment:
(i) FTIR analysis;
(ii) Thermogravimetric analysis;
(iii) Elemental analysis;
(iv) Proximate analysis;
(v) Nutritional composition.
2.1 Spirulina Biomass and Culture Medium
Spirulina strain was collected from Gerophyta Nutraceuticals, Tamil Nadu, and experiments were conducted at the Energy Center, MANIT, Bhopal with 12 h of light with equal hours of the dark period with regular required light and aeration of the flask, the culture was preserved at 25–30°C ambient temperature in the Zarrouk medium. All of the chemicals used to make the culture media were food-grade reagents.10 mg/l of inoculum was added to the media. Zarrouk media as the standard media and modified media, have been used to cultivate spirulina. Nitrogen content was changed in both the prepared media. Spirulina was cultivated for about 10–11 days and then using mesh cloth it was harvested and sun-dried. Urea and Potassium nitrate was used as nitrogen content which basically affects the cultivation and growth of spirulina. Fig. 1 shows the cultivation system of spirulina in both the prepared media. Analysis of spirulina biomass was done as
(ii) Thermal Analysis
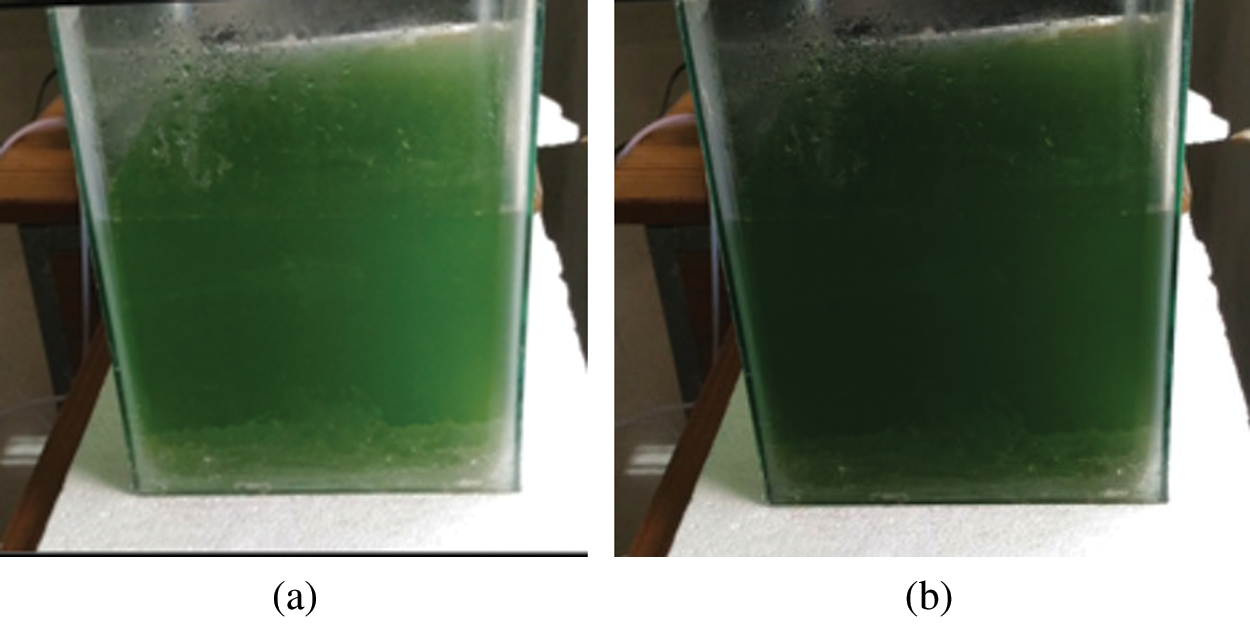
Figure 1: Cultivation of spirulina in (a) KNO3 (b) Urea
Thermo Gravimetric Analysis (TGA)
Infrared Analysis Spectroscopy (FTIR)
Elemental Analysis
Proximate Analysis
(iii) Biochemical Analysis
Protein Estimation
Carbohydrate Estimation
Lipid estimation
Fat Estimation
Thermo Gravimetric Analysis (TGA)
A dried spirulina sample was used in the TGA analysis. It was performed at different temperatures to determine the maximum temperature spirulina can copeup.
Infrared Analysis Spectroscopy (FTIR)
The dried spirulina specimens of about 1.5 mg were grounded in an agate mortar for FTIR analysis with 100 mg of sodium bromide (KBr) spectroscopic grade powder. 10–12 tons of pressure were added to this mixture for 5 min to reach 1 mm of clear pellets. The dried algal biomass IR spectrum was recorded at room temperature on a Nicolet IR spectrometer. Before analysis, the dried algal dust was blended with potassium bromide (KBr) powder and pressed into tablets. A scanning range of 4000–400 cm−1 was used.
CHNSO Elemental Analyzer (PERKIN ELMER) identified and evaluated qualitative elemental biomass analysis of crude spirulina. Thedry solid spirulina content was assessed at 105°C for 24 h as the dry residue. Once the feedstock burned at 550°C for three hours, the ash percentage was calculated as the firm residue. The content of crude protein, crude fat, and carbohydrate was assessed using Kjehldahl’s method for protein, solvent extraction method for fats and lipids, and crude carbohydrates by Food Analysis using Nielssen techniques [15]. Fig. 6 shows the comparison of elemental analysis of both the samples.
Nutritional Composition (Kjeldahl’s Method for Protein Estimation)
Nitrogen, N is determined through the Titration Method. Approximately 1 gm of dried spirulina sample was hydrolyzed with 15 mL concentrated sulfuric acid (H2SO4) containing two copper catalyst tablets in a heat block at 420°C for 2 h. After cooling, H2O was added to the hydrolysates before neutralization and titration. The calculation of the protein based on the nitrogen content in the food is then carried out. Gel electrophoresis is usually used as a standard for the detection and quantification of proteins. Because the Kjeldahl method does not measure the amount of protein, conversion factors (F) have to be applied to figure out the protein content. A conversion factor of 6.25 is used, which corresponds to 0.16 g nitrogen per gram of protein. The protein content of foods and feeds is determined indirectly by determining the nitrogen content, which requires a nitrogen-to-protein conversion factor (NPCF). 6.25 was historically applied to all proteins based on two assumptions: (1) all proteins contained 16 percent nitrogen (100/16 = 6.25) and (2) all nitrogen was derived from protein. Due to variations in amino acid profiles and nonprotein nitrogen, amino acid analyses revealed that a conversion factor of 6.25 overestimated the protein content of the majority of foods. Due to a lack of standardization in the methods used to determine food-specific NPCF, 6.25 has been retained and new factors have been developed inconsistently. This review summarizes efforts to calculate the NPCF for a variety of foods [16,17]. It is useful to split the Kjeldahl process into three steps: digestion, neutralization, and titration as illustrated in Fig. 2.
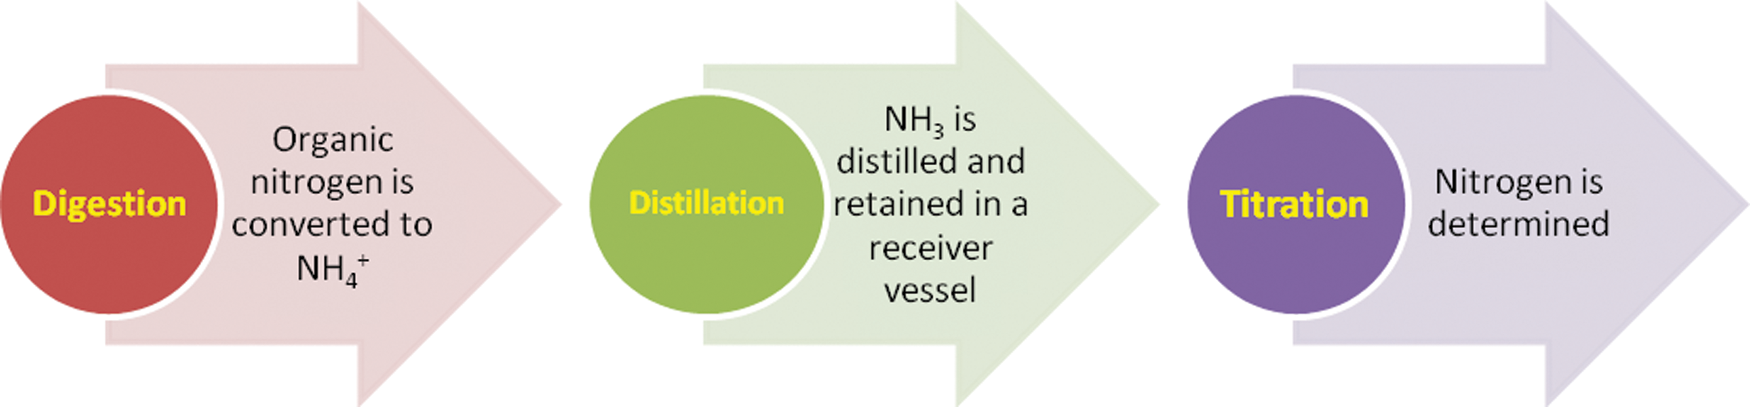
Figure 2: Kjeldahl step-wise process into three steps: Digestion, neutralization, and titration
For the method of carbohydrate estimation, the process is as follows. A solution of 1 mL of carbohydrate aliquot is easily blended with 3 mL of concentrated sulfuric acid and 30 s vortexed. The mixture starts boiling in a matter of seconds after adding acid. After removal, the solution was cooled in ice for a short time. Finally, the UV absorption amount at the wavelength of 315 nm is read on the spectrophotometer. Reference solutions are prepared after the same process as above, except that DDI (Distilled De-Ionised )water replaces the carbohydrate aliquot [18].
The lipid was extracted from harvested algae and 0.3 g of dry biomass was ground to a fine powder in 1.80 ml water. Added to the mixture is a 22.72 ml mixture containing liquid chloroform and a 45.45 ml amount of methanol. Samples were sonicated at 9.9/5.0 s for 25 min on/off pulses. Then, lysate cells were shaken with a magnetic stirring rod for 2 h followed by mixing and filtering through Whatman filter paper. The reagent used here was twice extracted as a preparatory step before use [19]. The solution was evaporated in the rotary evaporator at a temperature of 40°C. The dried lipid samples were weighed gravimetrically.
Soxhlet extraction is comparatively an easy method to determine total fat. The sampling is conducted in which a thimble is used if necessary, in the Soxhlet apparatus. When the filling level is reached, the solvent is siphoned back into the boiling flask with extracted matter (fat). The specimen is kept frozen throughout the entire observation. Extraction is carried out in a specific number of fillings. The solvent is evaporated at the end of the extraction so that only the extraction residue remains (fat) [20,21].
3 Thermal and Biochemical Results
The thermogravimetric analysis, Infrared analysis spectroscopy (FTIR), Elemental Analysis, Proximate Analysis were done as a part of thermal analysis. Protein, carbohydrate, lipid, and fats were estimated based on biochemical analysis.
3.1 Thermogravimetric Analysis
Thermogravimetric analysis is a rapid, non-destructive assessment of the quality of spirulina powder. Three decomposition phases were also acknowledged by researchers, i.e., dehydration, devolatilization, and strong decomposition. The Spirulina biomass TGA curves can be observed to be identical and show three stages throughout the heating process. The first phase was specifically between 10 and 250°C. This stage of moisture or mass loss is likely the result of dehydration, which was also observed in spirulina cells and inner water bounded in terms of water elimination by surface tension [18]. In brief, this is a phase of small mass loss because of the low moisture content of the two Spirulina samples. As well, this weight loss was more or less negligible due to the decomposition of light volatile compounds in the samples. The second phase of mass loss started at approximately 260°C and ended at around 680°C which includes the decomposition of proteins and carbohydrates Spirulina’s two samples showed substantial weight loss in the breakdown of spirulina components which includes proteins, carbohydrates, and lipids. The third stage ranged from 740°C to 885°C final temperature and refers to total organic matter oxidation [7]. A very small loss of mass could be reported during this process. This is primarily due to the decomposition of high carbon residues. However, some differences still existed between the two microalgae. The spirulina biomass thermal degradation at varying temperatures can be explained by loss in weight. The curves of weight loss for the spirulina sp. algal biomass is illustrated in Figs. 3 and 4.
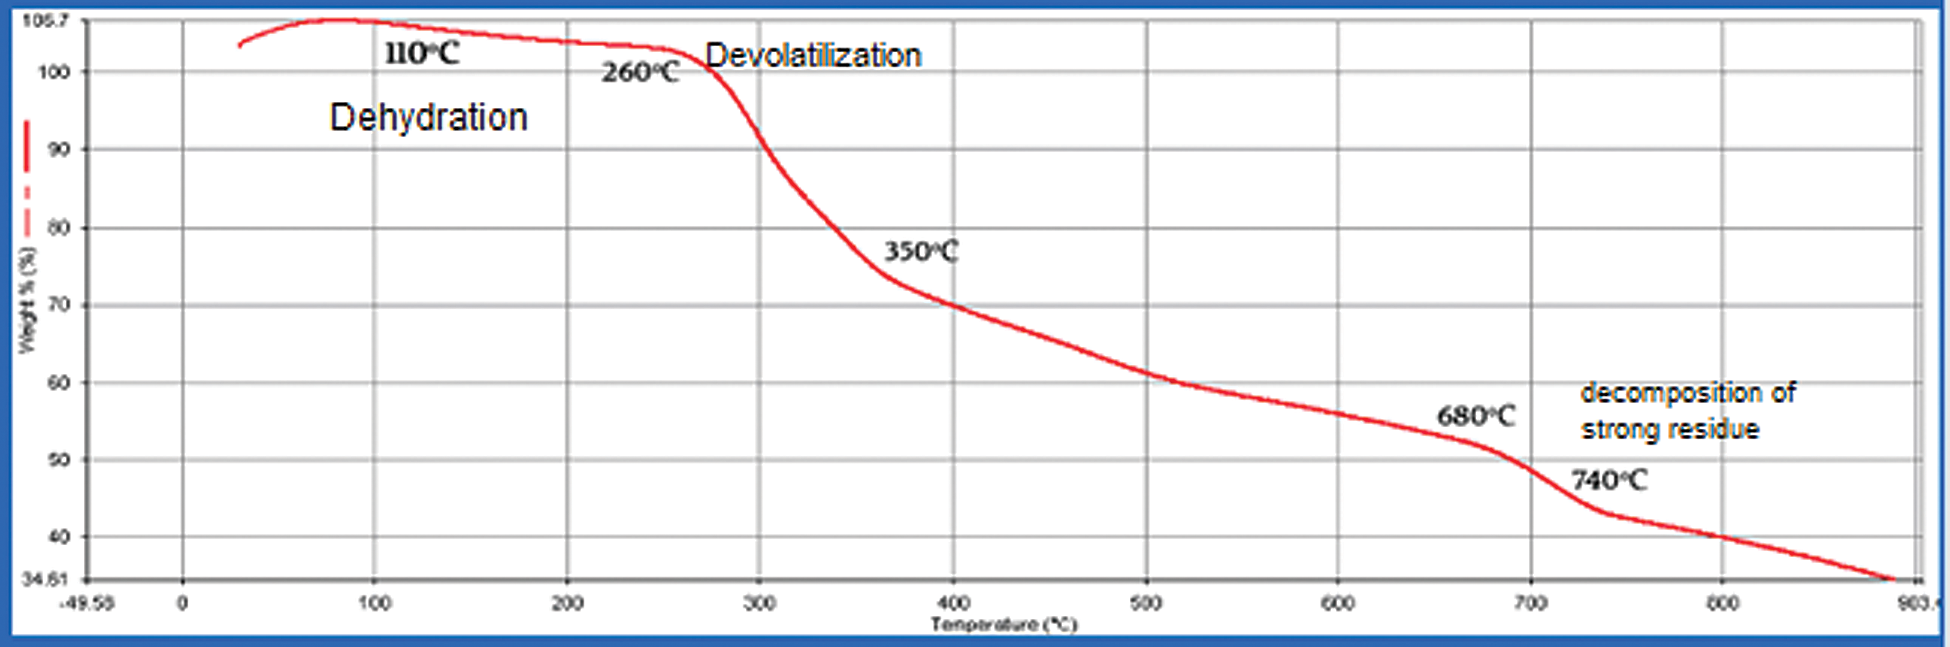
Figure 3: TGA results of Spirulina Plantesis in modified media with urea (Heat from 30°C to 900°C at 10 °C/min)
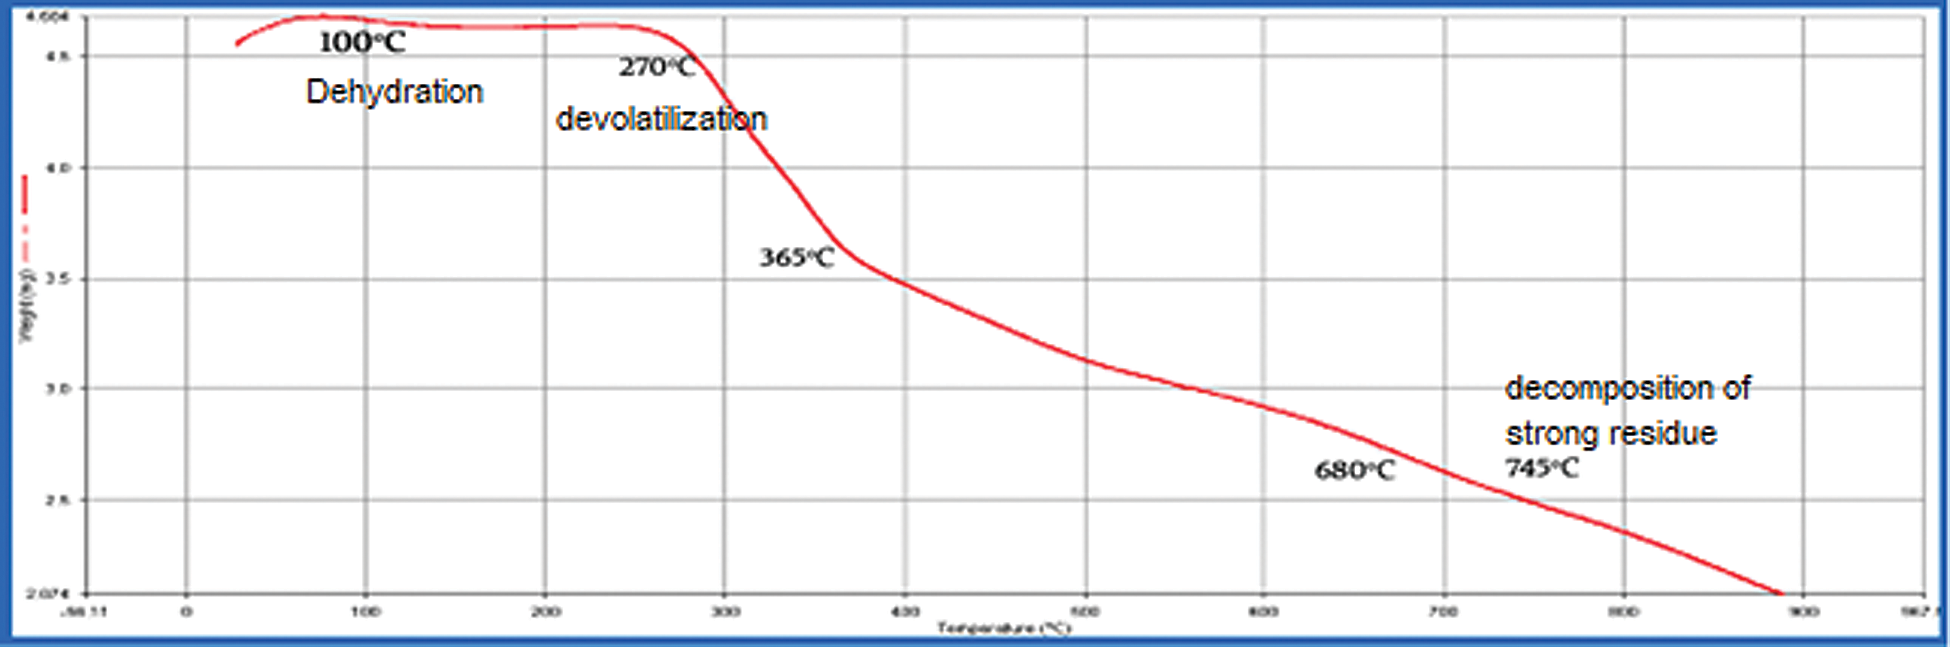
Figure 4: TGA results of Spirulina Plantesis in modified media with KNO3 (Heat from 30°C to 900°C at 10 °C/min)
The three primary phases of decomposition identified for the species of spirulina are illustrated in Tab. 1.
Table 1: TGA analysis of Spirulina sample
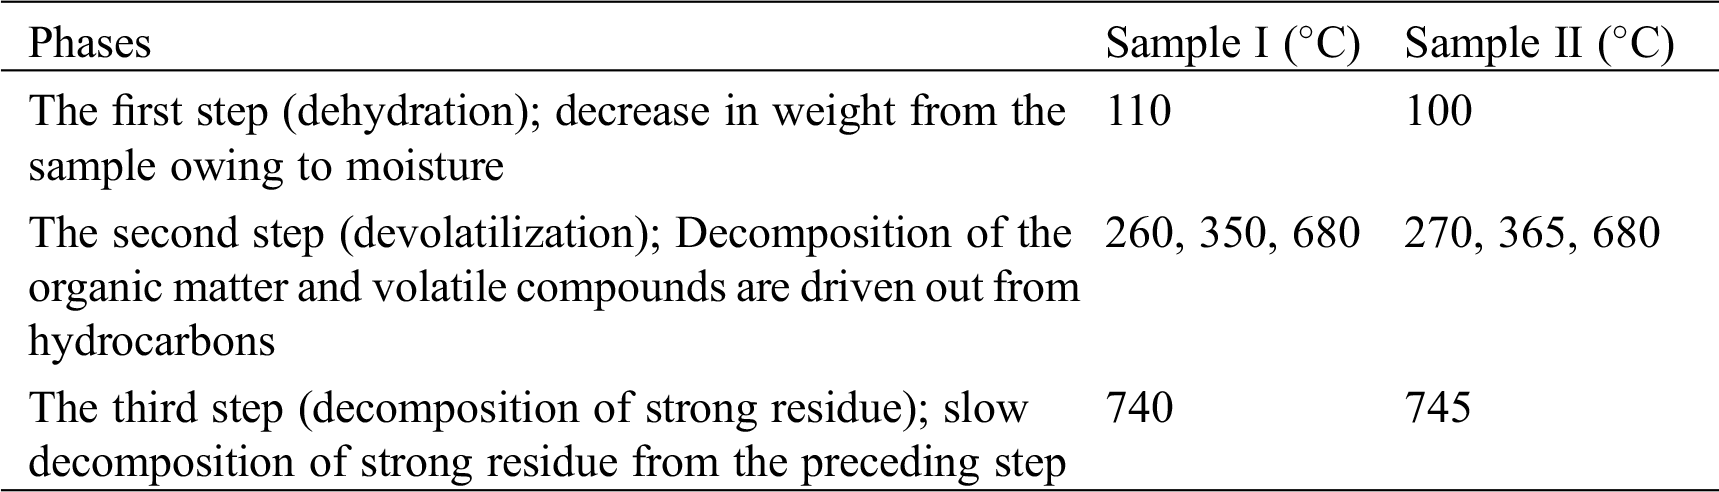
Table 2: Assignment of bands on the surface of Spirulina sp. to the functional group as studied from FTIR spectroscopy [12]
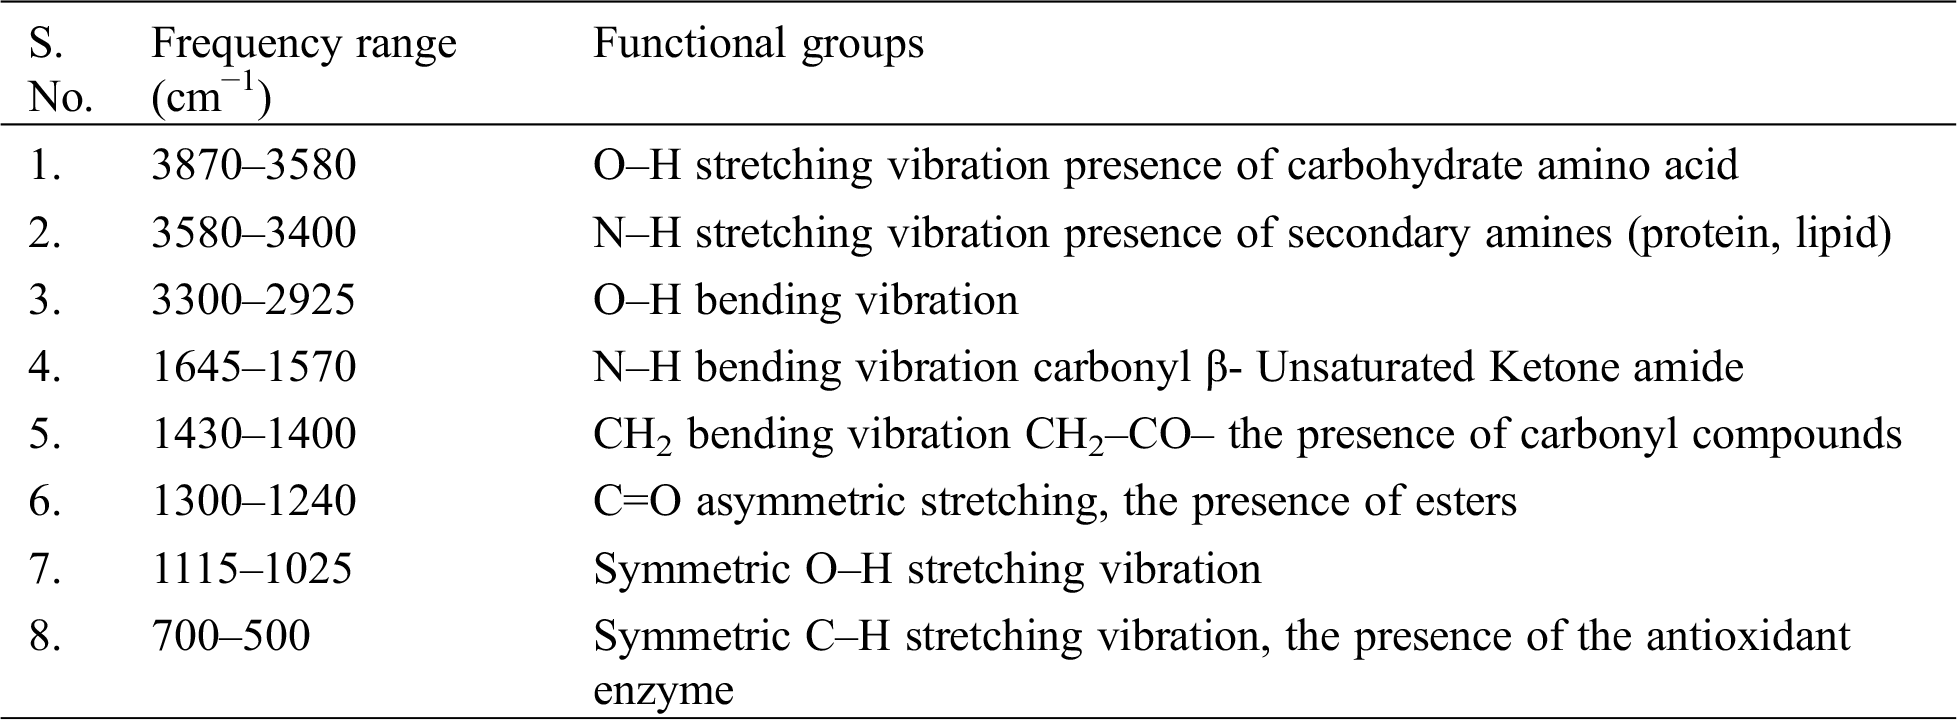
Table 3: Nutritional composition of spirulina with KNO3 and urea
3.2 Infrared Analysis Spectroscopy (FTIR)
Infrared spectroscopy is the absorption spectrum of molecular vibration frequencies, and any functional group has Infrared absorption. Spirulina sp. Spectrum observed in the figure O–H, N–H, C=O groups were discovered in 3 and 4. Hydroxyl group present together with C=O and also affirmed that COOH groups were present in the bio sorbentgroup. Together with the carbonyl group, the existence of the NH group and OH group could be attributed to the existence of amino acid groups in the bio sorbent. Besides, the stretching vibration of OH, NH, and CO groups changed to some extent, suggesting that these three groups may be engaged in biosorption. Assigning bands as noted from FTIR spectroscopy to a functional group on the Spirulina surface.
The aforementioned functional groups can be observed in the Spirulina FTIR evaluation (Tab. 2). The Infrared spectrum displays a frequency range of 3870–3580, 3300–2925 cm−1 representing Hydroxyl stretching and bending vibration, presence of carbohydrate amino acids. In the N–H bending of secondary amines in carbonyl β unsaturated ketone amide, the following peaks of 1645–1570 cm−1 are present. The frequency varies in the bending vibration of CH2 from a peak of 1430–1400 cm−1. The specific frequency varies from 1300–1240 cm−1 C–O stretching of O–H bending alcohol. The aforementioned frequency spectrum of 1300–1250 cm−1, the existence of carbonyl asymmetric C–O–C stretch esters, peak range of 1115–1025 cm−1 in symmetric C–H stretching, the existence of antioxidant enzymes [7]. Biological molecules like algae show complicated vibrational spectra including implications and all combinations of bands [21–24]. High levels of proteins, vitamins, phycocyanin, and antioxidants were evaluated by Spirulina FT-IR. Figs. 5 and 6 gives the illustration of open pond system with urea and KNO3.
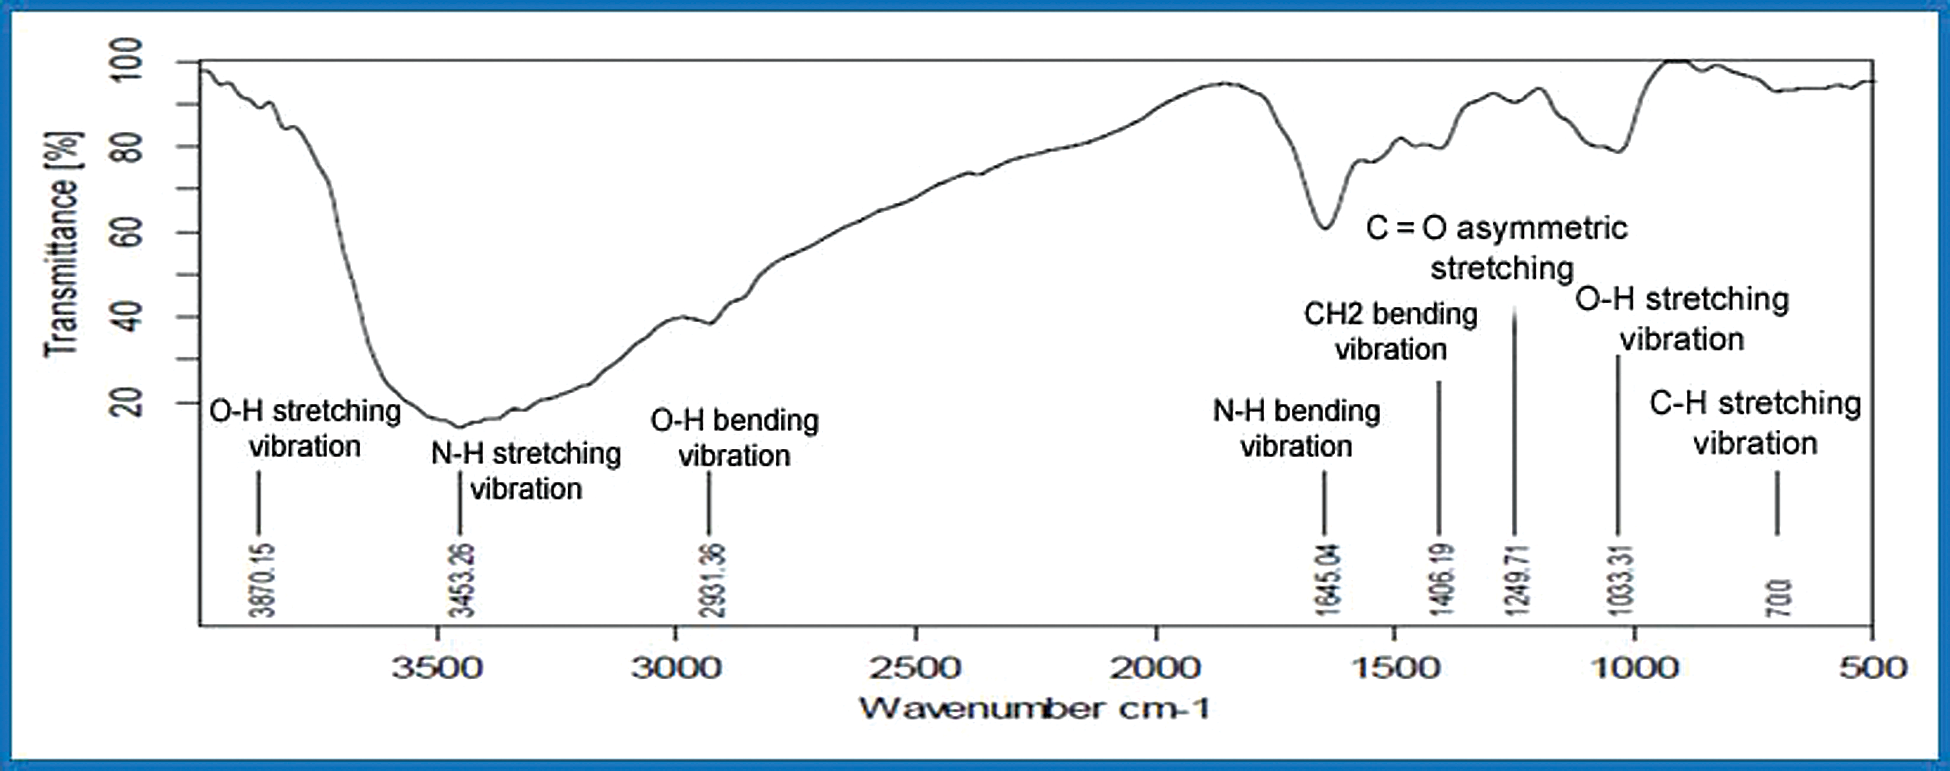
Figure 5: FTIR of open pond system with urea
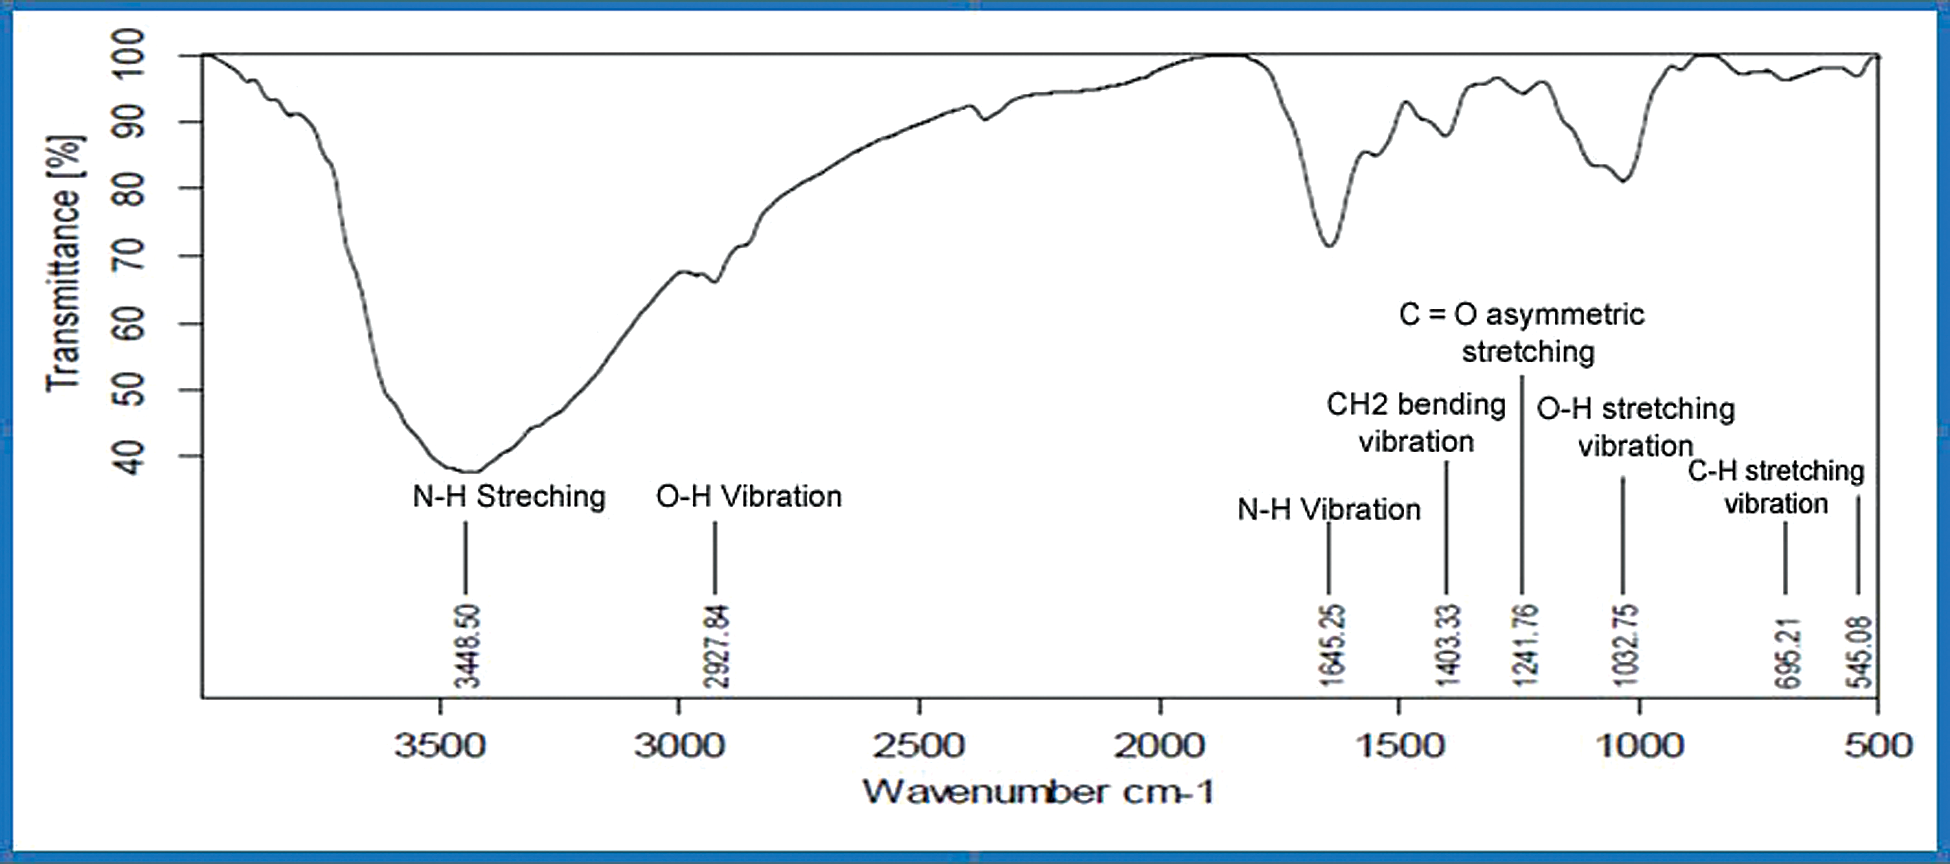
Figure 6: FTIR of open pond system of with KNO3
Fig. 8, provides the proximate and ultimate assessment of microalgae biomass. Thermogravimetric analysis (TGA) is a useful way to determine moisture content (MC), volatile matter, fixed carbon, and ash [25–27]. The volatile matter is the organic matter lost between 110°C and 700°C and the ash content is the weight remaining after 900°C. Fixed carbon content (FC) is determined by the difference in complete sample and humidity content, volatile matter (VM), and ash content. The primary components and their estimated composition (wt percent) were coal (21.45 percent), oxygen (22.45 percent), oil (6.57 percent), with an elevated content of nitrogen (15.42 percent) due to the existence of the protein. The elevated N content makes a substantial distinction between algal biomass and lignocellulosic feedstocks, typically containing <1 percent nitrogen. The findings indicate that, due to the elevated ash content, the carbon content of microalgae (in proportion) is much smaller. Fig. 7 gives the ultimate and elemental analysis of Spirulina samples. It gives the nutritional composition of the open system with KNO3 and Urea, wherein the percentage of protein, carbohydrates, lipids, and fats have been calculated.
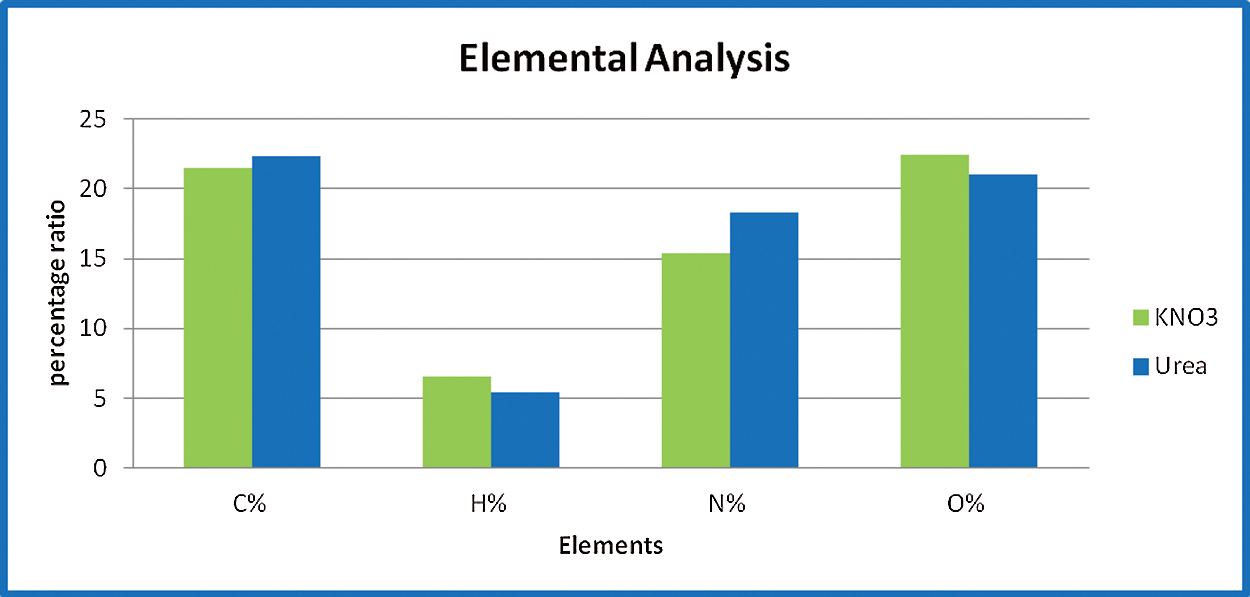
Figure 7: Elemental analysis of an open system with KNO3 and Urea
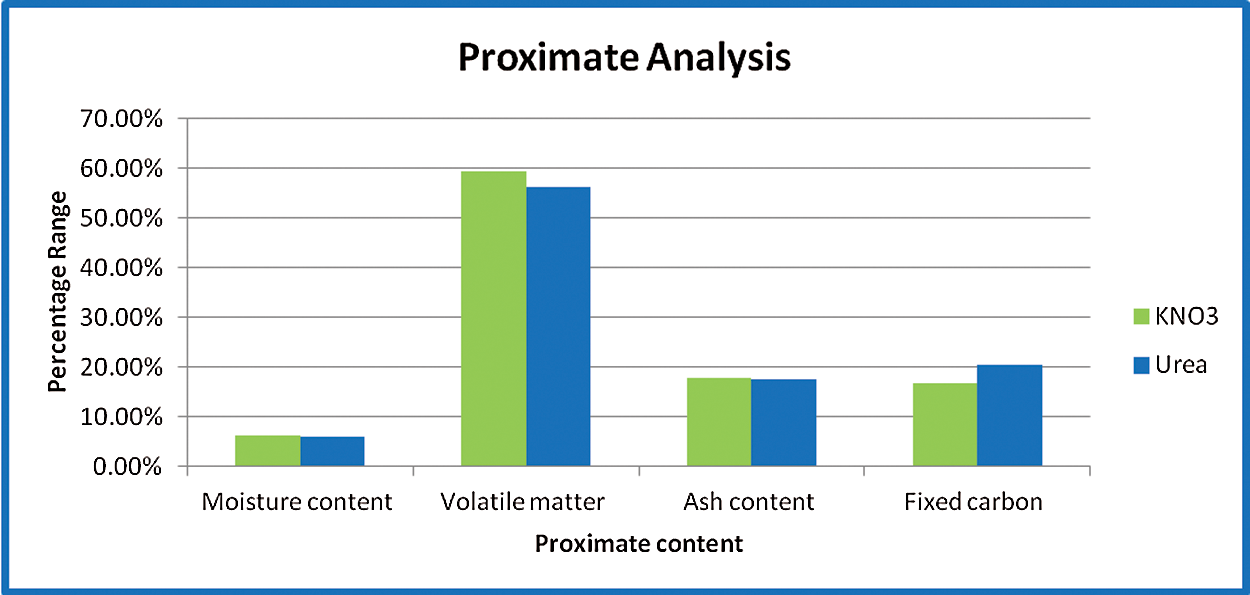
Figure 8: Proximate analysis of open system with KNO3 and Urea
Nutritional conditions are a critical factor affecting the growth and productivity of microalgae grown in mass cultures. This investigation was conducted with the primary objective of developing a simple and inexpensive method for lowering the cost of large-scale Spirulina production. This objective was accomplished by substituting cheaper and locally available commercial fertilizers and chemicals for the nitrogen sources.
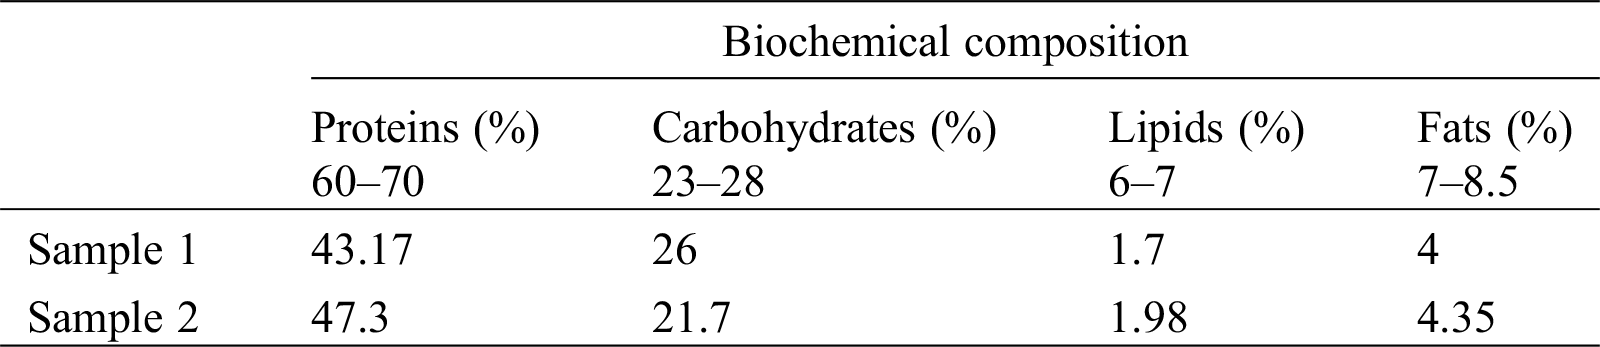
Among the nutrients required for algae growth, nitrogen is a critical component that is necessary for microalgae to maintain high production rates. Changes in the source of nitrogen and the amount of cultivated media constrain microalgae’s intensive growth and alter their pigment and biochemical composition. The present study examined the effect of various concentrations of two nitrogen sources on the productivity of S. platensis. Potassium nitrate and urea were chosen due to their lower cost (e.g., ammonium nitrate, sodium nitrate, or ammonium chloride). Nitrates contain one nitrogen atom (14%–16% nitrogen). Although urea has been recognized as a good source of nitrogen that algae can successfully metabolize. As can be seen from the biochemical composition, sample 2 had a higher protein content due to the addition of urea. Additionally, it is used in proximate and elemental analysis. The nitrogen content of sample 2 was higher, while the moisture and volatile matter content were lower. This clearly demonstrates that sample 2 produced superior results and that the nitrogen content of urea can be used in future studies (Tab. 3).
4 Discussion, Limitation, and Future Scope
CHN/TGA/FTIR is a feasible alternative for the determination of algae biomass thermal and biochemical composition. Overall, these techniques benefit from a broad spectrum of qualitative and quantitative information. In Spirulina sp. microalgae 59.32% of the sample consist of oxygenated, nitrogenated, and sulfide components. Microalgae decomposed in three significant degradation steps that can also be observed in the infrared spectrum. The comparison of the microalgae and the extraction residue sample demonstrates that the intensity of the band corresponding to CH is significantly important in the microalgae than in the residue [7]. The powdered spirulina sample FTIR assessment demonstrated the presence of CONH2, OH, CO, and CH surface-bound groups. FTIR spectroscopy offers a feasible choice for frequent microalgae identification as it is less time-consuming and economic than molecular techniques. Massive cultivation of microalgae requires significant investment owing to costly start-up and operating costs [28–30]. Protein-rich microalgae will rely on preliminary studies and field trials to recognize their true potential [15].
The following conclusions are derived from the experimental research and outcomes:
• Based on the systematic evaluation, spirulina contains protein, lipid, carbohydrates, aliphatic (C–H), carbonyl (esters and enzymes), carbonyl beta-unsaturated ketone amide (C=N), ester, symmetric C–H stretching vibration. The infrared spectral fingerprints of the product determine the significant element of the spirulina powder as a protein quality based on the assessment of the spirulina biomass.
• The various biochemical components of microalgae appear to be decomposed as follows: first, polysaccharides and proteins, then lipids. Although sodium nitrate seemed more optimal for S. platensis growth, potassium nitrate and urea can serve as alternative nitrogen sources, since this cyanobacterium shows the utilization of these nitrogen sources at low concentrations.
• The different steps of decomposition of microalgae species could be defined with the help of TGA. Microalgae decomposition takes place in three significant steps of degradation that can also be observed in TGA. Results showed that the thermal degradation rate of the first sample tends to be greater than the second sample of spirulina.
• The FTIR spectroscopic analysis reviewed the algae biomass functional groups. Dry algae analysis through FTIR clearly showed the presence of CONH2, OH, CO, and CH groups. FTIR/TGA research could be used to estimate the percentage of protein in specified microalgae;
• A mixture of FTIR/TGA offers an outstanding tool for characterization of Microalga spirulina sp. It is an important raw material for the production of sustainable proteins and biofuels.
• However, more research is needed to improve the necessary protein production and quality. While these components may be used to assess the accuracy of the lipid content of a given microalga, further in-depth studies are needed to clarify this point.
Funding Statement: The authors received no specific funding for this study.
Conflicts of Interest: The authors declare that they have no conflicts of interest to report regarding the present study.
1. Mostafa, S. S., El-Gendy, N. S. (2017). Evaluation of fuel properties for microalgae spirulina platensis bio-diesel and its blends with Egyptian petro-diesel. Arabian Journal of Chemistry, 10, S2040–S2050. DOI 10.1016/j.arabjc.2013.07.034. [Google Scholar] [CrossRef]
2. Soni, R. A., Sudhakar, K., Rana, R. S. (2017). Spirulina–from growth to nutritional product: A review. Trends in Food Science & Technology, 69, 157–171. DOI 10.1016/j.tifs.2017.09.010. [Google Scholar] [CrossRef]
3. Sudhakar, K., Soni, R. A. (2017). Carbon sequestration through solar bioreactors: Industrial strategies. Carbon utilization, pp. 143–155, Singapore: Springer. [Google Scholar]
4. Shabana, E. F., Gabr, M. A., Moussa, H. R., El-Shaer, E. A., Ismaiel, M. M. (2017). Biochemical composition and antioxidant activities of arthrospira (Spirulina) platensis in response to gamma irradiation. Food Chemistry, 214, 550–555. DOI 10.1016/j.foodchem.2016.07.109. [Google Scholar] [CrossRef]
5. Schenk, P. M., Thomas-Hall, S. R., Stephens, E., Marx, U. C., Mussgnug, J. H. et al. (2008). Second generation biofuels: High-efficiency microalgae for biodiesel production. Bioenergy Research, 1(1), 20–43. DOI 10.1007/s12155-008-9008-8. [Google Scholar] [CrossRef]
6. Pane, L., Franceschi, E., De Nuccio, L., Carli, A. (2001). Applications of thermal analysis on the marine phytoplankton, tetraselmis suecica. Journal of Thermal Analysis and Calorimetry, 66(1), 145–154. DOI 10.1023/A:1012443800271. [Google Scholar] [CrossRef]
7. Marcilla, A., Gómez-Siurana, A., Gomis, C., Chápuli, E., Catalá, M. C. et al. (2009). Characterization of microalgal species through TGA/FTIR analysis: Application to nannochloropsis sp. Thermochimica Acta, 484(1–2), 41–47. DOI 10.1016/j.tca.2008.12.005. [Google Scholar] [CrossRef]
8. Pan-Utai, W., Kahapana, W., Iamtham, S. (2018). Extraction of C-phycocyanin from arthrospira (Spirulina) and its thermal stability with citric acid. Journal of Applied Phycology, 30(1), 231–242. DOI 10.1007/s10811-017-1155-x. [Google Scholar] [CrossRef]
9. Reddy, H. K., Muppaneni, T., Patil, P. D., Ponnusamy, S., Cooke, P. et al. (2014). Direct conversion of wet algae to crude biodiesel under supercritical ethanol conditions. Fuel, 115, 720–726. DOI 10.1016/j.fuel.2013.07.090. [Google Scholar] [CrossRef]
10. Wang, X., Hu, M., Hu, W., Chen, Z., Liu, S. et al. (2016). Thermogravimetric kinetic study of agricultural residue biomass pyrolysis based on combined kinetics. Bioresource Technology, 219, 510–520. DOI 10.1016/j.biortech.2016.07.136. [Google Scholar] [CrossRef]
11. Li, S., Ma, X., Liu, G., Guo, M. (2016). A TG–FTIR investigation to the co-pyrolysis of oil shale with coal. Journal of Analytical and Applied Pyrolysis, 120, 540–548. DOI 10.1016/j.jaap.2016.07.009. [Google Scholar] [CrossRef]
12. Murugan, P., Dhanushkodi, S., Sudhakar, K., Wilson, V. H. (2021). Industrial and small-scale biomass dryers: An overview. Energy Engineering, 118(3), 435–446. DOI 10.32604/EE.2021.013491. [Google Scholar] [CrossRef]
13. Gai, C., Zhang, Y., Chen, W. T., Zhang, P., Dong, Y. (2013). Thermogravimetric and kinetic analysis of thermal decomposition characteristics of low-lipid microalgae. Bioresource Technology, 150, 139–148. DOI 10.1016/j.biortech.2013.09.137. [Google Scholar] [CrossRef]
14. Soni, R. A., Sudhakar, K., Rana, R. S. (2016). Biophotovoltaics and biohydrogen through artificial photosynthesis: An overview. International Journal of Environment and Sustainable Development, 15(3), 313–325. DOI 10.1504/IJESD.2016.077391. [Google Scholar] [CrossRef]
15. Sudhakar, K., Premalatha, M. (2012). Micro-algal technology for sustainable energy production: State of the art. Journal of Sustainable Energy & Environment, 3, 59–62. [Google Scholar]
16. Krul, E. S. (2019). Calculation of nitrogen-to-protein conversion factors: A review with a focus on soy protein. Journal of the American Oil Chemists’ Society, 96(4), 339–364. DOI 10.1002/aocs.12196. [Google Scholar] [CrossRef]
17. López, C. V. G., García, M. D. C. C., Fernández, F. G. A., Bustos, C. S., Chisti, Y. et al. (2010). Protein measurements of microalgal and cyanobacterial biomass. Bioresource Technology, 101(19), 7587–7591. DOI 10.1016/j.biortech.2010.04.077. [Google Scholar] [CrossRef]
18. Becker, E. W. (2007). Micro-algae as a source of protein. Biotechnology Advances, 25(2), 207–210. DOI 10.1016/j.biotechadv.2006.11.002. [Google Scholar] [CrossRef]
19. Albalasmeh, A. A., Berhe, A. A., Ghezzehei, T. A. (2013). A new method for rapid determination of carbohydrate and total carbon concentrations using UV spectrophotometry. Carbohydrate Polymers, 97(2), 253–261. DOI 10.1016/j.carbpol.2013.04.072. [Google Scholar] [CrossRef]
20. Vo, T., Nguyen, N. A., Huynh, P. T., Nguyen, H., Nim, T. et al. (2017). The growth and lipid accumulation of spirulina sp. under different light conditions. World Journal of Food Science and Technology, 1(3), 101–104. DOI 10.11648/j.wjfst.20170103.13. [Google Scholar] [CrossRef]
21. Peng, W., Wu, Q., Tu, P., Zhao, N. (2001). Pyrolytic characteristics of microalgae as renewable energy source determined by thermogravimetric analysis. Bioresource Technology, 80(1), 1–7. DOI 10.1016/S0960-8524(01)00072-4. [Google Scholar] [CrossRef]
22. Zhu, L., Ketola, T. (2012). Microalgae production as a biofuel feedstock: Risks and challenges. International Journal of Sustainable Development & World Ecology, 19(3), 268–274. DOI 10.1080/13504509.2011.636083. [Google Scholar] [CrossRef]
23. Sudhakar, K., Rajesh, M., Premalatha, M. (2012). A mathematical model to assess the potential of algal bio-fuels in India. Energy Sources, Part A: Recovery, Utilization, and Environmental Effects, 34(12), 1114–1120. DOI 10.1080/15567036.2011.645121. [Google Scholar] [CrossRef]
24. Pulz, O., Gross, W. (2004). Valuable products from biotechnology of microalgae. Applied Microbiology and Biotechnology, 65(6), 635–648. DOI 10.1007/s00253-004-1647-x. [Google Scholar] [CrossRef]
25. Apt, K. E., Behrens, P. W. (1999). Commercial developments in microalgal biotechnology. Journal of Phycology, 35(2), 215–226. DOI 10.1046/j.1529-8817.1999.3520215.x. [Google Scholar] [CrossRef]
26. Borowitzka, M. A. (1995). Microalgae as sources of pharmaceuticals and other biologically active compounds. Journal of Applied Phycology, 7(1), 3–15. DOI 10.1007/BF00003544. [Google Scholar] [CrossRef]
27. Rebolloso-Fuentes, M. M., Navarro-Pérez, A., García-Camacho, F., Ramos-Miras, J. J., Guil-Guerrero, J. L. (2001). Biomass nutrient profiles of the microalga nannochloropsis. Journal of Agricultural and Food Chemistry, 49(6), 2966–2972. DOI 10.1021/jf0010376. [Google Scholar] [CrossRef]
28. Shao, W., Ebaid, R., Abomohra, A. E. F., Shahen, M. (2018). Enhancement of spirulina biomass production and cadmium biosorption using combined static magnetic field. Bioresource Technology, 265, 163–169. DOI 10.1016/j.biortech.2018.06.009. [Google Scholar] [CrossRef]
29. Sudhakar, K., Premalatha, M. (2015). Characterization of micro algal biomass through FTIR/TGA/CHN analysis: Application to scenedesmus sp. Energy Sources, Part A: Recovery, Utilization, and Environmental Effects, 37(21), 2330–2337. DOI 10.1080/15567036.2013.825661. [Google Scholar] [CrossRef]
30. Soni, R. A., Sudhakar, K., Rana, R. S. (2019). Comparative study on the growth performance of spirulina platensis on modifying culture media. Energy Reports, 5, 327–336. DOI 10.1016/j.egyr.2019.02.009. [Google Scholar] [CrossRef]
 | This work is licensed under a Creative Commons Attribution 4.0 International License, which permits unrestricted use, distribution, and reproduction in any medium, provided the original work is properly cited. |