| Energy Engineering |
DOI: 10.32604/EE.2021.015028
ARTICLE
Analysis of Driving Factors of Natural Gas Consumption in China: Based on Regional Integration and LMDI Method
School of Economic and Management, China University of Petroleum (Beijing), Beijing, China
*Corresponding Author: Huiwen Xu. Email: huiwen8412@gmail.com
Received: 17 November 2020; Accepted: 28 December 2020
Abstract: In recent years, China has developed rapidly in terms of natural gas. Driven by regional economic integration, a regional natural gas market composed of neighboring provinces and cities has taken shape gradually, and it tends to grow toward the same direction in policy formulation, resource coordination, facility construction and market expansion. Based on the factors such as geographical location, economic conditions and natural gas consumption, this thesis tends to conduct a horizontal comparative analysis on the economic development conditions, natural gas consumption characteristics and natural gas pipeline network density of the three regions with obvious regional integration feature in China. Then according to LMDI, four core indicators, namely economic growth effect, energy intensity effect, energy structure effect, and substitution effect are selected. The thesis is expected to explore the contribution of different indicators to the growth of natural gas consumption in these three different regions. According to the results, it can be concluded that the driving factors of natural gas consumption differ greatly among regions. Specifically speaking, the more developed the economy is, the greater the contribution of the energy substitution effect to natural gas consumption will be, and the contribution of the economic growth effect to natural gas consumption will be smaller. Despite that the contribution of energy intensity in different regions shows slight difference, the energy structure contributes the least effect, which further explains the current differences in China’s natural gas consumption characteristics and the reasons behind.
Keywords: Regional integration; natural gas consumption; influencing factor; LMDI
Subscripts
| BTH: | Beijing-Tianjin-Hebei |
| JZS: | Jiangsu-Zhejiang-Shanghai |
| CSGY: | Chongqing-Sichuan-Guizhou-Yunnan |
| CM: | Cubic Meters |
| BCM: | Billion Cubic Meters |
| $: | U.S. Dollars |
| K: | Thousand |
| M: | Million |
| B: | Billion |
With the motivation of low-carbon trend and driven by the transition to clean energy, and low-carbon trend, China has witnessed been experiencing a steady increase in natural gas consumption, which further improves natural gas industry -chain and expands natural gas market. In 2019, the natural gas consumption in China recorded 306.7 billion cubic meters, which means a sharp increase of 9.4% compared to with in 2018, and now accounts for 8% of primary energy consumption. In terms of consumption structure, urban gas and industrial gas still serve as main sources of consumption, accounting for 37% and 35% of total consumption respectively while power generation and chemical consumption take up a relatively low proportions [1].
China now still remains at the stage of rapid growth on natural gas consumption, this situation is externally driven by the prosperity of the global natural gas market whilst rapid economic development and urgent demand of transition to clean energy serve as the internal driving forces. Along with the urbanization and the demand for energy transition, natural gas shows a promising future in improving the gasification level of urban residents, promoting heating supply in the southern regions, and accelerating gasification in key areas. It is predicated that China’s natural gas consumption will probably keep growing steadily in the next few years.
The development of natural gas market is closely related to the economic development. With the increasing regionalization of China’s economic development, the natural gas market also presents typical regional characteristics. According to this and from a regional perspective, applying LMDI method to analyze the factors which influcence the natural gas consumption in different regions will be feasible and the findings will provide a very meaningful reference for governments to formulate policies of differentiation and enterprises to generate effective competition strategies.
Based on the characteristics of current regional integration development in China, this paper selects three representative regions in terms of economic development and natural gas consumption. On the basis of the characteristics of natural gas consumption analysis and horrizontal comparision, the LMDI analysis method is applied to calculate the contributions of economic growth effect, energy intensity effect, energy structure effect and substitution effect to the growth of natural gas consumption in different regions. Based on the differences of regional characteristics and contributions of various influencing factors, the paper studies the characteristics and rules of driving factors of natural gas consumption in China from the perspective of regional integration, and puts forward corresponding development strategies and suggestions.
2.1 Study on Influencing Factors of China’s Natural Gas Consumption
With rapid growth of natural gas consumption in China, scholars engaged to analyze influencing factors of natural gas consumption from different perspectives and with different theoretical methods.
Based on the Thiel index, Zhu analyzed the consumption differences within and among the four major regions of China, namely the Eastern, the Central, the Western and the Northeastern and she proposed corresponding policy suggestions. On the basis of regional differences, she proposed corresponding policy suggestions [2]. Gao constructed a decomposition model of urban natural gas consumption, and then conducted a quantitative analysis on the impact of different factors on urban natural gas consumption from nine dimensions, namely spatial expansion, pipe network density, population density, urbanization, residential gasification rate, consumption elasticity, natural gas substitution, economic growth and pipe scale [3]. Through By applying the BMA method, Chai constructed six benchmark models based on twelve factors such as economic level, industrial structure, energy structure, and natural gas price, as well as attempted to predict the future natural gas consumption [4]. According to the Grey Relation Model, Wang screened three core factors from seven influencing factors, namely GDP, industrial structure, environmental protection mechanism, urbanization rate, population density, energy consumption intensity, and energy consumption structure. On basis of this, he analyzed the internal relation between these three core factors with and natural gas consumption. Afterwards, a fractional GM (1, N) model was established to predict the demand of the Eastern, the Central and the Western regions of China for natural gas usage. According to the research results, it can be concluded that economic growth, substitution effect, and energy intensity all play a positive roles in promoting the increase of natural gas consumption [5].
It can be seen that is obvious that many scholars have used different theoretical methods to explore the differences in influencing factors of natural gas consumption and already achieved certain research results fruits. As one of the mostre common research methods, regional classification method is widely used in the analysis of the influencing factors of natural gas consumption, which often choose to divide divided China into several regions and to compared the differences on the influencing factors of consumption. This kind of market division based on the whole is convenient for analysis and comparison, but it is difficult to accurately reflect the consumption characteristics and driving factors differences of the specific natural gas regional market.
LMDI’s full name is Logarithmic Mean Divisia Index, which is an Index Decomposition Analysis (IDA) method. It often decomposes target value into multiple predefined influencing factors, and then calculates total change value or change rate, finally obtains contributions of different influencing factors to target value. Ang who recommended LMDI method based on reviewing the development and applications of IDA methods, provided a practical guide that includes the general formulation process, summary tables for easy reference and examples [6–10].
As a decomposition analysis method, LMDI has many advantages, such as composition in both quantity and strength index, flexibility and wide application range. It can not only fully decompose the interaction terms generated by traditional exponential decomposition to obtain unique decomposition results, but also effectively deal with the zero or negative value in the decomposition process [11].
LMDI is identified as an ideal method to analyze energy consumption factors and has been widely applied for studying influencing factors to national energy consumption and carbon emission [12–17]. Kopidou applied LMDI method to industrial CO2 emissions in Southern European countries and found that it was difficult for Southern European consumers to switch to a more environmentally conscious use of industrial products [18]. Jesus analyzed the drivers behind the changes of the Aggregate Carbon Intensity (ACI) of Latin America and the Caribbean (LAC) power sector in five periods between 1990 and 2017c, and he revealed structural reasons for the increase of the ACI in 1995–2003 and 2008–2015, and intensity reasons for the decrease of the ACI in 1990–1995, 2003–2008 and 2015–2017 [19]. Kyonghwa decomposed Korean industrial manufacturing greenhouse gas (GHG) emissions by using LMDI method, both multiplicatively and additively. The results indicated that both the structure effect and intensity effect played important roles in reducing GHG emissions, and between which, and the structure effect played a more important role than the intensity effect [20].
LMDI has also been used on analyzing influencing factors of natural gas consumption. Shao applied a LMDI decomposition model to discuss the technical effect and the final demand effect to the driving mode of China’s energy consumption growth in four phases [21]. Chai examined the influencing factors on China’s natural gas consumption by LMDI decomposition method, and found that fossil energy structure and non-clean energy structure were the most important factors followed by urbanization, per capita GDP, industrialization and industrial energy intensity [22].
Although LMDI has been widely used in carbon emissions, energy consumption and other aspects, there is still a lack of professional research in some other fields. For natural gas consumption, research related to LMDI is still at its embryonic stage and needs more professional applications. Based on the perspective of regional integration, this paper analyzes influencing factors of natural gas consumption in China with better combining regional integration and consumption market by applying LMDI decomposition method, and will effectively fill the research gap.
3 Analysis of Natural Gas Consumption Characteristics in Typical Regions
Regional integration plays an active role in accelerating regional resource integration, improving regional market efficiency, and promoting regional coordinated development. It is an effective model for improving the quality of economic development and energy utilization efficiency. Since the impact of COVID-19 is continuing and hard to predicate when the epidemic situation can be much improved, China’s economic development is suffering an unprecedented challenge, and therefore, to further promote the development of regional economic integration and to accelerate more free and open trade among adjacent provinces become the inevitable choice. Regional integration not only meets with the requirement of current regional industrial structure adjustment, but also can effectively prevent or reduce the risk of reverse globalization and global industrial chain cutting. After decades of economic development and accumulation, China now has many favourable conditions for building regional integrated economic systems around large urban agglomerations. The economic integration of the Yangtze River Delta, the coordinated development of Region BTH, and the development of the Guangdong-Hong Kong-Macao Greater Bay Area have become national strategies, which shows that the regional economic integration has become an important feature and inevitable trend of China’s economic development.
Nowadays, it is common to see provincial-level natural gas pipe companies and their existence makes the boundaries among the provincial-level natural gas markets more clear. Neighboring provinces can form good commonality in terms of industrial chain complementation, resource allocation, and facility coordination, and the increasing political, economic and energetic connection of these provinces lead to further integration on the construction of supervision system, the realization of interconnection of pipe networks and the improvement of price transparency mechanism. The regional market composed of neighboring provinces will become an important part of China’s natural gas market, and the study of driving factors of natural gas consumption market from the perspective of regional integration is more in line with the future development direction.
Based on the current regional economic status and natural gas consumption characteristics in China, the paper takes three representative regions for analysis. Region BTH, Region JZS and Region CSGY which are located in the north, southeast and southwest of China respectively. Region BTH is the economic circle around the capital, Region JZS is the traditionally developed and the main natural gas consumption area, and Region CSGY is an important natural gas production area. There are significant differences among them in terms of population density, economic development degree and natural gas consumption, which represent different economic development levels and natural gas market development stages. Population, GDP and natural gas consumption in the three regions are shown in Tab. 1, which illustrates that the three regions represent different status of economic and natural gas consumption in China [23].
Table 1: Population, GDP and Gas consumption of typical regions (2017)

3.1 Analysis of Natural Gas Consumption Characteristics in Region BTH
Region BTH integration is a regional integration vigorously promoted by the Chinese government in recent years. According toFrom the average per capita GDP ranking (2008–2017), Beijing, Tianjin and Hebei are ranked 2nd, 3rd and 15th, respectively. As Since the population of Hebei Province accounts for 67% of the region in Tab. 2, we can infer that the whole region belongs to a medium level of economic development. Region BTH integration is a regional integration vigorously promoted by the Chinese government in recent years. Implementing joint prevention and control of air pollution and improving the air quality level of in Beijing and its surrounding areas are important objectives of regional integration, in which natural gas can play a huge role.
Table 2: Population, GDP and gas consumption-region BTH (2017)

The GDP contribution ratio of Beijing and Tianjin is significantly higher than that of population, which indicating that there are great differences in economic development in this region. Hebei Province, accounting for 67% of the population, is obviously backward in economic development and low in its natural gas utilization level is lower. From 2008 to 2017, the average growth rate of natural gas consumption in Region BTHH was 17.11%, and the average growth rate of GDP in the same period was 10.8% in Fig. 1. The growth rate of natural gas consumption was higher than the economic growth rate. Judging from the growth rate over the past years, we can conclude that the consumption fluctuated obviously, and the difference between the lowest growth rate in 2011 (6%) and the highest growth rate in 2015 (32%) exceeded 26%, indicating that the natural gas development in this region has not yet entered a mature stage, and it is greatly influenced by external factors such as policies and economic development.

Figure 1: Natural gas consumption and growth rate-region BTH (2008–2017)
The substitution of natural gas for replacing traditional fossil fuel energy sources such as coal and oil is an important way to realize the consumption growth of natural gas. From 2008 to 2017, natural gas consumption in Region BTH increased from 4.7% to 14.1%, coal consumption decreased from 83.1% to 70.1%, and oil consumption increased from 12.2% to 15.8%, the increase and decrease in Fig. 2 indicating that natural gas and oil have a substitution effect on coal and what’s more, with natural gas as worked as the main substitute.

Figure 2: Consumption comparison of coal, petroleum and gas-region BTH (2008–2017)
3.2 Analysis of Natural Gas Consumption Characteristics in Region JZS
From the ranking of average per capita GDP from 2008 to 2017, Shanghai, Jiangsu and Zhejiang ranked first, fourth and fifth, respectively, which marked it is one of the most developed regions in China. As a densely populated and economically developed region in Tab. 3, the region has high requirements for energy efficiency and low-carbon development, and natural gas has been playings an important role in economic development and energy consumption.
Table 3: Population, GDP and gas consumption-region JZS (2017)

Jiangsu, Zhejiang and Shanghai are equal in economic development, and the level of natural gas consumption and economic development is basically the same. From 2008 to 2017, the average growth rate of natural gas consumption was 17.08%, and the average growth rate of GDP in the same period was 11.25%. The growth rate of natural gas consumption was obviously higher than the economic growth rate. Obvious fluctuation wan shown when we take a review on the growth rate over the past years and we could see the lowest growth rate in 2009 (5%) is quite different from the highest growth rate in 2011 (30%) in Fig. 3, indicating that the growth of natural gas consumption in this region has not yet entered a mature stage, and it is greatly influenced by policies, economic development and other factors.

Figure 3: Natural gas consumption and growth rate-region JZS (2008–2017)
From 2008 to 2017, natural gas consumption in Jiangsu, Zhejiang and Shanghai increased from 4.0% to 11.8%, while coal consumption decreased from 76.6% to 67.6% and oil consumption increased from 19.4% to 20.6%. The substitution effect of natural gas on coal was obvious in Fig. 4, which meant the increase of natural gas mainly came from the substitution of coal, while the proportion of oil remained basically unchanged.
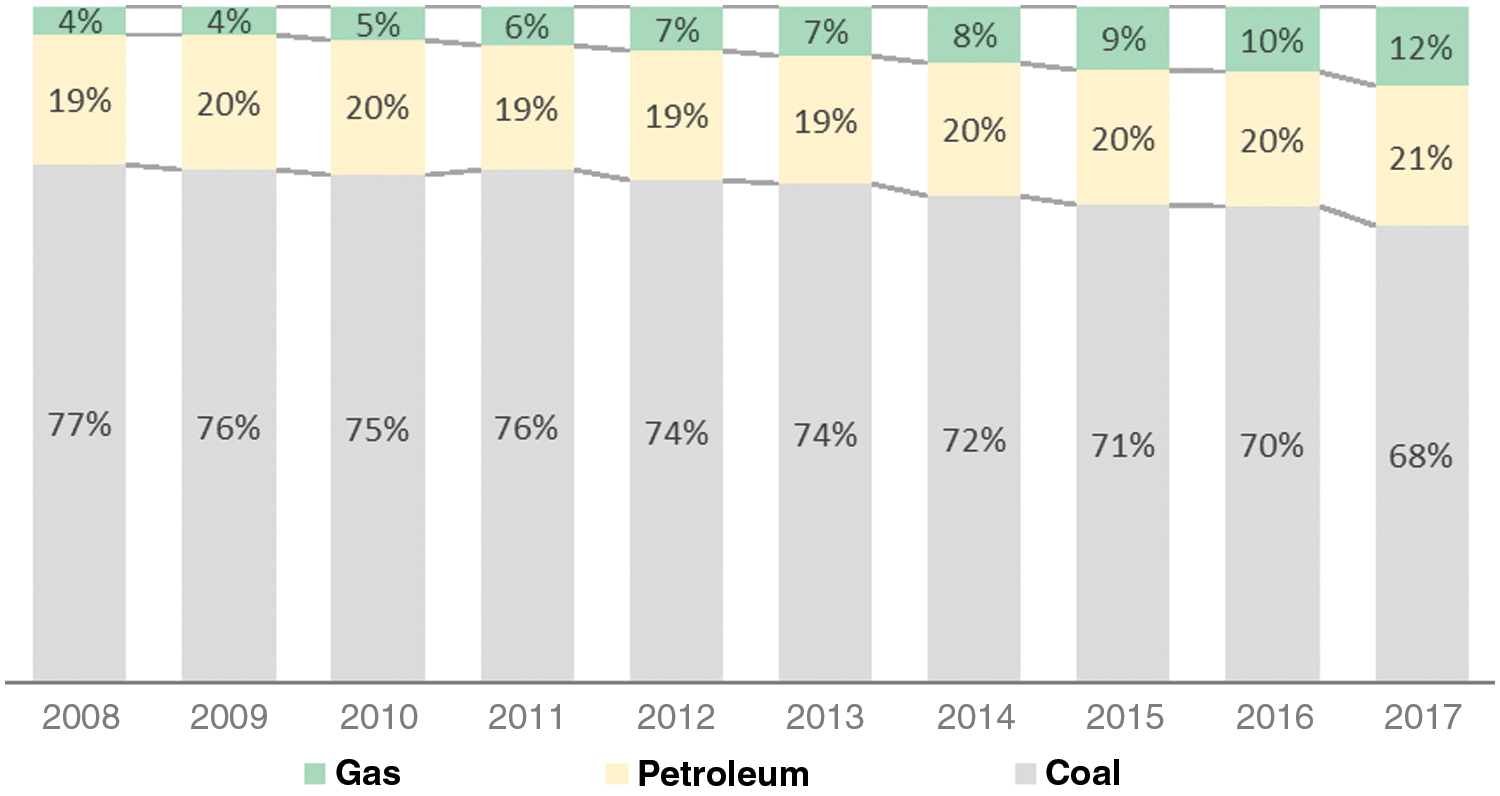
Figure 4: Consumption comparison of coal, petroleum and gas-region JZS (2008–2017)
3.3 Analysis of Natural Gas Consumption Characteristics in Region CSGY
Chongqing, Sichuan, Yunnan and Guizhou rank 12th, 24th, 29th and 31st in China in terms of average GDP per capita (2008–2017) and Region CSGY belongs to China’s underdeveloped regions as shown in Tab. 4.
Table 4: Population, GDP and gas consumption-region CSGY (2017)

The overall economic development level of region SCGY lags behind the whole country, the internal economic development level is uneven, and the natural gas consumption is also quite different among the four provinces. Sichuan is a major natural gas producing province and Chongqing is the most economically developed municipality in this region, the two contribute 92% of the natural gas consumption. From 2008 to 2017, the average annual growth rate of natural gas consumption was 7.17%, while the average GDP increased by 14.18% during the same period. The growth rate of natural gas consumption was significantly lower than the economic growth rate, and the natural gas development and utilization were not satisfactory. Compared with Region BTH and Region JZS, the growth rate of natural gas was much more stable. Except for 29% in 2010, the growth rate in other years is below 10% in Fig. 5. Although Sichuan is an important natural gas producing area in China, this region has not fully played its advantage, and the utilization of natural gas in Yunnan and Guizhou, which are geographically close to Sichuan, needs to be improved urgently.

Figure 5: Natural gas consumption and growth rate-region CSGY (2008–2017)
From 2008 to 2017, among the three energy resources, the proportion of natural gas consumption increased from 7.5% to 11.8%, while coal decreased from 81.0% to 67.3% and oil increased from 11.5% to 20.9% in Fig. 6. Compared with the other two regions, the proportion of natural gas in Region CSGY was the highest at the beginning of the period, but it did not significantly replace coal in the follow-up development. In the past ten years, the proportion of natural gas only increased by about 4%, while the proportion of oil increased by nearly 9% in the same period. The substitution effect of oil on coal was more obvious, and meanwhile, it is implied that the natural gas market in this region developed slowly during this period.

Figure 6: Consumption comparison of coal, petroleum and gas-region CSGY (2008–2017)
3.4 Comparison of Natural Gas Consumption Characteristics in Different Regions
The density of natural gas pipe network plays a vital role in determining the potentiality of the natural gas consumption market in a region. Through the horizontal comparison of natural gas consumption and pipe network density in the three regions from 2008 to 2017, this paper attempts to analyze the development course and consumption driving characteristics of natural gas consumption in different regions.
In terms of natural gas consumption, the rank in 2008 was like following: The Region CSGY > Region JZS > Region BTH. In 2017, the rank was Region JZS > Region BTH > Region CSGY. Region BTH ranks the top in the total consumption and per capita consumption, followed by Region JZS in Fig. 7. In addition, both the two regions show an increase in the per capita natural gas consumption by more than 250%. As for Region CSGY, it obviously lagged far behind, without doubling the total consumption and per capita consumption in the 10 years. Sichuan, as one of the most important areas in producing natural gas, it is much more convenient for it to consume natural gas than other regions that lack in the construction of natural gas pipe network. But along with the gradual completion of the national natural gas pipe network, the distance from the gas production area no longer plays a decisive role in determining natural gas consumption situation. Instead, the eastern region whose economy developes faster can afford higher natural gas price, and hence gradually turns into the main region for natural gas consumption.

Figure 7: Gas consumption comparison of three typical regions (2008–2017)
As for the natural gas pipe network, Region JZS and Region BTH have witnessed an increase in the density of which by 477 km/k sq.km and 207 km/k sq.km respectively from 2008 to 2017 in Fig. 8. But Region CSGY only increased by 49 km/k sq.km during the same period, about 1/10 and 1/4 of the other two regions. The slow economic development of Region CSGY is the main reason for the low demand on natural gas consumption.

Figure 8: Comparison of pipeline network distribution (2008–2017)
Both Region JZS and Region BTH play better performance in the growth of natural gas consumption compared with Region CSGY. Such a phenomenon is mainly driven by two factors, economic development and the coverage increase of natural gas pipe network. In addition, policy also plays a vital role in the natural gas consumption in the three regions. For example, Region BTH implements the policy of “substitution of coal with gas,” and Jiangsu implements the policy of “gasification of Jiangsu.” In the context of increasing pipe network coverage, the distance from gas producing areas has exerted less impact on natural gas consumption. Instead, factors such as price affordability and pipe network coverage are playing more and more important roles.
4 Analysis of Influencing Factors of Natural Gas Consumption in Typical Regions
LMDI takes indicator analysis into effect and it is widely applied in the analysis of influencing factors. Natural gas consumption serves as the most intuitive indicator reflecting the development of the natural gas industry, and many factors such as policies, economy, and facilities jointly determine its development level. Among the many factors that affect natural gas consumption, economic development, energy intensity, energy structure, and substitution level represent more direct ones. To be specific, the level of economic development determines the affordability of residents, energy intensity indicates the market demand for clean energy, energy structure implies the development trend of clean energy, and the substitution of natural gas for traditional fossil fuel energy such as coal constitutes a vital path to realize consumption growth.
4.1 Analysis of Influencing Factors of Natural Gas Consumption by Provinces
LMDI analysis is conducted on the influencing factors to ten provinces and regions, namely Beijing, Tianjin, Hebei, Shanghai, Jiangsu, Zhejiang, Chongqing, Sichuan, Yunnan, and Guizhou, and then it studies their differences in the factors influencing natural gas consumption. The paper takes relevant data from 2005 to 2017. GDP represents the economic growth effect, and the ratio of total energy consumption to GDP represents the energy intensity effect. In addition, the proportion of fossil energy (oil, coal, natural gas) in total energy consumption represents the energy structure effect, and the proportion of natural gas in fossil energy represents the substitution effect.
In which,
Q: Natural gas consumption; G: GDP; E: Gross energy consumption; F: Fossil energy consumption; i: province/city; EI: Energy intensity; ES: Energy structure; GS: Natural gas substitution
According to the analysis results of the ten provinces and regions, the economic growth effect and substitution effect show positive contributions. In other words, economic growth and the substitution of natural gas for other energy sources promote the growth of natural gas consumption. On the other hand, the energy intensity effect shows a negative contribution. In other words, the lower the energy intensity is, the more conducive to the growth of natural gas consumption it will be. As for the energy structure effect, it shows slight impact on the growth of natural gas consumption.
In terms of specific contribution, the economic growth effect and substitution effect account for the In terms of specific contribution, the economic growth effect and substitution effect account for the largest proportion of more than 80% to natural gas consumption, while the energy structure effect contributes the least in Fig. 9. Even though the general situation is similar, different provinces show discrepant characteristics. For example, Zhejiang and Jiangsu are dominated by substitution effects, with a proportion of more than 70%. In Beijing, Tianjin, Hebei, and Shanghai, the substitution effect slightly overwhelms the economic growth effect. Provinces in Region CSGY are dominated by the economic growth effect, and substitution effect is insignificant.

Figure 9: Contributions of different effects in 10 provinces (2005–2017)
4.2 Analysis of Influencing Factors of Natural Gas Consumption by Regions
Natural gas consumption is characterized by typical regional features. Based on the analysis of abovementioned 10 provinces, the paper further starts from the perspective of regional integration and takes the neighboring provinces as a whole object to analyze. On this basis, this paper attempts to analyze factors influencing the natural gas consumption in the three regions, namely Region BTH, Region JZS and Region CSGY. In this turn, it still selects relevant data from 2005 to 2017, and then analyses four influencing factors, namely economic development level, energy intensity, energy structure, and substitution level by applying the LMDI method.
In which,
Q: Natural gas consumption; n: Regions; i: Province/city; G: GDP; EI: Energy intensity; ES: Energy structure; GS: Natural gas substitution
In Region BTH, the economic effect and substitution effect provide more obvious contribution, followed by the energy intensity effect in Fig. 10. In addition, the energy structure effect has exerts no influence, and the substitution effect responds at the fastest speed in terms of growth rate. From 2005 to 2017, factors to influence natural gas consumption have gradually shifted, it turned from single contribution in the original to multiple ones at present.

Figure 10: Contributions of different effects-region BTH (2005–2017)
In Region JZS, the substitution effect shows the most obvious contribution, followed by the economic effect and energy intensity effect, the energy structure effect contributes the least in Fig. 11. From 2005 to 2017, the substitution effect had always contributed the most to the regional natural gas consumption. Such a result is closely related to the fact that the region, as the most economically developed area, attaches great importance to energy transition and clean energy utilization based on its own resource endowment characteristics and low-carbon economic development demand.

Figure 11: Contributions of different effects-region JZS (2005–2017)
The analysis result of Region CSGY shows completely different effect characteristics. The economic effect always serves as the most important factor, followed by the energy intensity effect and the substitution effect and energy structure effect contribute less in Fig. 12. As the least economically developed region among the three, economic factors in Region CSGY have always accounted for a relatively high proportion of the contribution of natural gas consumption from 2005 to 2017, while the substitution effect has contributed the least.
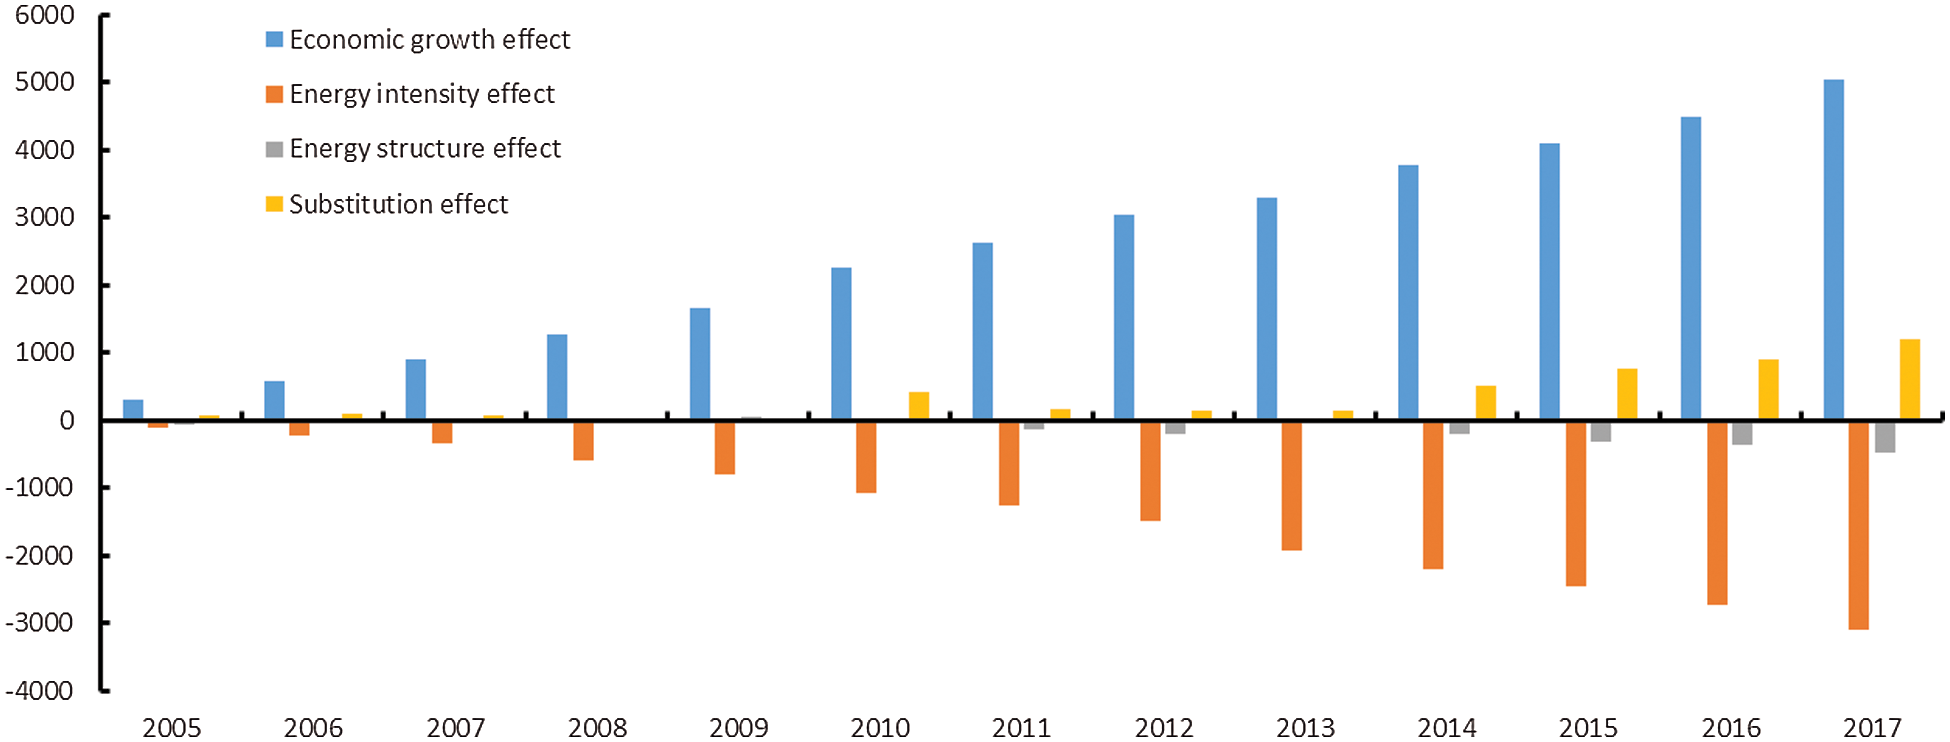
Figure 12: Contributions of different effects-region CSGY (2005–2017)
The Three regions to analyze represent different levels of China’s economic development and natural gas consumption. As the economic circle around the capital, Region BTH is the most developed region and the best in promoting natural gas consumption in Northern China; As the leader of China’s economy, Region JZS is the area with the best promotion of natural gas utilization and the densest coverage of network facilities; Region CSGY is the typical representative of underdeveloped areas in the Midwest, which lags behind other two regions in terms of overall economic development and natural gas consumption. Based on the perspective of regional integration and through LMDI analysis in Tab. 5, the factors influencing the natural gas consumption in China have following characteristics:
1. When the economic develops to a certain extent, the energy transition and the urgent demand for clean energy will emerge and accompany, the substitution effect will gradually turn into the main factor for natural gas consumption motivation;
2. The economic growth effect has always exerted an impact on natural gas consumption. Natural gas, as a type of clean energy, does not show absolute advantages over traditional fossil energy sources such as coal in terms of cost and facility construction. Therefore, the economic level serves as a vital factor for a region to encourage natural gas consumption;
3. The energy intensity effect on natural gas consumption places at a certain level, but it is less obvious than that of the economic effect and substitution effect;
4. The energy structure effect shows the least impact on the promotion of natural gas consumption.
Table 5: Contribution of different effects (2005–2017)

It can be inferred that there are significant differences in the driving factors of natural gas consumption in different regional markets, which are mainly caused by two reasons. Firstly, different economic development levels lead to the discrepancy of energy demand. Developed regions are more willing to transform energy and have a strong natural gas price affordability, so natural gas consumption is in line with the development concept of improving energy utilization efficiency in the region while on the contrary, developing regions give priority to energy consumption rather than energy utilization efficiency. Secondly, the perfection degree of natural gas infrastructure determines the natural gas competitiveness. The eastern developed areas are densely populated, with high density of natural gas pipe network and complete supporting infrastructures. Under the scale effect, natural gas has lower unit transportation cost and stronger alternative competitiveness.
The rapid economic development and regional integration in China have provided good opportunities to accelerate the growth of natural gas industry and the increase of natural gas consumption. According to the differences of driving factors for consumption and the unbalanced characteristics of development in various regions, it is necessary to take measures as follows:
1. Taking into consideration the characteristics of regional economic development and natural gas consumption, strengthen regional policy formulation, promote the interconnection of pipe network facilities in the region.
2. Giving full play to the role of existing natural gas trunk pipelines, speed up the construction of branch lines, further increase the utilization rate of existing facilities.
3. Further improving the pricing system for gas distribution and gas sales, enhance the competitiveness of natural gas to other alternative energy sources, and build a more fair, efficient and open regional natural gas market system.
Funding Statement: The authors received no specific funding for this study.
Conflicts of Interest: The authors declare that they have no conflicts of interest to report regarding the present study.
1. The Oxford Institute for Energy Studies (2020). China natural gas development report. China: Petroleum Industry Press. [Google Scholar]
2. Zhu, C. (2017). The study on regional differences of natural gas consumption in China. Beijing: China University of Petroleum. [Google Scholar]
3. Gao, J., Dong, X. (2018). Stimulating factors of urban gas consumption in China. Natural Gas Industry, 38, 130–137. [Google Scholar]
4. Chai, J., Wang, Y., Kin, K. (2019). Analysis of forecast of China’s natural gas consumption under the new normal. Operations Research and Management Science, 28, 175–183. [Google Scholar]
5. Wang, J., Li, N. (2020). Influencing factors and future trends of natural gas demand in the Eastern, Central and Western areas of China based on the grey model. Natural Gas Industry, 40, 149–158. [Google Scholar]
6. Ang, B. W. (2004). Decomposition analysis for policymaking in energy: Which is the preferred method? Energy Policy, 32(9), 1131–1139. DOI 10.1016/S0301-4215(03)00076-4. [Google Scholar] [CrossRef]
7. Ang, B. W. (2005). The LMDI approach to decomposition analysis: a practical guide. Energy Policy, 33(7), 867–871. DOI 10.1016/j.enpol.2003.10.010. [Google Scholar] [CrossRef]
8. Ang, B. W., Liu, N. (2007). Energy decomposition analysis: IEA model versus other methods. Energy Policy, 35(3), 1426–1432. DOI 10.1016/j.enpol.2006.04.020. [Google Scholar] [CrossRef]
9. Ang, B. W., Huang, H. C., Mu, A. R. (2009). Properties and linkages of some index decomposition analysis methods. Energy Policy, 37(11), 4624–4632. DOI 10.1016/j.enpol.2009.06.017. [Google Scholar] [CrossRef]
10. Ang, B. W., Xu, X. (2013). Tracking industrial energy efficiency trends using index decomposition analysis. Energy Economics, 40, 1014–1021. DOI 10.1016/j.eneco.2013.05.014. [Google Scholar] [CrossRef]
11. Ang, B. W. (2015). LMDI decomposition approach: A guide for implementation. Energy Policy, 86(3), 233–238. DOI 10.1016/j.enpol.2015.07.007. [Google Scholar] [CrossRef]
12. Escalante, J. M., Martínez, A. (2012). Theoretical study about the gain in indirect bandgap semiconductor optical cavities. Physica B: Condensed Matter, 407(12), 2044–2049. DOI 10.1016/j.physb.2012.02.002. [Google Scholar] [CrossRef]
13. Wood, R., Lenzen, M. (2006). Zero-value problems of the logarithmic mean divisia index decomposition method. Energy Policy, 34(12), 1326–1331. DOI 10.1016/j.enpol.2004.11.010. [Google Scholar] [CrossRef]
14. Hatzigeorgiou, E., Polatidis, H., Haralambopoulos, D. (2008). CO2 emissions in Greece for 1990-2002: A decomposition analysis and comparison of results using the Arithmetic Mean Divisia Index and Logarithmic Mean Divisia Index techniques. Energy, 33(3), 492–499. DOI 10.1016/j.energy.2007.09.014. [Google Scholar] [CrossRef]
15. González, P. F., Landajo, M., Presno, M. J. (2014). Tracking European Union CO2 emissions through LMDI (logarithmic-mean Divisia index) decomposition. The activity revaluation approach. Energy, 73, 741–750. [Google Scholar]
16. Lin, B., Long, H. (2016). Emissions reduction in China’s chemical industry—Based on LMDI. Renewable and Sustainable Energy Reviews, 53(8), 1348–1355. DOI 10.1016/j.rser.2015.09.045. [Google Scholar] [CrossRef]
17. Fetanat, A., Shafipour, G. (2017). A hybrid method of LMDI, symmetrical components, and SFA to estimate the distribution of energy-saving potential with consideration of unbalanced components in decomposition analysis. Energy Efficiency, 10(4), 1041–1059. DOI 10.1007/s12053-016-9505-0. [Google Scholar] [CrossRef]
18. Kopidou, D., Diakoulaki, D. (2017). Decomposing industrial CO2 emissions of Southern European countries into production-and consumption-based driving factors. Journal of Cleaner Production, 167(3), 1325–1334. DOI 10.1016/j.jclepro.2017.05.183. [Google Scholar] [CrossRef]
19. Jesus, P., Galvis, J., Rojas-Lozano, D., Yusta, M. (2020). Multitemporal LMDI index decomposition analysis to explain the changes of ACI by the power sector in Latin America and the Caribbean between 1990–2017. Energies, 13(9), 2328. DOI 10.3390/en13092328. [Google Scholar] [CrossRef]
20. Jeong, K., Kim, S. (2013). LMDI decomposition analysis of greenhouse gas emissions in the Korean manufacturing sector. Energy Policy, 62, 1245–1253. DOI 10.1016/j.enpol.2013.06.077. [Google Scholar] [CrossRef]
21. Shao, C., Su, D. (2015). The phase characteristics of China’s energy consumption growth: Empirical research based on LMDI model. South China Journal of Economics, 33, 1–17. [Google Scholar]
22. Chai, J., Liang, T., Lai, K. K., Zhang, Z. G., Wang, S. (2018). The future natural gas consumption in China: Based on the LMDI-STIRPAT-PLSR framework and scenario analysis. Energy Policy, 119(9), 215–225. DOI 10.1016/j.enpol.2018.04.049. [Google Scholar] [CrossRef]
23. China National Bureau of Statistics (2020). https://data.stats.gov.cn/easyquery.htm?cn=A01. [Google Scholar]
 | This work is licensed under a Creative Commons Attribution 4.0 International License, which permits unrestricted use, distribution, and reproduction in any medium, provided the original work is properly cited. |