| Energy Engineering |
DOI: 10.32604/EE.2021.014162
ARTICLE
Open-Circuit Faults Diagnosis in Direct-Drive PMSG Wind Turbine Converter
1Engineering Research Center of Hunan Province for the Mining and Utilization of Wind Turbines Operation Data, Hunan University of Science and Technology, Xiangtan, 411201, China
2School of Mechanical Engineering, Hunan University of Science and Technology, Xiangtan, 411201, China
3XEMC Wind Power Co., Ltd., Xiangtan, 411201, China
*Corresponding Author: Qihui Ling. Email: lqh_hunan@163.com
Received: 05 September 2020; Accepted: 29 December 2020
Abstract: The condition monitoring and fault diagnosis have been identified as the key to achieving higher availabilities of wind turbines. Numerous studies show that the open-circuit fault is a significant contributor to the failures of wind turbine converter. However, the multiple faults combinations and the influence of wind speed changes abruptly, grid voltage sags and noise interference have brought great challenges to fault diagnosis. Accordingly, concerning the open-circuit fault of converters in direct-driven PMSG wind turbine, a diagnostic method for multiple open-circuit faults is proposed in this paper, which is divided into two tasks: The first one is the fault detection and the second one is the fault localization. The detection method is based on the relative current residuals after exponential transformation and on an adaptive threshold, and the localization method is based on the average values of fault phase currents. The scheduled diagnosis method is available to both the generator-side converter and the grid-side converter, allowing to detect and locate single and double open-circuit faults. For validating this, robustness test and multiple open-circuit faults diagnosis are presented in a 2-MW direct-driven PMSG wind turbine system, the results validate the reliability and effectiveness of the proposed method.
Keywords: Wind turbine; converter; open-circuit fault; fault diagnosis; exponential transformation
Power converter is a hub connecting generator and power grid, which is mainly composed of two identical converters: The generator-side converter (GESC) representing a three-phase rectifier that converts the AC voltage in generator-side to a DC voltage across the DC coupling capacitor; the grid-side converter (GRSC) representing the inverter that converts the DC voltage to an AC voltage with the grid’s voltage and frequency [1]. Therefore, as the key component of wind turbines (WTs), the reliability level of converters directly determine whether WTs can connect to power grid in a safe state. The insulated gate bipolar transistor (IGBT) is the core component of the converter. The statistical data presented in [2,3] show that failures in converters are a significant contributor to the overall failure rate of modern WTs, the failure rate of converters is higher compared with the other components, where annual failure rate becomes to more than 15%, and 34% of failures in converters result from IGBTs. With the power generation capacity of WTs increases gradually, the demand for reliability and safety of power converters is increasing. Thus, fault detection and localization of IGBTs has always become a research hotspot.
There have been a large quantity of relevant research works that mainly focus on two aspects. The first one is IGBT short-circuit (SC) faults diagnosis research in WT converter. SC faults lead to an abnormal over current that can cause permanent damage to IGBTs, the time between the fault initiation and equipment damage is very short [4]. Therefore, SC faults detection and protection methods are mostly based on hardware circuits in order to deal with the faults rapidly, and the technologies have been extremely mature [5]. The IGBT gate driver with the model of 1IPSE1S45-100, produced by InPower, can detect SC faults by detecting the collector current change rate (di/dt) of high-power IGBT within 2.16 μs after the fault initiation, and then the driver turns off IGBT immediately [6]. The second one is IGBT open-circuit (OC) faults diagnosis research in WT converter. OC faults are relatively mild and do not lead to serious damage compared with SC faults. But this fault easily degrades the WTs performance, affects the power quality and makes the output phase current distortion. In addition, the DC currents generate unequal stress in the upper and lower transistors. These effects may cause secondary faults in the converter, motor, or load [4,7]. The use of the current Park’s vector shape monitoring approach for detecting the switch devices of three-parallel power converters in a wind-turbine system is presented in [8]. However, the technique generally has the disadvantage of slow detection. In order to mitigate these problems, the Park’s vector normalized currents and errors of their average absolute values were utilized to improve the immunity against the issue of false alarms and processing speed in [9]. The proposed method can allow for the diagnosis of single and a part of multiple OC faults. For the fixed threshold, the lack of adaptability to the system makes it prone to produce a negative impact on the reliability of the diagnosis results. A fault diagnosis scheme based on three phase output currents is proposed for single and multiple transistors open circuit in PWM VSI fed vector control drives in [10]. Evaluated the capability and robustness for accurate fault diagnosis under noisy variable wind conditions, a new fault diagnosis method for permanent magnet synchronous generator (PMSG) WTs converter OC faults is proposed in [11], but this method is only available for diagnosing single OC faults. A fault diagnosis method for OC faults based on real-time current amplitude is proposed in [12], which compares the current amplitude in the fault state with the set current amplitude threshold eliminates the misdiagnosis caused by errors. The diagnosis approach proposed in [13] is based on the average absolute value of the normalized stator currents, which is independent of the amplitude changes. However, the methods in [12,13] are only applied for diagnosing single-phase OC faults. Through the installation of voltage sensors, rapid fault detection could be achieved using voltage signal in [14–16], nevertheless, they require additional voltage sensors, which lead to a rise in the system cost, therefore they have clear limitations in application. The application of intelligent algorithm in fault diagnosis is not rare recently, machine learning diagnosis methods was adopted in [17–19], where Zhang et al. [17] extracts the original voltage signals and proposes a strategy containing wavelet transform, feature analysis, judgment and BPNN classification, Tan et al. [18] extracts the constraint relationship between the three-phase circuits and adopts the ANN fault detection method using correlation features, Zhang et al. [19] presents a strategy containing FP-Growth, WPT, K-means, LSTM, analysis and weight to conduct the reliability assessment of PMSG wind power converter. These series of methods whereas the complex computations increase the diagnosis time, and there is a huge amount of training parameters. Although the methods do not depend on the system model, the general approach to select and set of fault characteristics is not fully investigated at present. Furthermore, the fault diagnosis techniques based on observer have got extensive attentions of scholars. A diagnosis method for OC faults in converters based on interval sliding mode observer was proposed in [20], the Mixed Logic Dynamic model of the converter was established by using the current flow direction of the switch under normal working and fault conditions. A novel diagnosis method for OC fault of voltage sensor less inverter based on second-order sliding mode observer and hybrid logic dynamic model is proposed in [21], but the chattering phenomenon of sliding mode observer is serious. An adaptive diagnosis method for OC faults based on the bilinear observer is proposed in the converter of doubly-fed WTs in [22]. According to the voltage distortion observer, a diagnosis method for single-phase OC faults of generator-side converter is proposed in [23].
A review of literature shows that the existing research works regarding the development of OC faults diagnostic algorithms entirely dedicated to converters in direct-driven PMSG wind turbine (D-PMSGWT) have obvious drawbacks related to the few type of diagnosable fault and lack of adaptability and portability, which cannot be used both for the GESC and the GRSC. Affected by the converter structure and control strategy in D-PMSGWT, the combination of faulty IGBTs is diverse, which leads to the corresponding phase currents distinct degree of distortion. The stable operation of converter is interfered with conditions such as random wind speed and voltage sags. Apart from these, the current sensors signals are often mixed with noise signals, which increase the total harmonics distortion (THD) of currents. Obviously, all of these bring great challenges to OC faults diagnosis. In this context, this paper designs an effective diagnosis method for OC faults of converters in D-PMSGWT. The considered technique requires three PMSG phase currents and three grid phase currents only, allowing to achieve single and double IGBT OC faults detection and localization in both the GESC and the GRSC.
The remainder of the paper is organized as follows. In Section 2, the focused topology and the current equations of direct-driven PMSG wind power converter system are addressed and analyzed. In Section 3, the diagnostic principle and method are described, and the fault states are classified. Robustness test and multiple open-circuit faults diagnosis are presented to verify the reliability and effectiveness of the proposed fault diagnostic method in Section 4. The conclusions of this paper are drawn in Section 5.
2 Model of Wind Power Converter System
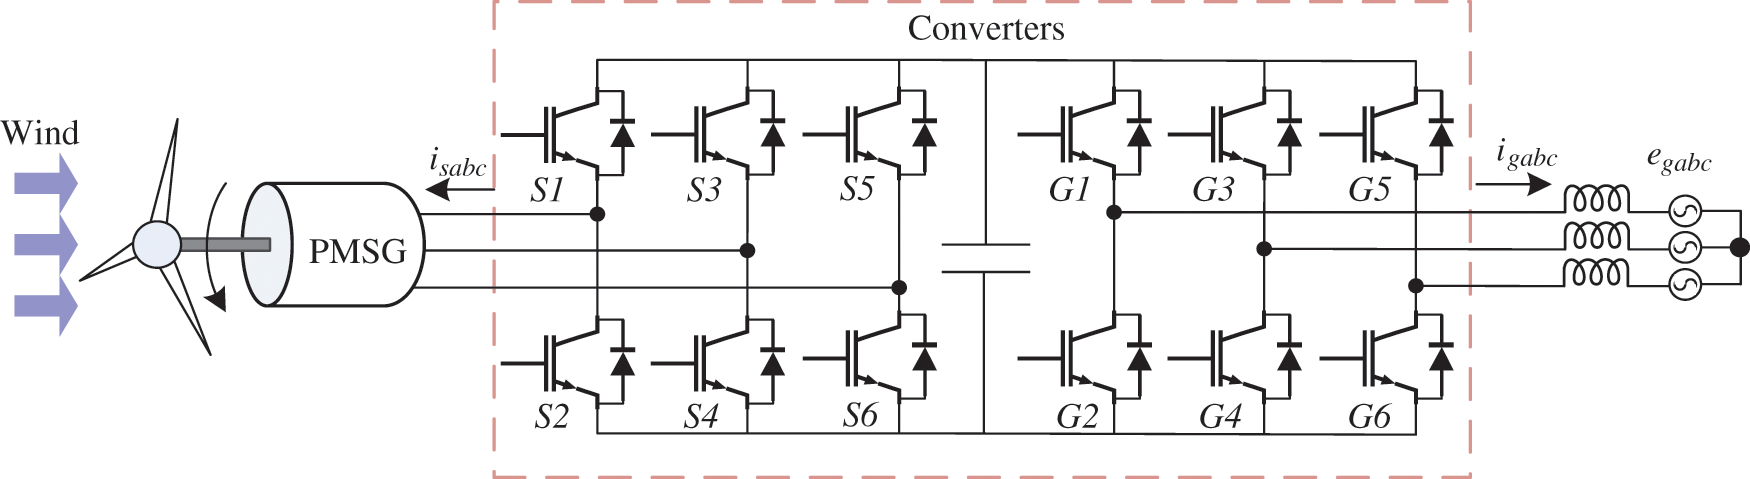
Figure 1: Structure diagram of direct-driven PMSG wind power converter system
The extensively applied topology of direct-driven PMSG wind power converter system, as depicted in Fig. 1, comprises PMSG and full power converter. Full power converter connects PMSG and power grid, it adopts double-PWM structure, which is indirect AC to AC converter (AC-DC-AC), including the GESC, DC capacitor and the GRSC. Each converter is composed of six IGBTs and their respective antiparallel diodes. Typically, stator flux oriented vector control is applied in the GESC to control PMSG, whereas power system voltage oriented vector control is applied in the GRSC to keep DC-link voltage stable; furthermore, the space vector pulse width modulation (SVPWM) strategies are applied for both converters (GESC and GRSC) to output PWM signals.
Since the current path of converter is formed by IGBTs and their respective antiparallel diodes, the fault phase current will lose its normal waveform, and the healthy phase current will be offset with the occurrence of IGBT OC fault of the converter [24]. According to this characteristic, the current signals can be implemented for faults diagnosis. The current equations of PMSG and grid-side converter in the dq synchronous rotating frame can be represented as (1) and (2), respectively:
where usd and usq are PMSG dq-axes voltage components; isd and isq are PMSG dq-axes current components; Ψf is PMSG magnets flux linkage; ωs is PMSG electrical angular speed; Rs is PMSG stator resistance; Lsd and Lsq are PMSG dq-axes stator inductance components and Lsd is equal to Lsq.
where ugd and ugq are grid-side converter dq-axes voltage components; egd and egq are power grid dq-axes voltage components; igd and igq are grid-side dq-axes current components; ωg is grid rotational angular speed; Rg is grid-side equivalent resistance; Lgd and Lgq are grid-side dq-axes equivalent inductance components and Lgd is equal to Lgq.
In order to detect the phase with OC fault, the detection method mainly includes three steps, designed and illustrated in the block diagram of Fig. 2. The first step is establishing Luenberger observer to obtain three-phase observed currents. The second step is calculating current relative residuals by measured and observed currents to design the detection variables. In the third step, two adaptive thresholds are designed for both converters based on the corresponding detection variables respectively. The detection purposes are achieved through the comparison of detection variables and adaptive threshold. The detailed design process is performed as follows:
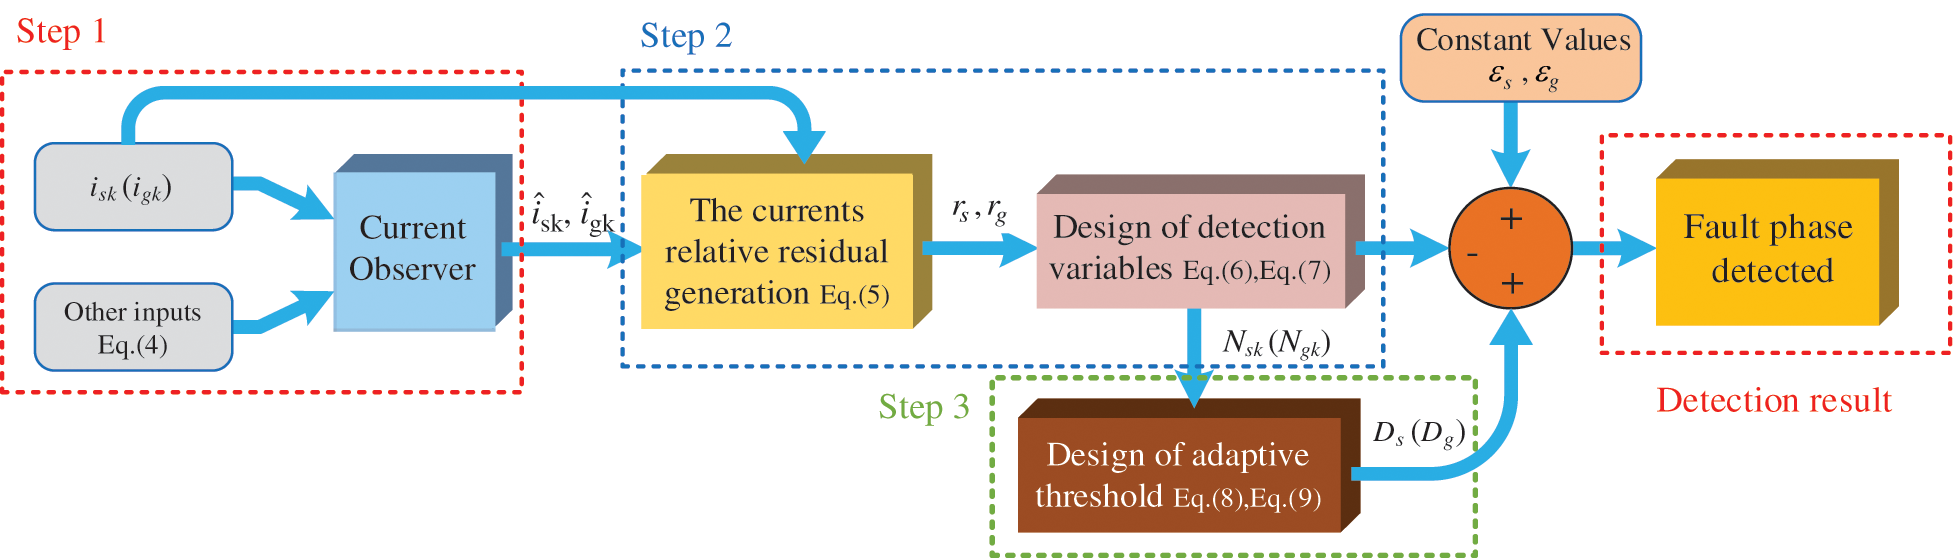
Figure 2: Block diagram of the fault detection method
Step 1: Design of the Luenberger Observer
Three-phase observed currents of both the GESC and the GRSC can be obtained by means of a Luenberger observer, which is based on the state space model. Therefore, according to (1) and (2), usd, usq, ugd and ugq are selected as input variables, concurrently, isd, isq, igd and igq as state variables, the state space model of direct-driven PMSG wind power converter system is established:
where x, u and y represent state variable, input variable and output variable, respectively;
Based on the state space model, the Luenberger observer is designed, which is represented by:
where
The gain matrix K is considered as the key parameter of observer design. Therefore, matrix K is determined by pole-placement method adopted in [25,26], assuring the stable convergence of the observer. The structure of the Luenberger observer for direct-driven PMSG wind power converter system in this section is constructed as shown in Fig. 3. Since the observed currents of observer outputs are in the dq synchronous rotating frame, it is necessary to obtain three PMSG phase observed currents and three grid phase observed currents through coordinate transformation.
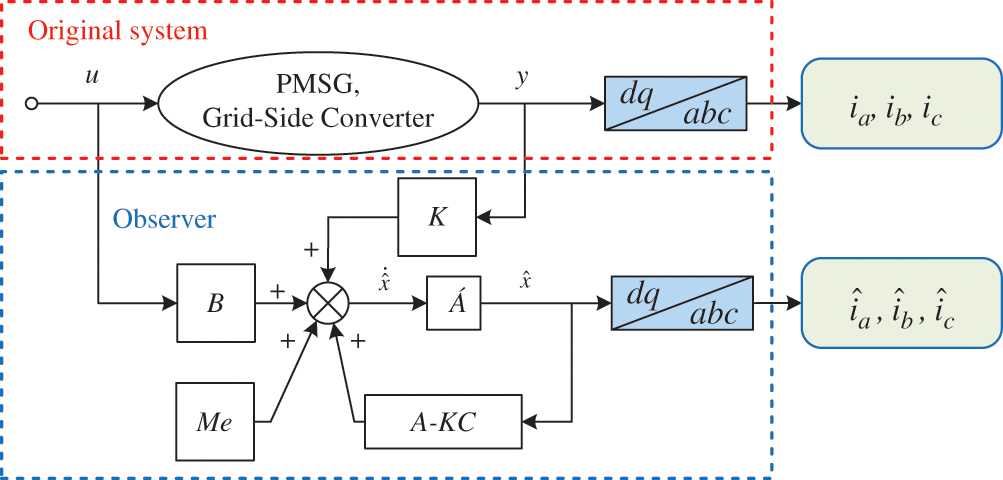
Figure 3: Luenberger observer for direct-driven PMSG wind power converter system
Step 2: Design of detection variables
For the generator(grid) phase k, the current residual is the difference between phase measured current isk(igk) and its observed current
Theoretically, the current residual and the relative current residual of each phase are approximately equal to 0 in normal operating condition. But affected by the non-ideal of power IGBT module and measurement noise in practice, the current residual exists even in normal operating condition, leading to the problem that the waveform of rsk(rgk) appears spicule sign. In order to obtain the detection variables with nearly constant values in normal operating condition and which decrease below a certain threshold value when OC faults occur, the necessary mathematical considerations for rsk and rgk are designed as shown in Fig. 4.
Firstly, the amplitude of rsk(rgk) is adjusted in the range of 0 to 1 through the exponential transformation represented as (6) and the amplitude reconstruction represented as (7):
where R1 is the amplitude of rsk(rgk) after exponential transformation; R2 is the amplitude of R1 after amplitude reconstruction. Then, the detection variable of the generator (grid) phase k is obtained through a low-pass filter, which is defined as Nsk(Ngk).
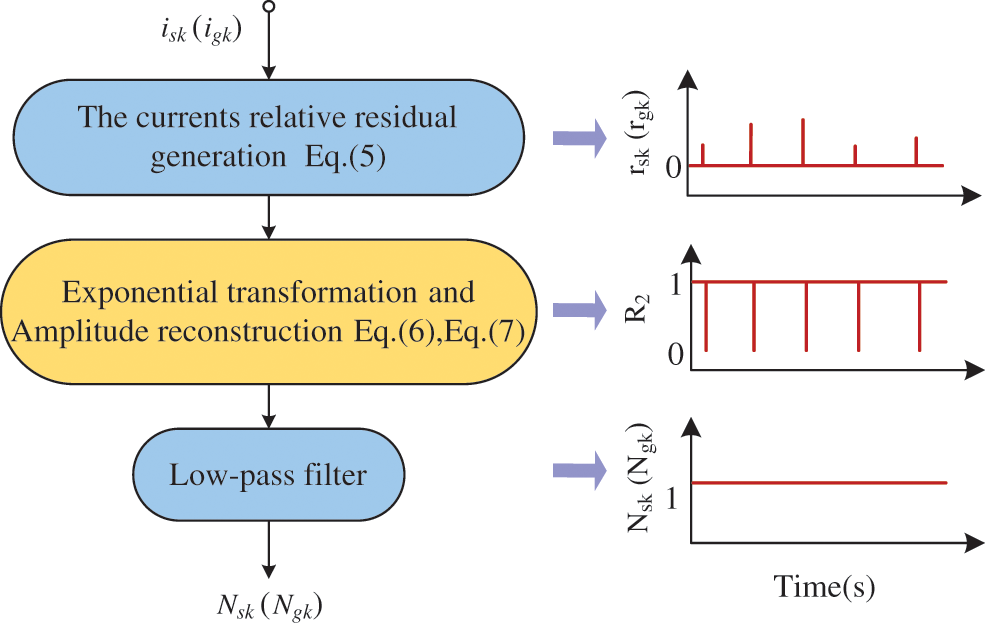
Figure 4: Design process of detection variables and corresponding calculation results
The relative current residual rsk(rgk) is approximately equal to 0, and the detection variable Nsk(Ngk) is approximately equal to 1 in normal operating condition. Once OC faults occur in the generator(grid) phase k, there will be severe distortion in the current waveform, which results in rsk(rgk) increasing and the corresponding Nsk(Ngk) decreasing, whereas the detection variables of healthy phase keeping invariant. Therefore, it is essential to compare each detection variable with a threshold.
Step 3: Design of adaptive threshold for detection variables
Generally, OC faults diagnosis technique depends on comparing the detection variables with the threshold to achieve the detection purposes. The adaptive threshold can be automatic adjusted when the operating conditions change, which helps to improve the reliability and reliability of the diagnosis technique. Thus, two adaptive thresholds Ds (for the GESC) and Dg (for the GRSC) are designed based on Nsk and Ngk, respectively:
where ds1 and ds2 (dg1 and dg2) are the maximum and median value of Nsa, Nsb and Nsc(Nga, Ngb and Ngc), respectively. Thus, ds1, ds2 and Ds(dg1, dg2 and Dg) will be approximately equal to 1 in normal operating condition. Once OC faults occur, there will be an error between Nsk(Ngk) and Ds(Dg).
For the convenience of describing fault detection results, the detection sign of the generator(grid) phase k is defined as Fsk(Fgk):
where ɛs and ɛg are constant values. If the absolute value of error between Nsk(Ngk) and Ds(Dg) is less than ɛs(ɛg), Fsk(Fgk) is equal to 0, it represents that there is no OC fault in the generator(grid) phase k. On the contrary, the absolute value of error between Nsk(Ngk) and Ds(Dg) is more than ɛs(ɛg), Fsk(Fgk) is equal to 1, it represents that there are OC faults in the generator(grid) phase k.
Full power converter is three-phase six-switch structure, so the same variety occur to the detection sign of each phase. However, each phase consists of upper and lower bridge arm IGBTs, just using the detection variable would bring difficulties to the following analysis. It is essential to design the fault located variables. In this paper the average value of fault phase current is used to solve this problem, and the located variable of the generator (grid) phase k is defined as Lsk(Lgk):,
where k = a, b, c; △t is the initial time; T is one current period. It should be noted that the integral interval here is a moving time-window with the length of one current period, which is shown in Fig. 5.
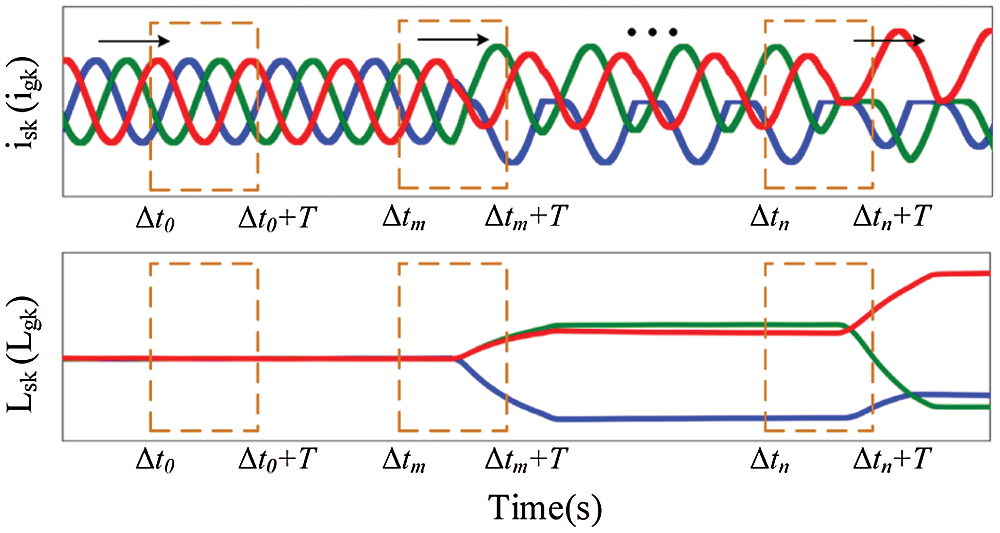
Figure 5: Schematic diagram of integral interval of located variables
In normal operating condition, the generator (grid) phase k current is sine wave, and Lsk(Lgk) is 0 during an integral interval, as illustrated in Fig. 5. When different types of OC faults occur in phase k, respectively, the current waveforms have distinct degree of distortion, Lsk(Lgk) also changes with phase k current distortion. In this case, the fixed thresholds Ms and Mg are respectively introduced for Lsk and Lgk and the threshold intervals are designed. The localization purposes are achieved through the comparison of Lsk(Lgk) and the corresponding threshold interval.
3.3 Process of Faults Diagnosis
In practice, OC faults are almost entirely caused by the open-circuit of single and double IGBTs. Both the GESC and the GRSC can be simplified into three-phase voltage-type PWM topology. According to the structural characteristics of three-phase six-arm converter, unilateral converter with OC faults can be classified as follows:
For single IGBT faults, the bridge arm is taken as the classification basis, and the faults are divided into two types. The first is single IGBT OC fault in upper bridge arm, there are
For double IGBTs faults, the phase and bridge arm are taken as the classification basis, and the faults are divided into three types. The first is double IGBTs OC faults in the same phase, there are
When both converters have faults, resorting to the isolation effect of DC-link, the distortion of generator-side current and grid-side current is the same as that of faults in unilateral converter. Therefore, this paper studies the fault diagnosis of single and double IGBT OC faults in unilateral converter. To summarize, there are five fault types as follows, and including 42 faults states altogether:
Type I: Single IGBT OC fault in upper bridge arm;
Type II: Single IGBT OC fault in lower bridge arm;
Type III: Double IGBTs OC faults in the same phase;
Type IV: Double IGBTs OC faults in the same half-bridge;
Type V: Double IGBTs OC faults in the different phase and half-bridge.
OC faults diagnosis of converters in D-PMSGWT is summarized in Tab. 1, where S1-S6 and G1-G6 represent corresponding IGBTs in Fig. 1. It can be seen in Tab. 1 that the fault detection signs would probably have the same results under different open-circuit fault types. Five kinds of located variables belong to the threshold interval M1[-∞, -M], M2[M, +∞], M3[-M, M], where M represents the fixed threshold Ms(Mg).

Fig. 6 shows the whole process of OC faults diagnosis of converters in D-PMSGWT with the proposed method, including the fault detection and the fault localization. As the basis of fault diagnosis, three PMSG phase currents and three grid phase currents are collected. Afterward, the observed current is obtained by designed observer, and the average value of each phase current is calculated at the same time. Then, fault detection algorithm is executed to detect fault phase. If no fault occurs, it will continue to monitor the system operation; otherwise, according to fault localization algorithm, the faulty IGBTs are located through the comparison of located variables and the corresponding threshold intervals finally.
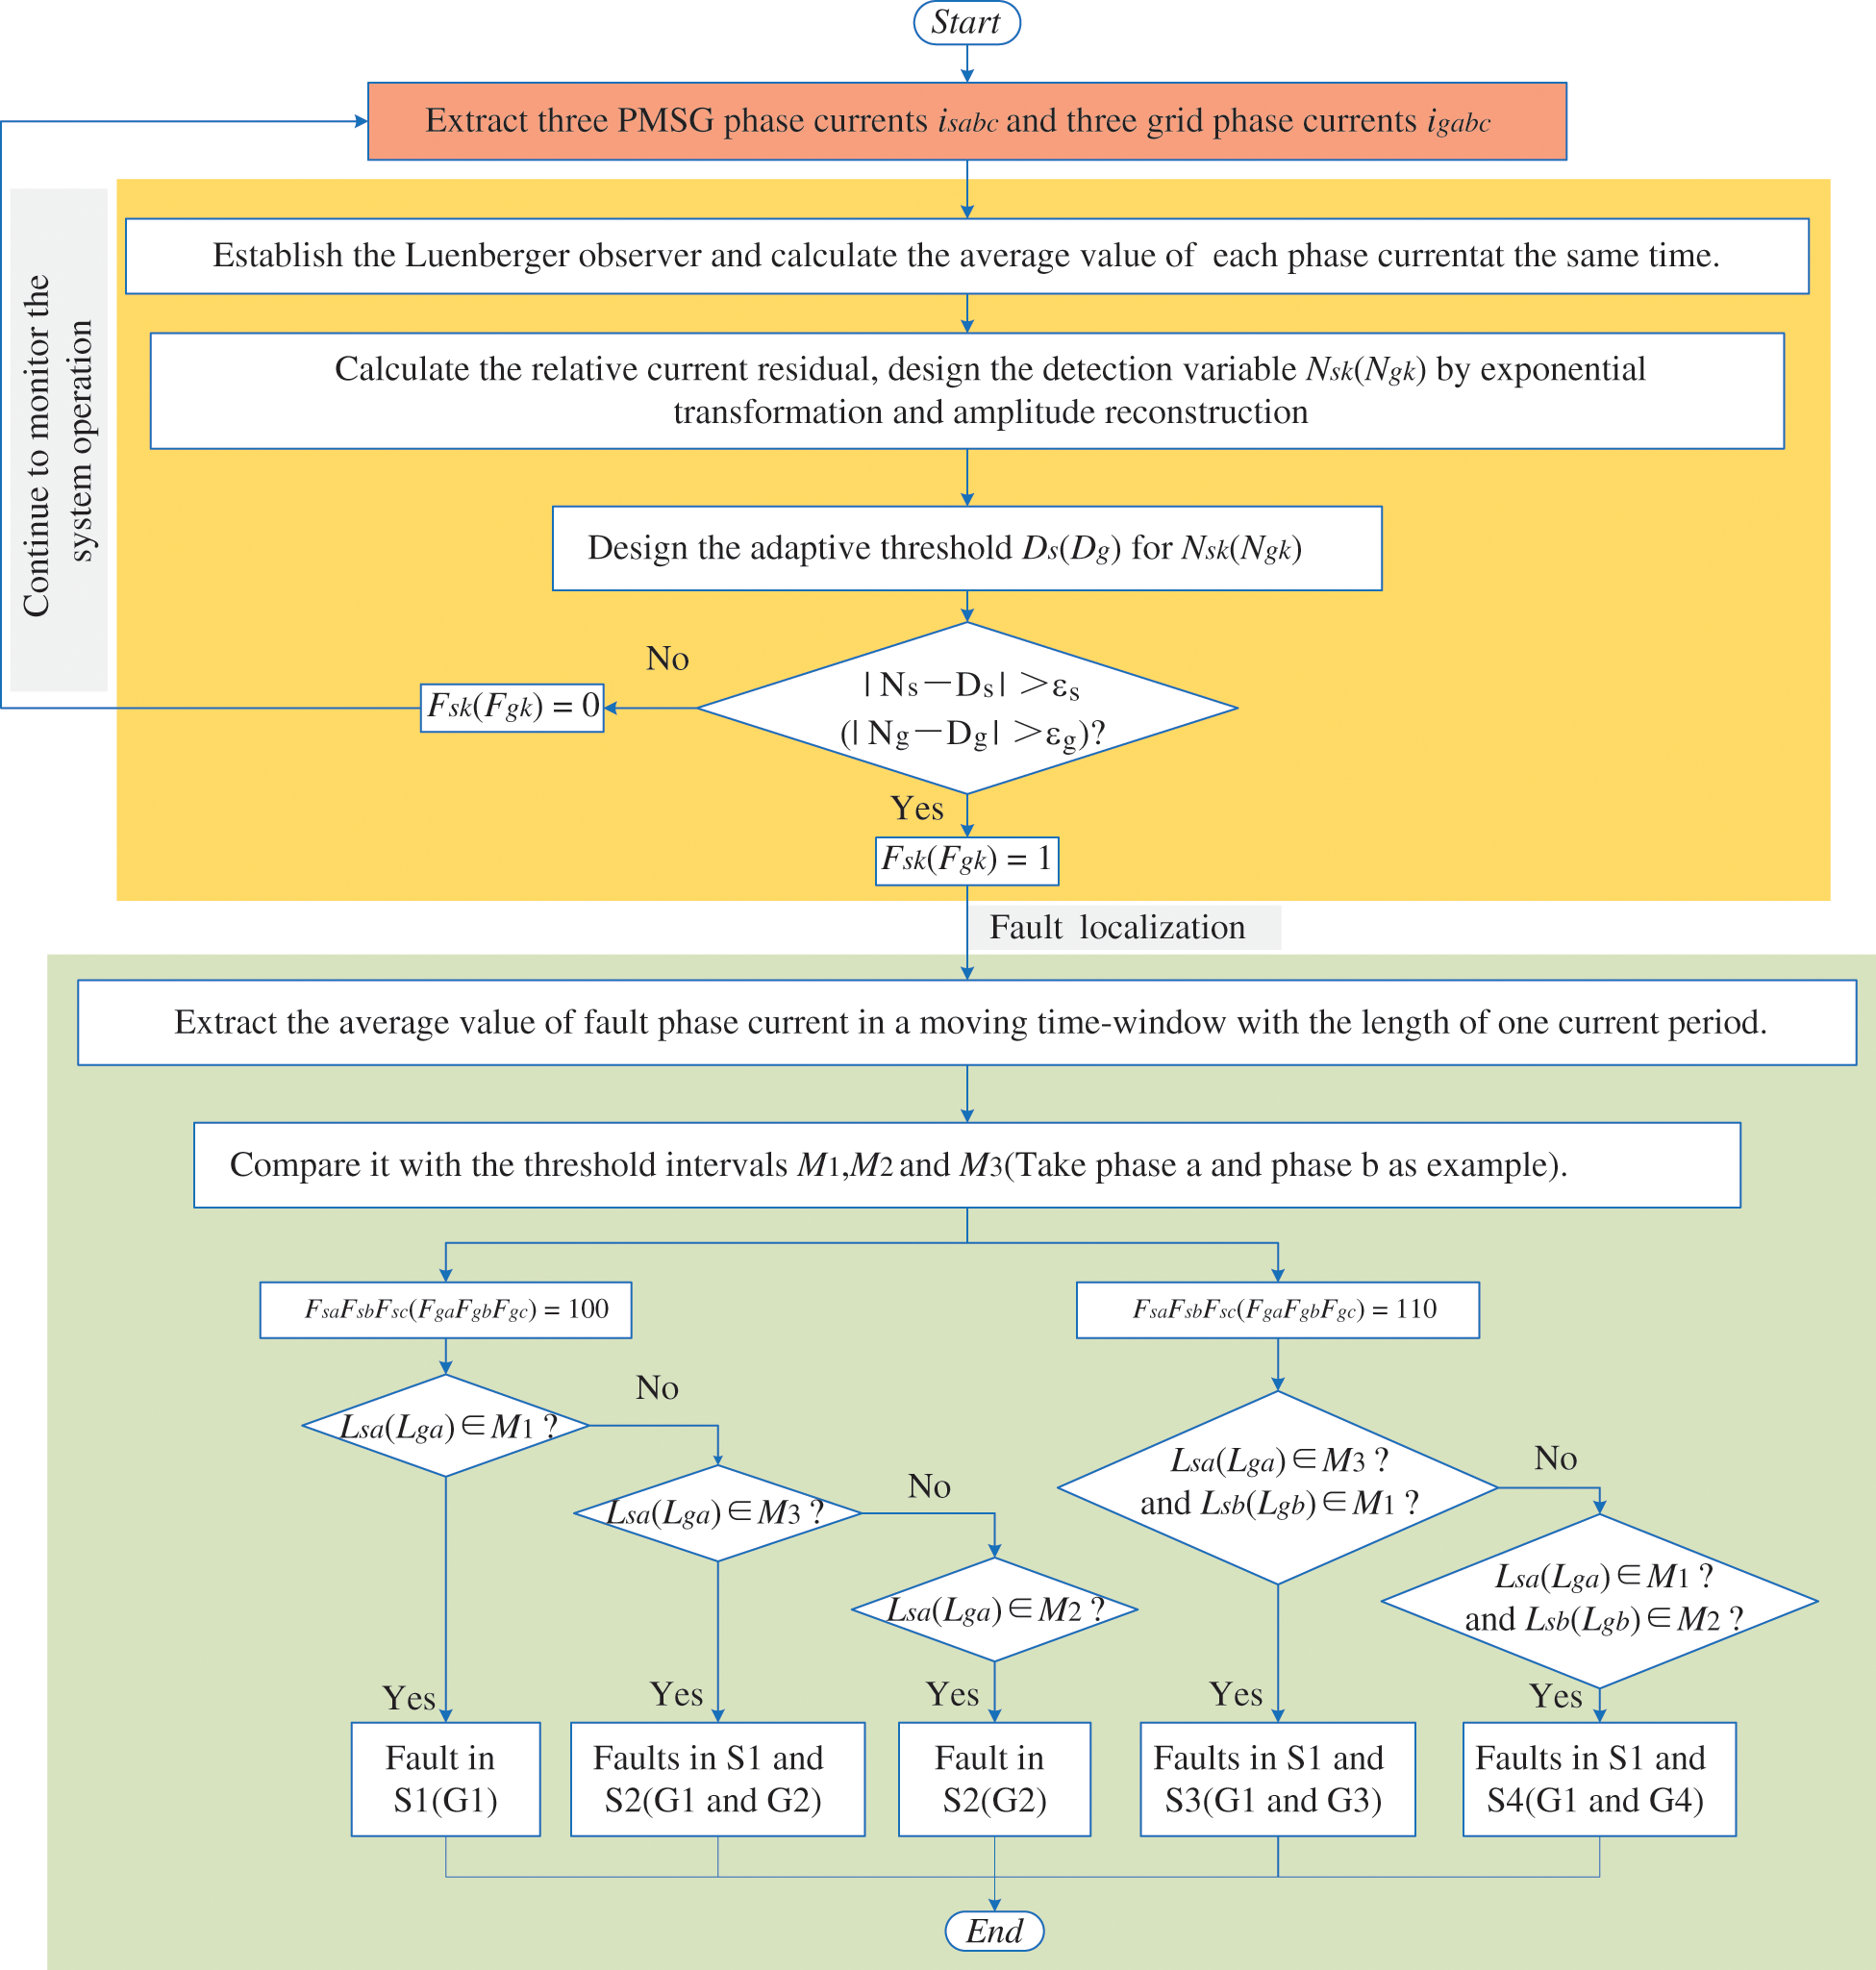
Figure 6: Flow chart of OC faults diagnosis with proposed method
For instance, FsaFsbFsc(FgaFgbFgc) is 100, which means that OC faults occur in generator (grid) phase a. If Lsa(Lga) is less than -Ms(-Mg), IGBT S1(G1) is open-circuit, and other IGBTs are normal at this time; If Lsa(Lga) is more than Ms(Mg), IGBT S2(G2) is open-circuit; If Lsa(Lga) is in the range of ±Ms(±Mg), IGBT S1 and S2(G1 and G2) are open-circuit.
Similarly, FsaFsbFsc(Fga Fgb Fgc) is 110, which means that OC faults occur in generator(grid) phase a and phase b. If Lsa(Lga) is in the range of ±Ms(±Mg) and Lsb(Lgb) is less than -Ms(-Mg), IGBT S1 and S3 (G1 and G3) are open-circuit; If Lsa(Lga) is less than -Ms(-Mg) and Lsb(Lgb) is more than Ms(Mg), IGBT S1 and S4 (G1 and G4) are open-circuit.
The OC faults of converters diagnosis method was tested in a 2-MW D-PMSGWT as depicted in Fig. 7. As shown, the wind turbine system comprises blades, a 2-MW PMSG, full power converter, filter, control module and fault diagnosis module.
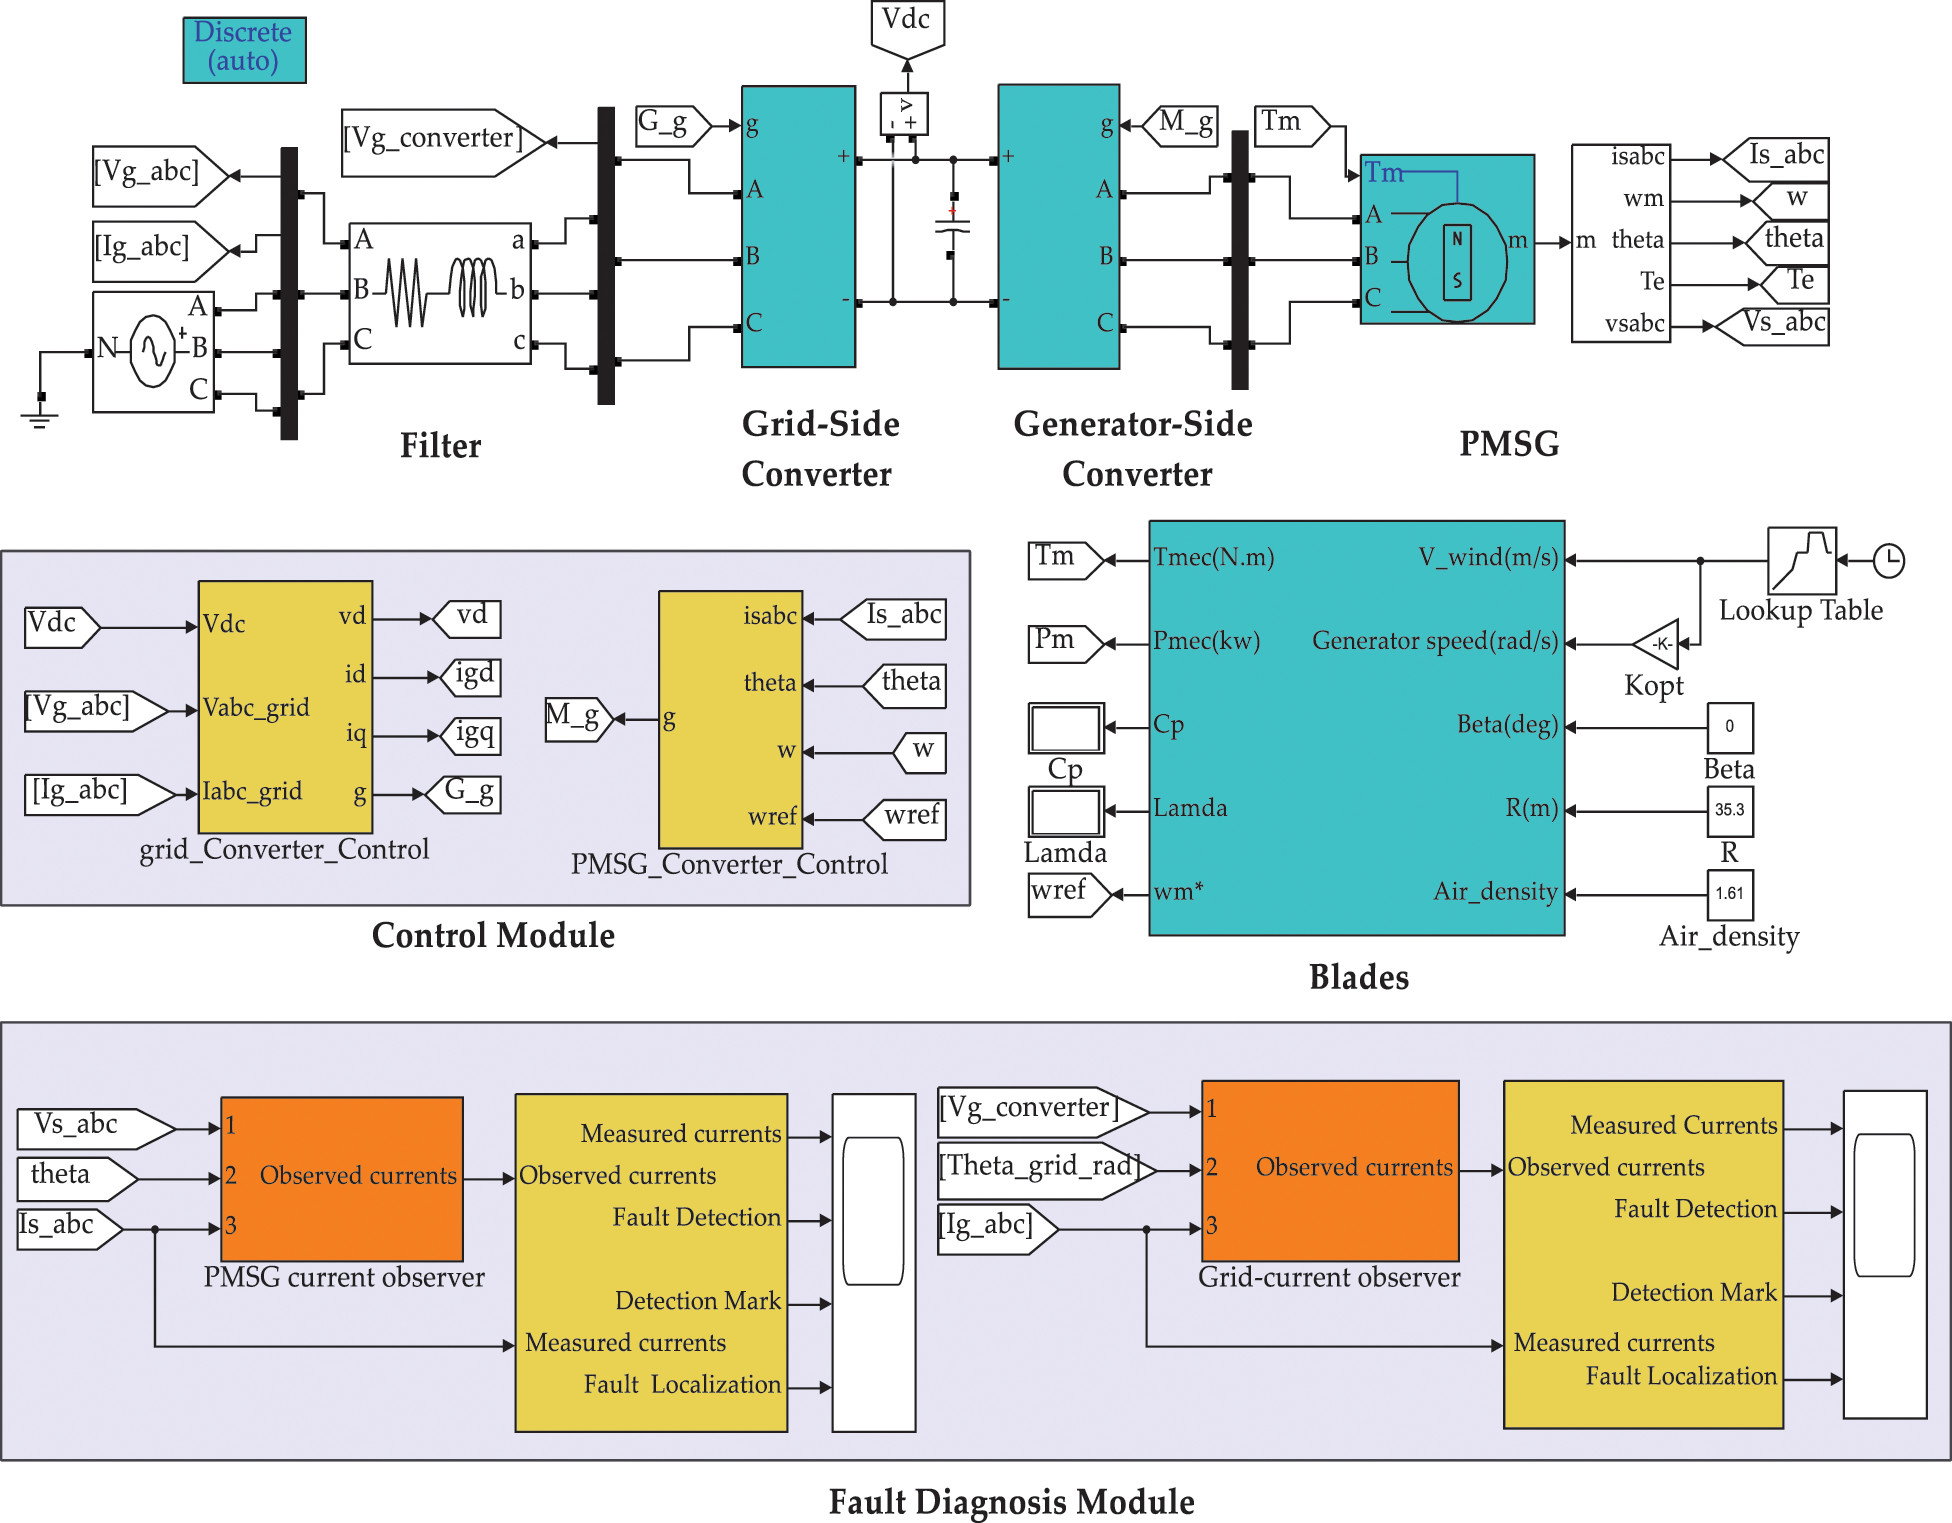
Figure 7: Diagram of direct-driven PMSG wind turbine system
The main parameters of this study are introduced in Tab. 2. To be noted, all mentioned OC faults are applied by removing their corresponding gate trigger pulse signals. Furthermore, the gain matrix K of the observer is determined by pole-placement method (k1 = k2 = 9000, k3 = k4 = 20000). Based on this, robustness test for the fault diagnosis method is carried out, and then different types of OC faults are diagnosed and analyzed.

In practice, OC faults of converters diagnosis in D-PMSGWT is inevitably compromised by various factors. Among them, random wind speed and grid voltage sags are common conditions during normal operation of converter; regarding the current sensors, they are deployed in harsh environments with high magnetic fields, which leads to the actual collected current signals mixed with noise signals. The robustness test of the proposed diagnosis method is addressed in this section.
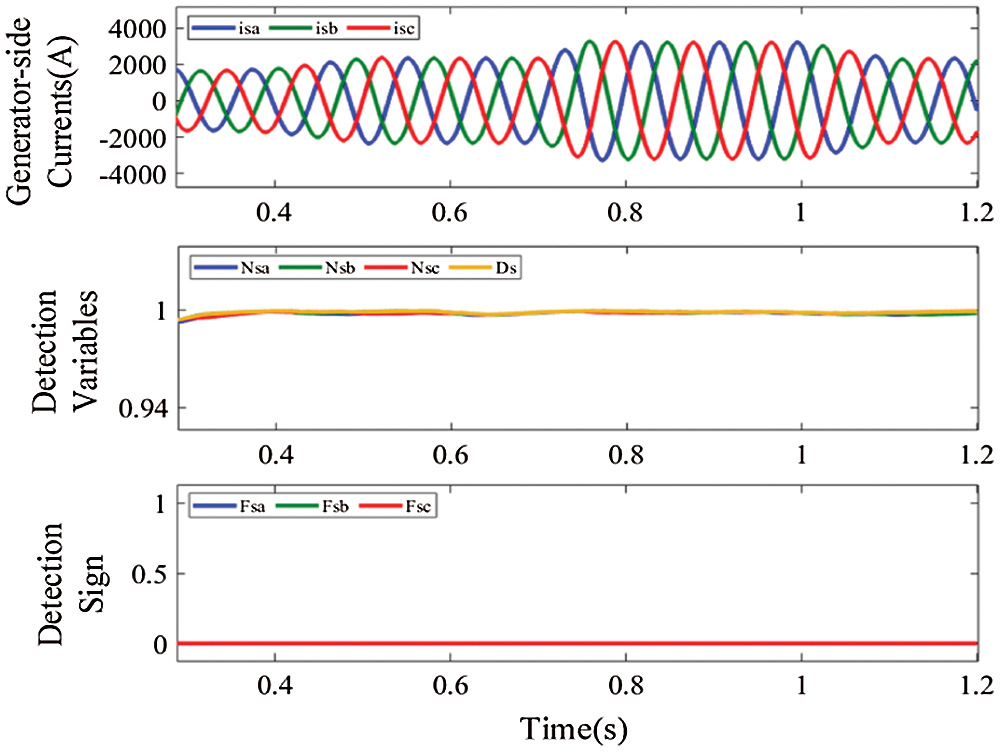
Figure 8: Waveforms of generator-side currents and detection variables, under wind speed changes abruptly
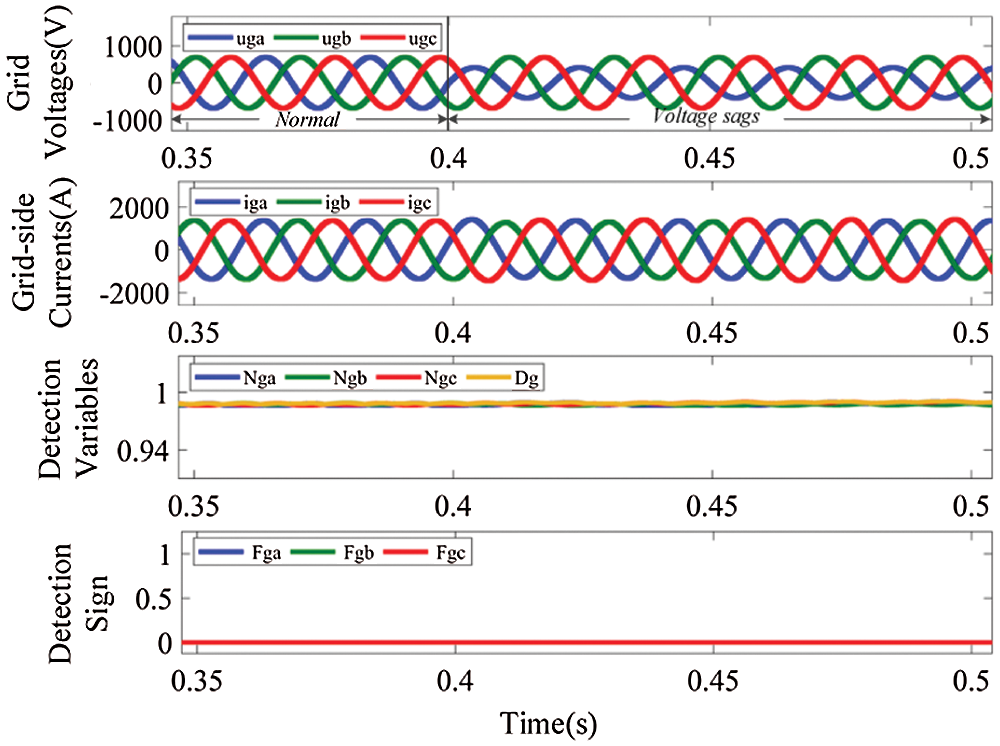
Figure 9: Waveforms of grid voltages, grid-side currents and detection variables, under phase a grid voltage sags
Firstly, Fig. 8 shows the waveforms of the generator-side currents together with the detection variables, under wind speed changes abruptly. From t = 0.4 s, wind speed gradually increases from 8 m/s to 11.5 m/s, which is its ratings. At the instant t = 0.7 s, it exceeds 11.5 m/s and becomes constant after reaching 13.5 m/s. After t = 1.1 s, it decreased and stabilized at its ratings. Next, Fig. 9 shows the waveforms of grid voltages, the grid-side currents and detection variables, under phase a grid voltage sags. At t = 0.4 s phase a voltage sags to 60% of the grid voltage ratings. It is obvious from Figs. 8 and 9 that only the current amplitudes change, while the current waveforms are still sine waves and the absolute value of error between Nsk(Ngk) and Ds(Dg) is still in a safe range during the above conditions. Therefore, the robustness of the fault diagnosis method is verified for wind speed changes abruptly and grid voltage sags.
In addition, 20 dB white Gaussian noise is respectively added into the generator-side and grid-side currents through the awgn function, and the waveforms of corresponding currents, detection variables and THD of currents under noise interference are shown in Figs. 10 and 11, respectively. THD of the generator-side currents increases from 0.87% to 3.28% and THD of grid-side current increases from 0.95% to 3.35% after the noise addition at t = 0.4 s. Although both are less than 5% [27], the increased harmonics will cause power loss, leads to the distortion of grid voltage, and affects power grid security [24]. Despite this, the detection variables are still in a safe range. It is obvious that noise interference will not cause the fault false alarm during the diagnosis process.
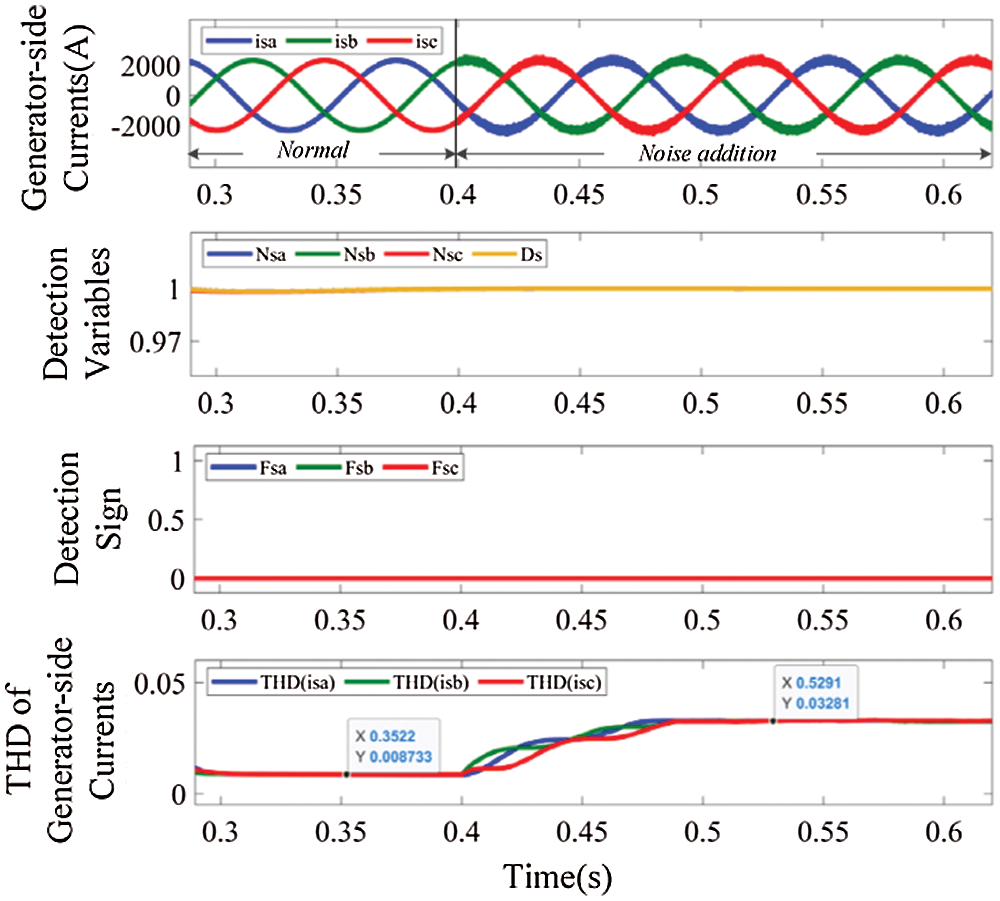
Figure 10: Waveforms of generator-side currents, detection variables and THD of generator-side currents, under noise interference
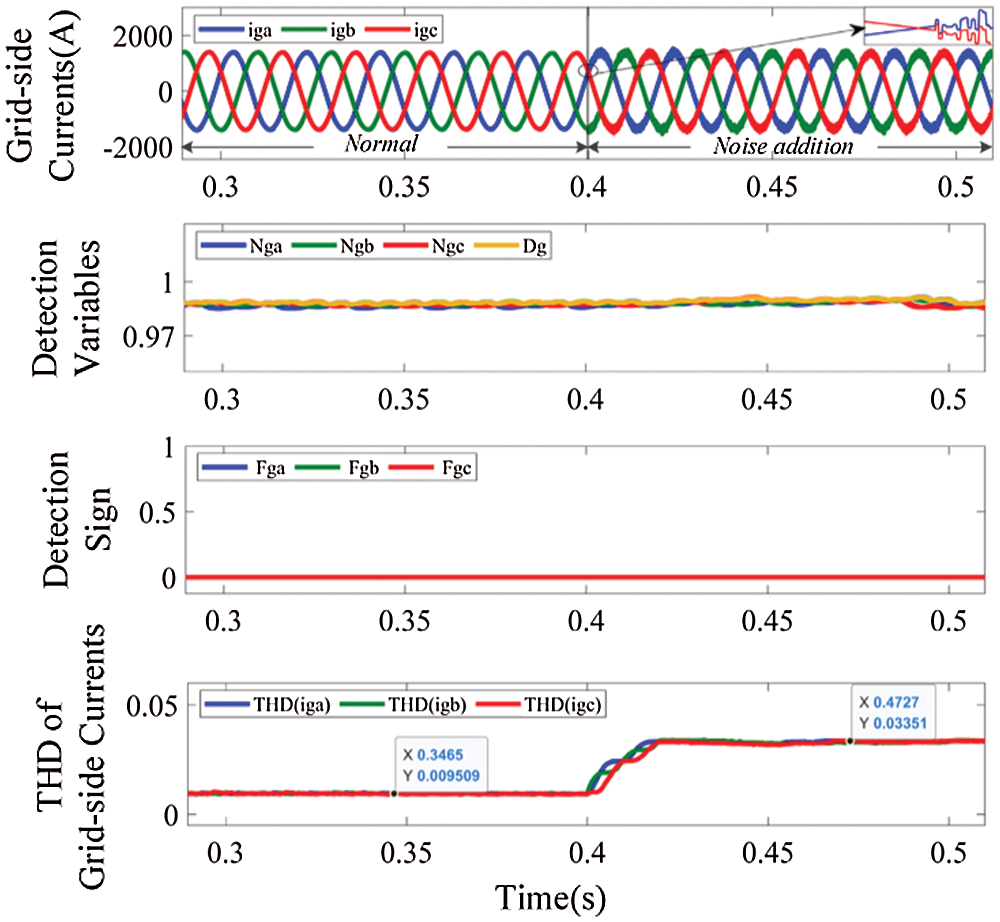
Figure 11: Waveforms of grid-side currents, detection variables and THD of grid-side currents, under noise interference
4.2 Analysis of Faults Diagnosis Results
The diagnosis results of 42 OC faults states produced from the proposed method is addressed in this section, where the diagnostic variables include detection variables and located variables.
Eight fault states are selected from faults of the GESC and the GRSC (in view of the symmetry of Type I and Type II, one can be selected for analysis). The result of values is showed in Tab. 3, including detection time, diagnosis time and the proportion of fundamental period, the value of detection variables and located variables. The specific diagnosis and analysis are as showed in Figs. 12–17.

In Fig. 12 double OC faults in IGBT S1 and S2 of the GESC is considered. In normal operating condition, the generator-side current waveforms are standard sine waves, Nsa, Nsb, Nsc and Ds are approximately equal to 1, the detection sign FsaFsbFsc is 000, and Lsa, Lsb and Lsc are equal to 0. S1 fault happens at t = 0.525 s, the current waveforms with important fault info have distortion, especially for phase a, where positive current blocking occurs within a short period of time before the antiparallel diode of S2 turning on. Concerning behaviors of the diagnostic variables, after the fault initiation Nsa becomes less than Ds, whereas Nsb and Nsc remain close to Ds. At t = 0.554 s, the absolute value of error between Nsa and Ds reaches 0.047, which is more than ɛs, so FsaFsbFsc becomes 100, which means that OC faults occur in generator phase a. The average value of phase a current Lsa is equal to −193.1, which is less than −Ms. Combining all the information to compare with Tab. 1, faulty IGBT is correctly located to S1, accounting for 36.2% of the current fundamental period (0.08 s). Then S2 fault happens at t = 0.915 s, phase a current has worse distortion, as a result Nsa continues to decrease, whereas Nsb and Nsc still remain close to Ds. At t = 0.953 s, FsaFsbFsc becomes 100, Lsa is equal to 3.157, which is in the range of ±Ms, the faulty IGBTs are correctly located to S1 and S2, accounting for 47.5% of the current fundamental period.
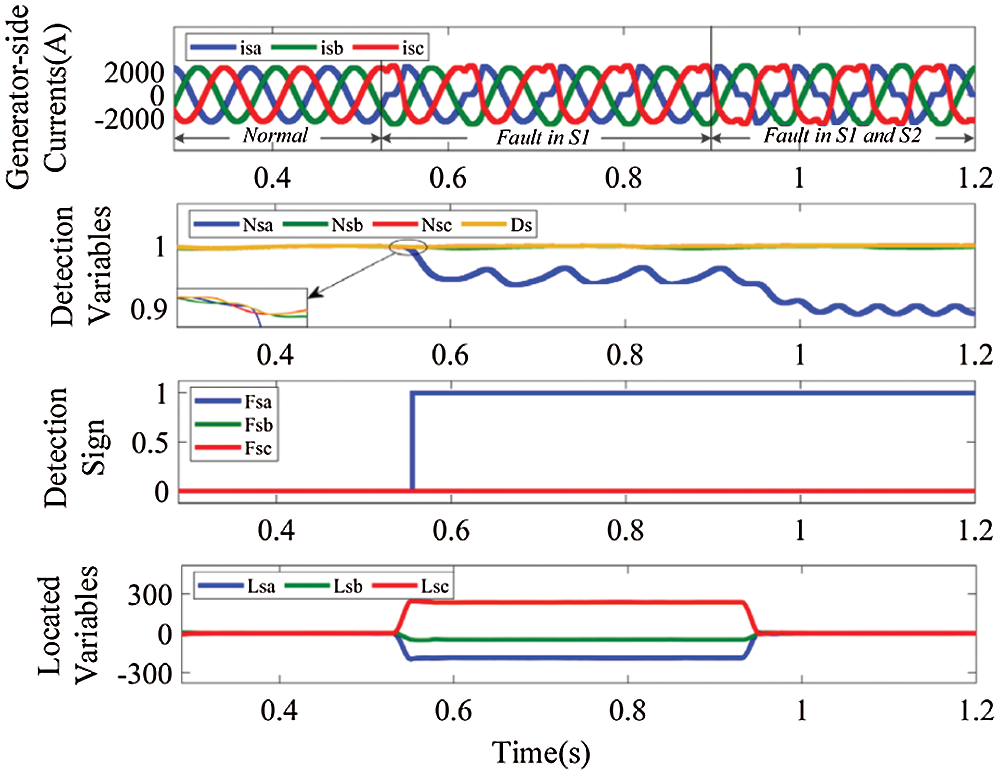
Figure 12: Waveforms of generator-side currents and diagnostic variables, for OC faults in IGBT S1 and S2
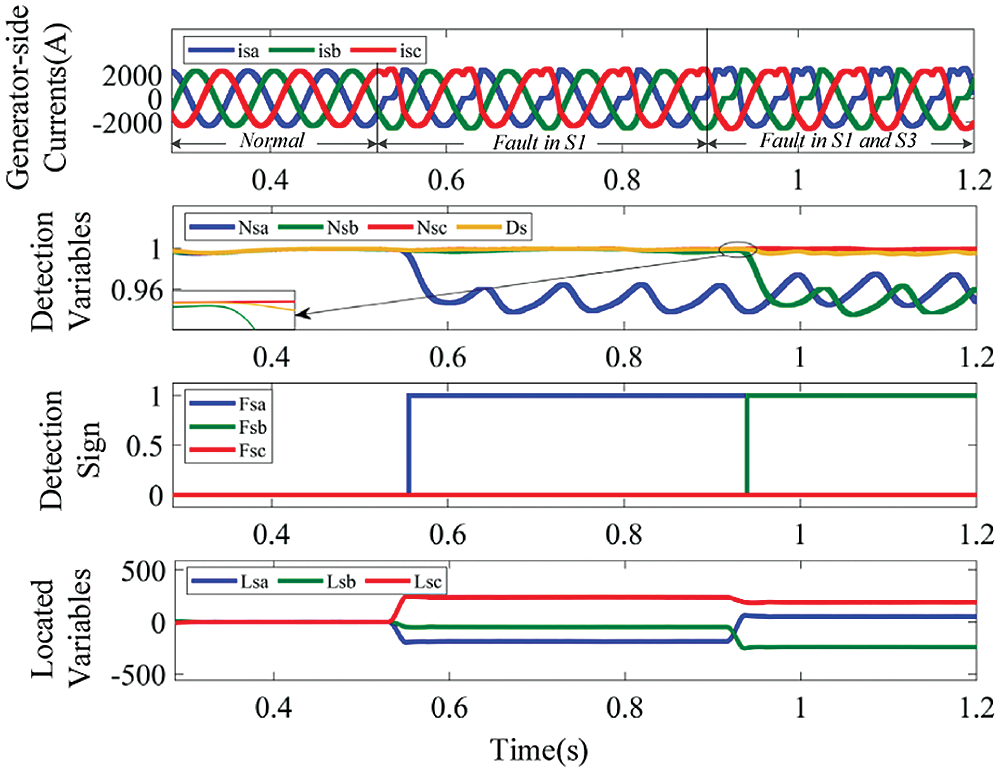
Figure 13: Waveforms of generator-side currents and diagnostic variables, for OC faults in IGBT S1 and S3
In Fig. 13 double OC faults in IGBT S1 and S3 of the GESC is considered. S3 fault happens at t = 0.915 s. At t = 0.939 s, FsaFsbFsc becomes 110, Lsa is equal to 62.30, which is in the range of ±Ms, and Lsb is equal to −249.6, which is less than −Ms. Combining all the information, the faulty IGBTs are correctly located to S1 and S3, accounting for 30% of the current fundamental period.
In Fig. 14 double OC faults in IGBT S1 and S6 of the GESC is considered. S6 fault happens at t = 0.915 s. At t = 0.931 s, FsaFsbFsc becomes 101, Lsa is equal to −330.4, which is less than −Ms, and Lsb is equal to 352.7, which is more than Ms. Combining all the information, the faulty IGBTs are correctly located to S1 and S6, accounting for 20% of the current fundamental period.
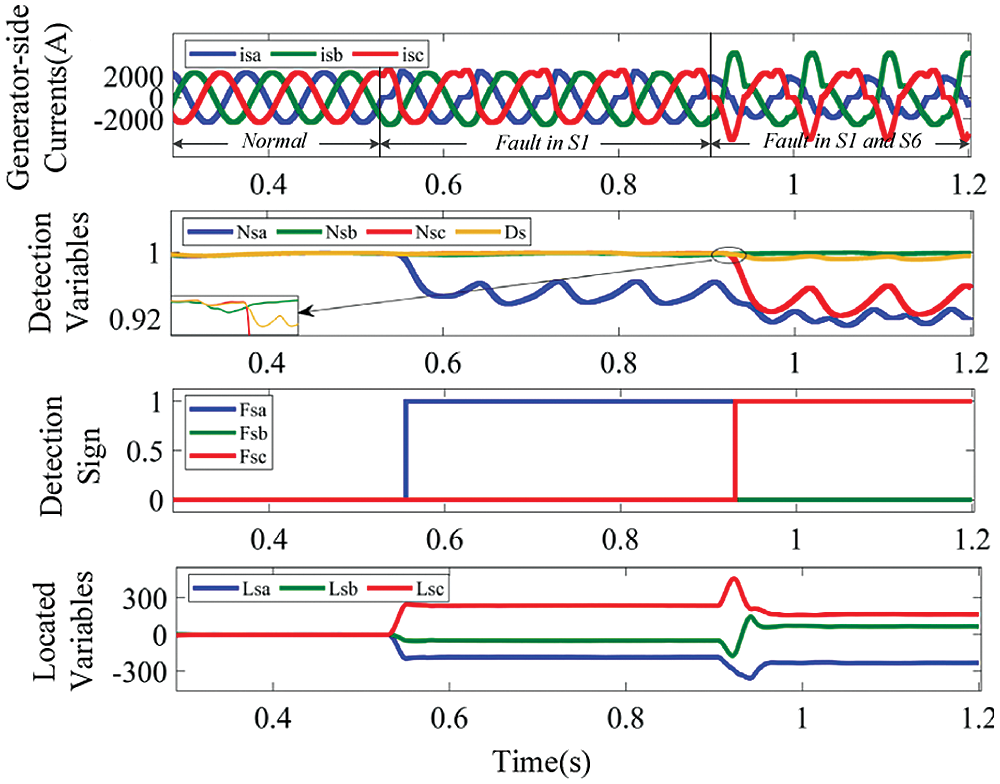
Figure 14: Waveforms of generator-side currents and diagnostic variables, for OC faults in IGBT S1 and S6
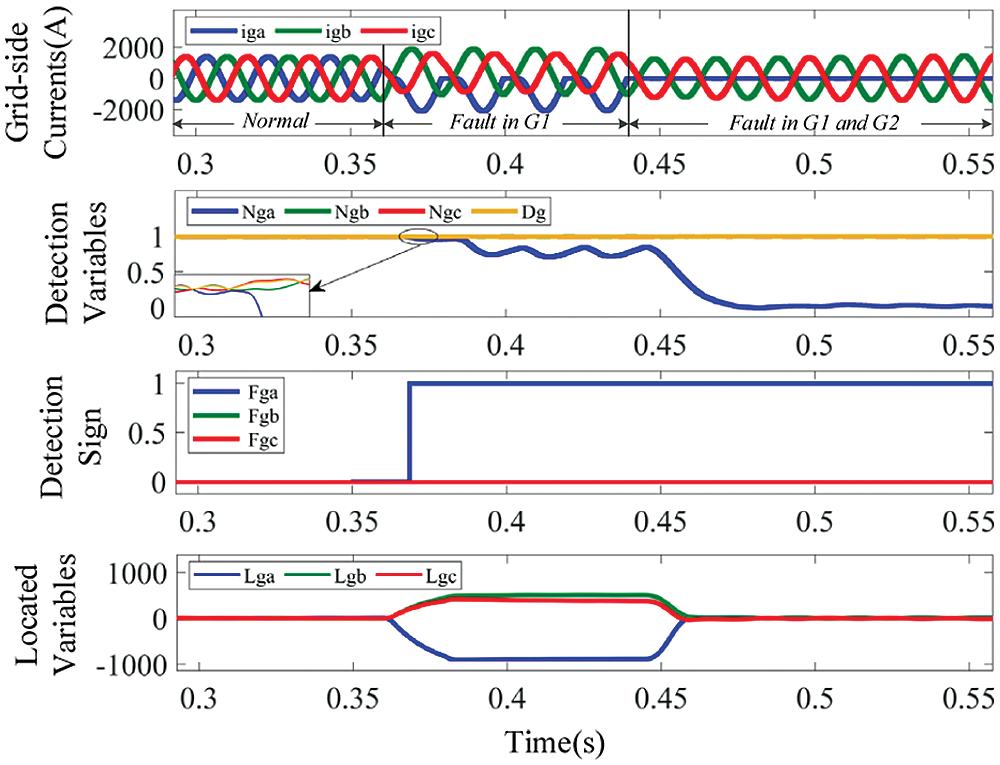
Figure 15: Waveforms of grid-side currents and diagnostic variables, for OC faults in IGBT G1 and G2
To further evaluate the diagnosis performance under faults in the GRSC, double OC faults in IGBT G1 and G2 of the GESC is considered in Fig. 15. The behaviors in normal operating conditions are the same as those in the GESC. At the instant t = 0.361 s G1 fault happens, phase a current only takes negative values, because of no positive current flowing through G1 and the antiparallel diode of G2. In addition, after the fault initiation Nga becomes less than Dg, whereas Ngb and Ngc remain close to Dg. At t = 0.368 s, the absolute value of error between Nga and Dg reaches 0.102, which is more than ɛg, so FgaFgbFgc becomes 100, which means that OC faults occur in grid phase a. And at t = 0.368 s, Lga is equal to −617.8, which is less than –Mg, indicating the existence of fault in G1, which takes a time period equivalent to approximately 60% of the current fundamental period (0.02 s). Then, G2 fault happens at t = 0.445 s, and FgaFgbFgc becomes 100 at t = 0.451 s. It can be seen that Lga takes value in the range of ±Mg, the faulty IGBTs are correctly located to G1 and G2, accounting for 30% of the current fundamental period.
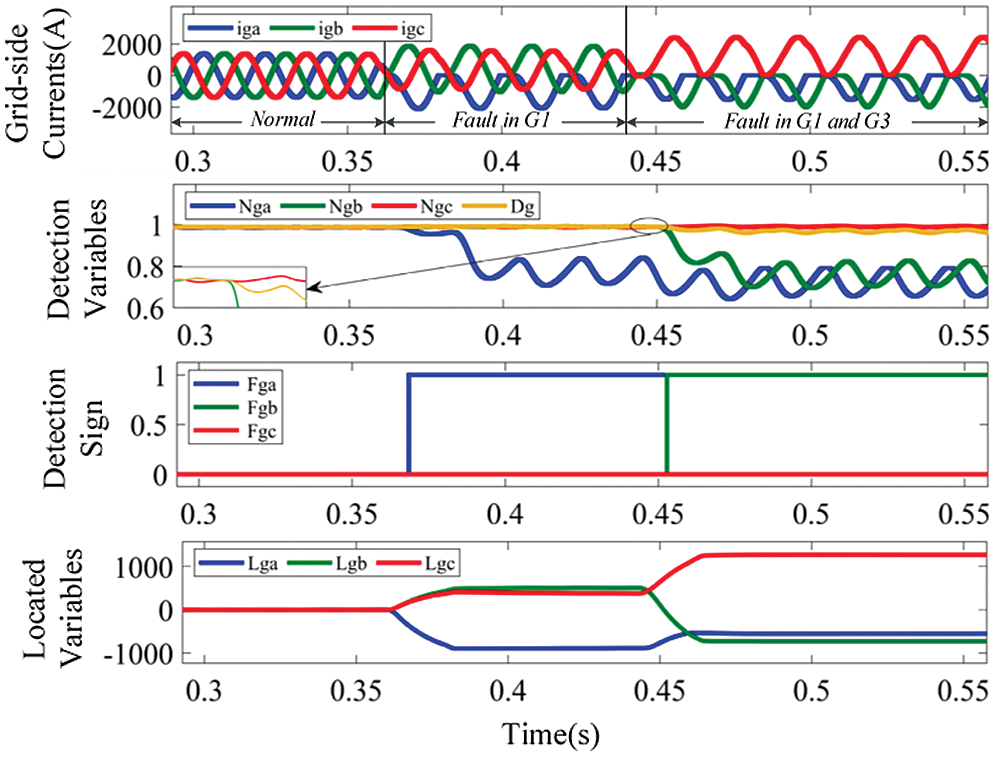
Figure 16: Waveforms of grid-side currents and diagnostic variables, for OC faults in IGBT G1 and G3
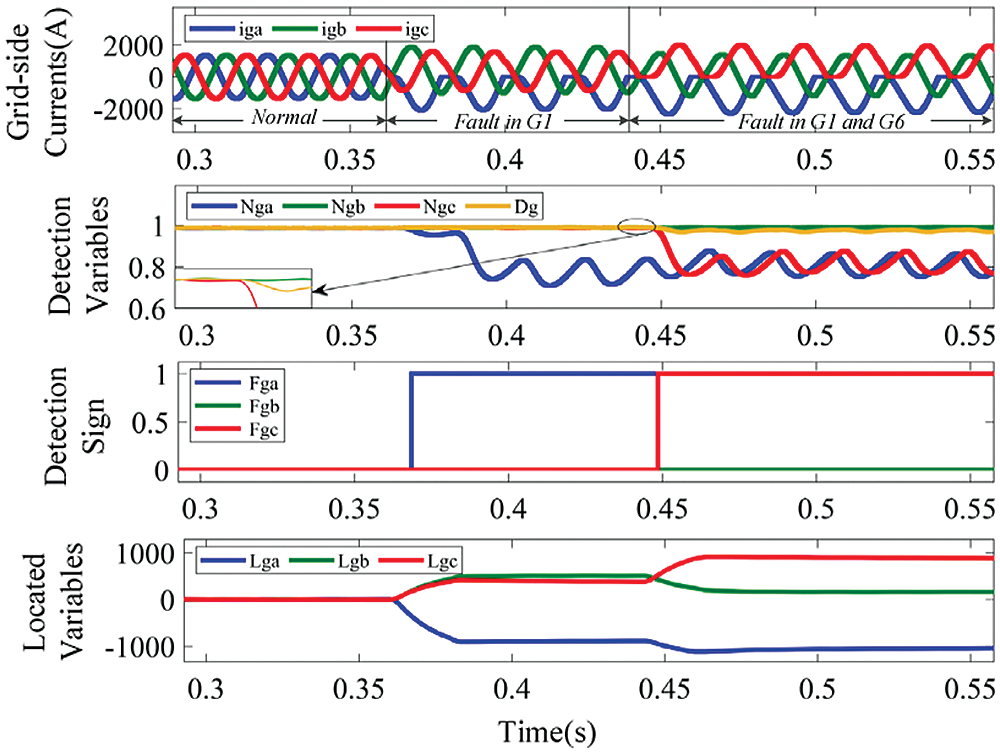
Figure 17: Waveforms of grid-side currents and diagnostic variables, for OC faults in IGBT G1 and G6
Next, double OC faults in IGBT G1 and G3 of the GRSC is introduced at t = 0.361 s and t = 0.445 s respectively in Fig. 16. At t = 0.453 s, FgaFgbFgc becomes 110, at t = 0.453 s, Lga is equal to −538.3, which is in the range of ±Mg, and Lgb is equal to −616.7, which is less than −Mg. Combining all the information, the faulty IGBTs are correctly located to G1 and G3, the fault diagnosis process takes a time period equivalent to 65% of the current fundamental period. Moreover, double OC faults in IGBT G1 and G6 of the GRSC is introduced at t = 0.361 s and t = 0.445 s respectively in Fig. 17. At t = 0.44 9 s, FgaFgbFgc becomes 101, Lga is equal to −975.5, which is less than −Mg, and Lgc is equal to 699.6, which is more than Mg. The faulty IGBTs are correctly located to G1 and G6, which takes a time period equivalent to approximately 20% of the current fundamental period.
The diagnostic variables have the similar characteristics under the same OC fault types. Extensive diagnosis analyses were performed for other 34 OC faults in the GESC and the GRSC. The obtained results can correctly diagnose the faulty IGBTs, which are similar the ones presented here, so they are unnecessary to go into detail.
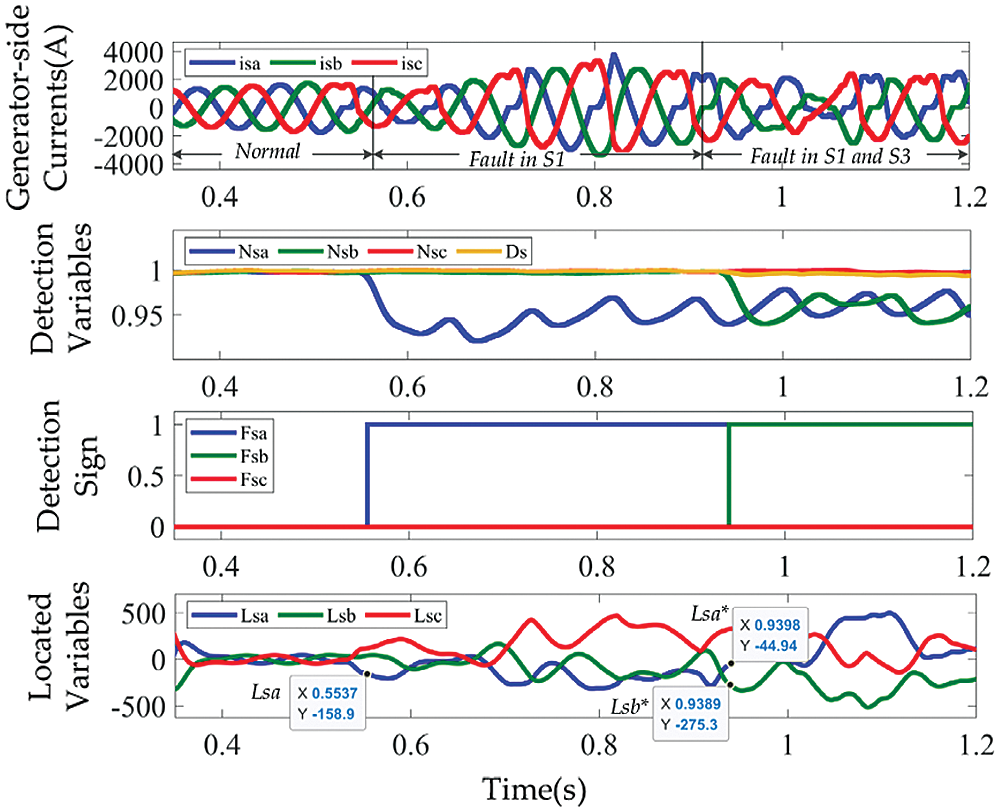
Figure 18: Waveforms of generator-side currents and diagnostic variables, for OC faults in IGBT S1 and S3 under constant wind speed
Furthermore, considering that the wind power system is actually operating under variable wind speed conditions, we take OC faults in IGBT S1 and S3 of the GESC under constant wind speed as an example. Fig. 18 shows waveforms of generator-side currents and diagnostic variables. Compared with Fig. 13, generator-side currents are not only distorted, but also changed in amplitude, however, the diagnosis was not affected, faulty IGBTs are correctly located to S1 and S3.
The analyzed results show that the thresholds are adaptive and always changed with the corresponding detection variables at the same time during the different fault states, which guarantees the effectiveness and the robustness of the proposed diagnostic method. It also can be seen that OC faults are diagnosed in a time zone less than 65% of the current fundamental period. On the other hand, the localization time depends on the faulty converter, the fault localization for the GESC can be achieved at the same time as the detection, whereas for the GRSC, it is accomplished in a time zone of about 25% of the grid current period after the detection. The diagnostic performance of the proposed method is justified due to its superior diagnostic capabilities, since it allows identifying 42 distinct and complex faulty states, instead of simple single IGBT OC faults.
In order to evaluate the performance of the proposed method, the detection parameter, research object, effectiveness, diagnosable type, Adaptive threshold and robustness are compared with the existing methods.

Tab. 4 lists the comparison results. It can be seen that the proposed fault diagnosis method has the efficient and comprehensive fault diagnosis performance while the other methods have one or more deficiencies. In addition, the proposed fault diagnosis method effectively takes into account the characteristics of the PMSG system, where the used observer signal already exists in the system.
1. This paper proposes a simple and real-time strategy for detection and localization of single and double IGBT OC faults of converters in D-PMSGWT, which only requires three phase currents, and the parameters used are all existing in the system. Therefore, no additional sensors are added and the original topology of the system will not be damaged.
2. The diagnosis method via adaptive threshold has the ability to ensure the robustness to the transient condition, such as variable wind speed condition, grid voltage sags and noise interference, and realize the diagnosis of OC fault on the premise of preventing misinterpretation under the transient condition.
3. The faults diagnosis results show that the OC faults detection and localization are achieved within 20%–65% of the current fundamental period. Moreover, the proposed diagnostic method is simple and efficient, it allows to achieve 42 distinct and complex faulty states detection and localization of single and double IGBT OC faults in both the GESC and the GRSC, showing higher integrity and superior diagnostic capabilities compared with the existing methods of the same type, which meets the needs of modern industry exceedingly.
Funding Statement: This work was supported by the Key Research and Development Program of Hunan Province, China under Grant 2018GK2073, the Natural Science Foundation of Hunan Province, China under Grant 2019JJ50154, the National Natural Science Foundation of China under Grant 51875199 and Major Technological Achievements in the Transformation of the Strategic Emerging Industry of Hunan Province of China under Grant 2018GK4024.
Conflicts of Interest: The authors declare that they have no conflicts of interest to report regarding the present study.
1. Tahir, A., EL-Mukhtar, M., EL-Faituri, A., Mohamed, F. (2020). Grid connected wind energy system through a back-to-back converter. Computers & Electrical Engineering, 85(6), 106660. DOI 10.1016/j.compeleceng.2020.106660. [Google Scholar] [CrossRef]
2. Touaiti, B., Ben Azza, H., Jemli, M. (2019). Open-switch fault detection scheme in the IGBT-based PWM power converter used in DFIG connected to DC-bus. International Transactions on Electrical Energy Systems, 29(11), 1–18. DOI 10.1002/2050-7038.12112. [Google Scholar] [CrossRef]
3. Yang, S. Y., Xiang, D. W., Bryant, A., Mawby, P., Ran, L. et al. (2010). Condition monitoring for device reliability in power electronic converters: A review. IEEE Transactions on Power Electronics, 25(11), 2734–2752. DOI 10.1109/TPEL.2010.2049377. [Google Scholar] [CrossRef]
4. Kuraku, N. V. P., He, Y., Ali, M. (2020). Fault diagnosis of open circuit multiple IGBT’s using PPCA-SVM in single phase five-level voltage controlled H-bridge MLI. IEEJ Journal of Industry Applications, 9(1), 61–72. DOI 10.1541/ieejjia.9.61. [Google Scholar] [CrossRef]
5. Li, B., Shi, S., Wang, B., Wang, G., Wang, W. et al. (2016). Fault diagnosis and tolerant control of single IGBT open-circuit failure in modular multilevel converters. IEEE Transactions on Power Electronics, 31(4), 3165–3176. DOI 10.1109/TPEL.2015.2454534. [Google Scholar] [CrossRef]
6. Hemmer, R. (2009). Intelligent IGBT drivers with exceptional driving and protection features. Proceedings of 13th European Conference on Power Electronics and Applications, pp. 1–4. Barcelona, Spain. [Google Scholar]
7. Zhao, H. S., Cheng, L. L. (2018). Open-switch fault-diagnostic method for back-to-back converters of a doubly fed wind power generation system. IEEE Transactions on Power Electronics, 33(4), 3452–3461. DOI 10.1109/TPEL.2017.2705985. [Google Scholar] [CrossRef]
8. Ko, Y. J., Lee, K. B., Lee, D. C., Kim, J. M. (2012). Fault diagnosis of three-parallel voltage-source converter for a high-power wind turbine. IET Power Electronics, 5(7), 1058–1067. DOI 10.1049/iet-pel.2011.0109. [Google Scholar] [CrossRef]
9. Estima, J. O., Cardoso, A. J. M. (2011). A new approach for real-time multiple open-circuit fault diagnosis in voltage-source inverters. IEEE Transactions on Industry Applications, 47(6), 2487–2494. DOI 10.1109/TIA.2011.2168800. [Google Scholar] [CrossRef]
10. Wu, F., Zhao, J. (2016). A real-time multiple open-circuit fault diagnosis method in voltage source-inverter fed vector controlled drives. IEEE Transactions on Power Electronics, 31(2), 1425–1437. DOI 10.1109/TPEL.2015.2422131. [Google Scholar] [CrossRef]
11. Qiu, Y. N., Jiang, H. X., Feng, Y. H., Cao, M. N., Zhao, Y. et al. (2016). A new fault diagnosis algorithm for PMSG wind turbine power converters under variable wind speed conditions. Energies, 9(7), 548. DOI 10.3390/en9070548. [Google Scholar] [CrossRef]
12. Huang, K., Qiu, Y. N., Qin, W., Feng, Y. H. (2019). Fault diagnosis algorithm for wind power rectifier based on real-time current amplitude. Electric Power Engineering Technology, 38(2), 25–31. [Google Scholar]
13. Mahdhi, B., Ben Azza, H., Jemli, M. (2020). Experimental investigation of an open-switch fault diagnosis approach in the IGBT-based power converter connected to permanent magnet synchronous generator-DC system. International Transactions on Electrical Energy Systems, 30, 8. [Google Scholar]
14. Wang, C., Zhou, L. C., Li, Z. C. (2019). Survey of switch fault diagnosis for modular multilevel converter. IET Circuits, Devices & Systems, 13(2), 117–124. DOI 10.1049/iet-cds.2018.5136. [Google Scholar] [CrossRef]
15. Shu, C., Chen, Y. T., Yu, T. J., Wu, X. (2016). A novel diagnostic technique for open-circuited faults of inverters based on output line-to-line voltage model. IEEE Transactions on Industrial Electronics, 63(7), 4412–4421. DOI 10.1109/TIE.2016.2535960. [Google Scholar] [CrossRef]
16. Chen, D. J., Liu, Y. T., Zhang, S. Z. (2019). Open-circuit fault diagnosis method for the T-type inverter based on analysis of the switched bridge voltage. IET Power Electronics, 12(2), 295–302. DOI 10.1049/iet-pel.2018.5377. [Google Scholar] [CrossRef]
17. Zhang, J. X., Sun, H. X., Sun, Z. X., Dong, W. C., Dong, Y. (2019). Fault diagnosis of wind turbine power converter considering wavelet transform, feature analysis, judgment and BP neural network. IEEE Access, 7, 179799–179809. DOI 10.1109/ACCESS.2019.2958409. [Google Scholar] [CrossRef]
18. Tan, Y. H., Zhang, H. X., Zhou, Y. (2020). Fault detection method for permanent magnet synchronous generator wind energy converters using correlation features among three-phase currents. Journal of Modern Power Systems and Clean Energy, 8(1), 168–178. DOI 10.35833/MPCE.2018.000347. [Google Scholar] [CrossRef]
19. Zhang, J. X., Sun, H. X., Sun, Z. X., Dong, W. C., Gong, S. Y. (2020). Reliability assessment of wind power converter considering SCADA multistate parameters prediction using FP-growth, WPT, K-means and LSTM network. IEEE Access, 99, 1. [Google Scholar]
20. Chen, C. B., Wang, X. X., Gao, S., Zhang, Y. M. (2020). A diagnosis method for open-circuit faults in inverters based on interval sliding mode observer. Proceedings of the CSEE, 40(14), 4569–4579+4736. [Google Scholar]
21. Zhang, X. G., Li, Z. X. (2016). Diagnostic method of open-switch faults in inverters without voltage sensor. Electric Machines and Control, 20(4), 84–92. [Google Scholar]
22. Zhao, H. S., Cheng, L. L. (2017). Open-circuit fault diagnosis based on bilinear observer for converter power-switch of doubly-fed wind turbine. Electric Power Automation Equipment, 37, 72–79. [Google Scholar]
23. Jung, S. M., Park, J. S., Kim, H. W., Cho, K. Y., Youn, M. J. (2013). An MRAS-based diagnosis of open-circuit fault in PWM voltage-source inverters for PM synchronous motor drive systems. IEEE Transactions on Power Electronics, 28(5), 2514–2526. DOI 10.1109/TPEL.2012.2212916. [Google Scholar] [CrossRef]
24. Liang, J. P., Zhang, K., Al-Durra, A., Zhou, D. M. (2020). A novel fault diagnostic method in power converters for wind power generation system. Applied Energy, 266, 114851. DOI 10.1016/j.apenergy.2020.114851. [Google Scholar] [CrossRef]
25. Jlassi, I., Estima, J. O., Khojet, E. K. S., Mrabet Bellaaj, N., Marques Cardoso, A. J. (2015). Multiple open-circuit faults diagnosis in back-to-back converters of PMSG drives for wind turbine systems. IEEE Transactions on Power Electronics, 30(5), 2689–2702. DOI 10.1109/TPEL.2014.2342506. [Google Scholar] [CrossRef]
26. Li, B., Yao, W. X., Hang, L. J., Lü, Z. Y. (2014). Optimized design of state variable feedback of grid-connected inverter with LCL-filter based on state observer. Transactions of China Electrotechnical Society, 29(6), 80–90. [Google Scholar]
27. Wang, J. D., Zhang, X. J., Du, X. H., Li, G. D. (2011). Standards of grid-connection technology for photovoltaic and wind power generations. Electric Power Automation Equipment, 31(11), 1–7. [Google Scholar]
 | This work is licensed under a Creative Commons Attribution 4.0 International License, which permits unrestricted use, distribution, and reproduction in any medium, provided the original work is properly cited. |