| Energy Engineering |
DOI: 10.32604/EE.2021.014641
ARTICLE
Optimal Trading Decision-Making of Power Supply Chain under Renewable Portfolio Standards
College of Economics and Management, Shanghai University of Electric Power, Shanghai, 200090, China
*Corresponding Author: Haocheng Xu. Email: xuhaocheng2020@mail.shiep.edu.cn
Received: 15 October 2020; Accepted: 26 January 2021
Abstract: Under the background of implementing renewable portfolio standards and the ever-improving tradable green certificate scheme, the increasingly environmentally-friendly preference of power users is leading to changes in electricity demand, which, in turn, is driving changes in the decision-making behaviors of various actors in the power supply chain. Based on this, with the goal of pursuing maximum profit, consumer-power-demand functions have been introduced with some consideration of the factors of consumer preference to establish an optimal profit model for each trading subject in non-cooperative states of the power supply chain, under the constraints of meeting renewable energy portfolio standards. Here, the optimal strategy of each trading subject is presented by adopting the reverse induction method. Furthermore, examples are used to analyze factors such as the influence of environmental protection preferences, quota ratios, price substitutions, and market demand as well as the optimal profit of each trading subject in view of providing a reference for the decision-making in the power supply chain trading subjects.
Keywords: Renewable portfolio standards; electricity sales company; renewable energy generators; power supply chain
In the context of fossil fuel shortage and increasingly serious environmental pollution, the implementation of renewable portfolio standards (RPS) and the improvement of the green certificate system has resulted in the decision-making for all subjects in the power supply chain becoming increasingly diversified [1]. Because of its environmentally-friendly nature, renewable energy has attracted increasing attention worldwide. Simultaneously, the growing awareness of environmental protection on the demand-side has increased some consumers’ demand for renewable energy power consumption. Some consumers, with strong environmental awareness, are willing to pay for pricier products. In fact, more consumers are now willing to accept higher prices [2]. The change in consumer demand for electricity is undoubtedly affecting the trading decisions of the main bodies in the power market, which is, in turn, profoundly affecting the supply and demand pattern of the power supply chain.
1.1 Development Background of China’s Renewable Portfolio Standards
The feed-in tariff (FIT) scheme was first established in China in 2006 and subsequently spurred the rapid development of China’s renewable energy system, with the nation’s current installed capacity for wind power and photovoltaic power ranking first in the world [3]. However, the gap in subsidies for renewable energy is widening, with the subsidies unable to cover the rapidly growing installed capacity of renewable energy systems. In view of this, the energy authorities have successively lowered the benchmark tariffs for wind power and photovoltaic subsidies in an effort to address the growing subsidy gap. In May 2018, China Energy Administration [4] issued the “Notice on Matters Related to Photovoltaic Power Generation in 2018,” which directly led to a sharp decline in the domestic photovoltaic installed capacity. Additionally, China’s renewable energy power generation distribution is geographically strong, and because of the insufficient grid transmission capacity, the problem of renewable energy transmission and consumption remains a serious one. Therefore, it is crucial to establish a long-term mechanism to promote the development and consumption of renewable energy power [5]. China’s multiple policy adjustments for wind power and photovoltaics, and the “Renewable Energy Power Quotas and Assessment Measures (Draft for Comment)” issued in 2018 [6], mean that China’s renewable energy support policy will shift from the FIT scheme to one mandatory institutional renewable energy system that combines the RPS and the renewable energy certificate (REC) systems. Under the RPS system, the government imposes mandatory controls over the market share of renewable energy through various laws and regulations [7] while using the REC system to assist in assessing the completion of the RPS indicators [8].
1.2 Progress of China’s Renewable Portfolio Standards
China is currently in the transition stage from FIT to RPS [9]. The early research on RPS, which includes the trading model, the RPS implementation scheme, and market power, is focused on the power generation side [10–12], while several studies on system dynamics have provided an in-depth analysis of the development prospects of a RPS/renewable energy sources (RES)-based power generation industry [13–16]. Meanwhile, related models have been used to empirically analyze the efficacy and feasibility of regional power generation industry planning under the RPS system [17,18]. To improve the market competitiveness, power companies must meet the needs of both the RPS and the power users, thus holding the qualifications of basic power sales and value-added services and showing a preference for signing long-term contracts with RES power generators [19]. In fact, this followed by an evolutionary equilibrium process involving the RPS and the behavioral strategies of power generation companies. Here, targeted research suggested that the key to the success of the RPS lay in whether the fairness of the quota indicators could be guaranteed [20]. Based on literature [20], the area of quota allocation was researched in terms of entropy weight and cost minimization methods [21,22]. Given the attention paid to the RES-related trading decisions in the power market, a dynamic game model of the supply chain was constructed to study the optimal decision for high-load absorption blocked wind power during the period of peak reduction [23]. With some consideration of RES and a distributed power supply, various power packages for power sales companies were proposed [24]. However, these power packages lacked universality because of the assumption that RES purchase costs could be ignored. An optimal decision model for each trading subject was then constructed under the conditions of supply chain non-cooperation and cooperation [25].
The development of RES in China has resulted in high requirements for the power supply chain. In face of the pressure induced by the renewable energy quotas and the change in consumer demand, it is of great practical significance for the main bodies of the power supply chain to make optimal trading decisions. However, there is a lack of research in this area.
1.3 Impact of the Renewable Portfolio Standards Mechanism on the Electricity Market
The RPS mechanism affects the decision-making behavior of market entities, such as electricity sales companies, power generators, and users. The electricity markets in the US [26], Australia, the UK, Italy, the Netherlands, and other countries [27] have all implemented renewable energy quota systems. The impact of the US RPS system on the electricity market has been studied, with its implementation found to have had a positive impact on all related entities [28]. A dominant enterprise–competitive edge model based on the RPS system was built to analyze the mid- and long-term investment strategies and the market power of renewable energy in the electricity market [29]. Meanwhile, several models were built to simulate market trading under the RPS mechanism, which was found to have the potential to enhance the competitiveness of the renewable energy power generation entities [30]. Elsewhere, a profit model of cooperation among electricity sales companies and microgrid group agents was proposed [31], which helped reduce the evaluation pressure faced by electricity sales companies under the RPS and deviation power evaluation mechanisms, with great importance attached to the environmental benefits of microgrid groups. A Bayesian hybrid logic model was also used to analyze the users’ preference for the RPS mechanism, while their marginal willingness to pay more was analyzed through the scenario method [32].
1.4 Design Concept of the Renewable Portfolio Standards Mechanism Framework
An ideal design of the RPS framework involves some consideration of balance among environmental governance, renewable energy development goals, and implementation costs and must align with top-level energy policies [33,34]. The design should also relate to the interactions among the quota indicators, market structure, and market entities in view of not distorting the attendant goals and causing unnecessary loss of social benefits [35]. Finally, a perfect RPS mechanism must also take into account certain parallel mechanisms and supporting measures. An electricity market trading mechanism was proposed with some consideration of absorbing responsibility and constructing a market framework under the coordination of multiple energy policies [36]. Additionally, it is important to consider the REC trading system, carbon emission trading system, attendant additional taxes, corresponding penalty mechanisms, etc. As an emerging market participant after the power sales market is liberalized, electricity sales companies primarily rely on participating in market purchases and sales of electricity to obtain profits [37]. Diversified market transaction paths, electricity price forecasts, and risk assessment are key links that affect electricity purchase decisions of retail companies [38–40]. Zhang et al. [41] has proposed building a renewable energy market trading plan with electricity sales companies as the main body and renewable energy trading volume as an evaluation indicator. Wang et al. [25] has also put forward planning and construction suggestions for establishing a multi-level renewable energy trading market on a time scale. Further, Huang et al. [35] has formulated two different renewable energy retail schemes according to user needs and analyzed the purchasing and selling decision behavior of electricity companies from the implementation of the quota system and environmental benefits. Moreover, Zhao et al. [42] has placed the electricity market transaction mechanism under the responsibility of consumption and built a market framework under the coordination of multiple energy policies.
1.5 Current Research Status of RPS and Its Power Market Linkage
At present, domestic and foreign scholars’ researches on RPS and its linkage with the electricity market mainly focuses on two aspects. The first is the RPS framework system and its effectiveness. Liu et al. [43] has used system dynamics to study the mechanism and effect of RPS on China’s power supply structure, and results show that it can effectively promote power supply structure adjustment and achieve government policy goals. Feng et al. [40] has proposed compensating ancillary services for green power certificates under RPS and quantifying them into a certain amount of green certificates to encourage ancillary service providers to offer services for RE. Jiang et al. [44] has designed an RPS framework with power users as the main body of obligation and demonstrated its feasibility. Further, the literatures [45–47] has analyzed and compared various foreign RE support policies and made recommendations on the Chinese RPS framework. The second aspect is the study of multi-agent trading strategies under the background of RPS. Additionally, literatures [48–51] have established a power market equilibrium model for green certificate trading and analyzed the role of RPS in promoting RE power consumption and market characteristics but set the obligation subject to the power generation. Literatures [52–56] have established the mathematical planning problem with equilibrium constraints for maximizing the revenue of RE generators, transforming it into a mixed-integer linear through linearization methods, such as strong duality theorem and binary expansion method. Thus, the mixed-integer linear programming model is solved.
Given the influence of the changes in the RPS system and in consumer demand on the trading decisions of the main bodies within the power supply chain, this paper constructs a model based on power-user demand, renewable energy generation, conventional energy generation, and power sales optimal profit and uses the reverse induction method to propose optimal decisions for the non-cooperative game among the subjects in the power market. To verify the validity of the model, concrete examples are used to analyze the influence of renewable energy quota ratios, environmentally-friendly preferences, and user demand on the purchase and sales strategy of each trading subject within the power supply chain.
2 Trading Market Structure of the Power Supply Chain under the Renewable Portfolio Standards Mechanism
The notice on establishing and perfecting the guarantee mechanism of renewable energy power consumption issued in 2019 marked the entry of renewable energy consumption into the era of compulsory examination [57]. The implementation of the RPS system led to the formation of a new trading structure in the power supply chain market. As shown in Fig. 1, conventional energy generators sell conventional electricity to the wholesale power market compared with renewable energy generators that bundle their green certificates to sell renewable electricity to the wholesale power market. The two types of electricity supply interact with each other. The electricity selling company, as a middleman, purchases the corresponding conventional and renewable electricity from the wholesale market according to the demands of its consumers (such as traditional electricity consumers, traditional and green electricity consumers, and pure green electricity users). And because of quotas, companies must annually consume a certain amount of renewable electricity. The subject of quota obligation first purchases conventional and RES power through the electricity wholesale market and then sells it to all kinds of electricity consumers in the retail market.
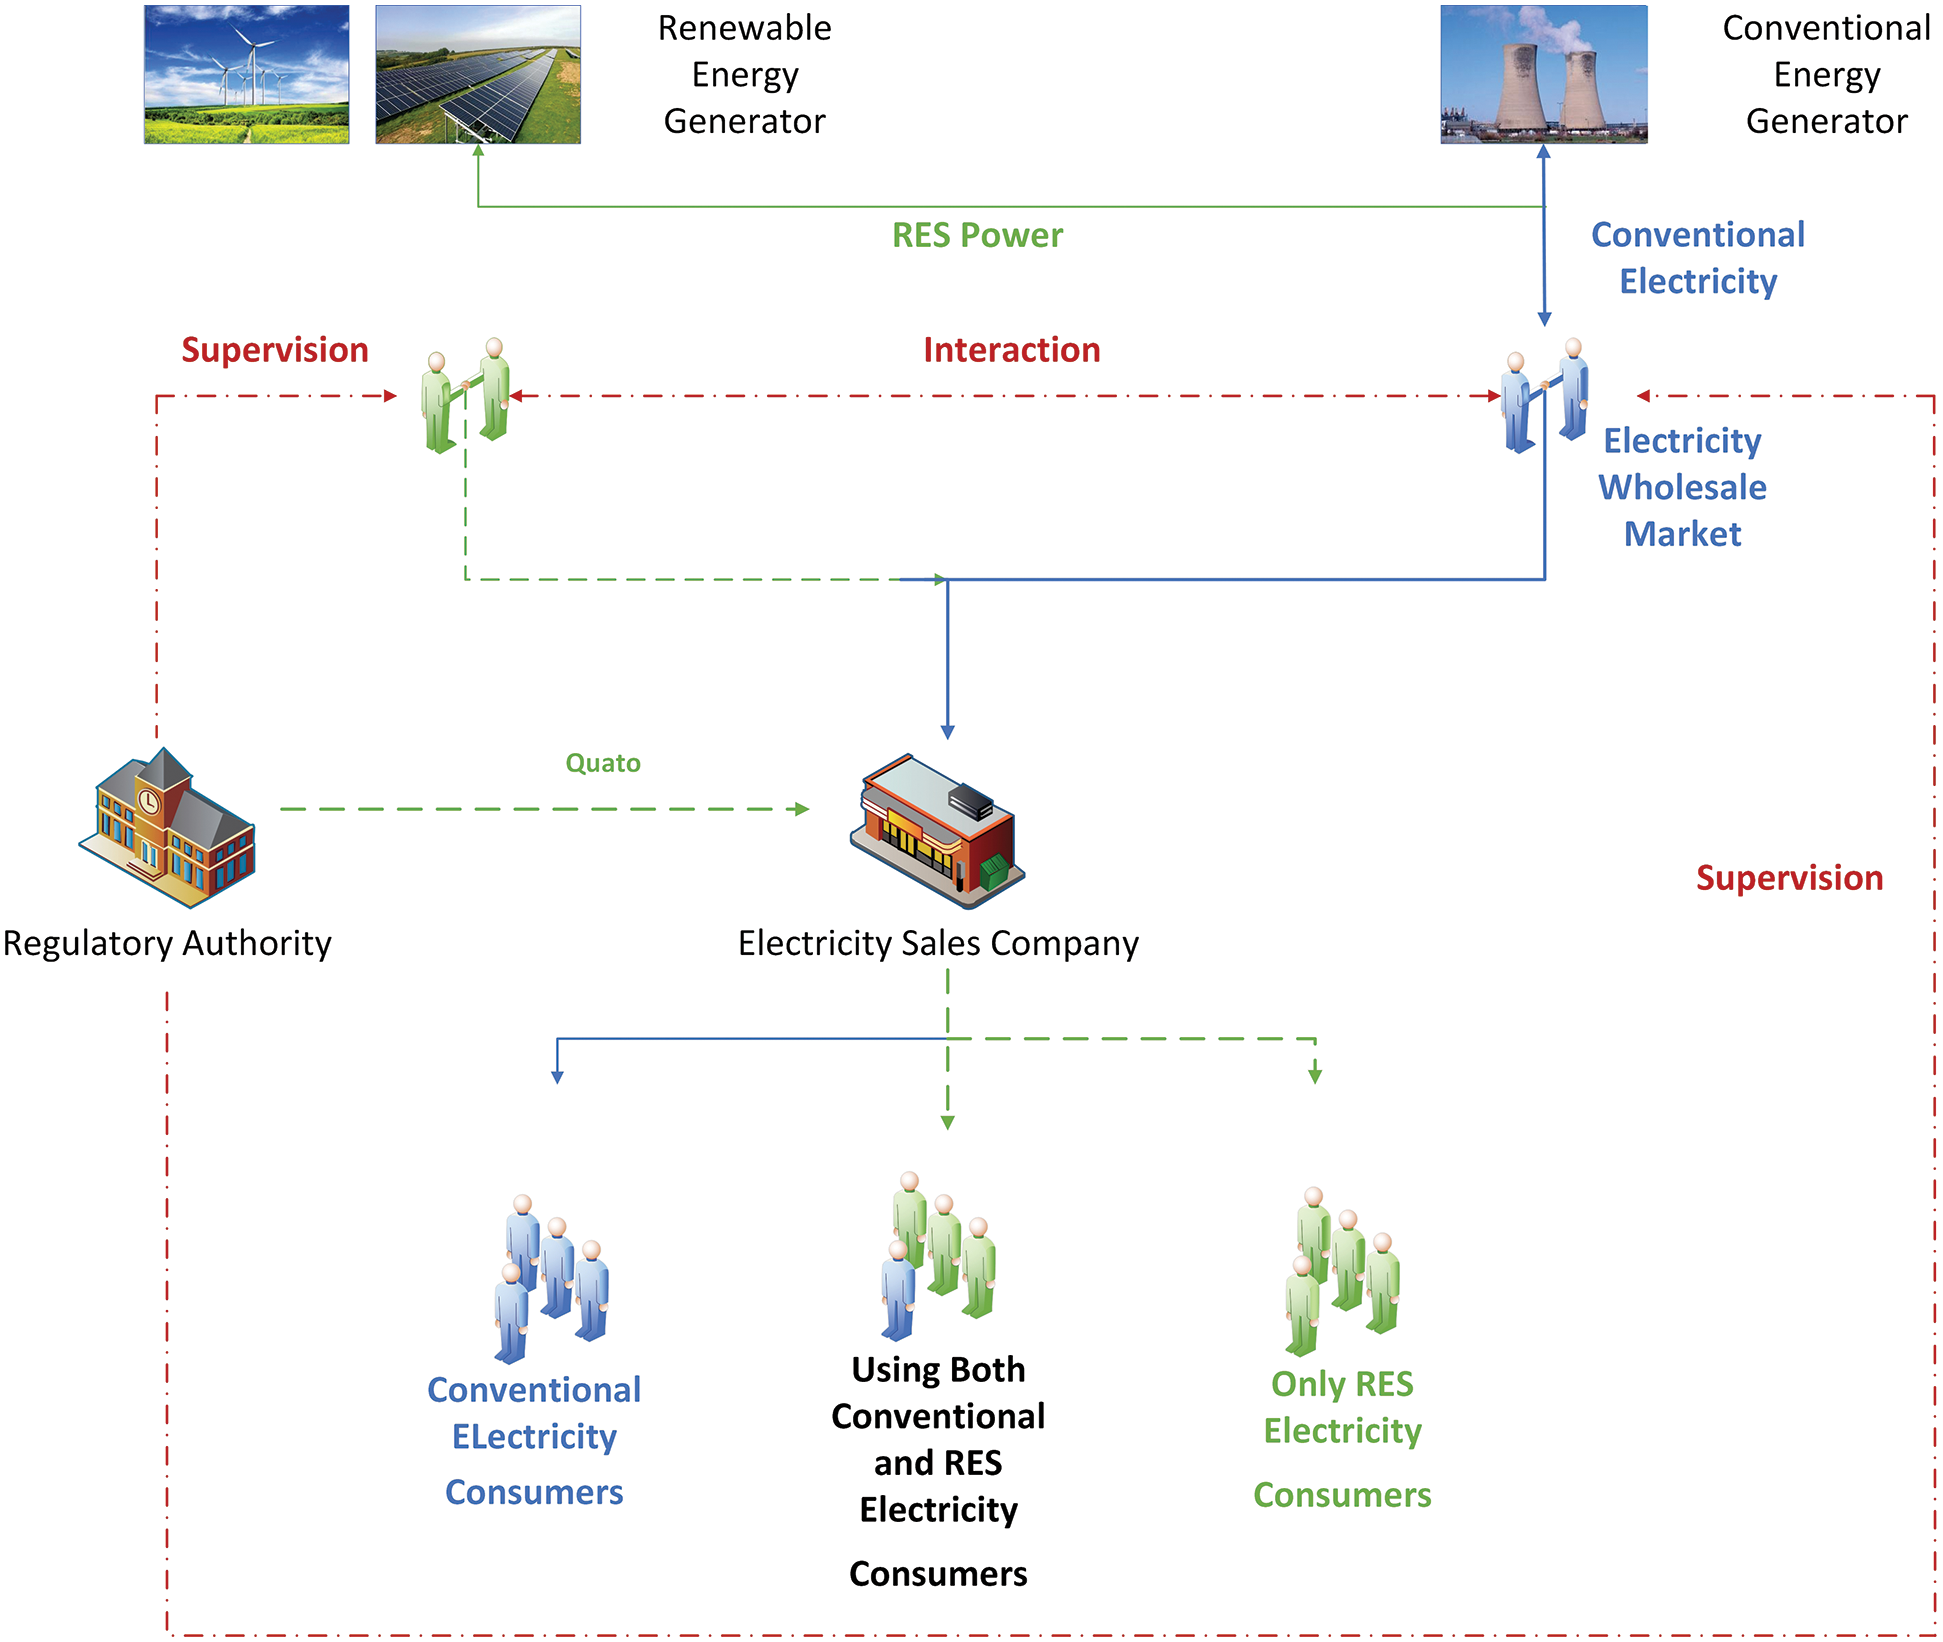
Figure 1: Market structure of electricity supply chain trading under RPS
RES electricity prices were determined by the market competition in the new power market environment, with the aim of restoring the commodity attribute of electric power. In the power supply chain, each trading subject presented a pairwise game relationship. Here, each trading body had its own game goal, while the power users needed to satisfy their own electricity preference and demand, which determined the retail sales of conventional and RES electricity for power-selling companies. Meanwhile, for the intermediary companies, retail electricity remains consistent with buying electricity from two types of upstream generator. Overall, the electricity sales companies and the power generation companies hoped to achieve their own specific goals.
3 The Profit Function of Each Trading Subject in the Power Supply Chain under the Renewable Portfolio Standards Mechanism
3.1 The Function of Power-User Demand
The environmental awareness of power users has become an important factor affecting their willingness to pay. In fact, the actual purchase behavior of power users in terms of renewable energy power products is not entirely consistent with their preference for renewable energy power products, which is also affected by the market price of the products and the price competition between these products and conventional energy power products. Meanwhile, electricity sales enterprises have both conventional electricity consumption channels and renewable power consumption channels.
User demand comprehensively reflects the interaction among users’ electricity consumption behavior and preference and different energy and electricity prices. Among them, energy and electricity prices are the most intuitive for consumers’ demand feedback. Consuming renewable energy can improve user utility; however, its demand decreases with price growth. This paper uses a demand function similar to the literature [58] to describe the power user’s demand function for renewable and conventional energy.
with the following constraints:
1) tariff constraints:
2) quota constraints:
where
3.2 Profit Function of Conventional Energy Generators
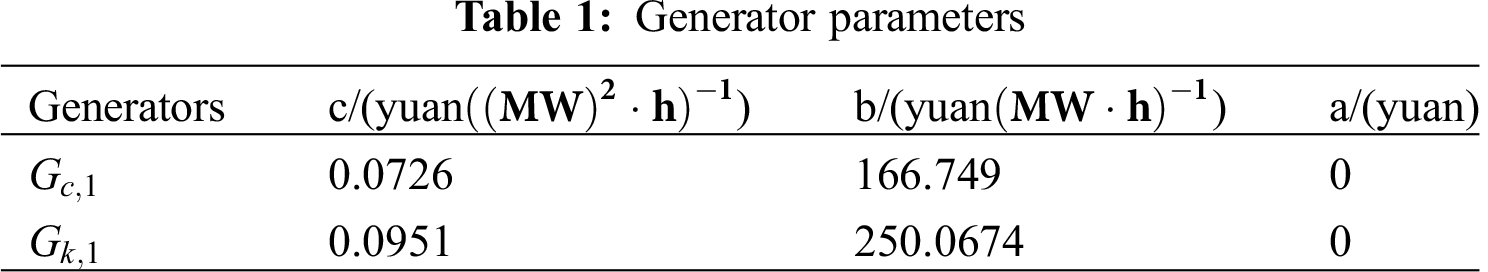
We can assume that conventional energy generators (i) have the following profit function [37]:
where
The constraints to be met are as follows [59]:
where
3.3 Profit Function for Renewable Energy Generators
We can assume that renewable energy generators (j) have the following profit functions:
where
The above formula presents the cost function of renewable energy generators where
The constraints to be met are as follows:
where
3.4 Profit Function of Electricity Selling Companies
Electricity sales companies act as the bridge between the generator and the power users, which is determined according to the type of electricity market trading and their own needs. In this paper, the power resources are divided into two types: renewable energy power and conventional energy power.
The profit function of the power sale company can be written as follows:
With the following constraints:
where
4 Optimal Decision-Making Model of Each Trading Subject in the Non-Cooperative Game
In the structure of the power supply chain constructed in this paper, the game relationship of each market subject can be summarized as follows. In the first layer, two types of power generators determine their respective wholesale electricity prices based on profit maximization, while the electricity sales companies determine the retail price of electricity and the amount of electricity purchased according to cost and maximum profit. Meanwhile, in the second layer, consumers maximize their demand for electricity on the basis of the retail prices of the power-selling companies.
(
where
The constraints are as follows:
1) Total constraint:
2) Power constraints:
3) Quota constraints:
The essence of the supply chain non-cooperative game is a pairwise game. As the profit
According to the calculated
Based on formulas (19) and (20), formulas (9) and (10) can solve the first layer problem of the two types of wholesale prices for electricity generators and the optimal wholesale price of conventional and renewable energy generators can be obtained via reverse induction:
As the power supplier and the power company sell the same electricity after the game—and because the users satisfy their own electricity preference and the demand for electricity is the same as the balance in the stable state of the power company, namely, formulas (7) and (8) solve the problem of third-tier consumers maximizing their power demand based on the retail price of the electricity selling company—the following models of the supply chain subjects apply.
4.1 Profits of Conventional Energy Generators
Here, the optimal profit of conventional power generators can be obtained by substituting formula (4) into the conventional power generator model, formula (20), the optimal electricity purchase price of conventional power generators, and formula (21), the optimal wholesale price of conventional power generators:
where
4.2 Profits of Renewable Energy Generators
Here, substituting formula (6) for the renewable energy power generator model, formula (19) for the optimal purchase power of conventional energy, and formula (22) for the optimal wholesale price of conventional energy power generator into the optimal profit of conventional energy power generator, the following is obtained:
where
4.3 Optimal Profit of Electricity Sales Companies
where
The following assumptions are made based on the on-grid price of conventional power and wind power price in China and the parameters of major power producers; let us suppose that the total potential demand q for renewable power and conventional power is 500 MW for both and reference [12] data source hypothesis that the market’s initial price is 0.308/kwh for renewable energy power
5.1 The Influence of User Preference and the Quota Ratio on the Optimal Profit of the Supply Chain
The preference coefficient for renewable energy power
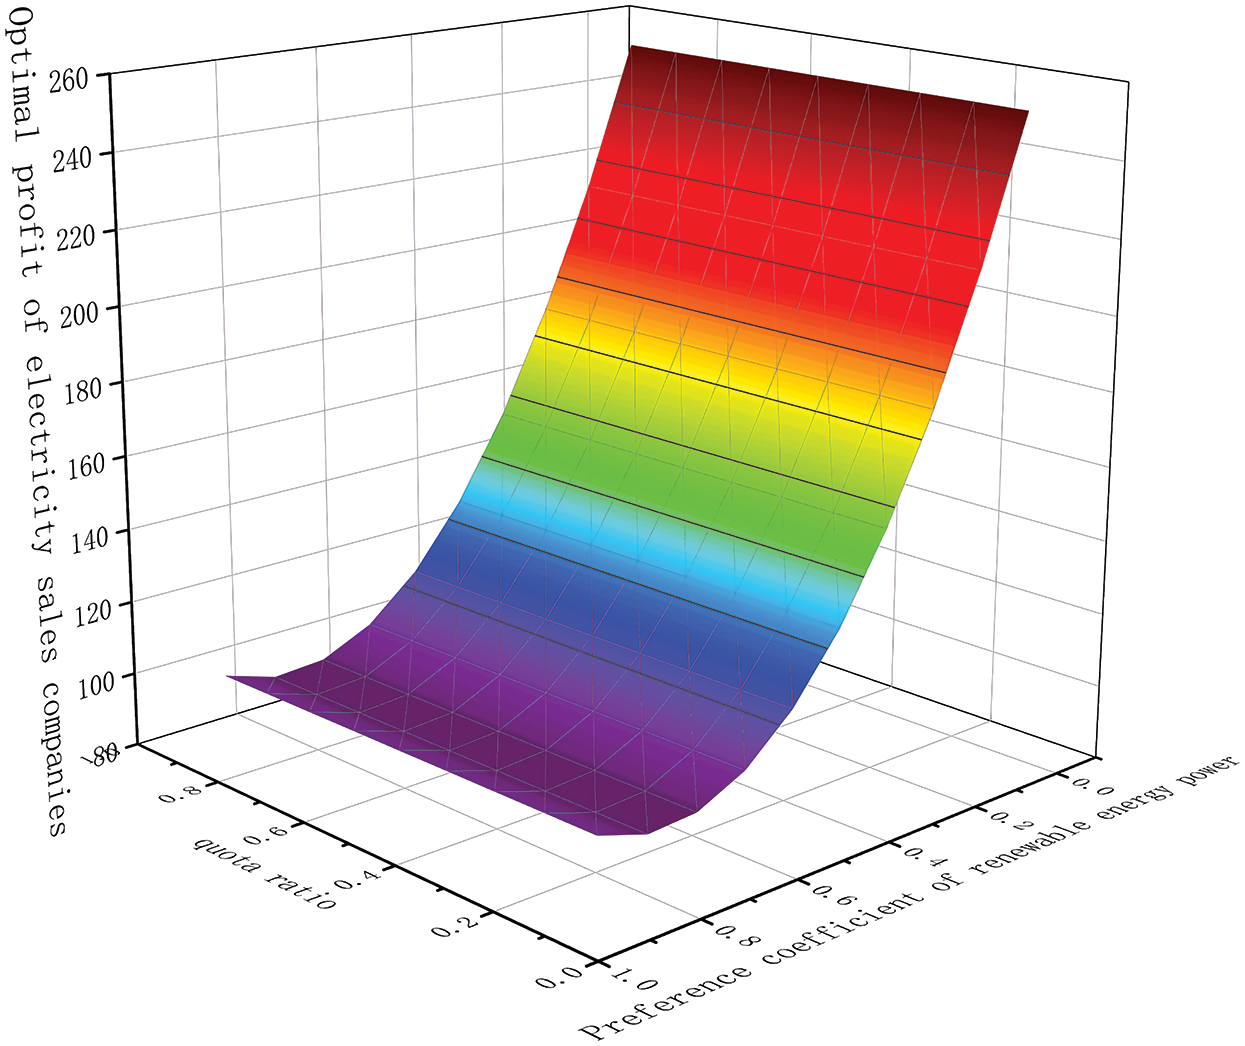
Figure 2: Optimal profit of power sales companies under different μ and δ
Fig. 2 shows the optimal profit of power sales companies in relation to the changes in the users’ environmental preference
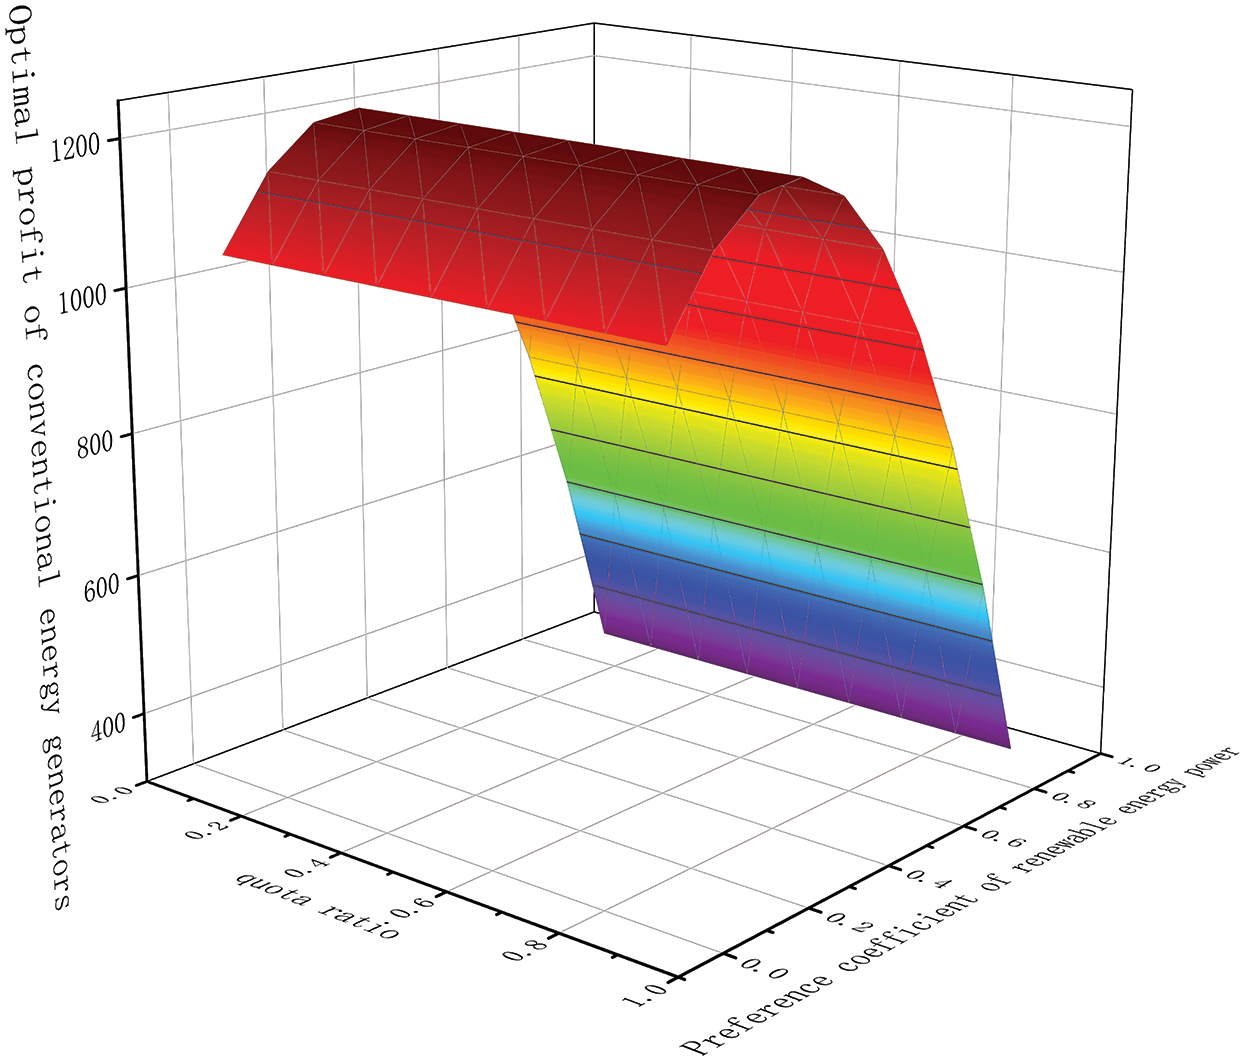
Figure 3: Optimal profit of conventional energy generators under different μ and δ
Fig. 3 shows the optimal profit of conventional energy generators in relation to the changes in the users’ environmental preference μ and the quota ratio δ. As the users’ preference for environmental protection increases, the proportion of renewable energy purchasing and selling increases, while those of conventional energy decrease and the attendant optimal profits present a downward trend. Therefore, the change in environmental preference and the quota ratio increase have a negative impact on conventional energy generators.
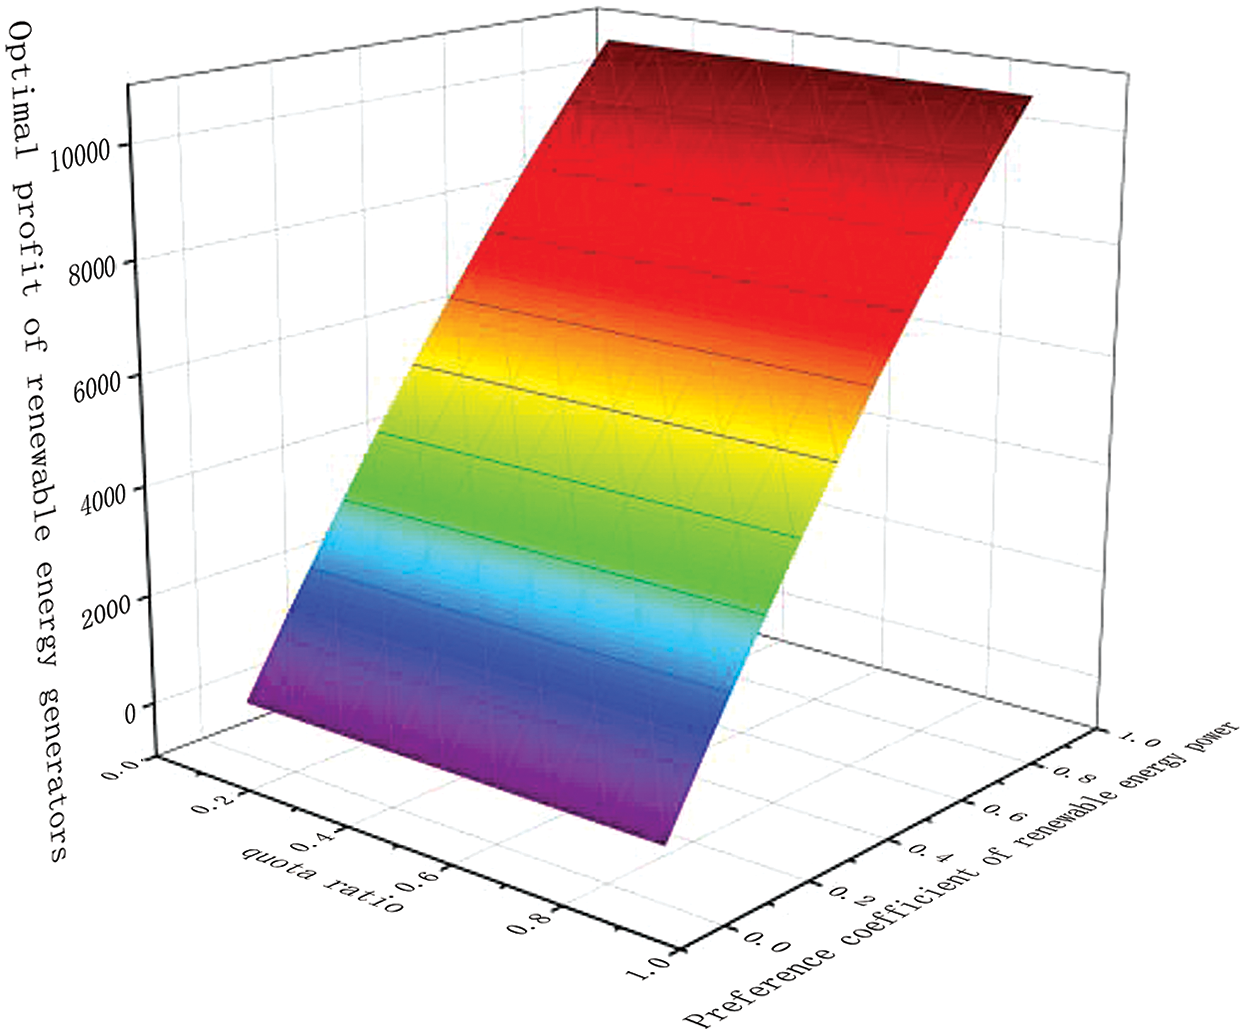
Figure 4: Optimal profit of renewable energy generators under different μ and δ
Fig. 4 shows the optimal profit of renewable energy generators in relation to the changes in user preference μ and the quota ratio δ. The optimal profit of renewable energy generators is positively related to both μ and δ as, with the gradual improvement in both, society will be encouraged to create a greener environment in terms of electricity consumption. This will, in turn, encourage sales companies to purchase more RES electricity and increase the consumption of it, thus increasing the profits of renewable energy generators. Overall, the improvement in μ and δ will have a positive impact on the profits of renewable energy generators.
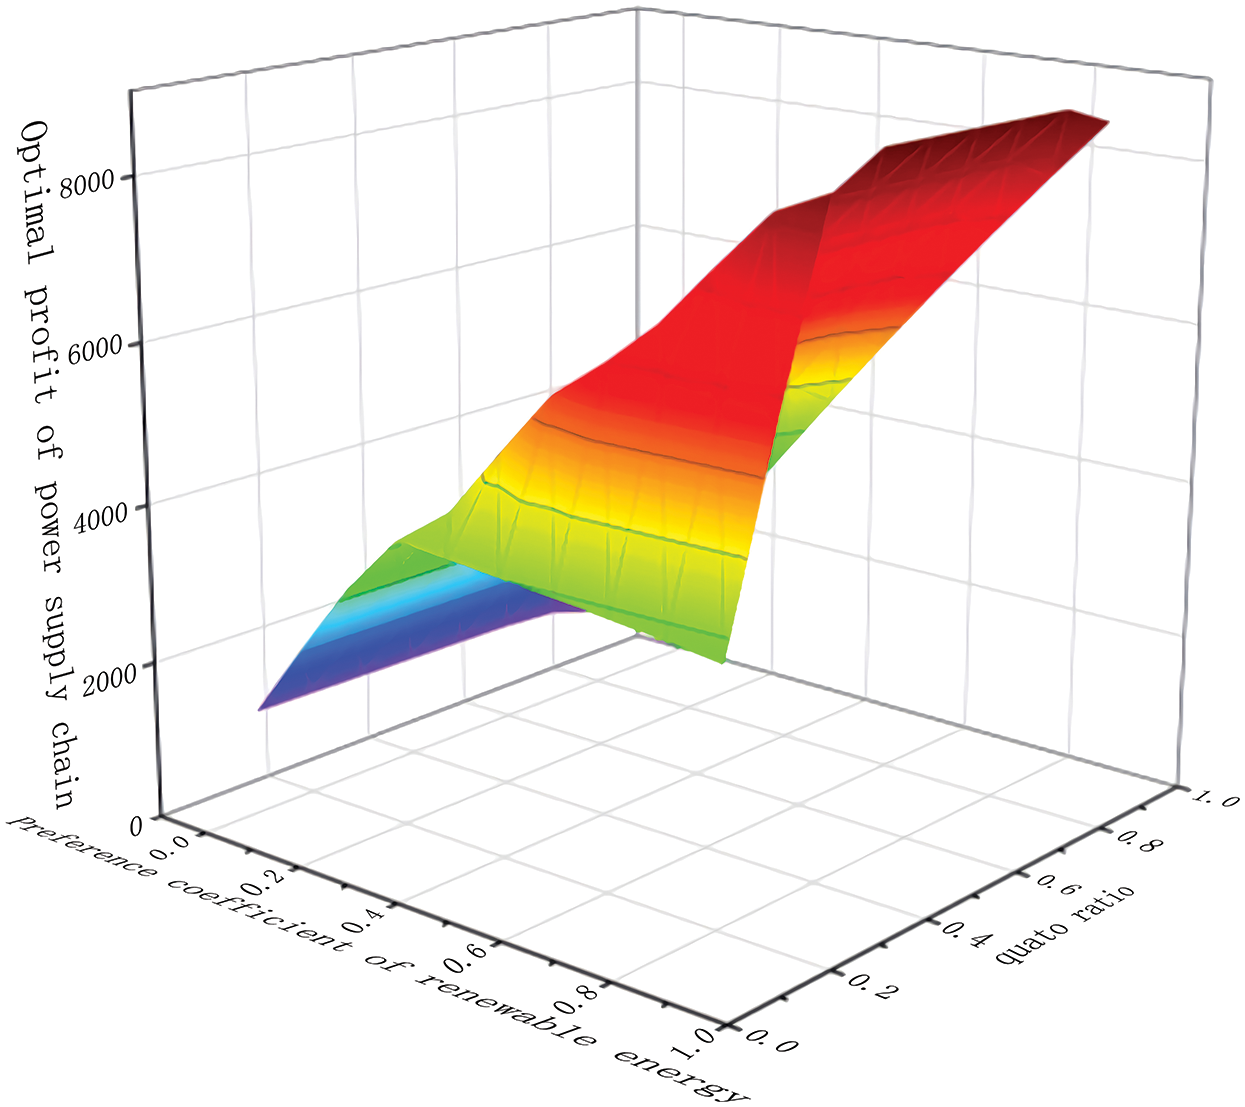
Figure 5: Optimal profit of power supply chain under different μ and δ
Fig. 5 shows the change of optimal profit of power supply chain under the change of environmental preference and quota ratio of different users. The optimal profit of power supply chain is positively correlated with environmental preference of users, while negatively correlated with quota ratio. The analysis shows that when users’ environmental preference keeps increasing, the consumption of renewable energy gradually occupies the main part of profit in the power supply chain. Compared with the profit of conventional energy, the profit space of renewable power is greater; thus, the optimal profit of the overall supply chain has been increasing positively. However, when the quota ratio of electricity selling companies keeps increasing the optimal profit will reduce and lead to negative situations, such as slow sales. The profit proportion of each main body in the supply chain is dominated by the electricity selling companies; therefore, the optimal profit of the whole supply chain will decrease.
5.2 Volatility of Market Demand and the Quota Ratio
Let us suppose that the price substitution coefficient of renewable power energy and conventional energy
Let us also suppose that the change in total potential demand q for renewable and conventional electricity presents a shift from 400 to 800. The output of the conventional power generator is 0.6
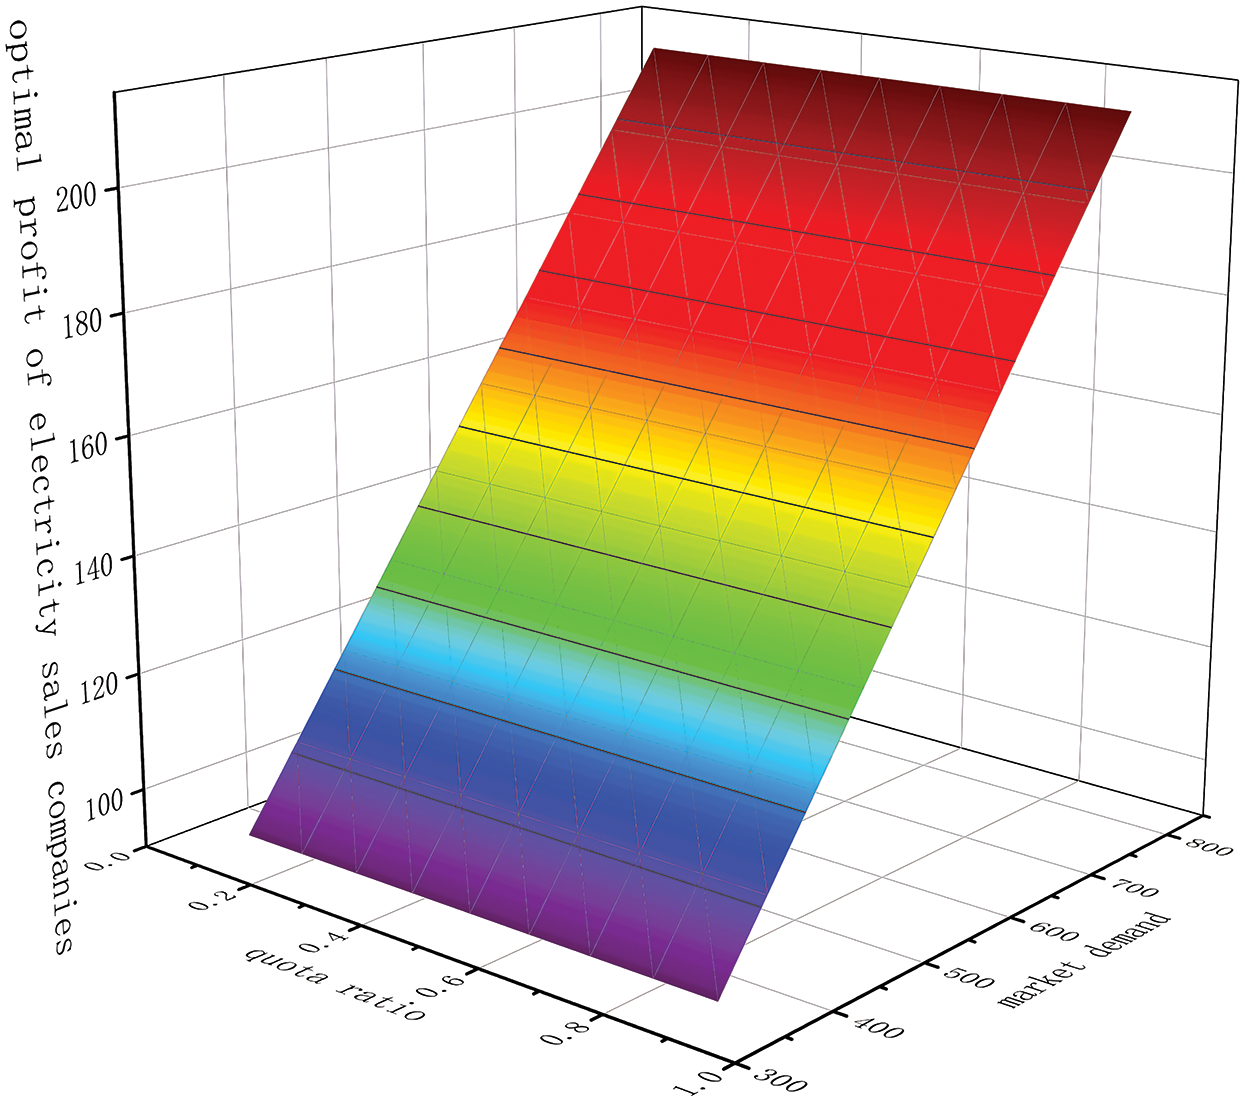
Figure 6: The impact of market demand and quota ratio fluctuations on the optimal profit of electricity sales companies
Fig. 6 shows the influence of market demand q and quota ratio
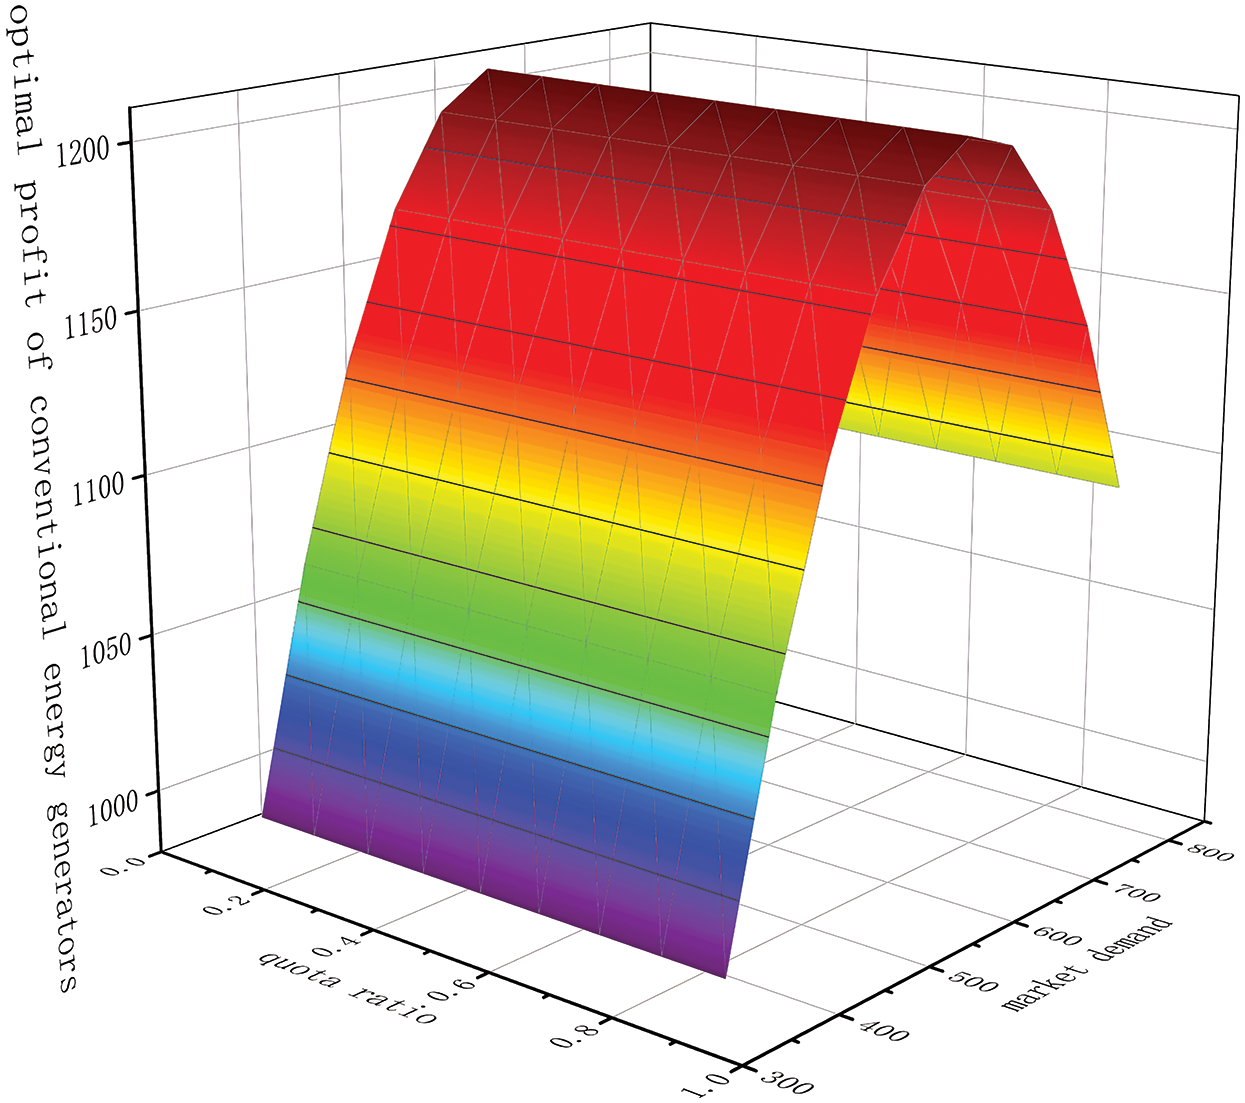
Figure 7: The impact of the fluctuations in market demand and quota ratio on the optimal profit of conventional energy generators
Fig. 7 shows the influence of market demand q and quota ratio
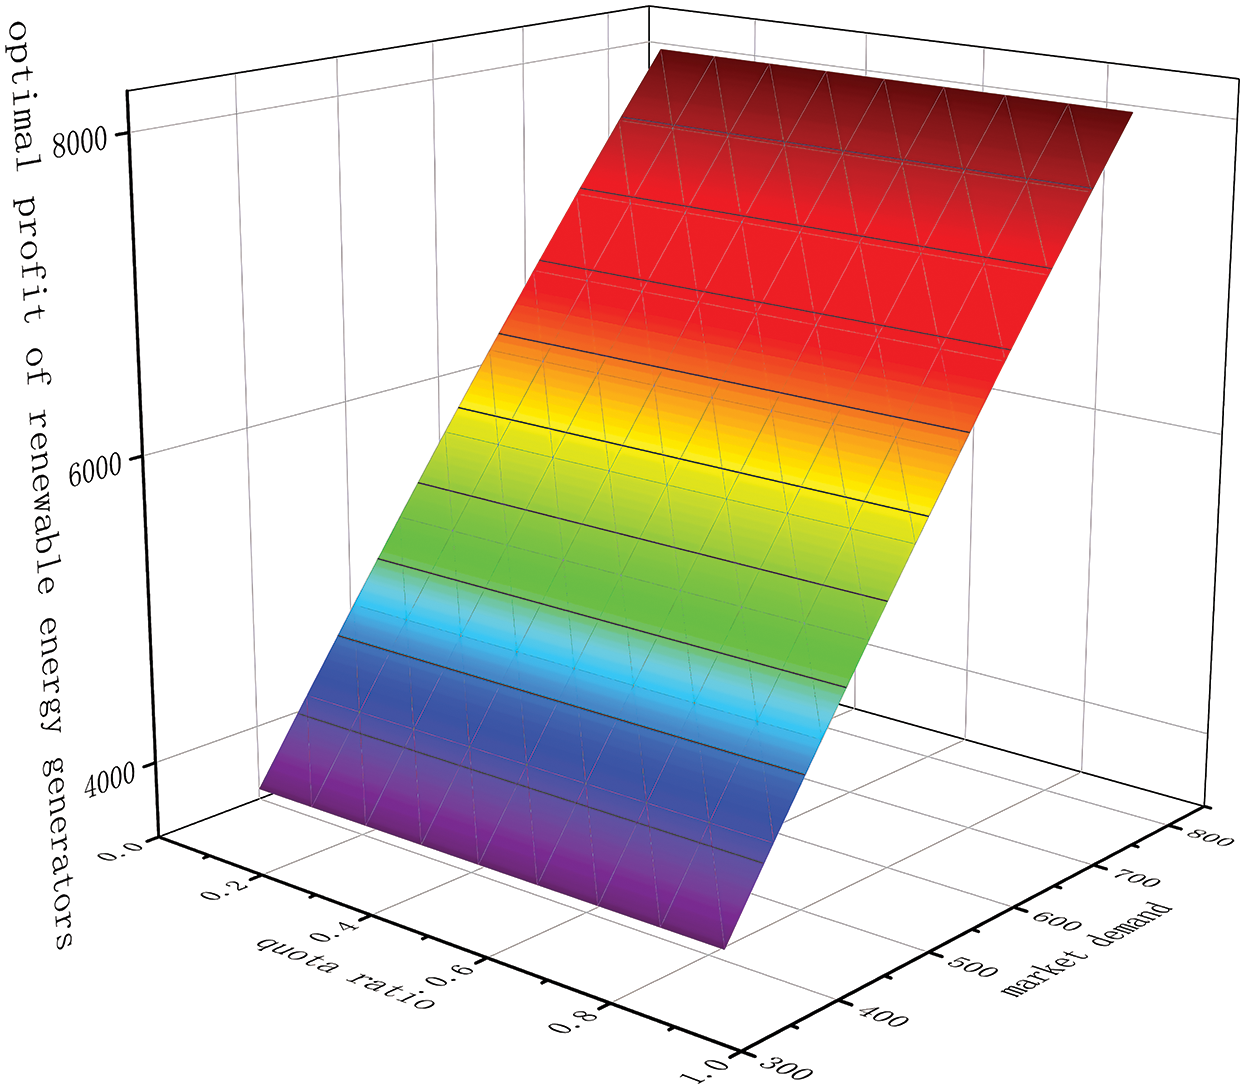
Figure 8: Impact of fluctuations in market demand and quota ratio on the optimal profit of renewable energy generators
Fig. 8 shows the influence of market demand p and quota ratio
5.3 Sensitivity Analysis of Price Substitution Coefficient
The preference coefficient for purchasing renewable power
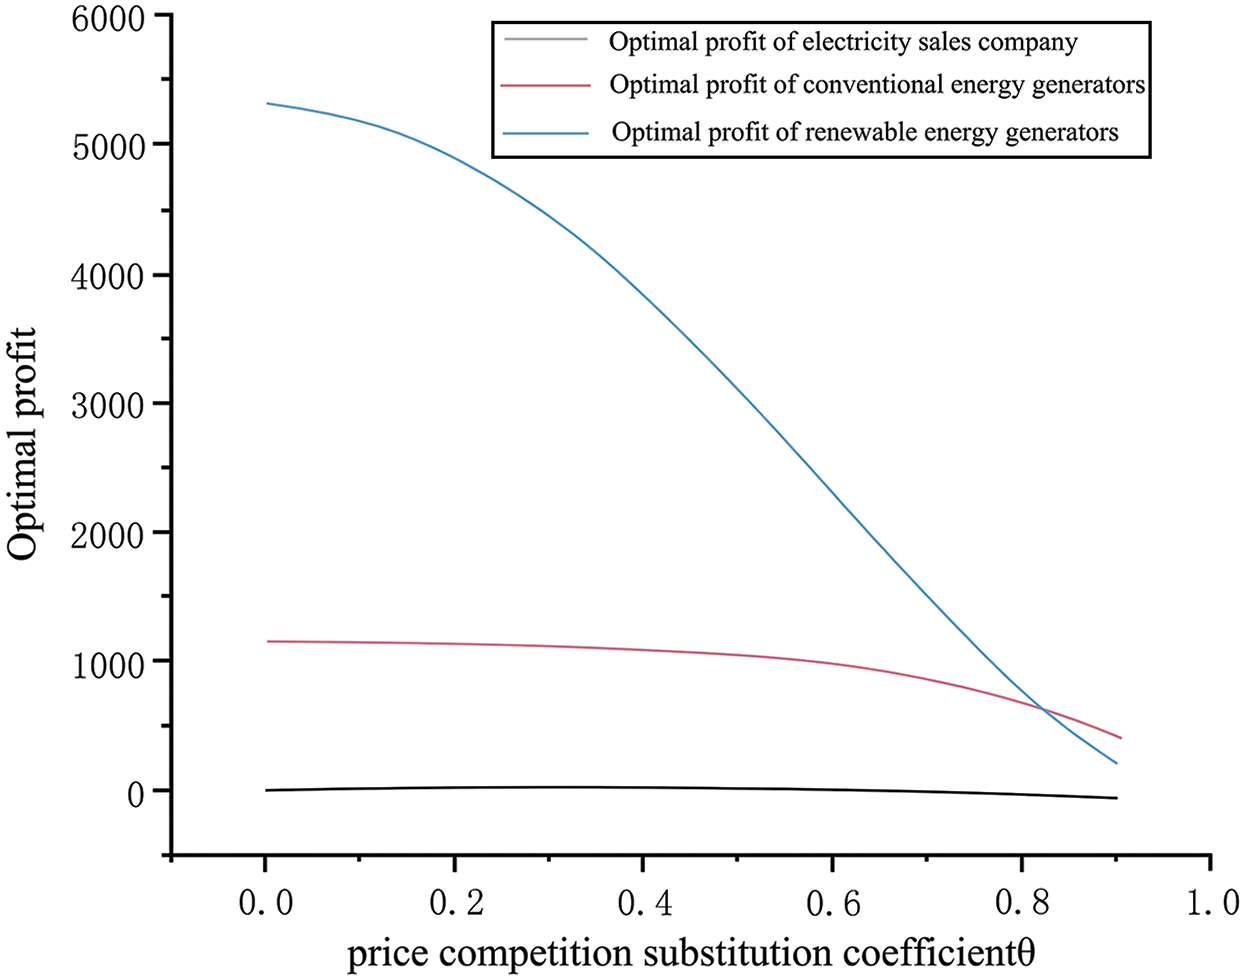
Figure 9: Impact of price competition substitution coefficient θ on the optimal profit of electricity sales companies and conventional and renewable energy generators
Fig. 9 shows the optimal profit curve in relation to the fluctuations in the price substitution coefficient
Given the influence of consumer environmental awareness, RPS quotas, and the price competition between renewable energy and conventional power energy, this paper outlined the relationship between the main bodies of the power supply chain and established an optimal profit model of the supply chain. Through empirical analysis of the model, the following conclusions can be drawn:
1. Enhancing user awareness of environmental protection will promote the progress of the RPS system, which could effectively increase the profits of integrated energy sales companies, while the appropriate quota ratio could enhance the efficiency of the power sales companies. However, because of the presently low understanding of environmental protection among Chinese users, the profitability of renewable power generators lies at the weak end of the power supply chain.
2. During the fluctuations in market demand and the quota ratio, the renewable energy generators in the supply chain are strongly affected as the proportion of RES electricity in the current power market is small. As the market demand rises and the quota ratio increases, the positive response of the RES power generator is the clearest. When the quota ratio increases, the optimal profit of the power sale company decreases slightly in the short term because the absorption task cannot be effectively undertaken by the user, while the optimal profit of RES from a long-term perspective is still increasing. Because conventional electricity dominates the market, the change in market demand has had little effect on the profits of conventional energy generators. Meanwhile, the increase in the quota ratio reduces the consumption of RES electricity as the attendant policy requires the power companies to buy more electricity. Therefore, the optimal profit will be negatively affected.
3. The price substitution coefficient has a significant influence for renewable energy generators, and the field of RES power is clearly affected by the price competition with the field of conventional power. As such, RES power producers must set RES power prices at reasonable levels to ensure that the field can survive and develop within the context of market competition.
Considering the implementation of RPS, the change in users’ environmental awareness leads to the change in power demand. Each main body in the power supply chain should make the optimal power trade decision according to the differentiated power demand of power consumers. All the transaction participants in the electric power market should finish the corresponding quota, and at the same time pay attention to the potential profit margin of renewable energy power and build the operation pattern from the developmental perspective, so as to promote the implementation of RPS and the optimal configuration of renewable energy.
The following are shortcomings in this paper: The function model used to build users’ two types of power demand is quite simple. In the future, we will introduce green certificate price and unbundled green power transaction to draw a more comprehensive conclusion, and provide a reference for practical power supply chain transaction.
Funding Statement: This work was supported by Project of Philosophy and Social Science Foundation of Shanghai, China (Grant No. 2020BGL011).
Conflicts of Interest: The authors declare no conflict of interest.
1. Xin, G. Z., Liang, J., Ling, Z. R., Zhang, Y. Z., Xu, J. Y. (2018). Top-level institutional design for energy low-carbon transition: Renewable portfolio standards. Power System Technology, 42(2), 1164–1169. [Google Scholar]
2. Xiong, Z. K., Zhang, P., Guo, N. (2014). Impact of carbon tax and consumers’ environmental awareness on carbon emissions in supply chains. Systems Engineering-Theory & Practice, 34(9), 2245–2252. [Google Scholar]
3. REN21 (2019). Renewables 2018 global status report. http://www.ren21.net/status-of-renewables/globalstatus-report. [Google Scholar]
4. State Development and Reform Commission, Ministry of Finance, State Energy Administration (2018). Notice on the related matters of photovoltaic power generation in 2018. http://www.ndrc.gov.cn/gzdt/201810/t20181009_900688.html. [Google Scholar]
5. Zhou, Q., Wang, N. B., He, S. N., Shen, C. Y., Yang, L. et al. (2017). Summary and prospect of China’s new energy development under the background of high abandoned new energy power. Power System Protection and Control, 45(10), 146–154. [Google Scholar]
6. The General Department of the State Energy Administration (2018). Letter to solicit opinions on the “renewable portfolio standard and assessment measures (draft)”. http://zfxxgk.nea.gov.cn/auto87/201803/t20180323_3131.htm. [Google Scholar]
7. Berry, T., Jaccard, M. (2001). The renewable portfolio standard: Design considerations and an implementation survey. Energy Policy, 29(4), 263–277. DOI 10.1016/S0301-4215(00)00126-9. [Google Scholar] [CrossRef]
8. Morthorst, P. E. (2003). A green certificate market combined with a liberalised power market. Energy Policy, 31(13), 1393–1402. DOI 10.1016/S0301-4215(02)00198-2. [Google Scholar] [CrossRef]
9. Ren, D. M. (2013). Renewable energy quota system policy research: system framework and operation mechanisms. Beijing, China: China Economic Publishing House. [Google Scholar]
10. Dongming, R. E. (2011). China’s Renewable portfolio standards and implementing countermeasures. Automation of Electric Power Systems, 35(22), 25–28. [Google Scholar]
11. Zhong, Y. F., Huang, M. X., Wen, F. S., Gong, J. B., Wang, Y. (2014). Equilibrium analysis of direct electricity purchase with green certificate mechanism. Electric Power Automation Equipment, 34(2), 144–150. [Google Scholar]
12. An, X. N., Zhang, S. H., Li, X. (2017). Equilibrium analysis of oligopolistic electricity markets considering tradable green certificates. Automation of Electric Power Systems, 41(9), 84–89. [Google Scholar]
13. Yu, Z. Z., Xin, G. Z., Ling, Z. R., Yi, Z. (2017). The development of the renewable energy power industry under feed-in tariff and renewable portfolio standard: A case study of China’s wind power industry. Journal of Cleaner Production, 168(9), 1262–1276. DOI 10.1016/j.jclepro.2017.09.102. [Google Scholar] [CrossRef]
14. Zhang, Y. Y., Zhao, X. G., Ren, L. Z., Liang, J., Liu, P. K. (2017). The development of China’s biomass power industry under feed-in tariff and renewable portfolio standard: A system dynamics analysis. Energy, 139(1), 947–961. DOI 10.1016/j.energy.2017.08.020. [Google Scholar] [CrossRef]
15. Zhao, S. N., Wang, B. B., Li, Y., Sun, H., Zeng, W. (2018). System dynamics based analysis on incentive mechanism of distributed renewable energy resources. Automation of Electric Power Systems, 41(24), 97–104. [Google Scholar]
16. Yu, S. K., Bi, P. P., Yang, W. Y., Wang, Y. L., Huang, Y. J. et al. (2018). Dynamic development system dynamics of renewable energy considering renewable energy quota system. Proceedings of the CSEE, 38(9), 2599–2608. [Google Scholar]
17. Zhang, Q., Wang, G., Li, Y., Li, H., McLellan, B. et al. (2018). Substitution effect of renewable portfolio standards and renewable energy certificate trading for feed-in tariff. Applied Energy, 227, 426–435. DOI 10.1016/j.apenergy.2017.07.118. [Google Scholar] [CrossRef]
18. Ji, L., Huang, G. H., Xie, Y. L., Niu, D. X., Song, Y. H. (2017). Explicit cost-risk tradeoff for renewable portfolio standard constrained regional power system expansion: A case study of Guangdong Province, China. Energy, 131(4), 125–136. DOI 10.1016/j.energy.2017.05.017. [Google Scholar] [CrossRef]
19. Wang, R. (2009). The research of optimal electricity procurement strategy with renewable portfolio standards. Beijing, China: North China Electric Power University. [Google Scholar]
20. Zhao, X. G., Ren, L. Z., Zhang, Y. Z., Wan, G. (2018). Evolutionary game analysis on the behavior strategies of power producers in renewable portfolio standard. Energy, 162(4), 505–516. DOI 10.1016/j.energy.2018.07.209. [Google Scholar] [CrossRef]
21. Wang, G., Zhang, Q., Li, Y., Mclellan, B. C. (2019). Efficient and equitable allocation of renewable portfolio standards targets among China’s provinces. Energy Policy, 125, 170–180. DOI 10.1016/j.enpol.2018.10.044. [Google Scholar] [CrossRef]
22. Wang, B., Wei, Y. M., Yuan, X. C. (2018). Possible design with equity and responsibility in China’s renewable portfolio standards. Applied Energy, 232(3), 685–694. DOI 10.1016/j.apenergy.2018.09.110. [Google Scholar] [CrossRef]
23. Li, Y. L., Liu, W. Y., Xie, C., Tian, H., Wang, W. Z. (2017). Supply chains game based decision-making method of congested wind power consumption for high-energy load. Automation of Electric Power Systems, 41(7), 135–143. DOI 10.1016/j.ijepes.2017.05.025. [Google Scholar] [CrossRef]
24. Nojavan, S., Zare, K., Mohammadi-Ivatloo, B. (2017). Application of fuel cell and electrolyzer as hydrogen energy storage system in energy management of electricity energy retailer in the presence of the renewable energy sources and plug-in electric vehicles. Energy Conversion and Management, 136(1), 404–417. DOI 10.1016/j.enconman.2017.01.017. [Google Scholar] [CrossRef]
25. Wang, H., Chen, B. B., Zhao, W. H., Liao, K., Bao, X. J. T. (2019). Optimal Decision-making of trans-provincial power transaction subjects under renewable portfolio standard. Power System Technology, 43(6), 1987–1995. [Google Scholar]
26. National Conference of State Legislatures State (2020). Renewable portfolio standards and goal. http://www.ncsl.Org/research/nergy/renewable-portfolio-standards.aspx. [Google Scholar]
27. Ofgem (2021). About the RO. https://www.ofgem.gov.uk/environmental-programmes/ro/about-ro. [Google Scholar]
28. Kydes, A. S. (2007). Impacts of a renewable portfolio generation standard on US energy markets. Energy Policy, 35(2), 809–814. DOI 10.1016/j.enpol.2006.03.002. [Google Scholar] [CrossRef]
29. Chen, Y., Tanaka, M. (2013). Market power in renewable portfolio standards. Energy Economics, 39(3), 187–196. DOI 10.1016/j.eneco.2013.04.007. [Google Scholar] [CrossRef]
30. Bao, X. J. T., Zhao, W. H., Wang, X. M., Tan, Z. F. (2019). Impact of policy mix concerning renewable portfolio standards and emissions trading on electricity market. Renewable Energy, 135(Supplement C), 761–774. DOI 10.1016/j.renene.2018.12.005. [Google Scholar] [CrossRef]
31. Wang, T. F., Wang, H., Leng, Y. J., Zhao, W. H. (2019). Profit model of power retailer considering microgrid group under renewable portfolio standards and energy deviation penalty mechanism. Electric Power Construction, 40(1), 96–103. [Google Scholar]
32. Shin, J., Woo, J., Huh, S. Y., Lee, J., Jeong, G. (2014). Analyzing public preferences and increasing acceptability for the Renewable Portfolio Standard in Korea. Energy Economics, 42(6), 17–26. DOI 10.1016/j.eneco.2013.11.014. [Google Scholar] [CrossRef]
33. Choi, D. G., Park, S. Y., Hong, J. C. (2015). Quantitatively exploring the future of renewable portfolio standard in the Korean electricity sector via a bottom-up energy model. Renewable and Sustainable Energy Reviews, 50, 793–803. DOI 10.1016/j.rser.2015.05.048. [Google Scholar] [CrossRef]
34. Siddiqui, A. S., Tanaka, M., Chen, Y. (2016). Are targets for renewable portfolio standards too low? The impact of market structure on energy policy. European Journal of Operational Research, 250(1), 328–341. DOI 10.1016/j.ejor.2015.10.063. [Google Scholar] [CrossRef]
35. Huang, L., Chen, H. Y., Zhong, J. Y., Liu, Y. M. (2020). Power market system to promote renewable energy consumption. Guangdong Electric Power, 33(2), 10–17. [Google Scholar]
36. Hu, C., Du, S. H., Su, J., Tong, G. Y., Wang, M. Z. (2016). Preliminary research of trading approach and management modes of chinese electricity retail companies under new electricity market reform. Power System Technology, 40(11), 3293–3299. [Google Scholar]
37. Wang, L. Y., Zhang, L. Z., Zhang, F. (2018). Decision-making and risk assessment of purchasing and selling business for electricity retailers. Automation of Electric Power Systems, 42(1), 47–54. [Google Scholar]
38. Luo, S. H., Jiang, C. W., Wang, X. (2019). Power trading strategy and risk assessment of electricity retailing company under power system reform. Power System Technology, 43(3), 944–953. [Google Scholar]
39. Garcia, R. C., González, V., Contreras, J., Custodio, J. E. S. C. (2017). Applying modern portfolio theory for a dynamic energy portfolio allocation in electricity markets. Electric Power Systems Research, 150(1), 11–23. DOI 10.1016/j.epsr.2017.04.026. [Google Scholar] [CrossRef]
40. Feng, Y., Liu, Q. H., Liu, Y., Wang, S. (2017). Design and exploration of renewable portfolio standard in power demand side in China. Automation of Electric Power Systems, 41(24), 137–141. [Google Scholar]
41. Zhang, X., Chen, Z., Ma, Z. M., Xia, Q., Dai, X. J. et al. (2019). Study on the electricity market trading system adapting to the renewable portfolio standard. Power System Technology, 43(8), 2682–2690. [Google Scholar]
42. Zhao, X. G., Feng, T. T., Yang, Y. S. (2014). Impacting mechanism of renewable portfolio standard on China’s power source structure and its effect. Power System Technology, 38(4), 974–979. [Google Scholar]
43. Liu, Q. H., Yuan, H., Yang, Z. L., Fan, H. F., Xu, C. L. (2020). Discussion on compensation ancillary service scheme of green certificates based on renewable portfolio standard. Automation of Electric Power Systems, 44(6), 1–8. [Google Scholar]
44. Jiang, Y. C., Cao, H. X., Yang, L., Fei, F., Li, J. et al. (2020). Mechanism design and impact analysis of renewable portfolio standard. Automation of Electric Power Systems, 44(7), 187–199. [Google Scholar]
45. Li, G. D., Li, G. Y., Zhou, M., Zhang, F. (2019). Analysis on foreign typical market mechanisms for promoting new energy consumptive. Electric Power, 52(2), 46–52. [Google Scholar]
46. Zhang, X., Chen, Y. G., Bai, Y., Liu, W. T., Zhang, Y. et al. (2018). Design on medium-term and long-term electric power market mechanism to promote energy-saving and emission reduction. Guangdong Electric Power, 31(6), 25–31. [Google Scholar]
47. Sun, Y. Q., Ling, J., Qin, Y. H., Chen, N., Zhang, L. et al. (2018). A bidding optimization method for renewable energy cross-regional transaction under green certificate trading mechanism. Renewable Energy Resources, 36(6), 942–948. [Google Scholar]
48. Zhou, X. J., Peng, Q., Yang, R. (2020). Bidding strategy of comprehensive energy selling e-commerce considering transmission congestion under the influence of green power certificate transactions. Power System Technology, 44(4), 1317–1324. [Google Scholar]
49. Zhu, J. Z., Feng, Y. Q., Xie, P. P., Zou, J. (2019). Equilibrium model of Chinese electricity market considering renewable portfolio standard. Automation of Electric Power Systems, 43(1), 168–176. [Google Scholar]
50. Dong, F. G., Shi, L. (2019). Design and simulation of renewable portfolio standard and tradable green certificate mechanism. Automation of Electric Power Systems, 43(12), 113–122. [Google Scholar]
51. Guo, H. Y., Chen, Q. X., Xia, Q., Kang, C. (2020). Modeling strategic behaviors of renewable energy with joint consideration on energy and tradable green certificate markets. IEEE Transactions on Power Systems, 35(3), 1898–1910. DOI 10.1109/TPWRS.2019.2953114. [Google Scholar] [CrossRef]
52. Dai, T., Qiao, W. (2017). Finding equilibria in the pool-based electricity market with strategic wind power producers and network constraints. IEEE Transactions on Power Systems, 32(1), 389–399. DOI 10.1109/TPWRS.2016.2549003. [Google Scholar] [CrossRef]
53. Delikaraoglou, S., Papakonstantinou, A., Ordoudis, C., Pinson, P. (2015). Price-maker wind power producer participating in a joint day-ahead and real-time market. 2015 12th International Conference on the European Energy Market, pp. 1–5. Lisbon, Portugal. [Google Scholar]
54. Dai, T., Qiao, W. (2015). Optimal bidding strategy of a strategic wind power producer in the short-term market. IEEE Transactions on Sustainable Energy, 6(3), 707–719. DOI 10.1109/TSTE.2015.2406322. [Google Scholar] [CrossRef]
55. Baringo, L., Conejo, A. J. (2013). Strategic offering for a wind power producer. IEEE Transactions on Power Systems, 28(4), 4645–4654. DOI 10.1109/TPWRS.2013.2273276. [Google Scholar] [CrossRef]
56. Kazempour, S. J., Zareipour, H. (2014). Equilibria in an oligopolistic market with wind power production. IEEE Transactions on Power Systems, 29(2), 686–697. DOI 10.1109/TPWRS.2013.2286094. [Google Scholar] [CrossRef]
57. Peng, Q., Zhou, X., Yang, R. (2020). Design of coordination and balance mechanism between national green power certificate trading market and provincial day-ahead power market. Power System Technology, 44(7), 2565–2571. [Google Scholar]
58. Xiao, T., Qi, X., Yu, G. (2007). Coordination of supply chain after demand disruptions when retailers compete. International Journal of Production Economics, 109(1–2), 162–179. DOI 10.1016/j.ijpe.2006.11.013. [Google Scholar] [CrossRef]
59. Wu, X., Chen, H., Zhang, J. (2017). Coordinationg a retailer’s dual-channel supply chain under demand and production cost disruptions. Journal of Systems & Management, 26(6), 1151–1157. [Google Scholar]
 | This work is licensed under a Creative Commons Attribution 4.0 International License, which permits unrestricted use, distribution, and reproduction in any medium, provided the original work is properly cited. |