| Energy Engineering |
DOI: 10.32604/EE.2021.014697
ARTICLE
The Relationship between Urbanization and Domestic Energy Consumption: An Empirical Study of Shandong Province, China
1School of Management Science and Engineering, Shandong University of Finance and Economics, Jinan, 250014, China
2National Engineering Laboratory for Reducing Emissions from Coal Combustion, Engineering Research Center of Environmental Thermal Technology of Ministry of Education, Shandong Key Laboratory of Energy Carbon Reduction and Resource Utilization, Research Center for Sustainable Development, School of Energy and Power Engineering, Shandong University, Jinan, 250061, China
3Housing and Urban-Rural Development Institute of Shandong Province, Jinan, 250004, China
4Shandong Academy of Environmental Sciences, Jinan, 250001, China
*Corresponding Author: Doudou Liu. Email: liudoudou@sdufe.edu.cn
Received: 20 October 2020; Accepted: 11 March 2021
Abstract: The rapid development of urbanization has led to a rapid increase in total energy consumption. The proportion of domestic energy consumption to total energy consumption has gradually increased and has become the major driving force for energy consumption. With the pressure from urbanization and domestic energy consumption, it is necessary to study the impact of urbanization on domestic energy consumption of the regional level and to explore the function paths of these two factors. The findings are helpful to realize sustainable development based on the actual situation analysis, horizontal survey data and statistical yearbook panel data. The current situation and changing trends in domestic energy consumption of Shandong Province are systematically examined through field investigation and survey questionnaire. The time-series econometric model is applied to analyze the relationship between urbanization rate and total domestic energy consumption. The research results show that the total domestic energy consumption and urbanization rate of Shandong are generally increasing. The urbanization rate development and domestic energy consumption have a long-term stable and balanced relationship. An increase in urbanization rate can cause an increase in domestic energy consumption. There is a slight difference between the average total energy consumption levels of urban and rural residents, but their energy consumption structures differ a lot. These findings provide basic data support and reference for local governments to formulate energy- conservation and emission-reduction policies.
Keywords: Urbanization; domestic energy consumption; ADF test; cointegration test; Granger causality
With the development of the economy and urbanization, the proportion of citizens’ direct energy consumption continues to expand. In 2009, the direct energy consumption of residents in the United States accounted for 22% of total energy consumption [1]. China’s urbanization process is accelerating with the urbanization rate increasing at an average annual rate of 1.2%, from 17.9% in 1978 to 60.6% in 2019, while the urban population has increased from 172 million to 848 million. Domestic energy consumption is the second largest area of energy consumption of China, with direct domestic energy consumption accounting for about 10% of total energy consumption, gradually increasing in recent years to 12.8% in 2017 and becoming the main growth point in energy consumption. An average increase of 1 percentage point in the rate of urbanization will lead to an increase in energy intensity of between 0.753% and 1.473% for electricity and coal intensity, respectively [2]. While the rapid development of urbanization has led to a swift increase in total energy consumption, the energy consumption structure has evolved slowly [3], thereby putted tremendous pressure on energy supply. However, for a long time, a focus on improving energy efficiency and reducing energy intensity has been placed on industry and the research on residential energy consumption has not been thorough. Urbanization and total energy consumption control are the two major tasks of China’s current development. It is of great practical significance to explore the paths of these two in order to realize sustainable development.
Shandong is a province with large energy consumption. Coal consumption accounts for 80% of primary energy consumption and thermal power generation accounts for 90% of its total installed capacity. The emissions of sulfur dioxide, carbon dioxide, and dust are large, and the need for environmental governance is becoming increasingly severe. The urbanization rate of Shandong’s permanent population increased from 31.90% in 1995 to 61.51% in 2019, with an average annual increase of 1.18%. Urbanization has brought huge energy pressure and it also will inevitably lead to changes in the energy supply and consumption structures. Currently, understanding in depth the impact of urbanization on domestic energy consumption and promoting the green development of new urbanization in a proactive way with the opportunity to realize the conversion of new and old kinetic energy are major issues. Therefore, discussing the changing trend of domestic energy consumption in the process of urbanization, analyzing the impact of urbanization on energy consumption of China, and identifying the spatial path by which urbanization affects energy consumption has important policy values and practical significance for clarifying the development of urbanization and formulating energy-saving policies in the process of urbanization.
Shandong Province ranks second from the perspective of population, but its urbanization rate ranks 11th. Urbanization and the demand for domestic energy consumption will be major long-term problems. Taking direct domestic energy consumption as the research object, this study selects 5 districts and 8 county-level cities in Shandong for field surveys, horizontally analyzes the current status and change trends of domestic energy consumption, and longitudinally analyzes the impact of urbanization on domestic energy consumption using the Shandong Provincial Statistical Yearbook. This paper aims to explore the impact of urbanization on the changing trend of domestic energy consumption and provide a theoretical basis for optimizing the structure of domestic energy consumption.
Urbanization in foreign countries started early and much research on the relationship between urbanization and energy consumption has been carried out. Owing to the rapid increase in China’s urbanization level and the national conditions of a major energy-consuming country, research on the relationship between urbanization and energy consumption has also received extensive attention from the academic community in recent years. Relevant research results cover the correlation between urbanization and energy consumption, the causal relationship between urbanization and energy consumption, and the regional differences in the impact of urbanization on energy consumption.
There is no consensus on whether the impact of urbanization on energy consumption is ultimately reflected in a negative aggregation effect or a positive promotion effect. Regarding the impact of urbanization on domestic energy consumption, the existing literature is mainly developed based on two aspects. The first are empirical analyses of the correlation and causality between urbanization and domestic energy consumption. Wang et al. [4] confirmed that the relationship between urbanization and residential energy consumption varied at different stages. Haouraji et al. [5] found the GDP and urbanization are the predominant variables affecting the three energy sources consumed in residential sector. Sainu et al. [6] empirically studied the temporal, dynamic, and causal relationship between urbanization, energy consumption & emissions, and found that urbanization increased energy consumption and could trigger an energy crisis. The second research aspect is quantitative analysis of the contribution of urbanization to changes in domestic energy consumption. The research of Fan et al. [7] showed that from 1996 to 2012, urbanization contributed 15.4% to the growth in energy consumption of Chinese citizens. Khuong et al. [8] studied the quantitative relationship between urbanization and energy demand and found that urban populations and non-agricultural workers decreased by 0.1% annually and the energy demand of these groups was reduced by 1.4% and 2.6%, respectively.
There are two different views on the correlation between urbanization and energy consumption. One is that energy consumption is positively related to urbanization. Zhao et al. [9] used the LMDI decomposition method to study domestic energy consumption and found that urbanization, rising income levels, and increased ownership of energy consumables all considerably boosted the growth in energy consumption of Chinese urban residents. Wang et al. [10] constructed a fixed-effect panel model and found that the net effect of China’s urbanization on energy consumption was positive. Bilgili’s et al. [11] researches on the impact of urbanization on energy intensity showed that urbanization variables had significant impacts on energy intensity in the short and long term. Sheng et al. [12] used data from 78 countries to study the impact of urbanization on energy efficiency. The results show that the process of urbanization led to substantial increases in actual energy consumption and optimal energy consumption, but utilization efficiency declined. Lv et al. [13] used spatial Durbin modeling and a decomposition method to study the dynamic impact of China’s urbanization on classified energy consumption. The impact of population growth on energy and electricity was significantly positive, whereas its impact on coal consumption was negative. Du et al. [14] found that urbanization had a significant positive impact on vehicle energy consumption and urbanization continuously promoted an increase in total vehicle energy consumption and per capital energy use.
Most studies have shown a positive correlation between energy consumption and urbanization, while the other view is that energy consumption is negatively related to urbanization. Ewing et al. [15] found that urbanization had a negative impact on energy consumption. Xiao [16] used the spatial Dubin panel-data model and found that every 1% increase in the level of urbanization reduced energy consumption by 0.089%. Based on panel data from 30 provinces in China, Wang [17] found that energy consumption was more efficient under the effect of economies of scale and urbanization reduced energy consumption demand.
Regarding the causal relationship between urbanization and energy consumption, most scholars believe that urbanization is the Granger cause of energy consumption growth [18–20]. Some scholars have also found that some cities have an one-way Granger causality from urbanization to energy consumption, while other cities have an one-way Granger causality from energy consumption to urbanization [21].
The regional differences in the impact of urbanization on energy consumption have also been explored by many researchers. Lenzen et al. [22] explored the impact of urbanization on energy consumption of Australia, Brazil, Denmark, India, and Japan. Al-Mulali et al. [23] analyzed the relationship between energy consumption, carbon dioxide, and urbanization in the Middle East and North Africa. Cheng et al. [24] believed that the impact of urbanization on energy consumption in eastern, central, and western China showed a gradual decrease. Zhang et al. [25] noted that urbanization in the backward areas of western China reduced energy consumption, whereas urbanization in the central and eastern regions increased energy consumption. Ding [26] believed that the impact of urbanization on areas with low energy consumption intensity was not significant, but the impact on areas with high energy consumption intensity was very obvious.
After analyzing the domestic and foreign literature and related research results, the current research mainly focuses on the relationship between urbanization, and total energy consumption and uses macro-national statistical data as the object of analysis. Analysis of micro-survey data and meticulous research on the relationship between urbanization and domestic energy consumption is lacking. Given the differences in time frame and regions, research conclusions on the correlation and causality between urbanization and energy consumption are inconsistent. Although foreign scholars have carried out comparative analyses of energy consumption in the process of urbanization in developed and developing countries, there are few studies on the impact of urbanization on domestic energy consumption. There are huge differences in the levels of urbanization in different regions of China and the energy consumption situation caused by these differences may also be different. Therefore, this study takes Shandong Province as the research object, analyzes the relationship between urbanization and domestic energy consumption at the regional level according to field survey data, and provides a decision-making reference tolocal authorities to formulate energy and energy-conservation policies.
3.1 Time-Series Econometric Model
To explore the relationship between the level of urbanization and the total consumption of domestic energy, this study uses a time-series econometric model to conduct an empirical analysis of the equilibrium relationship and causality between urbanization and domestic energy consumption in Shandong Province. The modeling process is shown in Fig. 1. Initially, the ADF unit root test is used to test the data stationarity and the urbanization rate and domestic energy consumption are non-stationary series. Next, the Johansen method is used to test the cointegration of these two variables. Finally, Granger causality is used to test the existence of one-way Granger causality between urbanization and domestic energy consumption.
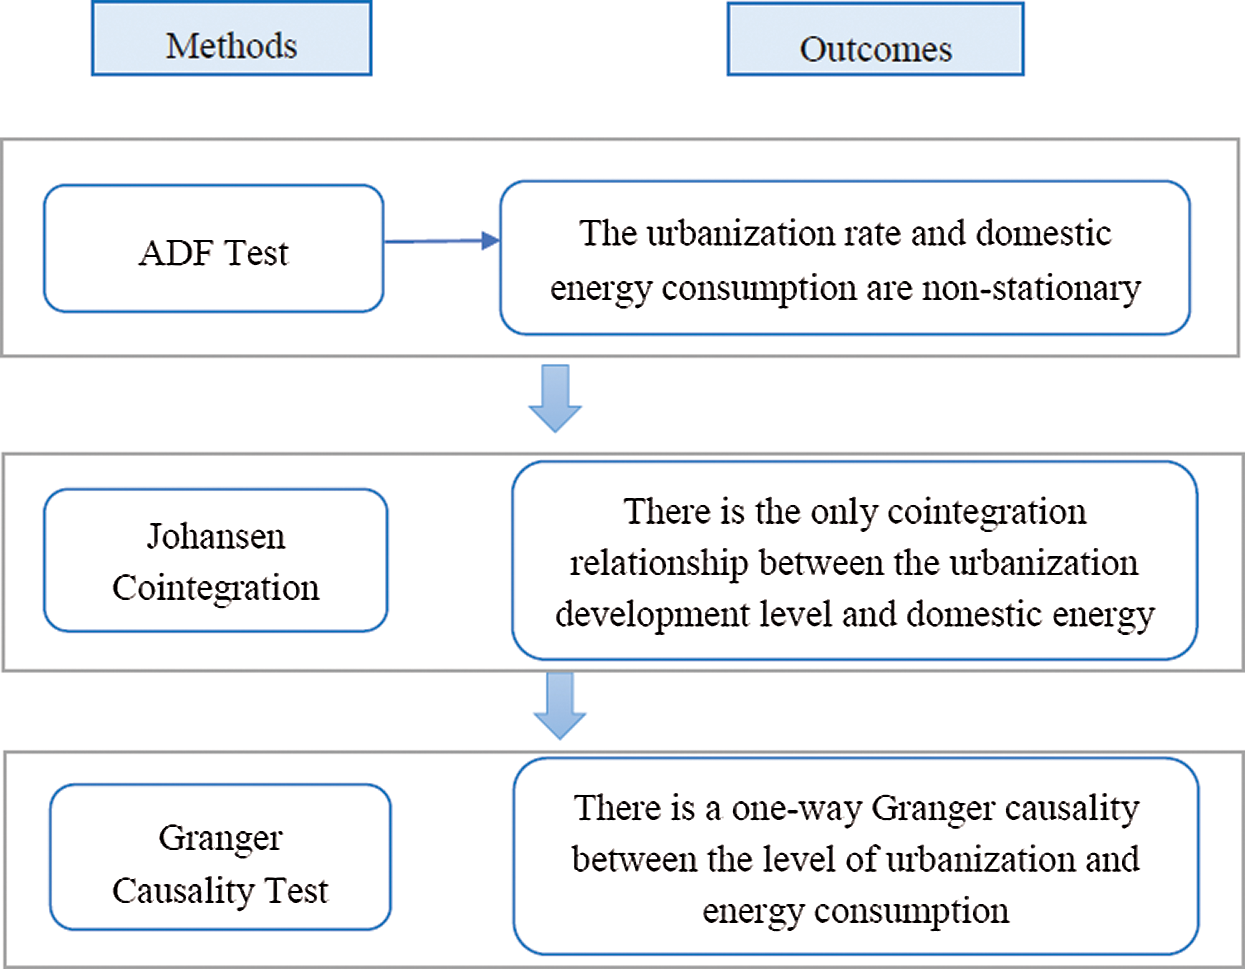
Figure 1: Time-series econometric model of the relationship between urbanization and domestic energy consumption
The ADF test was proposed by Dicky et al. [27]. It is achieved through the following three models:
Model 1:
Model 2:
Model 3:
T in Model 3 is a time variable and the null hypothesis is H0:
The test starts with Model 3, followed by Model 2, and then Model 1. Under the established significance level, if t statistics > critical value, then H0 holds, that is, the time series is a unit root process I (1); otherwise, the test rejects H0 and considers the time series to be a stationary process I (0) [28,29].
3.1.2 Johansen Cointegration Test
If the time series is a unit root process, then a cointegration test can be performed. The Johansen cointegration test is a test method for multivariate analysis [30]. The basic idea is as follows:
The k-order vector yt and d-order vector xt are unit root processes that construct the following VAR model:
where
where λ is the eigenvalue, T is the total number of samples and k is the total number of variables. If the trace test or the maximum eigenvalue test is less than the critical value under the established significance level, then the null hypothesis is accepted, that is, there is no cointegration relationship between the variables; otherwise, the null hypothesis is rejected, that is, there is at least one cointegration relationship between the variables.
For two variables Y and X, the Granger causality test requires an estimation of the following regression model:
The Granger test is completed by the restricted F test [31]. For example, for the assumption that the parameters before the lag term X in Eq. (7) are 0 as a whole, regressions with and without the lag term X are performed, recording the residual sum of squares of the former as RSSu and the residual sum of squares of the latter as RSSR. The calculation of F statistics is as follows:
where m is the number of lags of X, n is the sample size, and k is the number of parameters of the unconstrained regression model to be estimated, including possible constant terms and other variables.
If the calculated value of F is greater than the corresponding critical value of the distribution of F under the given significance level
The data of this study are mainly sourced from a survey questionnaire and statistical yearbook.
According to the Provincial Capital, the Jiaodong and Lunan economic circles were proposed in the implementation plan for implementing the views of the CPC Central Committee and the State Council on establishing a more effective new mechanism for the coordinated development of Shandong Province. In 2016, field surveys were conducted in five districts and cities, including Jinan of the Provincial Capital economic circle, Qingdao and Weifang of the Jiaodong economic circle, Jiningand Heze of the Lunan economic circle and eight counties (cities), Zhangqiu, Jimo, Jiaozhou, Shouguang, Zhucheng, Zoucheng, Qufu and Yuncheng. Representative cities with high, general, and low urbanization levels are selected as the survey sites, which are shown in Fig. 2. The respondents are selected randomly. The questionnaires are distributed and collected face-to-face. A total of 6 research teams with 3 persons in each group were sent out for 10 days and 5200 questionnaires were distributed, of which 2600 were distributed in urban areas and 2600 in rural areas. The questionnaire response rate was 100%. After the validity of each questionnaire was verified and invalid questionnaires were excluded, 4617 valid questionnaires (effective rate of 88.79%) were finally obtained, including 2316 from urban areas (89.08%) and 2,301 from rural areas (88.50%). The types of domestic energy consumption involved in the field investigation included coal, pipeline natural gas, canned liquefied petroleum gas, electricity, heat, fuel oil, firewood, straw and biogas.
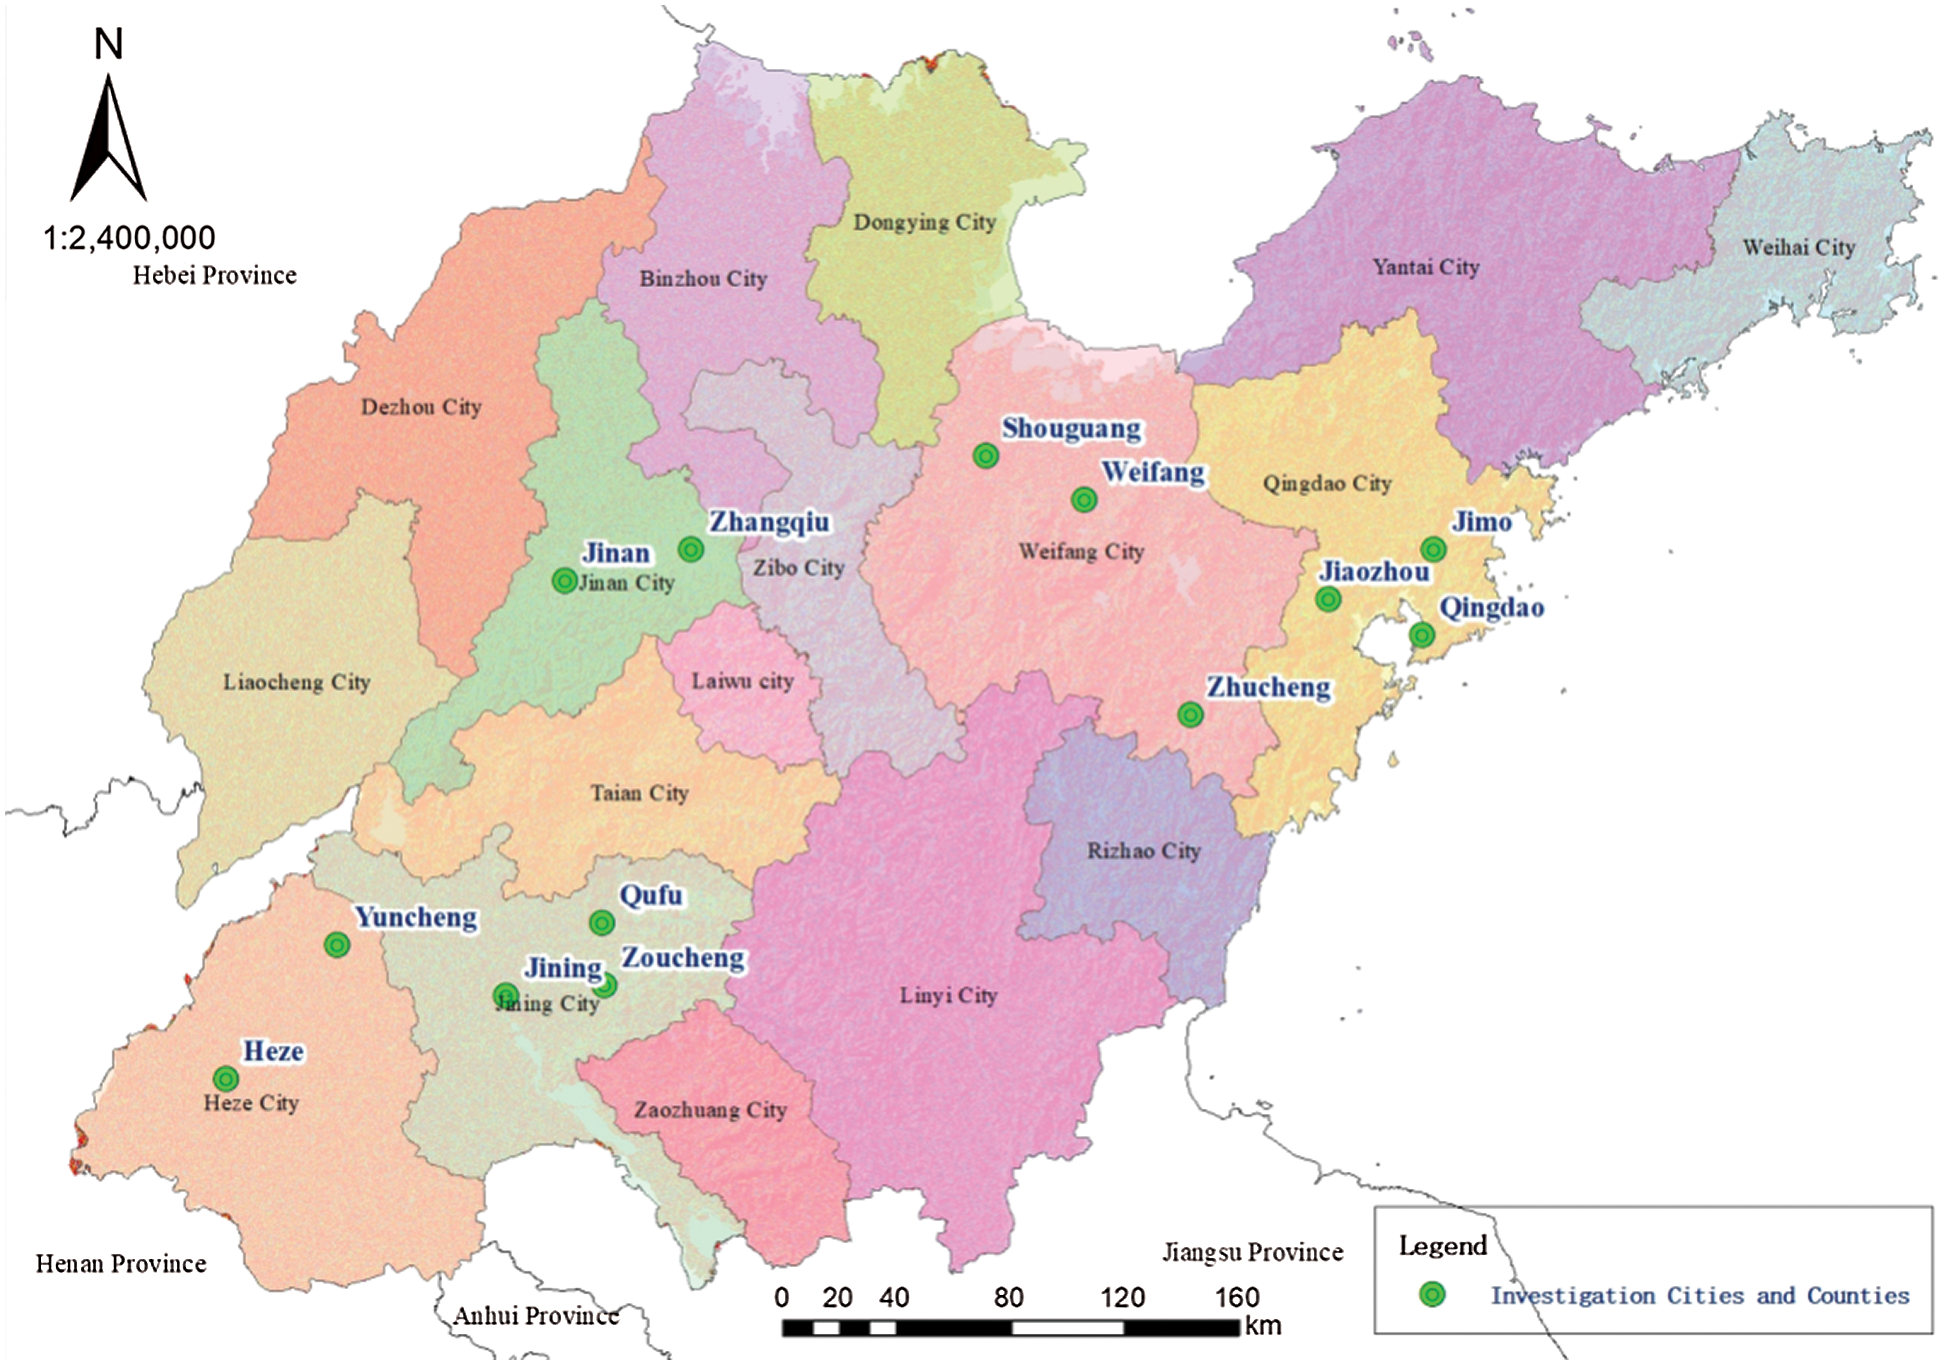
Figure 2: Distribution of survey sites
The statistical yearbook data mainly come from the Shandong Statistical Yearbook. The composition of energy consumption of the statistical yearbook mainly includes coal, gasoline, liquefied petroleum gas and electricity.
4.1 Current Status of Energy Consumption in Shandong Province
4.1.1 Domestic Energy Consumption of Urban and Rural Residents
According to the survey statistics, the total energy consumption per capita of urban residents is 380.22 kg of standard coal, while that of rural residents is 367.97 kg of standard coal. The total energy consumption per capita of urban residents is 12.25 kg of standard coal higher than that of rural residents.
From the perspective of per capita consumption of various energy types (Fig. 3), the per capita energy consumption of urban residents ranked from high to low is heat, gasoline, electricity, natural gas, coal and liquefied petroleum gas, corresponding to 124.04, 110.66, 53.12, 41.41, 36.99 and 14.01 kg of standard coal, respectively. With the improvement in urban residents’ living standards, the use of straw and firewood (mainly firewood) in cities has disappeared. The per capita energy consumption of rural residents ranked from high to low is coal, gasoline, electricity, straw and firewood, liquefied petroleum gas, heat, natural gas, and biogas, corresponding to 164.03, 68.89, 44.62, 35.35, 23.55, 21.13, 9.93, and 0.47 kg of standard coal, respectively. Urban residents have higher per capita consumption of electricity, natural gas, heat, and gasoline than rural residents, especially heat and gasoline. Winter heating and private cars have become the main forms of energy consumption in large households of urban residents. However, in terms of coal, straw, firewood, liquefied petroleum gas and biogas, rural residents have higher consumption than urban residents, especially coal products, straw and firewood. In winter, coal-fired heating is a major energy consumer for rural residents.
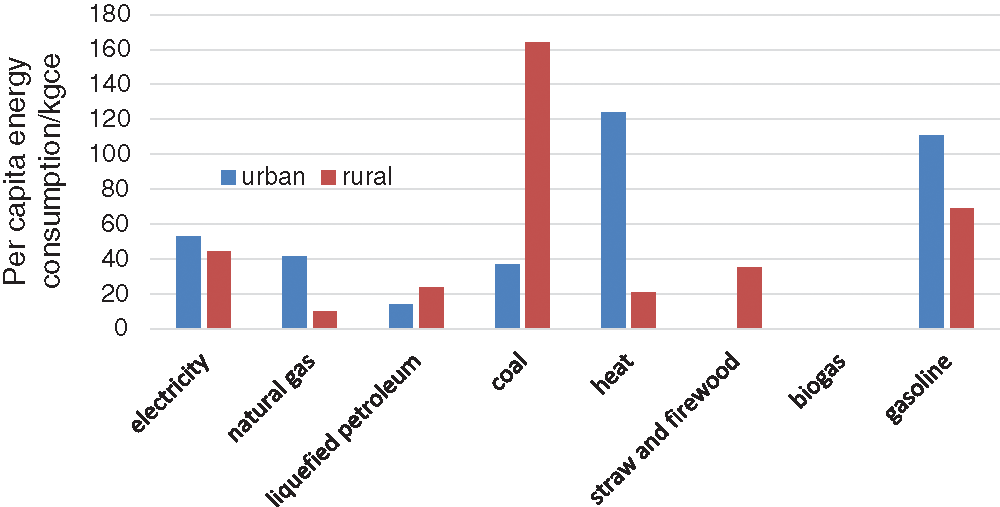
Figure 3: Comparison of per capita energy consumption in urban and rural areas
4.1.2 Types of Energy Consumption of Urban and Rural Residents
Through the analysis of residential energy types of the surveyed areas, electric energy is found to be the most necessary energy for both urban residents and rural households, with a utilization rate of 100%. In terms of cooking energy, urban residents mainly use natural gas and some liquefied petroleum gas, while rural residents use liquefied petroleum gas, natural gas, and coal as the main cooking fuels. Liquefied petroleum gas is the most important cooking fuel to rural residents. The proportion of urban residents that use clean energy (natural gas, liquefied petroleum gas and electricity; 97.97%) is 1.39 times the proportion of rural residents who use clean energy (natural gas, liquefied petroleum gas, electricity and biogas; 70.23%).
In terms of heating methods in winter, urban residents mainly use central heating, accounting for 79.92% of the survey samples, while rural residents mainly use coal-fired heating stoves, accounting for 68.80%. At the same time, 14.81% of urban residents use coal-fired heating stoves in winter and 15.21% of rural residents use central heating. Electric heating is used to some extent in both urban and rural areas, accounting for 4.23% and 10.60%, respectively.
In terms of domestic hot water, urban residents use solar energy and electric water heaters, accounting for 94.52%, while rural residents use solar energy and coal-fired stoves, accounting for 83.22%.
In terms of transportation mode, electric bicycles, private cars and buses are the main modes for urban residents, accounting for 90.93%, while, the daily travel of rural residents mainly includes electric bicycles, private cars and motorcycles, accounting for 81.61%. The proportion of rural residents that use electric bicycles to travel is nearly 9% higher than that of urban residents, while the proportion of urban residents that use private cars to travel is 7% higher than that of rural residents. Car ownership per 100 households among urban residents are 1.56 times than among rural residents. Urban residents also rate higher than rural residents in terms of average vehicle exhaust and annual average mileage. Due to the universality and convenience of urban buses, the proportion of urban residents that use buses to travel is 2.13 times that of rural residents. As for the motorcycle travel mode, the proportion of rural residents is 9 times that of urban residents.
4.1.3 Residential Energy Consumption Structure of Urban and Rural Residents
In terms of the energy consumption structure of urban residents, heating in winter is the largest energy consumption, accounting for 32.62% of total per capita domestic energy consumption, while gasoline and electricity consumption rank second (29.11%) and third (13.97%), respectively. Following close behind are natural gas (10.89%) and coal (9.73%). Note that although natural gas and central heating have been popularized in urban areas, coal consumption still accounts for a certain proportion of total energy consumption. In this proportion, the contribution rate of coal consumed by coal-fired heating stoves is 91.00% and that of cooking coal is 9.00%. Given the popularity and price advantage of natural gas in urban areas, the use of liquefied petroleum gas has decreased and its per capita consumption only accounts for 3.68% of total per capita energy consumption.
In the energy consumption structure of rural residents, coal is the largest energy consumption. Per capita coal consumption accounts for 44.58% of total per capita domestic energy consumption, of which per capita coal consumption for domestic heating accounts for 36.54% and the remaining 8.03% is coal consumed for cooking. Gasoline consumption ranks second, with per capita gasoline consumption accounting for 18.72% of total domestic energy consumption. Electricity consumption ranks third, accounting for 12.13%. Following close behind are straw and firewood and liquefied petroleum gas, which respectively account for 9.61% and 6.40% of total domestic energy consumption. Heating consumption accounts for 5.74% of total domestic energy consumption. In rural survey areas, biogas is not widely used.
From the perspective of the difference in energy consumption structure between urban and rural residents, heat, gasoline, electricity and natural gas are important components of urban residents’ energy consumption, although, coal cannot be ignored in the composition of urban residents’ energy consumption. The energy consumption structure of rural residents mainly includes coal, gasoline and electricity, supplemented by traditional biomass energy (straw and firewood) and liquefied petroleum gas. Traditional fuels such as coal, firewood, and straw still account for a large proportion of rural household energy use. According to the survey, the reasons that rural residents use more coal, firewood and straw are as follows. First, the price of coal is low, and local firewood and straw are easy to obtain and do not need to be purchased. Second, the rural residents are elderly people who prefer to use traditional energy because of their long-term use of coal, firewood, and straw.
4.1.4 Analysis of Relationship between Urbanization Rate and Domestic Energy Consumption in Surveyed Cities
In 2016, the urbanization rates of Jinan, Qingdao, Weifang, Jining, and Heze were 69.46%, 71.53%, 58.15%, 55.25%, and 47.36%, respectively, and their per capita domestic energy consumption was 328.9, 368.6, 423.91, 405.85, and 309.91 kg of standard coal, respectively. The results show that: the per capita energy consumption of Jinan and Qingdao with high urbanization rates is lower than those of Weifang and Jining with medium urbanization rates, and the per capita energy consumption of Heze with a low urbanization rate is the lowest. It can be seen that in the early stages of urbanization, domestic energy consumption increases with the urbanization rate, while in the middle and late stages of urbanization, due to the emphasis on efficient use of energy and the improvement of urbanization quality, the impact of urbanization on domestic energy consumption is negative [32].
4.2 Change Trend in Domestic Energy Consumption
4.2.1 Change Trend in Domestic Energy Consumption Amount
Along with the continuous improvement in people’s living standards, their total energy consumption has increased rapidly, from 3,846,100 tons of standard coal in 1995 to 25,411,100 tons of standard coal in 2016, with an average annual growth rate of 9.41%. At the same time, total energy consumption has increased from 99.39 million tons of standard coal in 1995 to 387.23 million tons of standard coal in 2016, with an average annual growth rate of 6.69%. The growth rate of domestic energy consumption has exceeded that of total energy consumption. However, the proportion of domestic energy consumption of Shandong Province has increased from 3.87% in 1995 to 6.56% in 2016, with an average annual increase of 2.54%. The growth rate of domestic energy consumption is not fast.
4.2.2 Change Trend in Types of Domestic Energy Consumption
Fig. 4 shows that the consumption of coal in Shandong’s domestic energy consumption showed a fluctuating upward trend increasing from 3.376 million tons in 1995 to 6.574 million tons in 2016, with an average annual increase of 152,200 tons. Gasoline consumption showed a rapid increase, from 158,100 tons in 1995 to 4.613 million tons in 2016, a 28-fold increase. The number of family cars owned by urban and rural residents in Shandong Province has also grown rapidly. The number of family cars owned by urban residents has increased from 4.47 cars per 100 households in 2005 to 55.60 cars per 100 households in 2016, an increase of 11.4 times. The number of rural residents’ family cars has increased from 1.07 vehicles/100 households in 2005 to 29.40 vehicles/100 households in 2016, an increase of 26.5 times. The rapid growth in private car ownership has driven the rapid growth in household gasoline consumption. Liquefied petroleum gas shows a trend of first increasing, then decreasing, and then increasing again. From 1995 to 2010, the consumption of liquefied petroleum gas increased from 130,900 tons to 1,330,400 tons, with an average annual increase of 80,000 tons; after 2010, it began to decrease and fell to 410,000 tons in 2014, a decrease of 920,400 tons in four years. It began to increase again from 2015 and increased to 498,000 tons in 2016. Electricity consumption has also shown an increasing trend, from 7.954 billion kWh in 1995 to 55.44 billion kWh in 2016, with an average annual increase of 2.261 billion kWh. Moreover, consumption has increased nearly 6 times in 20 years. The popularization of various household appliances and vehicles, such as battery-powered vehicles, has led to a rapid increase in domestic electricity consumption [33].
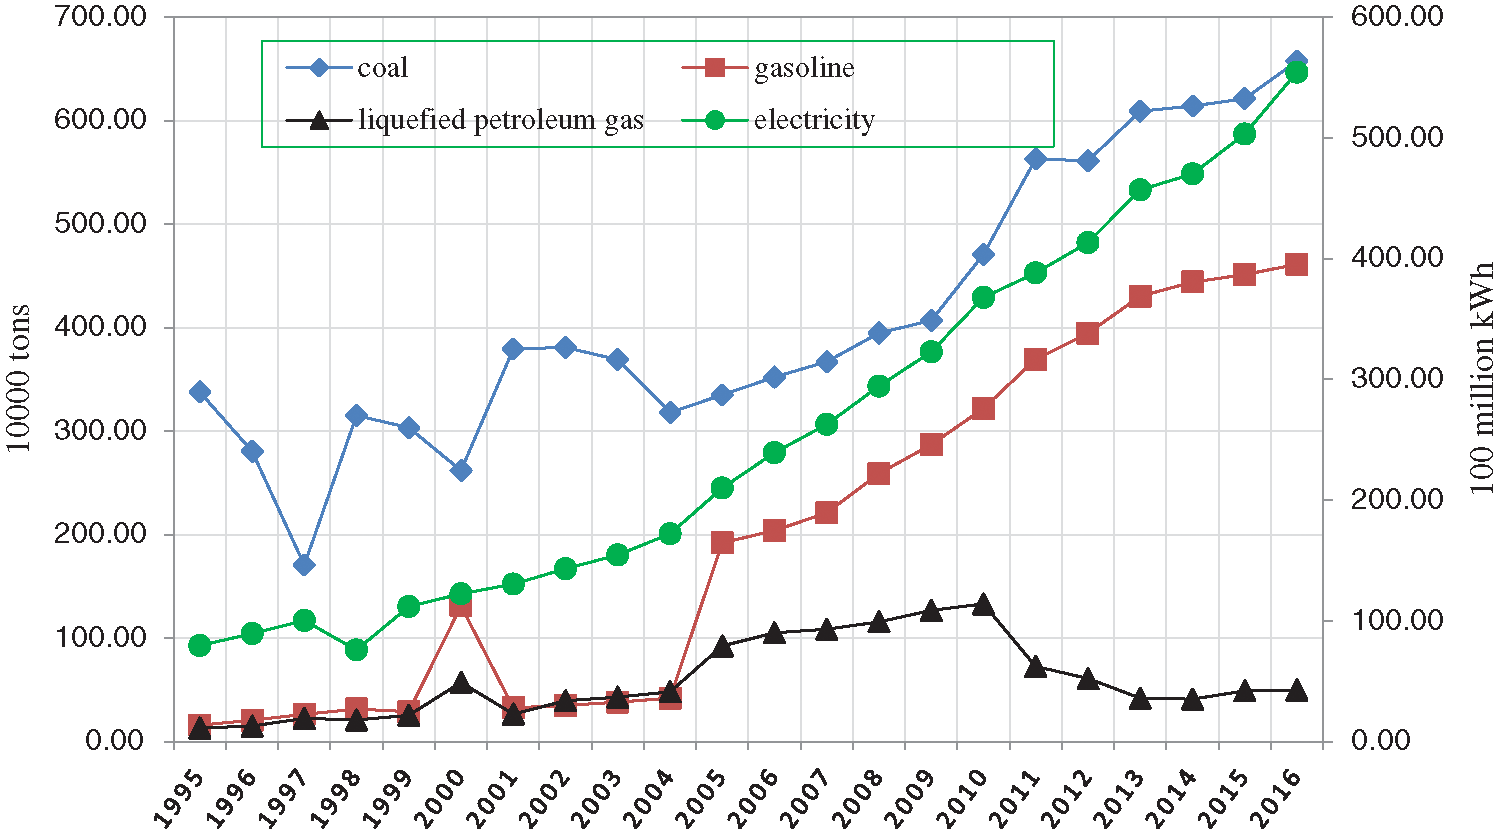
Figure 4: Change trend in domestic energy consumption and the types
4.2.3 Change Trend in Structure of Domestic Energy Consumption
In order to compare different types of energy, this study converts the consumption of coal, gasoline, liquefied petroleum gas, and electricity into the equivalents of standard coal.
From the perspective of changes in the proportion of various energy sources in total domestic energy consumption of Shandong Province, from 1995 to 2016, the percentage of coal in total domestic energy consumption fell from 62.71% to 24.52%, with an average annual decrease of 4.37%. The proportions of gasoline and liquefied petroleum gas increased from 6.05% in 1995 to 37.54% in 2014 and then decreased to 35.44% in 2016. The proportion of liquefied petroleum gas increased from 5.83% in 1995 to 17.55% in 2006 and then decreased to 4.46% in 2016. The proportion of electricity rose from 25.41% in 1995 to 35.58% in 2016, with an average annual growth rate of 1.62%.
From the perspective of change in energy consumption structure, in 1995, coal and electricity occupied the main positions in energy consumption, accounting for 62.71% and 25.41%, respectively; in 2016 electricity and gasoline were the main types of energy used in daily life, accounting for 35.58% and 35.44%, respectively. The energy consumption of residents in Shandong Province has gradually broken the traditional pattern of coal-based consumption and is shifting toward high efficiency and cleaner energy. The structure of domestic energy consumption has shown the growth trends of petrochemical and electric power.
4.3 Relationship between Urbanization and Domestic Energy Consumption
From 1995 to 2016, the total domestic energy consumption and urbanization rate of the permanent population of Shandong showed overall increasing trends. The total consumption of domestic energy increased from 3.8461 million tons of standard coal in 1995 to 25.411 million tons of standard coal in 2016, a total increase of 21.5649 million tons of standard coal and an average annual increase of 1.0269 million tons of standard coal. The urbanization rate of the permanent population increased from 31.90% in 1995 to 59.02% in 2016, an increase of 27.12% and an average annual increase of 2.97% (Fig. 5). According to preliminary calculations, for every 1% increase in the urbanization rate of the province, the consumption of domestic energy will increase by 795,200 tons of standard coal. From 2005 to 2010, domestic energy consumption increased rapidly; In 2005, the energy consumption even doubled compared with that in 2004.
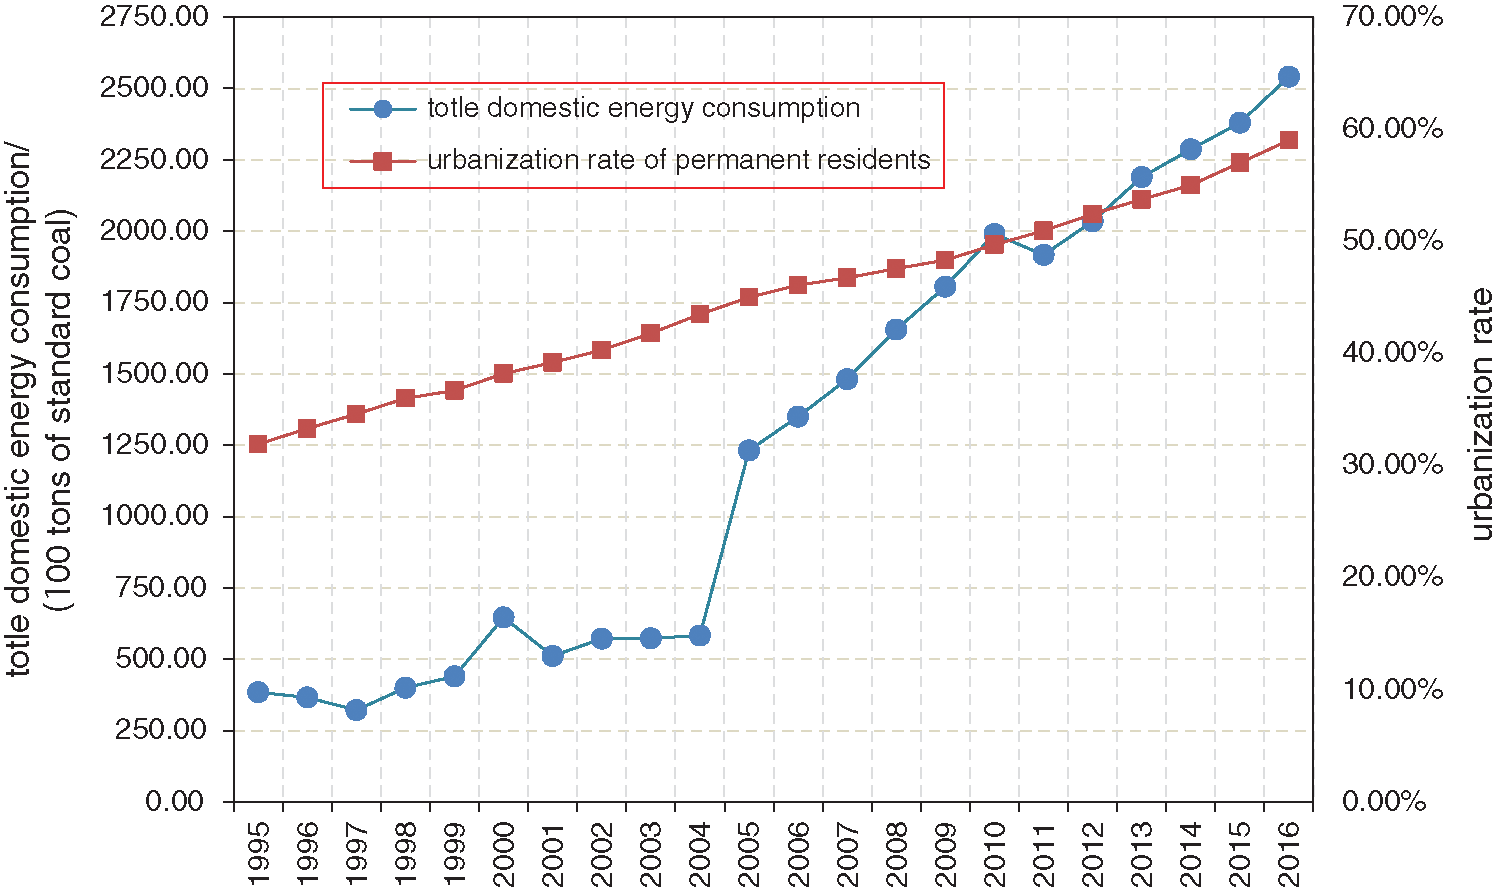
Figure 5: Total domestic energy consumption and trend of urbanization rate
4.4 Cointegration Test Analysis of Urbanization Rate and Total Domestic Energy Consumption
The ADF unit root method is used to test the stability of variables, the optimal lag order is determined by the AIC minimum criterion, and the ADF test is realized by EViews [34]. The test results are shown in Tab. 1.
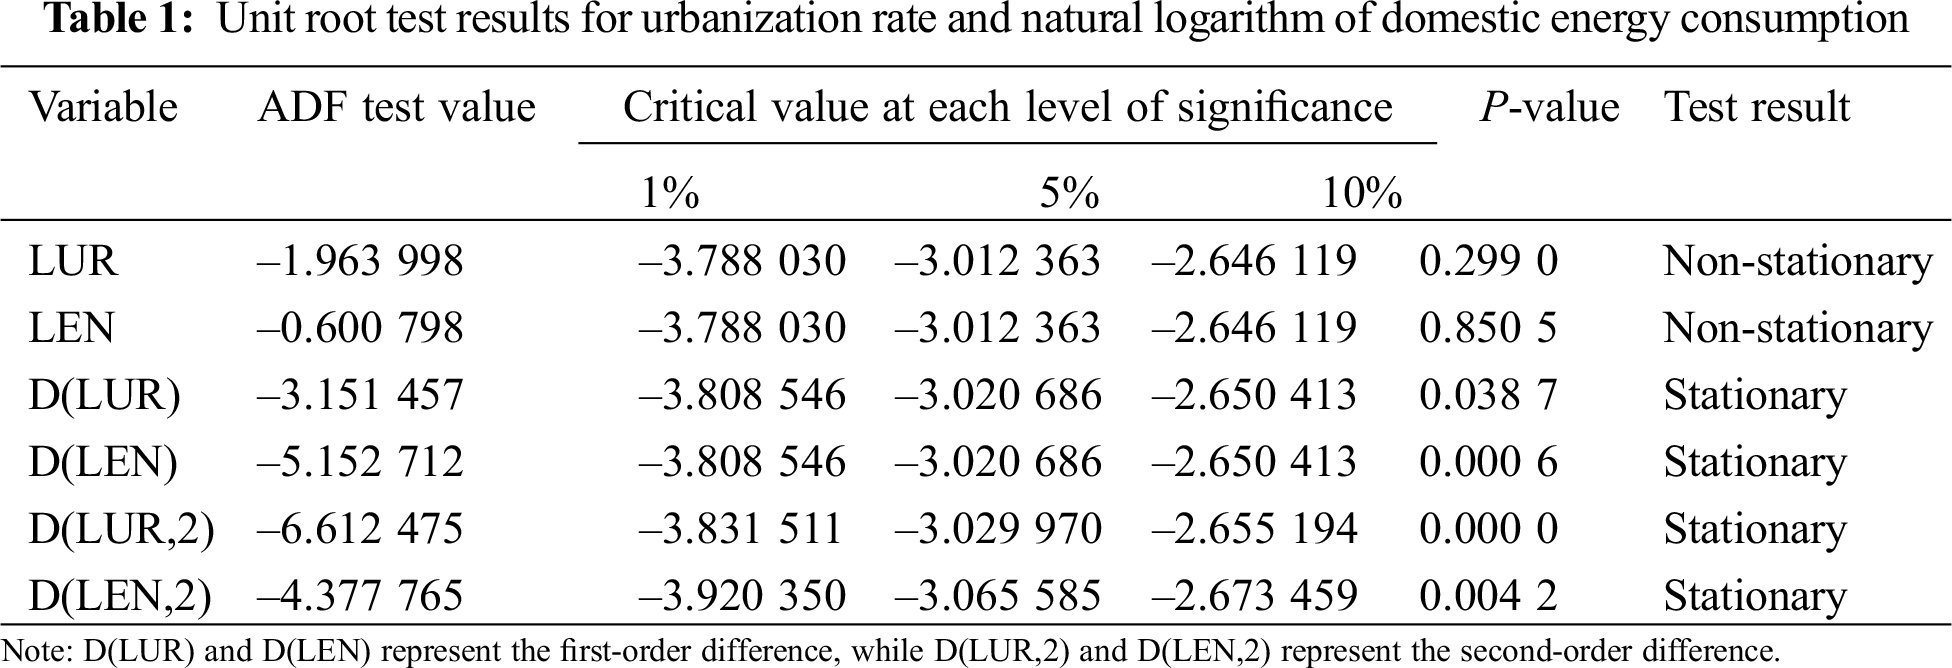
The results of the ADF test (Tab. 1) show that the time series of urbanization rate and domestic energy consumption in Shandong Province from 1995 to 2016 have unit roots under the significance level of 10%, that is, the original time series of urbanization rate and domestic energy consumption are non-stationary. The first-order difference series D(LUR) and D(LEN) both reject the unit root hypothesis at the 10% significance level. Therefore, the LUR and LEN time series can be considered first-order single-integer series, denoted I(1), which meet the requirements of the cointegration test.
The following uses Johansen’s method for the cointegration test. Before the cointegration test, according to the likelihood ratio (LR) test method, the AIC standard, and the SC standard, the optimal lag order is determined to be 1. The Johansen test results are shown in Tab. 2.
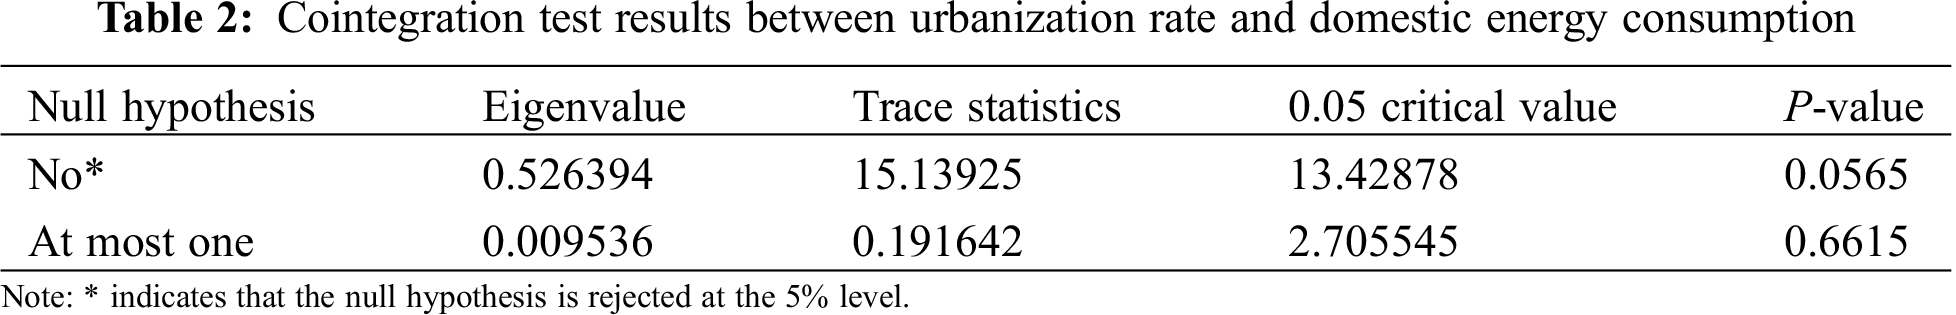
The results of the cointegration test reveal that at a significance level of 10%, there is the only cointegration relationship between urbanization rate and domestic energy consumption in Shandong. Specifically, from 1995 to 2016 a long-term and stable equilibrium relationship existed between urbanization rate and domestic energy consumption in Shandong. A cointegration relationship between variables can only indicate that there is a long-term causal relationship between variables, but cannot determine the direction of the causal relationship. Therefore, the following is a causality test on the urbanization rate and domestic energy consumption.
4.5 Granger Causality Test Analysis of Urbanization Rate and Total Domestic Energy Consumption
The Granger causality test is an analysis method to judge whether a causal relationship exists between two variables. The results of the Granger causality test for LUR and LEN are shown in Tab. 3.
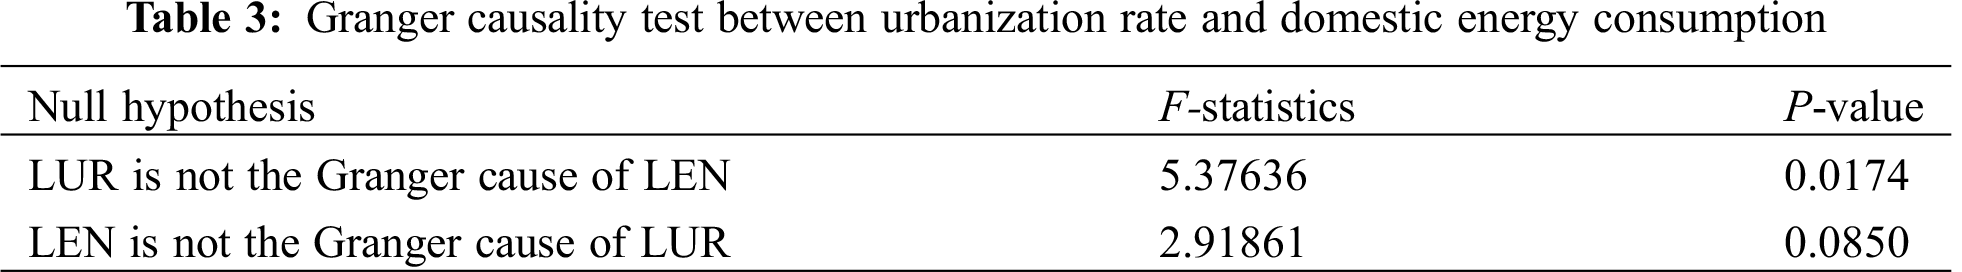
From the Granger causality test, it can be seen that LUR is the Granger cause of LEN, while LEN is not the Granger cause of LUR, that is, the urbanization rate is the cause of the increase in domestic energy consumption, but the increase in domestic energy consumption does not contribute to urbanization. This result shows that there is an one-way Granger causality between urbanization rate and energy consumption in Shandong Province. An increase in urbanization rate can promote an increase in domestic energy consumption, but an increase in domestic energy consumption cannot promote an increase of urbanization rate.
Urban and rural residents differ in their choice of domestic energy types. There is slight difference between the average total energy consumption of urban and rural residents, and electricity is an essential energy source for all households. The proportion of urban residents that use clean energy is 1.39 times that of rural residents. In terms of heating method, urban residents mainly use central heating, while rural residents mainly use coal-fired heating stoves. Heating energy consumption is the largest energy consumption for both urban and rural residents, followed by gasoline and electricity. The rural energy consumption structure needs to be further optimized.
The total domestic energy consumption and urbanization rate of the permanent population of Shandong are both significantly increasing. As the urbanization rate increases by 1%, the domestic energy consumption increases by approximately 795,200 tons of standard coal. The cointegration test analysis indicates that at a significance level of 10%, the only cointegration relationship exists between urbanization rate and domestic energy consumption in Shandong. There is a long-term and stable equilibrium relationship between urbanization rate and domestic energy consumption.
From the Granger causality test, it can be seen that urbanization is the cause of the increase in domestic energy consumption, but the increase in domestic energy consumption does not contribute to urbanization. There is an one-way Granger causality between urbanization rate and domestic energy consumption in Shandong Province. Among the factors affecting domestic energy consumption, the contribution of urbanization and the change in residents’ consumption structure are increasing. In the early stage of urbanization, due to the improvement in urban living standards and the increase in energy consumption demand, the domestic energy consumption increases significantly with the increase in urbanization rate. By the middle stage of urbanization, the domestic energy consumption gradually reaches its peak and tends to become stable. In the late stage of urbanization, because of the aggregation effect and the adjustment of the energy consumption structure, the domestic energy consumption decreases with the increase of urbanization rate.
Based on the above research results, the following suggestions are proposed to reduce the impact of urbanization on energy consumption and promote energy conservation, First, the energy supply structure should be optimized through energy supply-side reform. Increase the utilization of new energy, and build a diversified energy supply system. Improve the construction of urban heating network facilities and explore possible central heating in town centers of rural areas.Vigorously promote the construction of charging infrastructure, with family charging piles as the main body and public charging facilities as the auxiliary, to form an electric vehicle charging infrastructure system. Promote the use of solar heating, promote centralized hot water projects in industries, businesses and public services and carry out solar heating pilot projects. Second, the relevant energy policies should also vary with time and local conditions, and local governments should be encouraged to formulate energy policies with regional characteristics. For regions with high urbanization level, give full play to the agglomeration effect and encourage the use of clean energy and efficient energy through fiscal subsidies, tax relief and other policies. For areas with low urbanization levels, it is necessary to plan first, optimize urban planning and urban transportation planning, and provide infrastructure guarantees for new energy supply and application. The findings can be useful reference to policy makers.
Funding Statement: This research was funded by Natural Science Foundation of China (71974116), Shandong Natural Science Foundation (2019MG009), and Shandong Provincial Social Science Planning Research Project (20CGLJ13).
Conflicts of Interest: The authors declare no conflicts of interest.
1. Min, J., Hausfather, Z., Lin, Q. F. (2010). A high-resolution statistical model of residential energy end use characteristics for the United States. Journal of Industrial Ecology, 14(5), 791–807. DOI 10.1111/j.1530-9290.2010.00279.x. [Google Scholar] [CrossRef]
2. Elliott, R. J. R., Sun, P. Y., Zhu, T. (2017). The direct and indirect effect of urbanization on energy intensity: A province-level study for China. Energy, 123, 677–692. DOI 10.1016/j.energy.2017.01.143. [Google Scholar] [CrossRef]
3. Zhang, L., Huang, Y. X. (2010). Energy consumption for China’s modern urbanization. China Population, Resources and Environment, 20(1), 25–30. [Google Scholar]
4. Wang, Q. R., Yang, X. M. (2019). Urbanization impact on residential energy consumption in China: The roles of income, urbanization level, and urban density. Environmental Science and Pollution Research, 26(4), 3542–3555. DOI 10.1007/s11356-018-3863-4. [Google Scholar] [CrossRef]
5. Haouraji, C., Mounir, B., Mounir, I., Farchi, A. (2020). A correlative approach, combining energy consumption, urbanization and GDP, for modeling and forecasting Morocco’s residential energy consumption. International Journal of Energy and Environmental Engineering, 11(1), 163–176. DOI 10.1007/s40095-020-00336-2. [Google Scholar] [CrossRef]
6. Franco, S., Mandla, V. R., Rao, K. R. M. (2017). Urbanization, energy consumption and emissions in the Indian context A review. Renewable and Sustainable Energy Reviews, 71(3), 898–907. DOI 10.1016/j.rser.2016.12.117. [Google Scholar] [CrossRef]
7. Fan, J. L., Zhang, Y. J., Wang, B. (2017). The impact of urbanization on residential energy consumption in China: An MARK aggregated and disaggregated analysis. Renewable and Sustainable Energy Reviews, 75(Supplement 3), 220–233. DOI 10.1016/j.rser.2016.10.066. [Google Scholar] [CrossRef]
8. Khuong, P., McKenna, R., Fichtner, W. (2019). Multi-level decomposition of ASEAN urbanization effects on energy. International Journal of Energy Sector Management, 13(4), 1107–1132. DOI 10.1108/IJESM-12-2018-0002. [Google Scholar] [CrossRef]
9. Zhao, X. L., Li, N., Ma, C. B. (2012). Residential enenrgy consumption in urban China: A decomposition analysis. Energy Policy, 41(9), 644–653. DOI 10.1016/j.enpol.2011.11.027. [Google Scholar] [CrossRef]
10. Wang, L., Wei, H. K. (2014). The impacts of Chinese urbanization on energy consumption. Resources Science, 36(6), 1235–1243. [Google Scholar]
11. Bilgili, F., Kocak, E., Bulut, U., Kuloglu, A. (2017). The impact of urbanization on energy intensity: Panel data evidence considering cross-sectional dependence and heterogeneity. Energy, 133(9), 242–256. DOI 10.1016/j.energy.2017.05.121. [Google Scholar] [CrossRef]
12. Sheng, P. F., He, Y. P., Guo, X. H. (2019). The impact of urbanization on energy consumption and efficiency. Energy Policy, 132(1), 309–317. DOI 10.1016/j.enpol.2019.05.050. [Google Scholar] [CrossRef]
13. Lv, Y. L., Chen, W., Cheng, J. Q. (2019). Modelling dynamic impacts of urbanization on disaggregated energy consumption in China: A spatial Durbin modelling and decomposition approach. Energy Policy, 133(1), 110841. DOI 10.1016/j.enpol.2019.06.049. [Google Scholar] [CrossRef]
14. Du, Z. L., Lin, B. Q. (2019). Changes in automobile energy consumption during urbanization: Evidence from 279 cities in China. Energy Policy, 132(1), 309–317. DOI 10.1016/j.enpol.2019.05.050. [Google Scholar] [CrossRef]
15. Ewing, R., Rong, F. (2008). The impact of urban form on U.S. residential energy use. Housing Policy Debate, 19(1), 1–30. DOI 10.1080/10511482.2008.9521624. [Google Scholar] [CrossRef]
16. Xiao, H. W. (2014). Impact of New-type urbanization on energy consumption-the empirical examination and the impact decomposition using spatial econometric model. Contemporary Economic Management, 8(36), 12–18. [Google Scholar]
17. Wang, Z. B. (2016). Energy consumption, environmental treatment and green taxation in the process of urbanization -a green endogenous economic growth model. Journal of Yunnan Finance and Trade Institute, 2, 49–61. [Google Scholar]
18. Halicioglu, F. (2007). Residential electricity demand dynamics in Turkey. Energy Economics, 29(2), 199–210. DOI 10.1016/j.eneco.2006.11.007. [Google Scholar] [CrossRef]
19. Liu, Y. B. (2007). An analysis of dynamic econometric relationship between development of urbanization and growth of energy consumption in China. Journal of Finance and Economics, 11(33), 72–81. [Google Scholar]
20. Tan, J. T., Zhang, P. Y., Li, J., Liu, S. W. (2016). Effect of urbanization on energy consumption in China based on cointegration and STIRPAT model. Journal of Arid Land Resources and Environment, 9(30), 1–6. [Google Scholar]
21. Wang, X. B., Qiu, L. X. (2013). An analysis of dynamic econometric relationship between urban energy consumption and urbanization in China. Soft Science, 12(27), 90–94. [Google Scholar]
22. Lenzen, M., Wier, M., Cohen, C., Hayami, H., Pachauri, S. et al. (2006). A comparative multivariate analysis of household energy requirements in Australia. Energy, 31(2–3), 181–207. DOI 10.1016/j.energy.2005.01.009. [Google Scholar] [CrossRef]
23. Al-mulali, U., Fereidouni, H. G., Lee, J. Y. M., Sab, C. N. B. C. (2013). Exploring the relationship between urbanization, energy consumption, and CO2 emission in MENA countries. Renewable and Sustainable Energy Reviews, 23, 107–112. DOI 10.1016/j.rser.2013.02.041. [Google Scholar] [CrossRef]
24. Cheng, J. H., Chen, J. (2009). Regional differences of energy consumption in the process of urbanization in China. Economic Review, 3, 38–46. [Google Scholar]
25. Zhang, L. N., Xia, H. Y. (2013). Research on the difference of energy consumption in the process of Urbanization: Based on the analysis of China’s inter provincial panel. Academia Bimestris, 2, 136–141. [Google Scholar]
26. Ding, C. C. (2015). The dynamic effect and regional difference of the industrialization and urbanization on the energy consumption intensity in China. Journal of Hebei University of Economics and Business, 3(36), 41–48. [Google Scholar]
27. Otto, S. (2021). Unit root testing with slowly varying trends. Journal of Time Series Analysis, 42(1), 85–106. DOI 10.1111/jtsa.12557. [Google Scholar] [CrossRef]
28. Zuo, X. X. (2020). Review of the new development of unit root test. Mathematics in Practice and Theory, 13(50), 272–279. [Google Scholar]
29. Studenmund, A. H. (2015). Using econometrics: a practical guide. 6th Edition. UK: Pearson Education Limited. [Google Scholar]
30. Kennedy, P. (2008). A guide to econometrics, 6th Edition. https://www.wiley.com/en-cn/A+Guide+to+Econometrics,+6th+Edition-p-9781405182577. [Google Scholar]
31. Skripnikov, A., Michailidis, G. (2019). Joint estimation of multiple network Granger causal models. Econometrics and Statistics, 10(11), 120–133. DOI 10.1016/j.ecosta.2018.08.001. [Google Scholar] [CrossRef]
32. Lv, Y. L. (2019). Muti-scale and Spatio-temporal Analysis of Energy Consumption in China under the Background of Urbanization (Ph.D. Thesis). Shandong University, China. [Google Scholar]
33. Soltani, M., Rahmani, O., Pour, A. B., Ghaderpour, Y., Ngah, I. et al. (2019). Determinants of variation in household energy choice and consumption: Case from Mahabad City, Iran. Sustainability, 11(17), 4775. DOI 10.3390/su11174775. [Google Scholar] [CrossRef]
34. Gao, T. M. (2016). Econometric analysis method and modeling: Eviews application and example. 3th Edition. CHN: Tsinghua University Press. [Google Scholar]
 | This work is licensed under a Creative Commons Attribution 4.0 International License, which permits unrestricted use, distribution, and reproduction in any medium, provided the original work is properly cited. |