| Energy Engineering |
DOI: 10.32604/EE.2021.014970
ARTICLE
Assessment of Electricity Productivity in China: Regional Differences and Convergence
1College of Economics and Management, Shanghai University of Electric Power, Shanghai, 200090, China
2Zhejiang Electric Transmission and Transformation Engineering Co., Ltd., Hangzhou, 310016, China
3State Grid Jiangsu Marketing Service Center (Metrology Center), Nanjing, 210019, China
4Beijing Electric Power Transmission and Transformation Co., Ltd., Beijing, 102401, China
*Corresponding Author: Pinjie Xie. Email: yjzxpj@shiep.edu.cn
Received: 12 November 2020; Accepted: 17 March 2021
Abstract: Electricity productivity is regarded as a major assessment indicator in the design of energy saving policies, given that China has entered a “New Normal” of economic development. In fact, enhancing electricity productivity in an all-round way, as is one of the binding indicators for energy and environmental issues, means that non-growth target of total electric energy consumption in the economic development is feasible. The Gini coefficient, Theil index, and Mean log deviation are utilized to measure regional differences in China’s electricity productivity from 1997 to 2016 in five regions, and conditional β convergence is empirically analyzed with the spatial Durbin model. The results show that: (1) China’s electricity productivity is improving, while the overall feature is that the eastern area has a higher efficiency than the western area. (2) The difference in electricity productivity is the smallest in the northeast and the largest in the northwest. Interregional difference plays an important role and is the main cause for the differences. (3) The electricity productivity in China exhibits β convergence, except for the northwest. The positive driving factor is urbanization level (0.0485%), and the negative driving factor is FDI (–0.0104%). Moreover, the urbanization rate (0.0669%), foreign direct investment (0.0960%), and the industrial structure (–0.0769%) have a spatial spillover effect on improving regional electricity productivity. Based on this conclusion, the study provides some recommendations for saving energy policy design in China’s power industry.
Keywords: Electricity productivity; regional differences; convergence; spatial Durbin model
The economic development occurring in China since economic reforms were enacted in the country 40 years ago has led to consistent medium-high growth at an average annual rate of 9.22%1. Electrical energy, an indispensable factor in modern society, is a driving force behind and key to the security of stable and sustainable economic development. Electricity consumption in China, which accounted for 37.04% of the total energy consumption in the country in 2000, increased to 54.52% in 2015 [1,2]. By 2011, China had surpassed the United States in terms of electricity consumption and become the largest consumer of power in the world [3]. Given this situation, the ratio of electric energy to terminal energy consumption is expected to increase continuously [4], as pointed out in the “13th Five-Year Plan for Electric Power Development” (2016–2020). Electricity consumption is also expected to increase in the future as the Chinese economy continues to develop, and as electrification rates continue to improve. However, limitations in resource endowment has meant that electricity production in China has been dominated by thermal power. The proportion of thermal power used for this purpose has decreased in recent years; however, it was 72.24% in 2016. In addition, more than 90% of the fuel used in thermal power plants originated from coal. Therefore, electricity consumption (particularly that generated from thermal power) produced indirect carbon dioxide emissions and directly produced many pollutants such as sulfur dioxide, soot, and nitrogen oxides, thereby causing serious environmental and social problems. Fig. 1 shows that approximately 902.76 metric tons of China’s carbon emissions from electricity were produced in 1997; however, in 2016 that figure was 3,667.61 metric tons. Carbon emissions from electricity as a proportion of total fossil fuel consumption has increased continuously, reaching approximately 40% in 2016 [5,6].

Figure 1: China’s CO2 emissions in 1997–2016 (metric tons, Mt)
The productivity of electricity, also known as electricity intensity, is usually measured as electricity consumption per unit of gross domestic product (GDP). It is a measure that can simultaneously address the contradiction between economic growth and reducing emissions. This indicator also reflects the changes in electricity demand caused by economic restructuring and the feasibility of ensuring that zero carbon emissions come from power as part of stable economic growth [7,8]. The change in electricity productivity should be given more attention as part of the improvements made to the electrification level. However, two issues typical of electricity productivity in China must be recognized here. First, electricity productivity in China is still low due to the extensive economic growth that the country experienced. British Petroleum (BP) reported that the economic production value of electricity per kilowatt-hour electricity is $1.88 in China; this is equivalent to 60% of the global average, 70% of South Korea, 42% of the US, and 39% of Japan. Second, the spatial distribution of electricity productivity in China showed a pattern of being high in the east and low in the west. Therefore, improving electricity productivity in a manner consistent with China’s energy strategy, which focuses on energy efficiency, depends on overcoming the challenges of increasing resource and environmental pressures. This is one of the energy policy approaches by which China can change its original extensive economic development mode and ease environmental pressure.
Given the aforementioned conditions, this study aims to effectively evaluate regional differences in electricity productivity in China and analyze where these converge using the spatial Durbin model (SDM). First, a comprehensive analysis of regional differences in electricity productivity in China between 1997 and 2016 was conducted. Second, a powerful SDM model was used to further study whether there can be any convergence in electricity productivity. Finally, compared with previous studies, this work makes the following contributions. First, given the subdivision of the energy sectors, this study focuses on electric energy. We examined the differences and convergences in five regions of China, in terms of the overall electricity productivity in the country, to obtain targeted conclusions. Second, we used the Gini coefficient, Theil index, and mean log deviation (MLD) to analyze these regional differences in electricity productivity as these tools can accurately evaluate the status quo of the latter. Finally, we justified the convergence of electricity productivity by examining the spatial spillover effect of neighboring provinces in China using the SDM. This study provides a new vision with which policymakers can design differentiated energy control mechanisms to balance economic growth and environmental concerns.
As a high-quality and efficient secondary energy source, electricity plays an inestimable role in economic prosperity and social progress. However, it is mainly a conversion of primary source by burning fossil fuels such as coal, oil, and gas. Excessive use of fossil fuels for power generation has resulted in serious environmental pollution problems. Hence, electricity is a particularly important focus for energy studies. Electricity research have elicited extensive attention from scholars worldwide [9,10]. Currently, it focuses on the energy efficiency or energy intensity.
The first issue is regional differences in energy efficiency. Roberto [11] used the generalized entropy index to evaluate the spatial distribution of energy efficiency in 98 countries and concluded that there was a trend of convergence in this area in the sample countries. Duro et al. [12] used the Theil index decomposition method to investigate the differences in the energy efficiency of countries in the Organization for Economic Cooperation and Development (OECD), and found that the changes in the differences were caused by within-group and between-group inequalities. Ning et al. [13] and Li et al. [14] took China’s energy efficiency into consideration and proposed using the Theil index to study regional differences in the country, also considering that within-group differences were the main cause of the overall regional differences. Zhao et al. [15] used a Gini coefficient analysis to determine the status of regional energy efficiencies using the coefficient of variation and found that the differences between the Midwest and East were distinct but not large. Chen et al. [16] found that the intensity of energy consumption in China decreased in different regions. Finally, a sketch review of the results of existing research on regional differences in energy efficiency shows that the methods and objects of study needed to be improved. In terms of the former, existing research is often based on quantitative statistical models such as the Theil and generalized entropy indices, the Gini coefficient, and the coefficient of variation. However, these methods have considerable differences in sensitivity to changes at various levels [17,18]. Furthermore, it is difficult to comprehensively investigate the causes and of trends in regional energy-saving policies using one statistical indicator, as this is unconducive to judging the rationality of those policies. In terms of understanding trends, previous work has mainly focused on energy efficiency with little attention paid to electricity productivity. However, electricity is the most important energy resource in the Chinese economy [19]. Improving its efficiency can effectively solve the resource and environmental constraints of sustainable social development. Therefore, it is necessary to analyze electricity productivity, specifically, in China.
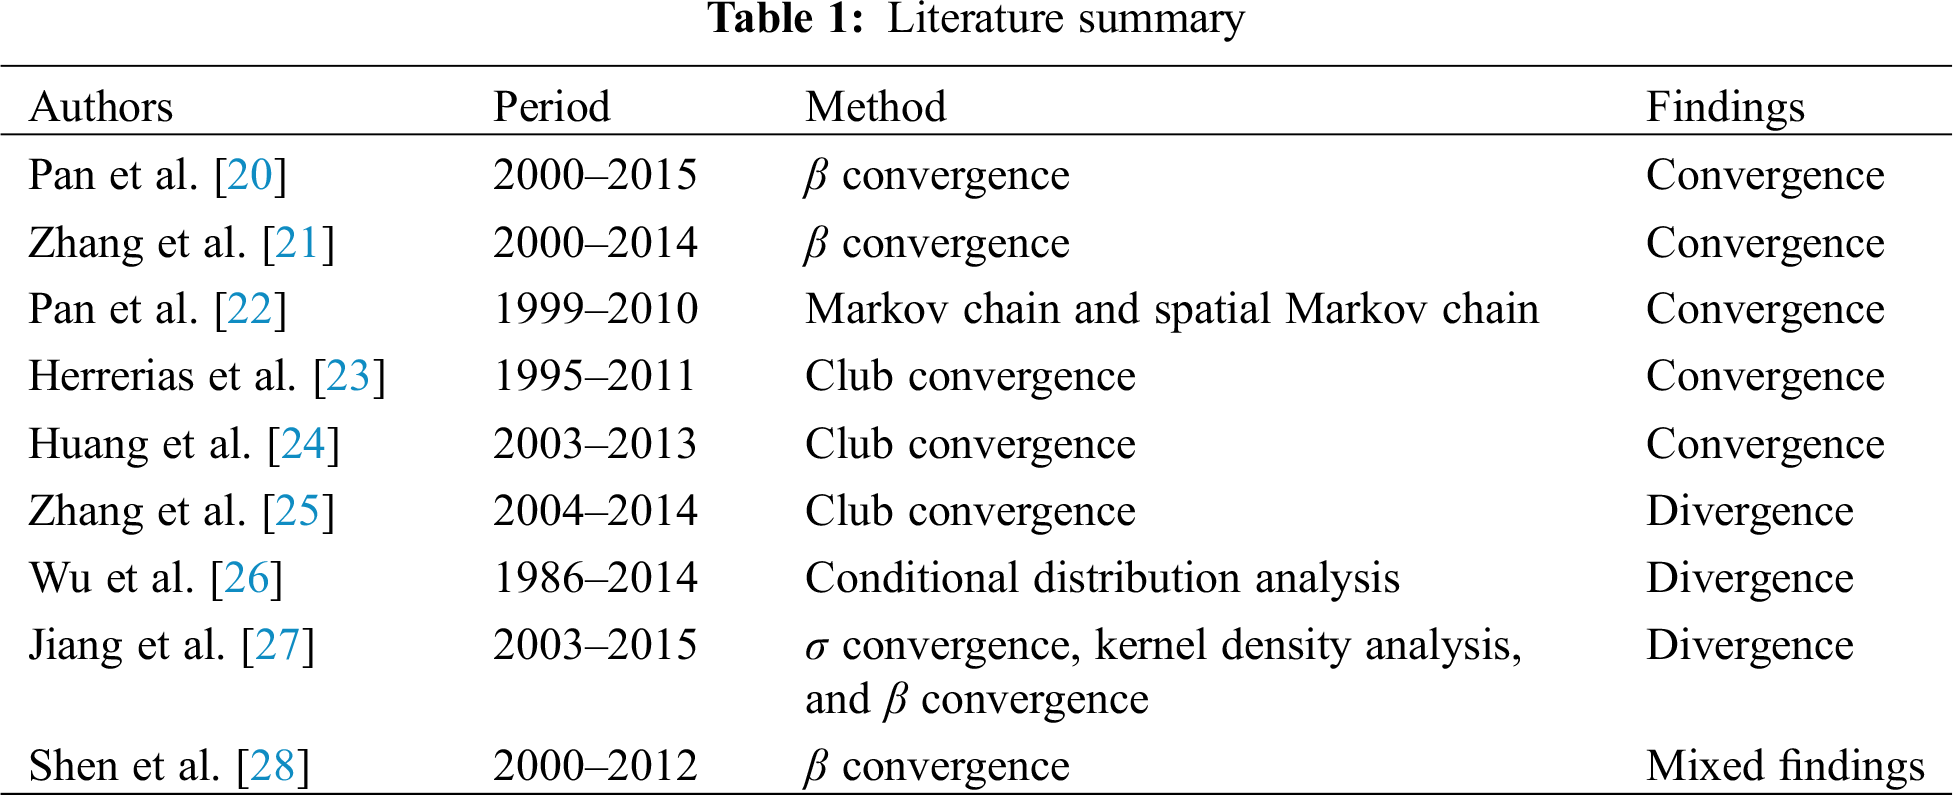
The second issue is the convergence of energy efficiency. Many researchers have empirically analyzed the convergence of regional differences in energy efficiency but have not reached a unified conclusion regarding this. Tab. 1 shows studies that examined the convergence of energy efficiency in China over the past five years. These studies can be divided into two groups according to their methodologies. The first group examined the convergence of energy efficiency within the scope of β convergence or σ convergence using cross-section or panel data techniques. The second group proposed alternative methodological concepts for testing energy efficiency convergence; these included club convergence, conditional distribution analysis, Markov chains, and spatial Markov chains. However, research on the convergence of electricity productivity is rarer than that on energy efficiency. Vaona [29] analyzed the convergence of regional electricity intensities in Italy using panel data for the period 1997–2007 and found that differences in various regions remained stable throughout that time. Herrerias et al. [30] used monthly data from 2003(1)–2009(12) to analyze the spatial convergence of provincial electricity intensity and discovered that club convergence exists in most provinces while divergence occurs in a few provinces. Chen et al. [31] used cluster analysis panel data for the period 2005–2014 and concluded that there was no polarization effect in the efficiency of electrical energy in China. Lin et al. [32] found that the efficiency of electricity consumption is affected by income, urbanization, population, secondary industry, and electricity price.
These studies provided a solid theoretical foundation for research on electricity productivity, but were conducted under the premise that regional spatial entities are independent of each other; the spatial spillover effect of neighboring areas was overlooked. The spatial spillover effect is a crucial factor that affects electricity productivity; therefore, ignoring the spatial spillover effect inevitably causes deviations in convergence estimates [33–35], which then leads to the conclusion that there is no relationship between the electricity productivity of different economic regions. In addition, it is difficult to propose differentiated policies based on regional realities. Current research on the spatial spillover effects focuses on energy intensity [36,37], carbon emissions [38], and urbanization [33].
3.1 Data and Variables Description
(1) In theory, productivity means output per unit of input, which corresponds to the engineering’s concept of efficiency. Hence, electricity productivity (or efficiency), usually measured as electric energy consumption per unit of gross domestic product (GDP), or electric energy intensity, is a measure of the direct link between electric energy consumption and economic growth and is related to emissions and environmental protection. A large value indicates high efficiency. So, the electricity productivity index is defined as:
where, GDPit is processed by a deflator, which is based on prices in 2000 and adjusted for subsequent years (unit: RMB 100 million). The total energy consumption is represented by the total annual electricity consumption of 30 provinces (unit: 100 million kilowatt-hours). The data are sourced from the http://data.stats.gov.cn/index.htm. The study describes in detail the status of electricity productivity in 30 provinces (due to the lack of data statistics, Tibet, Hong Kong, Macao, and Taiwan are excluded) in China. And the sample of the panel data in 30 provinces are obtained from 1997 to 2016 due to limited data availability.
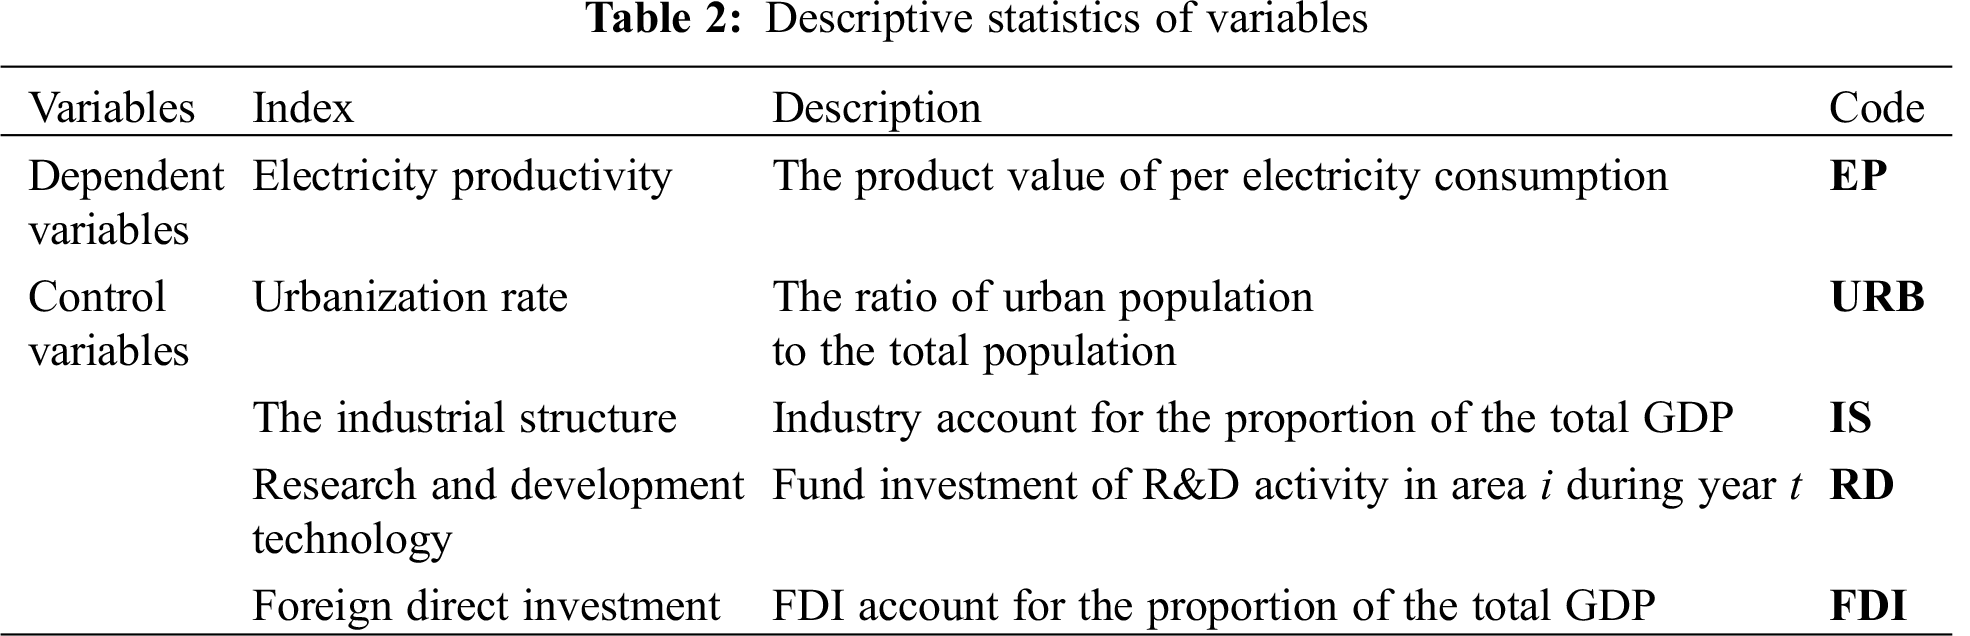
(2) As economic development, urbanization, and industrialization have all been commensurately increasing, China’s electricity consumption growth rate is more than twice the growth rate of total energy demand. And the improvement of regional electricity productivity is associated not only with the economic level and industrial structure but also with the composition of the energy resources and other factors. Thus, the study considers the urbanization level [32], the industrial structure [39], fund investment of research and development technology (R&D) [40], and foreign direct investment [41] as the control variables. The details of the variables are outlined in Tab. 2.
3.2 Methodolgy of Regional Differences
To investigate the regional differences in electricity productivity, we introduce regional economic methods, such as the Gini coefficient, MLD, and the Theil index proposed by economist Taylor in 1967. Existing studies on regional differences primarily and extensively used these methods. The Gini coefficient is sensitive in the middle part of electricity productivity, and MLD and the Theil index are sensitive at the bottom and upper parts of electricity productivity, respectively [17,18]. Considering that the three indices are sensitive to changes at different levels, they are used to measure the regional differences in electricity productivity comprehensively.
As an important index to measure regional differences, Gini coefficient has attracted the attention of many scholars. When it comes to group decomposition of the overall Gini coefficient, there is a complex problem and considerable controversy. A decomposition method mentioned by Marek [42] strictly assumed that the income distributions of the two subgroups do not overlap at all. This is difficult to satisfy in the real economic development. Cowell et al. [43] proposed a Gini coefficient group decomposition method, which requires the assumption of a cross term to replace the overlapping effect of subgroups, but the economic significance of the cross term is not clear. Abatemarco et al. [44,45] pointed out that the Gini coefficient does not satisfy the condition of additive decomposability and cannot perform perfect group decomposition. So, the Gini coefficient (GINI) formula is as follows:
where GINI is the Gini coefficient of electricity productivity; n denotes the sample size, namely, the number of regions; ei denotes the electricity productivity of the ith sample in ascending order; and μe denotes the mean of electricity productivity in the provinces or regions from 1997 to 2016.
The mean log deviation (GE0) and Theil index (GE1) formulas are as follows:
where GE0 is the mean log deviation of electricity productivity; GE1 is the Theil index of electricity productivity; and n, ei, and μe mean the same thing as those in the formula for calculating the Gini coefficient.
Furthermore, to investigate the difference in electricity productivity between and within groups, we use the decomposition formula of MLD and the Theil index simultaneously.
The total sample size n is divided into m groups, nk (k = 1, 2, … , m). The corresponding electricity productivity vector of each group is ek, the mean of electricity productivity in each group is μk, the number of regions is nk, the proportion of each group in the total area is νk = nk/n, W is the weighted average of unequal values in the kth groups and is used to measure the intragroup difference of electricity productivity, and B is the difference between the groups of electricity efficiency, which is calculated by converting the electricity productivity of each region into its corresponding group mean. The weight of W and B in the equation (
3.3 Methodology of Convergence
Through the analysis of differential decomposition and the spatial test, this study analyzes the convergence mechanism of regional differences in electricity productivity to further investigate its evolution in different regions. The classic panel model for testing β convergence generally considers absolute and conditional convergence. However, absolute β convergence is strictly assumed to be consistent with the economic growth level, industrial structure, technological level, and degree of openness of each region. From the previous analysis, we know that large differences exist in the above conditions in various regions of China. Thus, the conditional β convergence model is selected for analysis. Given that the relationship between growth in poor economies and the initial level over time is negative, all economies tend toward their own steady state, and conditional β convergence exists. Similarly, referring to Markandya et al. [46], we can introduce the conditional β convergence model of economics into the field of electricity productivity.
We estimate the following regression:
where ln(yi, t+T/yi, t)/T is the annualized growth rate of electricity productivity between t and t + T in area i and ln (yi, t) is the logarithm of area i’s electricity productivity at time t. α is a constant; β = –(1–e–θT) represents the speed of convergence to steady state, where T is the length of time. If β < 0, then we assume that it exhibits conditional β convergence, that is, the growth rate of the areas with high electricity productivity is lower than those with low electricity productivity between time t and t+T. Xi,t is a vector of variables that holds constant the steady state of electricity productivity in area i, and εi,t ~ N (0, σ2) (the error term ε in the normal distribution) is the disturbance for a spatial autoregressive structure.
China has a vast territory, and each region or province has regional spatial autocorrelation and heterogeneity. Given that these characteristics are ignored in traditional economic approaches, misleading conclusions could have been obtained [47]. Therefore, based on the impacts and interactions of spatial dependence, several spatial econometric models have been developed; these primarily include the spatial lag model (SLM), spatial error model (SEM), and SDM [48–50].
The common paradigms of SLM, SEM, and SDM are as follows:
I. Considering the spatial dependence across the observations on the dependent variable as an endogenous spatial lag variable, create a mixed autoregressive model. Therefore, SLM can be used to obtain a clear spatial autocorrelation, which is the spatial autoregressive model. The model is defined as follows:
where W comprises the n × n contiguity matrix (i.e., spatial weight matrix), Wln(yi,t+T/yi,t) represents the spatially lagged dependent variable, and ρ is the regression coefficient that reflects the spatial interactions of the sample observations. ui, vt, and εi,t are the spatial individual effect, period effect, and random error effect, respectively.
II. SEM considers the spatial correlation across the essential variables (error terms) on the dependent variable. The model is presented as follows:
where λ is the coefficient of the spatial error regression that reflects the spatial correlation in neighboring regions between the regression residues. Wεi,t represents the spatial lag of the error, which reflects the spatial interaction in the error regression structure. μi,t is a spatially uncorrelated random perturbation.
In SLM, a large value of ρ indicates strong spatial influences and dependences from neighboring regions. However, in SEM, the spatial influence occurs only when a deviation from the expected value is observed in the growth of neighboring regions. Its effect has a direct correlation with the coefficient λ.
III. Considering the effects of spatially lagged dependent and independent variables, SDM is a better choice than SLM and SEM. Its advantage is that it can capture the spatial correlation of the dependent variables and the spatial spillover effects of independent variables. The form of SDM is as follows:
where ηWXi,t is the interaction terms of the spatial weight matrix and exogenous variables that are designed to calculate the spatial spillover effects among the exogenous variables. All other variables are the same, as shown in Eqs. (7)–(10).
Therefore, the SDM model is presented as follows:
In Eq. (12),
A noteworthy feature of China is that there are huge differences in electricity productivity among different regions. Understanding the level of differences can reveal the situation of electricity productivity and provide a reasonable reference for the balanced development of regional electricity productivity. The study of regional differences on electricity productivity first involves the issue of regional division. Currently, China is generally divided into three regions by the division method of the State Council. However, the method is different from China’s regional economic development strategy such as “The development of the western China”, “The Rise of Central China”, and “Revitalization of Northeast Old Industrial Base”. And the economic development status of the southwest and northwest regions is quite different. Therefore, considering the close relationship between regional economic development and electricity supply and demand, this study divides the 30 provinces into five regions.
4.1 Status Quo of Electricity Productivity in China
4.1.1 Analysis of the Difference in Electricity Productivity Using Annual Provincial Data
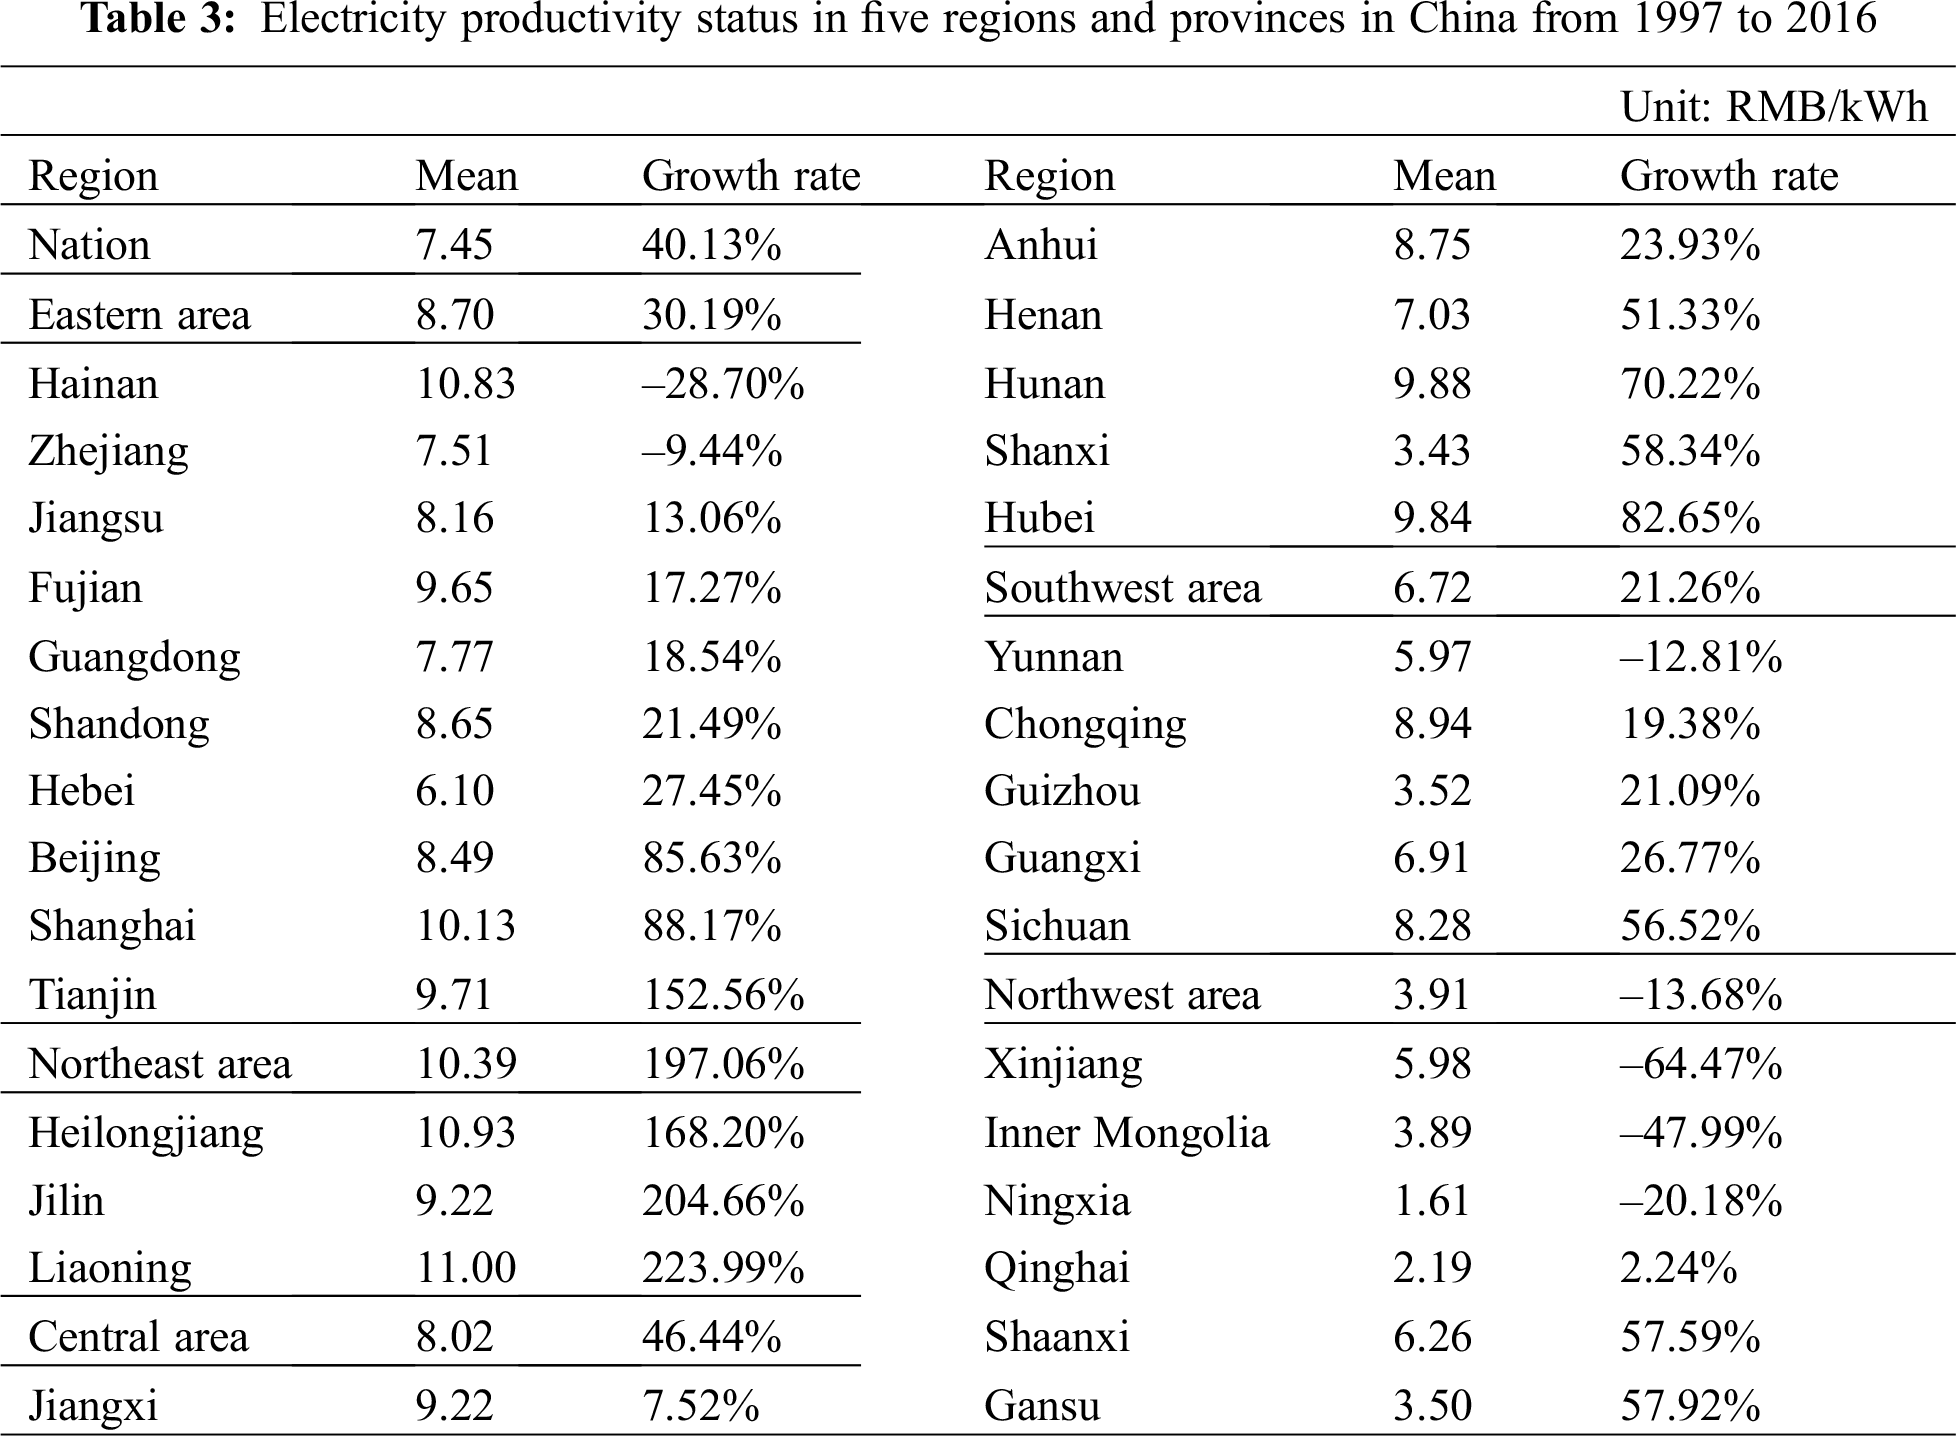
Tab. 3 shows the collected information on the electricity productivity of all provinces and the means for the five regions from 1997 to 2016. Most provinces in China exhibited significantly enhanced electricity productivity during 1997–2016. However, slow growth is observed in a few provinces. Negative growth is even observed for several provinces, namely, Zhejiang (–9.44%), Yunnan (–12.81%), Ningxia (–20.18%), Hainan (–28.70%), Inner Mongolia (–47.99%), and Xinjiang (–64.47%). Specifically, the growth rate of Liaoning was the highest from 5.27 in 1997 to 17.08 in 2016, and its efficiency increased by 2.24 times. Jilin, Heilongjiang, Tianjin, Shanghai, Beijing, Hubei, Hunan, Shanxi, Gansu, and Shaanxi closely followed. However, 10 provinces exhibited a slow growth rate, namely, Qinghai, Jiangxi, Jiangsu, Fujian, Guangdong, Chongqing, Guizhou, Shandong, Anhui, and Guangxi. Qinghai’s growth rate was only 2.24%, which was the lowest in the country excluding negative growth rates. At the national level, electricity productivity reached 7.45 over the entire period (1997–2016). In the eastern, northeastern, and central regions, electricity productivity was lower than the national level only in Shandong, Henan, and Shanxi. In the southwest and northwest regions, only Sichuan and Chongqing reached the national average. From the sequential variation perspective, the provincial electricity productivity in China differed over the past two decades, increasing or declining occasionally. In terms of mean values, China’s electricity productivity demonstrated an improvement. Such improvement indicates that China has effectively reduced its electric energy intensity and improved its efficiency. Tab. 3 shows that differences in electricity productivity exist among different provinces and regions of China. Meanwhile, regional electricity productivity decreased from east to west areas. For example, Liaoning had the highest electricity productivity with an average value of 11.0 between 1997 and 2016, which is 6.83 times as high as that of Ningxia (1.61), the province with the lowest electricity productivity.
4.1.2 Analysis of the Difference in Electricity Productivity Using Annual China’s Regional Data
In reference to the industrial coupling degree in economic regions, China’s 30 provinces are divided into five regions. Tab. 3 and Fig. 2 show that electricity productivity in the northeast area was the highest and even much higher than the value in eastern and central regions during 1997–2016. Meanwhile, the electricity productivity in the northeast, eastern, and central regions exceeded the national average. The southwest and northwest areas of China had the lowest electricity productivity, which was below the national average. In terms of variation amplitude, the national growth rate of electricity productivity was 40.31%. Significant differences are found among the five regions. The growth rates in the northeast and central areas were 197.06% and 46.44%, respectively; however, the growth rate was lower than the national level in other regions. Combined with the variation amplitude of provincial electricity productivity, the majority of the top 10 provinces were in the central and eastern areas and accounted for 80%. These findings imply that regional electricity productivity is related to economic development, that is, the more developed eastern region improves faster than the other regions. In terms of the average, Shanghai, Beijing, Tianjin, Hainan, and Liaoning in the east, Hunan, Hubei, and Jiangxi in the center, and Chongqing and Sichuan in the southwest are relatively developed provinces in the region. They have higher electricity productivity compared with the national average level. Economic growth may exert positive effects on electricity productivity. Therefore, consistent with the energy-saving policy, stable and sustainable economic growth is based on low electricity consumption. This finding provides a valuable reference for improving energy efficiency in the future.

Figure 2: Change trends of electricity productivity in five regions and China (1997–2016)
4.2 Analysis of the Differences in China’s Electricity Productivity
4.2.1 Analysis of Difference in Electricity Productivity among Different Provinces
Eqs. (1)–(3) are respectively used to calculate the estimates of GINI, MLD, and the Theil index of electricity productivity and its growth rate in 30 provinces of China from 1997 to 2016, as shown in Fig. 3. We further analyze the differences in provincial electricity productivity from the overall changes and statistical characteristics of the three variability indicators. Fig. 3 shows a chronologically increasing trend, but the specific amplitude is different. The variation amplitude of the Theil index is the smallest at 70.23%, and the growth rates of MLD and GINI are 84.29% and 93.10%, respectively. The average values of GINI, MLD, and the Theil index are 0.1939, 0.1048, and 0.0839, respectively. Although the three indicators have a high growth rate, their average values are below 0.2. This result suggests that provinces with low levels of electricity productivity change slightly, whereas provinces with moderate and high levels of electricity productivity change considerably. Overall, the results suggest that the internal efficiency of China’s electric energy did not change much from 1997 to 2016. The specific reasons may be closely related to the government’s energy policy guidance. However, the three indicators have changed significantly in several individual years. For example, all of the three indicators showed the first positive growth rate in 2003 at 5.67%, 10.99%, and 7.57%. Negative growth rates of –3.75%, –5.87%, and –5.46% occurred in 2016, showing that the regional differences in electricity productivity were greatly reduced for the first time in 2016. The energy policies in the “13th Five-Year Plan” indicate that these results cannot be separated, such as the “notice on relevant matters about comprehensively promoting the reform pilot of transmission and distribution electricity price” in 2015, which reduced excessive coal-fired power plant production capacity and increased large-scale new energy power generation integration.

Figure 3: Results of regional differences in China’s electricity productivity
4.2.2 Analysis of the Difference in Electricity Productivity among Different Regions
The study uses Eqs. (4) and (5) to estimate the regional difference in electricity productivity, as shown in Figs. 4 and 5. The regional differences in electricity productivity reflected by the two indicators (GE1 and GE0) are generally similar to those in Fig. 4. The northwest area, where GE0 and GE1 are 0.1318 and 0.1252, respectively, has the largest difference, whereas the eastern areas, where GE1 and GE0 are 0.0042 and 0.0042, respectively, show the smallest difference. In terms of the variation trend in the five regions, the two indicators in the northeast are reduced by 50%, whereas the growth trend of the other regions is maintained. To investigate the overall regional differences in electricity productivity, the total difference of the two indicators exhibited a trend during 1997–2016, that is, it decreased after the first increase. In 2014, the total difference in electricity productivity in the five regions reached the peak then narrowed down. The main factor of district determines the regional differences that lead to China’s electricity productivity. Overall, the total difference is divided into intraregional and interregional differences by using Eqs. (4) and (5), as shown in Fig. 5. We can determine the main contribution of regional differences that lead to China’s electricity productivity. All indicators suggest that the interregional difference is expanding chronologically, and its proportion exceeded 50% by 2007 then gradually became dominant.

Figure 4: Differences of electricity productivity in five regions (1997–2016). (a) Based on Mean log deviation, (b) Based on Theil index

Figure 5: Distributions of electricity productivity in five regions (1997–2016). (a) Based on Mean log deviation, (b) Based on Theil index
4.3 Analysis of Spatial Convergence in Electricity Productivity
4.3.1 Spatial Autocorrelation Test
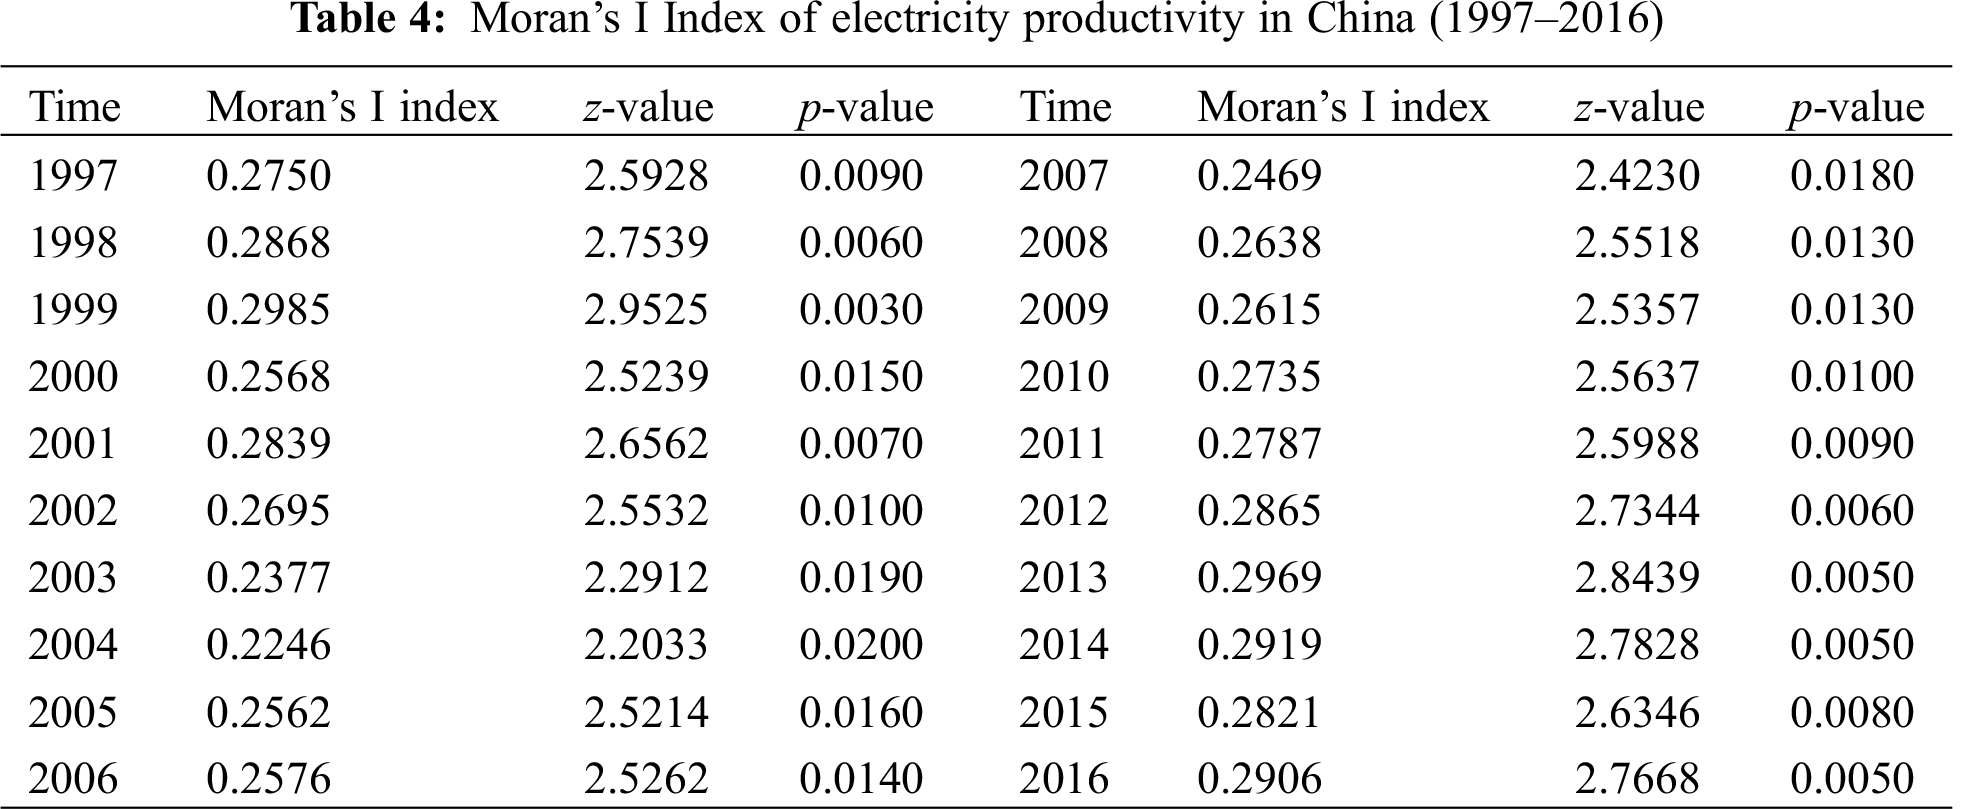
This study considers whether or not the spatial effect on China’s regional electricity productivity exists. Thus, this study introduces spatial economics theory to analyze its spatial distribution or autocorrelation further. Using the global autocorrelation test model, we can obtain the Moran’s I index of China’s electricity productivity from 1997 to 2016. This index depicts the correlation degree and spatial agglomeration of local areas in China’s electricity productivity. It can measure the spatial autocorrelation of the electricity productivity index. On the basis of the spatial weight matrix, GeoDa is used to calculate the Moran’s I index of China’s electricity productivity during the sample period after several simulations, as shown in Tab. 4.
In general, the result reveals that Moran’s I index has a flat “N” shape. In particular, Tab. 4 presents a wave curve that increases slowly at the beginning and falls sharply afterward; subsequently, it begins to rise. It merely presents the strengthening trend in the dynamic changes of spatial correlation in electricity productivity. Tab. 4 also shows that its value in each year is more than 0.20, with 0.2985 as the highest value in 1999. However, the values of Moran’s I index from 1997 to 2016 are all positive and significant at the 5% level, and the growth rate is 5.38%. This result also indicates that spatial correlation in China’s electricity productivity must exist over the period 1997–2016. Therefore, spatial correlation as a vital factor should be considered in the study of regional differences in electricity productivity.
4.3.2 Analysis of Convergence Results
As suggested by Elhorst [51], the spatial model selection procedure proceeds as follows. It begins with the standard POLS model. Determining whether or not a spatial effect exists is necessary. Then, the type of spatial effect (spatial lag or spatial error) is identified, and whether a spatial or temporal fixed effect exists is determined. Subsequently, the type of panel data model is decided upon (fixed or random effect model).
The study considers spatial dependence and distinguishes the optimal model by using five specification tests from the model judgment criteria of Anselin [47]; these five are Lagrange multiplier test for errors (LM-err test), Lagrange multiplier test for lag (LM-lag test), Wald’s test, likelihood ratio (LR) test, and Hausman’s test.
All results are produced by Matlab 2016a to estimate the models from Eq. (7) to Eq. (11). Tab. 5 shows the estimated results when a nonspatial panel data model is used to determine whether SLM or SEM is appropriate. The LM tests show that POLS and spatial fixed effect models of LM-err and LM-lag are significant at the 1% level, whereas the spatial and time-period fixed effect models of LM and robust tests are ineffective. This result suggests that the spatial correlation cannot be explained by the spatial lag and spatial error completely. Therefore, SDM is introduced for estimation when considering the spatial agglomeration and spillover effects from the province and region. We use the LR test to determine the type of spatial Durbin model to be applied. The measured LR value of the spatial fixed effect is 164.7206 (p = 0.0000), and the LR value of the time-period fixed effect is 212.5224 (p = 0.0000). Therefore, SDM with the two-way fixed effect model should be used for regression. These results testify the extension of the model with spatial and time-period fixed effects [52]. Moreover, we study whether these fixed effects are jointly significant and replaced by random effects. Hausman’s test may be performed to justify the random effect model against the fixed effect model [53]. The Hausman’s test value is 1.5057 (p = 0.3264), indicating that the random effect model should be used for the estimation.

Then, to test whether SDM can be simplified to SLM and SEM models, Wald’s test or the LR test may be performed, as shown in Tab. 6. The results of Wald’s test spatial lag (20.7030), LR test spatial lag (22.2924), Wald’s test spatial error (20.1233), and LR test spatial error (22.1802) in the six columns pass the 1% significance test. Thus, the model is in favor of SDM and rejects SLM and SEM.
In summary, the test results point to the spatial Durbin specification of the two-way fixed effect model. Therefore, the SDM of the electricity productivity in Tab. 6 is considered. In the national level, growth convergence is observed in electricity productivity in China. The urbanization development’s impacts on electricity productivity are positive and significant. A 1% increase in urbanization level results in a 0.0485% increase in the growth of electricity productivity. In areas with low electricity productivity, accelerated urbanization development can narrow the gap between areas with high electricity productivity, which is significant to the improvement of electricity productivity in general. The FDI coefficient is significant but negative. The Chinese government has injected a large amount of foreign direct investment. This situation may result in high energy consumption and high pollution, thereby increasing China’s electrical energy intensity and not conducive to improving China’s overall electricity productivity. Considering the existence of the spatial spillover effect, urbanization level has a significant positive spillover effect. The increase in the level of urbanization in neighboring areas will promote the improvement of local electricity productivity. FDI has a significant positive spillover effect, which indicates that FDI positively influences the reduction of China’s electricity intensity and improvement of the electricity productivity of surrounding areas by flow and competition effects, further negating the “pollution heaven” hypothesis. The industrial proportion (IS) has a significant spillover effect but is negative. It shows that in the process of industrialization, the improvement of electricity productivity in several areas may be based on the decline in other areas from neighboring provinces, resulting in an enhanced polarization effect of electricity productivity in various regions. However, the spatial spillover effect of R&D investment is not significant, indicating that their influence mechanisms may not have formed in the above-mentioned variables.

To investigate the existence of regional convergence, we divide the sample into five regions for regression, as shown in Tab. 7. The test results indicate that the Durbin model, which has two-regime, bias-corrected, and random spatial time-period fixed effects, can be selected as the optimal model for the five regions. The regression analyses reveal a difference in the influence factors on electricity productivity and its convergence speed in the five regions.
In view of the convergence characteristic, the electricity productivity in the eastern, northeastern, southwestern, and central areas showed a significant convergence characteristic. The speed is the highest in the northeast and lowest in the east. This finding indicates that except for the northwest area, the differences in electricity productivity in the other regions are gradually narrowing, but the northeast region is the slowest. In terms of specific variables, due to the differences in the internal influencing factors in each region, the driving degree to electricity productivity is also different.
The urbanization level in the eastern and northeastern areas is significantly positive, but other areas are not significant, as shown in Tab. 7. In the process of urbanization, the increase urbanization level in the eastern and northeastern areas decreases the electric energy intensity, which is conducive to improving the electricity productivity. The increase in industrial structure in the northeast is significantly negative, indicating that the improvement in electricity intensity inhibits the increase in electricity productivity during industrialization process. However, the effect of the industrial structure in the southwest is significantly positive. Under the constraint of unit energy consumption, the electric power industry promotes the improvement of electricity productivity against the background of the campaign of western region development. The R&D expenditure is significantly negative in the central and northwestern regions, where it might be constrained by economic levels and technical conditions. Thus, fully converting R&D into technology utilization is challenging. If R&D investment in the power industry could be truly and effectively translated into clean energy technology achievements, such as smart grids, clean and efficient power generation technology, and offshore wind power, then improving the electricity productivity and building a resource-saving society would be crucial. FDI is significantly negative in the northwest of China. FDI may introduce the eliminated high energy consumption and high-pollution industries in developed areas into the relatively backward areas in the northwest, thereby restraining the improvement of electricity productivity in China. FDI is positive but not significant in the central and east areas, where the effect of investment remains insufficient.

To further verify whether or not the influence factors exert spatial spillover effects at the regional level, this study explores the influence factors of regional electricity productivity convergence. The results show that regional electricity productivity has a significant spillover effect. In other words, the above-mentioned variables in a certain region not only affect the electricity productivity of the region, but also cause changes in electricity productivity in neighboring regions through the spatial conduction mechanism. The urbanization level is significantly negative in the eastern area, where urbanization development may compete with the development of surrounding cities, thereby curbing the growth rate of electricity productivity. The spatial spillover effect of IS is significant but negative in the northeast and eastern areas, indicating that the increase in industrial proportion in the industrialization process not only affects the local electricity intensity, but also promotes the electricity intensity in the neighboring areas, thus inhibiting the improvement of electricity productivity. The spatial spillover effect of IS is positive in the central, southwest, and northwest areas. However, it is only significant in the southwest region, indicating that although the increase in the industry contributes to the improvement of electricity productivity, it is not significant enough. The spatial spillover effect of R&D is positive in the east area but significantly negative in the northwest area. Thus, R&D expenditures can be effectively transformed into scientific and technological achievements in the eastern developed regions, thus driving technological advances in the surrounding areas and achieving rapid economic development at reduced energy consumption costs. It has a significant impact on electricity productivity. The spatial spillover effect of FDI is positive in the northeast and southwest regions and negative in the other regions. This result indicates that FDI brings about technology and knowledge spillover effects and improves the technology and production efficiency of the surrounding provinces in the northeast and southwest regions to enhance its electricity productivity. In the other regions, FDI might drive economic development in backward areas at the expense of high energy consumption in the early stage of industrialization and urbanization. The spillover effect spreads to the neighboring areas and reduces their electricity productivity. Therefore, when introducing investments, governments at all levels should ensure stable and sustainable economic development at the expense of low electric energy intensity.
We use a single-factor indicator to measure electricity productivity based on the ratio of actual GDP to total electricity consumption. First, the regional differences in electricity productivity are analyzed in 30 provinces and five regions in China by calculating three difference indexes. Then, the spatial spillover effects are not omitted nor ignored. Through SDM, we empirically analyze the convergence of electricity productivity in China. The following conclusions are obtained.
(1) China’s electricity productivity has evident regional differences.
In recent years, the electricity productivity of most provinces in China has improved. However, this varied considerably among the different provinces during the period 1997–2016; during this time, productivity was on a gradient that showed a higher efficiency in the east than in the west. Furthermore, there is an inseparable relationship between the increase in electricity productivity and economic development. The rate at which electricity productivity increased in several economically developed eastern regions was high whereas the rates in the central, southwest, and northwest are lower than the national level; this is despite three different indicators showing increasing trends year by year. The differences in regional electricity productivity are highest in the northwest and lowest in the northeast. In terms of the amplitude of variation, two indicators in the northeast decreased by approximately 50% whereas those in the remaining areas increased slightly overall. From the perspective of different structures, the regional differences in electricity productivity maintained their growth trends according to two indicators although the former narrowed after 2014; the differences between the regions gradually became dominant.
(2) Electricity productivity shows a significant convergence trend.
All four regions except the northwest showed significant convergence in terms of electricity productivity. The northeast had the fastest convergence rate while the east had the slowest. This result indicates that the regional differences in electricity productivity of the four areas studied are gradually narrowing although this change is slowest in the northeast. Different variables have varying effects on electricity productivity. An increase in urbanization level and R&D expenditure can improve electricity productivity while an increase in FDI and industrial structures increases the intensity of electricity and reduces improvements in electricity productivity. However, the effects of R&D and industrial structures are not obvious. Moreover, considering the spatial spillover effect of electricity productivity in different regions, differences in the economic levels of the latter, and resource endowment in various regions, the spillover effects of the variables of electricity productivity also vary. Therefore, when provincial governments make efforts to find solutions to improve electricity productivity, they should analyze the structure of energy efficiency and promote convergence among different regions. It is necessary to implement energy-saving policies following the development track set by a provincial government and plan power in a rational way that is suited to local conditions.
From this empirical research, we obtain the following implications.
First, regional differences in electricity productivity should be considered. Regional governments should focus on seeking increased openness and establishing effective coordination mechanisms to increase electricity productivity. The advantages of the spatial spillover effect should be used fully to promote coordinated regional development of electricity productivity. The “technological superiority of the east” and the “abundant energy resources in the west” need to be combined in a rational and scientific manner to narrow the gap between the regions. Following this, the east could provide governance and management advice to the western, through collaborative governance mechanisms and technology transfers, to improve electricity productivity.
Second, the “13th Five-Year Plan” created energy intensity constraints in the top-level design of relevant policies. Moreover, the local conditions in different regions must be considered seriously in terms of optimizing their industrial structures. On the one hand, China should reasonably reduce the proportion of primary industries and increase the proportion of tertiary industries in the eastern and central regions. The country should also focus on optimizing the internal structure of its service industry and accelerating the transformation of and upgrades to industrial structures toward low energy consumption and high added value. On the other hand, adjustments to the industrial structure in the west should combine the economic foundations and resource advantages of each province to continue to increase the development of the new energy industry. Innovative industries should be encouraged to reduce their dependence on the power industry, thereby achieving structural adjustments to their energy sources and to green and sustainable development.
Third, increasing electricity productivity depends on the investment in innovation and R&D. R&D expenditure should be increased to promote the development and application of new energy sources, particularly in areas with low electricity productivity; the former should gradually adjust the structures of electric power production to improve the efficiency of power configurations. However, the following points should be noted in terms of the negative effects of R&D in several regions. First, the local government should promote the benefit of the transformation for scientific and technological achievements in energy efficient technologies. Second, the precise investment to scientific research, in terms of funding, should be ensured to increase the input–output ratio in the power industries and establish sound scientific research and supervision mechanisms therein.
Fourth, the government has a policy of introducing foreign investment although FDI has a two-sided effect on the improvement of electricity productivity. However, foreign investment could play a positive role in improving electricity productivity in China. Therefore, we must not blindly focus on the scale of foreign investment; we should constantly adjust its quality and direction to avoid its negative effects. In the new energy industry, the quality and efficiency of energy utilization should be enhanced via an injection of foreign capital and advanced technology. Improving energy efficiency, including electricity productivity, must be the priority target for which to introduce investment.
Authors Contribution: Conceptualization, Pinjie Xie and Fan Yang; formal analysis, Pinjie Xie, Zhuowen Mu, Fan Yang and Ying Zhai; investigation, Zhuowen Mu and Ying Zhai; writing—original draft preparation, Pinjie Xie and Ying Zhai; writing—review and editing, Pinjie Xie, Chao Wang and Fan Yang; supervision, Pinjie Xie, Chao Wang and Ying Zhai.
Funding Statement: This paper is supported by Funds for the National Natural Science Foundation of China Youth Project (Grant Nos. 71103120 & 51507099) and Shanghai Social Science Planning General Project (Grant No. 2018BGl019).
Conflicts of Interest: The authors declare that they have no conflicts of interest to report regarding the present study.
1Annual growth rate is compound annual growth rate (CAGR), i.e., CAGR = (ending balance/beginning balance)1/number of years.
1. NBSC (National Bureau of Statistics of China) (2017). China statistics yearbook 2001–2017. China: China Statistics Press. [Google Scholar]
2. Zhou, K., Yang, S., Shao, Z. (2016). Energy Internet: The business perspective. Applied Energy, 178(23), 212–222. DOI 10.1016/j.apenergy.2016.06.052. [Google Scholar] [CrossRef]
3. Dong, F., Yu, B., Pan, Y. (2019). Examining the synergistic effect of CO2 emissions on PM2.5 emissions reduction: Evidence from China. Journal of Cleaner Production, 223(7), 759–771. DOI 10.1016/j.jclepro.2019.03.152. [Google Scholar] [CrossRef]
4. Chen, W., Zhou, K. L., Yang, S. L. (2017). Evaluation of China’s electricity productivity under environmental constraints: A DEA cross efficiency model based on game relationship. Journal of Cleaner Production, 164(2), 38–44. DOI 10.1016/j.jclepro.2017.06.178. [Google Scholar] [CrossRef]
5. Yao, L., Chang, Y. (2014). Energy security in China: A quantitative analysis and policy implications. Energy Policy, 67(6), 595–604. DOI 10.1016/j.enpol.2013.12.047. [Google Scholar] [CrossRef]
6. Yuan, R., Jaão, F. D., Rodrigues, B. P. (2018). Impact of non-fossil electricity on the carbon emissions embodied in China’s exports. Journal of Cleaner Production, 192(5), 582–596. DOI 10.1016/j.jclepro.2018.04.255. [Google Scholar] [CrossRef]
7. Chen, X., Wang, C., Zhang, Y., Pu, Y. (2016). The simultaneous convergence of energy intensity and economy in China. Journal of Industrial Engineering Management, 30(3), 216–223 (in Chinese). [Google Scholar]
8. Jenkins, S. (2018). Getting to zero carbon emissions in the electric power sector. Energy Joule, 2, 1–12. DOI 10.1016/j.joule.2017.10.014. [Google Scholar] [CrossRef]
9. Xie, P., Gao, S., Sun, F. (2019). An analysis of the decoupling relationship between CO2 emission in power industry and GDP in China based on LMDI method. Journal of Cleaner Production, 211(8), 598–606. DOI 10.1016/j.jclepro.2018.11.212. [Google Scholar] [CrossRef]
10. Xie, P., Yang, F., Mu, Z., Gao, S. (2020). Influencing factors of the decoupling relationship between CO2 emission and economic development in China’s power industry. Energy, 209, 1–9. [Google Scholar]
11. Roberto, E. (2007). Distribution dynamics of energy intensities: A cross-country analysis. Energy Policy, 35(10), 5254–5259. DOI 10.1016/j.enpol.2007.05.006. [Google Scholar] [CrossRef]
12. Duro, J. A., Padilla, E. (2011). Inequality across countries in energy intensities: An analysis of the role of energy transformation and final energy consumption. Energy Economics, 33(3), 474–479. DOI 10.1016/j.eneco.2010.12.008. [Google Scholar] [CrossRef]
13. Ning, Y. D., Zhang, S. X., Sun, J. (2014). An analysis on the differences of regional energy efficiency in China based on Theil index. China Population Resources and Environment, 24, 69–72 (in Chinese). [Google Scholar]
14. Li, H. W., Kong, X. N., Zhao, H. C. (2016). Analysis of regional difference decomposition and the influence factor of the energy consumption intensity. China Mining Magazine, 25, 32–37 (in Chinese). [Google Scholar]
15. Zhao, J. L., Li, G., Sun, Y., Liu, J. G. (2013). Regional differences and convergence analysis of energy efficiency in China: On stochastic frontier analysis and panel unit root. Chinese Journal of Management Science, 21, 175–184 (in Chinese). [Google Scholar]
16. Chen, J. D., Wu, Y. Y., Wen, J., Cheng, S. L., Wang, J. L. (2017). Regional differences in China’s fossil energy consumption: An analysis for the period 1997–2013. Journal of Cleaner Production, 142, 578–588. DOI 10.1016/j.jclepro.2016.05.135. [Google Scholar] [CrossRef]
17. Firebaug, G., Goesling, B. (2004). Accounting for the recent decline in global income inequality. American Journal of Sociology, 110(2), 283–312. DOI 10.1086/421541. [Google Scholar] [CrossRef]
18. Dourius, S. F. (2008). Global demographic convergence? A reconsideration of changing intercountry inequality infertility. Population and Development Review, 34(3), 519–537. DOI 10.1111/j.1728-4457.2008.00235.x. [Google Scholar] [CrossRef]
19. Brantley, L. (2009). Electricity intensity convergence in IEA/OECD countries: Aggregate and sectoral analysis. Energy Policy, 39, 1470–1478. [Google Scholar]
20. Pan, X., Pan, X., Jiao, Z. (2019). Stage characteristics and driving forces of China’s energy efficiency convergence: An empirical analysis. Energy Efficiency, 12(8), 2147–2159. DOI 10.1007/s12053-019-09825-8. [Google Scholar] [CrossRef]
21. Zhang, W., Pan, X., Yan, Y. (2017). Convergence analysis of regional energy efficiency in china based on large-dimensional panel data model. Journal of Cleaner Production, 142(2), 801–808. DOI 10.1016/j.jclepro.2016.09.096. [Google Scholar] [CrossRef]
22. Pan, X. F., Liu, Q., Peng, X. (2015). Spatial club convergence of regional energy efficiency in China. Ecological Indicators, 51(1), 25–30. DOI 10.1016/j.ecolind.2014.10.026. [Google Scholar] [CrossRef]
23. Herreris, M. (2016). Residential energy consumption: A convergence analysis across Chinese regions. Energy Economics, 62(10), 371–381. DOI 10.1016/j.eneco.2016.06.006. [Google Scholar] [CrossRef]
24. Huang, J. H., Yu, Y. T., Ma, C. B. (2017). Energy efficiency convergence in China: Catch-up, lock-in and regulatory uniformity. Environment Resource Economics, 70(1), 21–45. [Google Scholar]
25. Zhang, D. Y., Broadstock, D. C. (2016). Club convergence in the energy intensity of China. Energy Journal, 37, 137–158. [Google Scholar]
26. Wu, J., He, J., Qian, J. J. (2018). Examination on the distribution dynamics of energy intensity across Chinese provinces and its determinants. China Population Resources and Environment, 28, 36–47 (in Chinese). [Google Scholar]
27. Jiang, L., Folmer, H., Minhe, J., Zhou, P. (2018). Revisiting cross-province energy intensity convergence in China: A spatial panel analysis. Energy Policy, 121(4), 252–263. DOI 10.1016/j.enpol.2018.06.043. [Google Scholar] [CrossRef]
28. Shen, N., Zhou, J. J., Zou, W. J. (2015). Energy efficiency measures and convergence in China, taking into account the effects of environmental and random factors. Journal of Environmental Studies, 24, 257–267. DOI 10.15244/pjoes/28347. [Google Scholar] [CrossRef]
29. Vaona, A. (2013). The sclerosis of regional electricity intensities in Italy: An aggregate and sectoral analysis. Applied Energy, 104, 880–889. DOI 10.1016/j.apenergy.2012.12.018. [Google Scholar] [CrossRef]
30. Herrerias, M. J., Cuadros, A., Orts, V. (2013). Energy intensity and investment ownership across Chinese provinces. Energy Economics, 36, 286–298. DOI 10.1016/j.eneco.2012.08.043. [Google Scholar] [CrossRef]
31. Chen, W., Zhou, K., Yan, S. L. (2017). Evaluation of China’s electricity productivity under environmental constraints: A DEA cross efficiency model based on game relationship. Journal of Cleaner Production, 164(2), 38–44. DOI 10.1016/j.jclepro.2017.06.178. [Google Scholar] [CrossRef]
32. Lin, B., Zhu, J. (2020). Chinese electricity demand and electricity consumption efficiency: Do the structural changes matter? Applied Energy, 262(5), 114505. DOI 10.1016/j.apenergy.2020.114505. [Google Scholar] [CrossRef]
33. Wang, Y. P., Li, J. (2019). Spatial spillover effect of non-fossil fuel power generation on carbon dioxide emissions across China’s provinces. Renewable Energy, 136(5), 317–330. DOI 10.1016/j.renene.2019.01.012. [Google Scholar] [CrossRef]
34. Liu, Y., Xiao, H., Lv, Y. K., Zhang, N. (2017). The effect of new-type urbanization on energy consumption in China: A spatial econometric analysis. Journal of Cleaner Production, 163, s299–s305. DOI 10.1016/j.jclepro.2015.10.044. [Google Scholar] [CrossRef]
35. Li, K., Fang, L., He, L. (2018). How urbanization affects China’s energy efficiency: A spatial econometric analysis. Journal of Cleaner Production, 200(3), 1130–1141. DOI 10.1016/j.jclepro.2018.08.028. [Google Scholar] [CrossRef]
36. Meng, B., Wang, J. G., Andrew, R., Xiao, H., Xue, J. et al. (2017). Spatial spillover effects in determining China’s regional CO2 emissions growth: 2007–2010. Energy Economics, 63(2), 161–173. DOI 10.1016/j.eneco.2017.02.001. [Google Scholar] [CrossRef]
37. Li, W. C., Yan, Y. H., Tian, L. X. (2018). Spatial spillover effects of industrial carbon emissions in China. Energy Procedia, 152(73), 679–684. DOI 10.1016/j.egypro.2018.09.230. [Google Scholar] [CrossRef]
38. Zhao, X. G., Zhang, Y. F., Li, Y. B. (2019). The spillovers of foreign direct investment and the convergence of energy intensity. Journal of Cleaner Production, 206(1), 611–621. DOI 10.1016/j.jclepro.2018.09.225. [Google Scholar] [CrossRef]
39. AlBajjali, S. K., Shamayleh, A. Y. (2018). Estimating the determinants of electricity consumption in Jordan. Energy, 147(1), 1311–1320. DOI 10.1016/j.energy.2018.01.010. [Google Scholar] [CrossRef]
40. Wang, C., Chen, X. (2017). Technological progress, structural adjustment of economy and convergence of energy intensity. Journal of Shanxi University of Finance and Economics, 4(39), 76–87 (in Chinese). [Google Scholar]
41. Qi, S., Fang, Y., Li, K. (2011). Empirical analysis of the regional impact of the knowledge spillover effect of FDI on the energy intensity in China. World Economy Study, 4, 70–75 (in Chinese). [Google Scholar]
42. Marek, K. (2010). Reference groups and complaints about inequality. Journal for Perspectives of Economic Political and Social Integration, 3(12), 97–118. [Google Scholar]
43. Cowell, F. A., Ebert, U. (2004). Complaints and inequality. Social Choice and Welfare, 23(1), 71–89. DOI 10.1007/s00355-003-0237-7. [Google Scholar] [CrossRef]
44. Abatemarco, A. (2010). A note on complaints and deprivation, decision theory and choices: A complexity approach. Milan: New Economic Windows. [Google Scholar]
45. Pedersen, A. W. (2004). Inequality as relative deprivation: A sociological approach to inequality measurement. Acta Sociologica, 47(1), 31–49. DOI 10.1177/0001699304041550. [Google Scholar] [CrossRef]
46. Markanya, A., Pedroso-galinato, S., Strsimikience, D. (2006). Energy intensity in transition economies: Is there convergence towards the EU average? Energy Economics, 28(1), 121–145. DOI 10.1016/j.eneco.2005.10.005. [Google Scholar] [CrossRef]
47. Anselin, L. (2013). Spatial econometrics: Methods and models. Berlin: Springer Science and Business Media. [Google Scholar]
48. Li, B., Wu, S. S. (2016). Effects of local and civil environmental regulation on green total factor productivity in China: A spatial Durbin econometric analysis. Journal of Cleaner Production, 234, 1–12. [Google Scholar]
49. Barro, R. J. (2016). Economic growth and convergence, applied to China. China & World Economy, 24(5), 5–19. DOI 10.1111/cwe.12172. [Google Scholar] [CrossRef]
50. Ramos, R. (2005). Advances in spatial econometrics. Methodology, tools and applications. Investigaclones. Regionales, 45, 866–870. [Google Scholar]
51. Eihorst, J. P. (2014). Spatial econometrics: From cross-sectional data to spatial panels. New York: Heidelberg. [Google Scholar]
52. Baltagi, B. H. (2015). The Oxford handbook of panel data. UK: Oxford Press. [Google Scholar]
53. Lee, L. F., Yu, J. (2010). Some recent developments in spatial panel data models. Regional Science and Urban Economics, 40(5), 255–271. DOI 10.1016/j.regsciurbeco.2009.09.002. [Google Scholar] [CrossRef]
 | This work is licensed under a Creative Commons Attribution 4.0 International License, which permits unrestricted use, distribution, and reproduction in any medium, provided the original work is properly cited. |