| Energy Engineering |
DOI: 10.32604/EE.2021.015032
ARTICLE
Study of Polymer Flooding in Heterogeneous Porous Media by Using Nuclear Magnetic Resonance
Shengli Oil Field, Sinopec Group, Dongying, 257000, China
*Corresponding Author: Xing Zhang. Email: zhxhdpu@126.com
Received: 17 October 2020; Accepted: 12 March 2021
Abstract: Polymer has been successfully used to enhance crude oil recovery at high water cut stage. However, the application of polymer flooding is limited by the heterogeneity of reservoir. In this work, the role of polymer flooding in heterogeneous reservoir was explored by nuclear magnetic resonance (NMR) spectroscopy. Parallel core displacement experiments were carried out to study polymer flooding in heterogeneous formation. The results showed that the polymer flooding area was related to permeability and pore connectivity. At the end of the water flooding stage, the residual oil was not evenly distributed in porous media. The percent crude oil recovery increased with the increase of pore diameter. Crude oil recovery from cores with larger pores was higher, and water broke through the highly permeable core first. After 0.3 PV polymer injection, the water mobility of the high permeability core decreased. Polymer injection showed a dual effect, an oil displacement effect and a traction effect. The oil displacement effect was responsible for driving out the crude oil in large pores, whereas the traction effect was responsible for driving out residual oil from small pores. After 1 PV polymer injection, the polymer solution channeled through the highly permeable core rapidly. The crude oil in large pores was washed out completely. The NMR water-phase spectrum line of the highly permeable core was much higher than that of the low permeable core. Under different core permeability and porosity, the NMR peak of the crude oil-phase spectrum line indicated that the polymer flooding is mainly effective on pores > 40 μm.
Keywords: Nuclear magnetic resonance; relaxation time; polymer flooding; displacement effect; traction effect
The high water cut stage is difficult to be avoided after long-term water flooding in mature oil field [1,2]. Polymer is an effective agent to control the mobility of water, improve sweep volume of injected water and percent crude oil recovery [3–5]. The mechanism of polymer flooding to enhance oil recovery is mainly in two aspects: one is to increase the viscosity of water phase and reduce the mobility of water phase; the other is to decrease the permeability of reservoir because of the adsorption and retention of polymer [6–8]. These two aspects generate a synergistic effect, which makes the mobility of polymer aqueous solution in the crude oil layer obviously decreased. However, reservoir physical parameters, fluid parameters, polymer solution performance and other factors will make different impacts on the polymer flooding [9–11]. These factors seriously influence the improvement of crude oil recovery in the polymer sweeping area [12,13]. Thus, it is necessary to study the mechanism of polymer flooding in reservoirs to provide operation parameters and operation reservoir guidance for enhanced oil recovery by polymer flooding.
With the development of technology, nondestructive testing technology has been applied to the field of petroleum exploration and development [14]. NMR is one of the most effective methods to study the displacement process in heterogeneous formation [15]. Brown and Fatt found that the relaxation time of NMR decreased significantly compared with the free state when the fluid was in the pore of rock [16]. Since then, many scholars have begun to apply NMR technology to the field of petroleum. NMR is used for evaluating formation properties and reservoir fluid properties in the laboratory sample analysis [17]. Stefan Menger and Manfred Prammer compared the formation porosity obtained by nuclear magnetic resonance logging with conventional logging and core analysis porosity [18,19] It is considered that NMR logging can not only obtain effective porosity of formation but also total porosity of formation. M. B. Crone and John P. Korkowitz studied the nuclear magnetic resonance logging crude oil and water resolution ratio, and believed injecting relaxation agent into formation can effectively shorten the relaxation time of water phase. Therefore, it can differentiate formation crude oil and water signals to distinguish different fluids [20].
Relaxation is very important to NMR and its application. And it’s the main information source of NMR core analysis [21]. NMR relaxation is divided into transverse relaxation and longitudinal relaxation. The transverse relaxation time (T2) is usually measured to analyze the physical properties of core samples, because the measurement of longitudinal relaxation time is pretty time-consuming [22,23]. The distribution of T2 spectrum reflects the distribution of pore size, and T2 value is proportional to pore size. The relationship between pore radius and T2 value is determined, and the T2 spectrum of NMR is converted into the pore radius distribution curve, so that the interfacial flow of polymer in the reservoir core can be evaluated by NMR data. There is a cut-off (T2cutoff) value (Fig. 1.) of movable fluid in T2 spectrum. When the relaxation time of fluid T2 is longer than that, all fluids are movable fluids, and conversely are immovable fluids [24,25].
With conventional experimental methods, polymer flooding can only be analyzed by monitoring the flow and pressure of injection and production. In this study, NMR technology was applied to systematically study the mechanism of polymer flooding. And the effects of pore size distribution on water flooding, polymer flooding and subsequent water flooding were studied quantitatively. Besides, it was also used to analyze the distribution of polymer flooding and residual oil in each stage. Finally, the mechanism of polymer flooding was obtained. And the operation parameters and operation reservoir guidance for enhanced oil recovery by polymer flooding were provided.
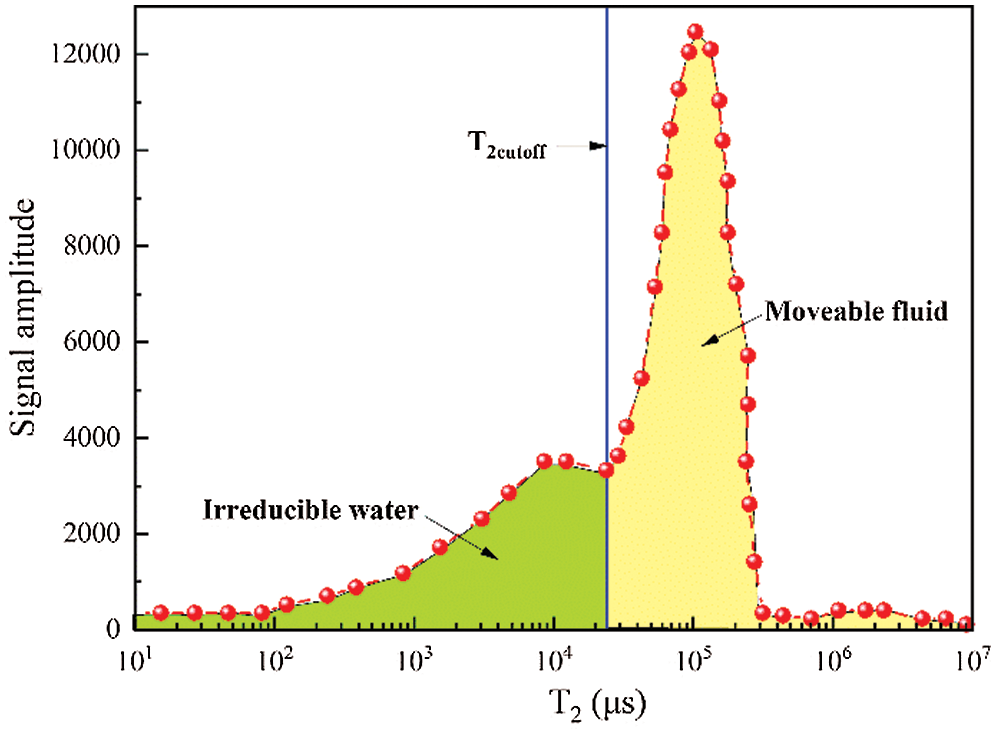
Figure 1: T2cutoff spectrum of fluid in formation
The polymer flooding under different heterogeneous conditions was studied by using cores with different permeability and porosity.
The experimental oil was a mixture of dehydrated crude oil and diesel oil with a volume ratio of 1:3. The density was 0.865 g/cm3 and the viscosity was 9.736 mPa·s in 20°C. The experimental water was simulated formation water (KCL is 4000 mg/L). Paramagnetic ions could accelerate the relaxation process of hydrogen proton in water phase without influencing the relaxation time of hydrogen proton in oil phase. Paramagnetic ions were added in core to distinguish crude oil and water because of diffusion effect. The polymer MO-4000HSF used in this work shows a white powder appearance, and its molecular weight is 20.2 × 10⁶. The hydrolyzing degree of the polymer is 25% to 30%. According to the mixture method developed and recommended by Littman et al. [26], firstly, preparing polymer solution for 2000 mg/L, which was prepared according to the API standard. The solution was filtered through a filter before use, and the viscosity of the polymer was 16.22 mPa·s as the shear rate was 24.5 s–1 and the concentration was 2000 mg/L. Nuclear magnetic resonance analysis was performed on the properties of crude oil and polymer fluid. It can be seen from Fig. 2. that the relaxation time of crude oil is greater than 10 ms and the relaxation time of polymer is less than 10 ms. Thus, crude oil and polymer can be distinguished by relaxation time.
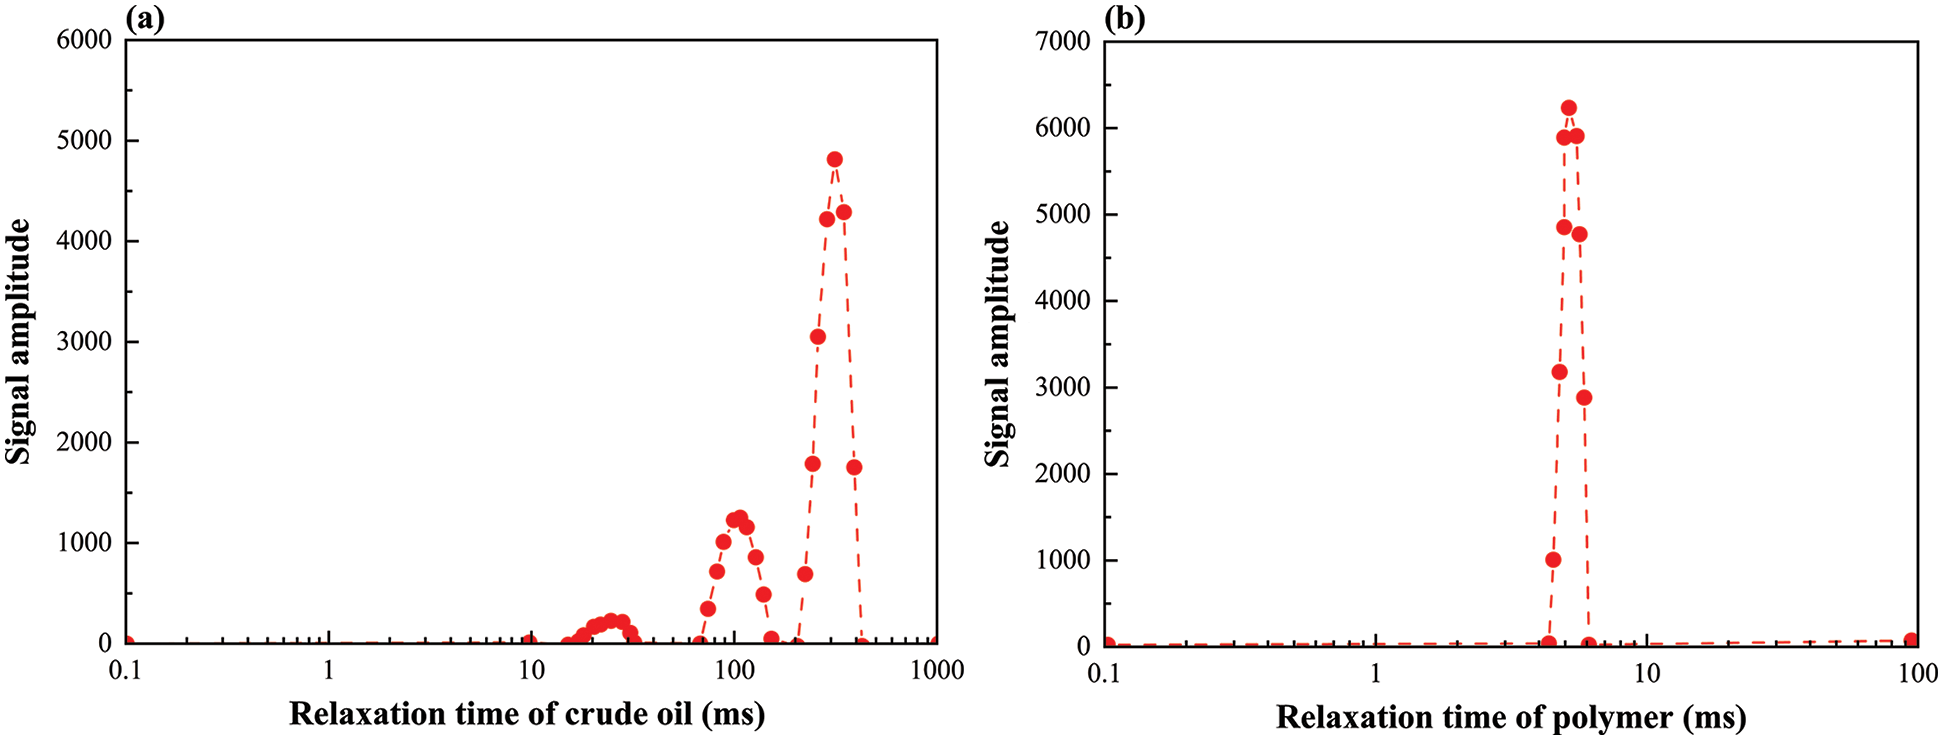
Figure 2: T2 spectral line ((a): spectral line of crude oil; (b): spectral line of polymer)
NMR system is a large scientific research apparatus with complex structure, which can be divided into four parts: superconducting magnet, electronic system, computer processing system and output equipment. The schematic of NMR apparatus is shown in Fig. 3.
The system consists of superconducting NMR instrument, high pressure metering pump, thermostatic water bath, rheometer, electric mixer, high pressure pipeline, high pressure vessel, precision pressure gauge, electronic balance, densitometer and valves.
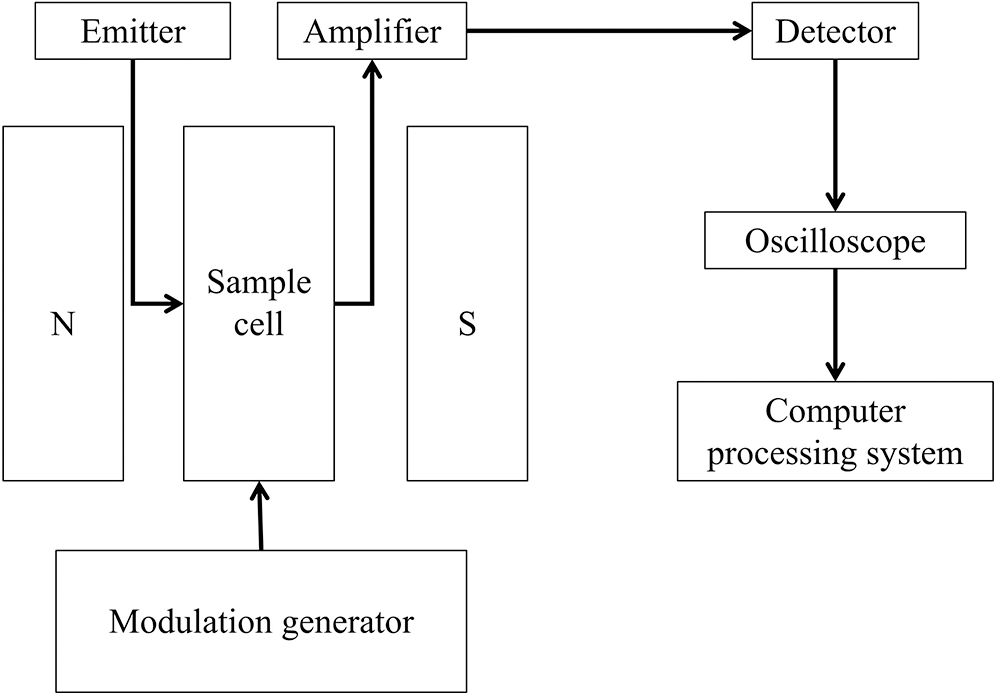
Figure 3: Schematic of NMR apparatus
The experimental temperature was 35°C and the constant displacement flow rate was 0.2 ml/min.
3.2.1 Calibration of Test Samples
The CPMG is the name of pulse sequence, which was built by Carr, Purcell, Meiboom and Gill. The spin echo is released through CPMG pulse sequence to measure the transverse relaxation time. Standard reference laboratory specifications of NMR parameters (SY/T 6490-2000) was shown in Tab. 1.
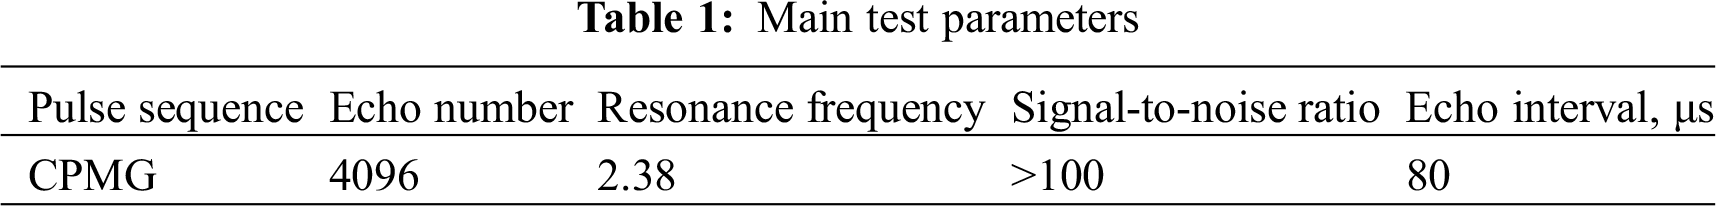
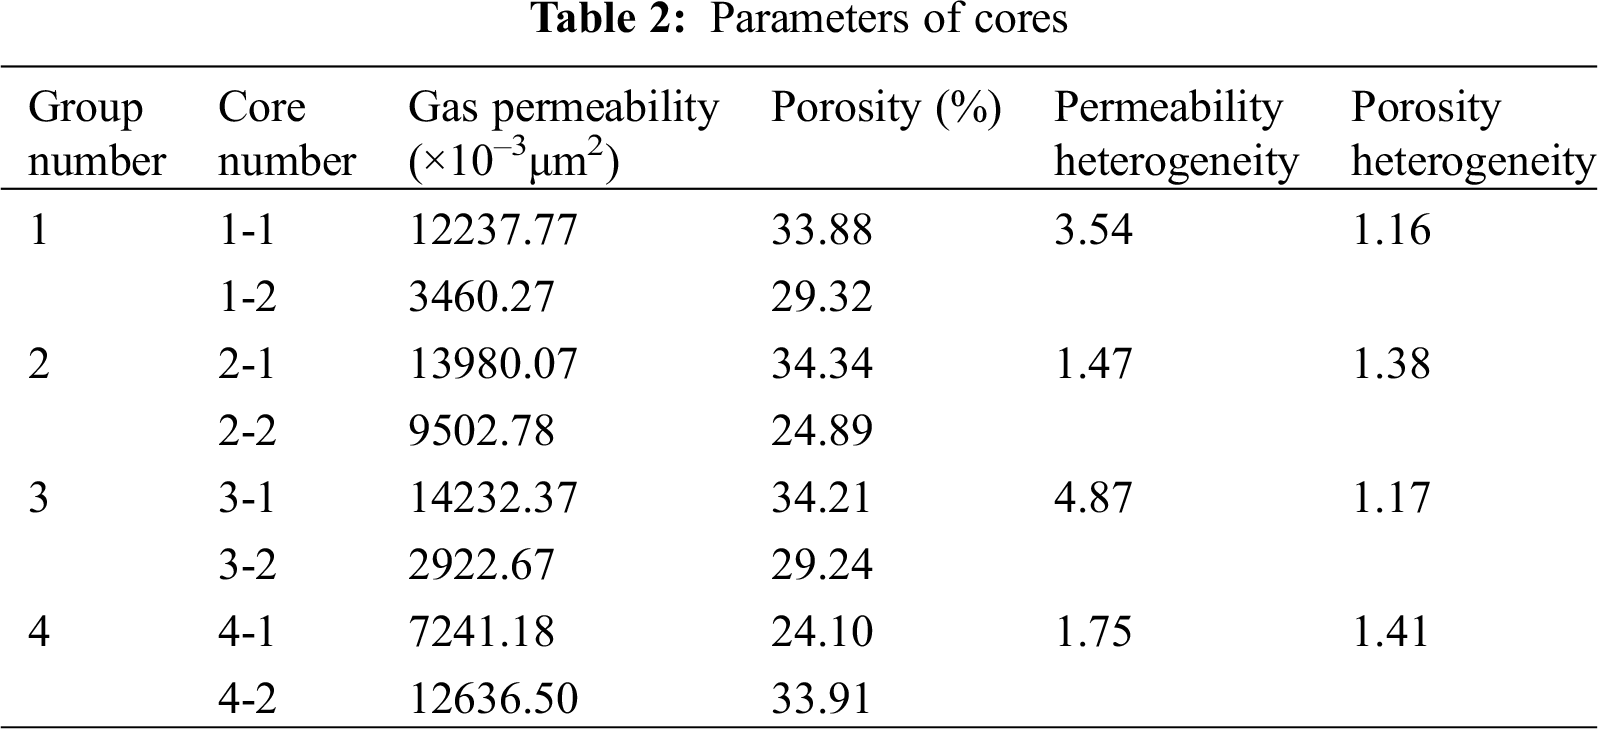
Before the NMR, a calibrated sample was made, which had good stability and its physical and chemical properties did not change with time. More importantly, the sample must not contain paramagnetic substances, so that the sample could be preserved for a long time to calibrate parameters accurately. First, the instrument was tuned to achieve full resonance. The test samples were optimized the parameters according to the sample characteristics, and improved the signal-to-noise ratio for obtaining the corresponding NMR signal data. Calibrate the scale and analyze the data. The parameters of cores were shown in Tab. 2.
3.2.2 The Process of Flooding in Parallel Heterogeneous Core
The cemented cores were made from silica sand of different particle sizes, and the cores were dried in a vacuum drying chamber until constant weight was reached. The dry weight of the cores were weighed, and the length and diameter were measured. The porosity of core samples was measured through helium hole. More methods had been described in the literatures [27]. The gas permeability under six groups of different pressure difference and flow rate was measured for each core, with air as the seepage media. Every core was vacuum-saturated (12 h), and the probe of the NMR analyzer was placed in the core of 100% saturated KCL solution for nuclear magnetic resonance measurement. And the T2 relaxation time spectrum was calculated and the pores’ radius were determined. The oil phase displacing water phase was established, and nuclear magnetic resonance was carried out to obtain the original crude oil content distribution. Two high and low permeability cores were connected in parallel, the water phase was used to displace the oil phase, and when the core was displaced to 100% water, closed it and another core was displaced to 100% water. Nuclear magnetic resonance was performed on the residual oil distribution after water flooding with each core, analyzing the fluid distribution in different pore sizes. At the polymer flooding, the parallel cores were displaced 0.3 PV. Nuclear magnetic resonance was performed on high and low permeability cores, to determine residual oil distribution. When the polymer was displaced out of one core, closed it and continued to drive the other core to the polymer was out of it (1 PV). Nuclear magnetic resonance was performed on the residual oil distribution after water flooding with each core, analyzing the fluid distribution in different pore sizes. Subsequent water flooding (5 PV) was conducted at the same displacement velocity. When the water was out of the high-permeability core, closed it and continued to drive the low-permeability core. Nuclear magnetic resonance was performed on the residual oil distribution after subsequent water flooding with each core. Before the NMR, the sample was rolled on the micro-wet filter paper to remove surface water and reduce measurement error.
The data from each core were processed. The pore size distribution of core was determined by T2 spectrum of NMR. Then, the pore size distribution figures, accumulative pore size distribution figures, lateral relaxation time and signal amplitude figures of each displacement stage were drawn. And the fluid distribution in pore of each displacement stage through the relationship between relaxation time and pore size was analyzed. The effects of high permeability heterogeneity, high porosity heterogeneity on enhanced oil recovery and comprehensive analysis of both were studied as follows.
4.1 High Permeability Heterogeneity
The permeability heterogeneity and porosity heterogeneity of the first group of cores are 3.54 and 1.16, respectively. The fitting curve of the original data after polymer injection is shown in Fig. 4a. According to the figure, the data fit well. The accumulative distribution frequency of different pore sizes is shown in Fig. 4b. The pore size of the cores is uneven and mainly distributed in the range of 10–20 μm. According to IUPAC [28] classification, the pore size is between capillary pore and large capillary pore, of which 71% is capillary pore and 26% is large capillary pore.
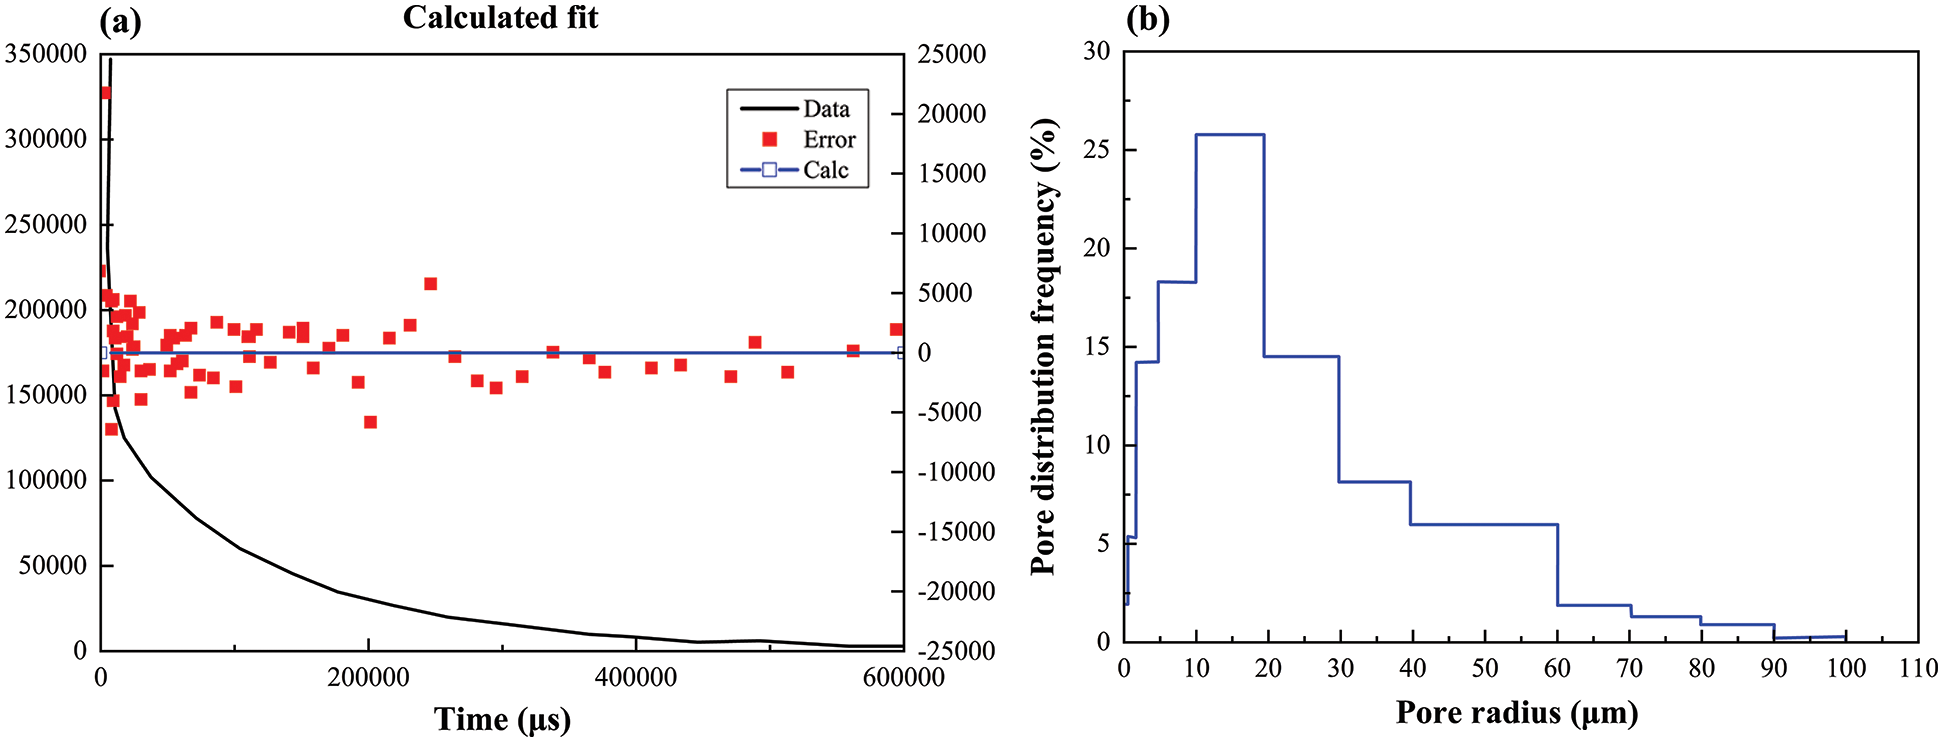
Figure 4: Core 1-2 ((a): Fitting curve of raw data (0.3 PV); (b): Pore cumulative distribution frequency)
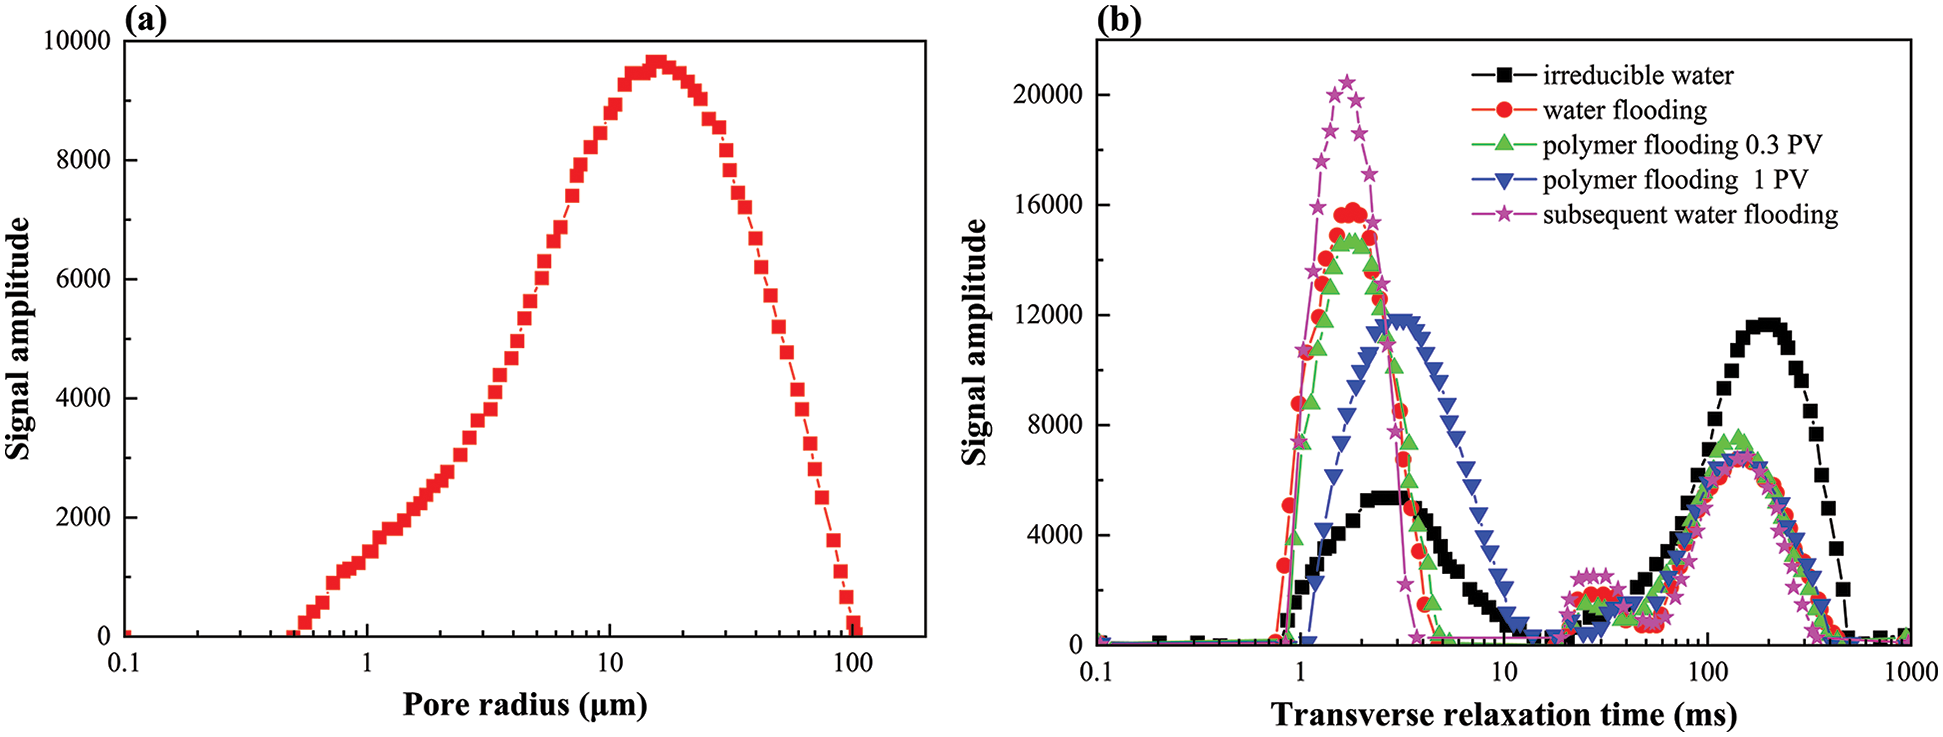
Figure 5: NMR spectrum of core 1-2 at different stages of displacement ((a): pore distribution spectrum; (b): displacement spectrum)
The core 1–2 is a low permeability core in which 80% of the pore radius is less than 30 μm and it is concentrated on 10–20 μm (Fig. 5a). The crude oil contents in the pore which diameter greater than 4 μm decreased during water flooding, and the spectral line of pore diameter greater than 30 μm decreased the most, it drove the most oil and contributed most to ater drive recovery.
The displacement spectrum of core 1-2 is shown in Fig. 5b. At 0.3 PV polymer injection, the residual oil in the pore diameter greater than 40 μm was mainly driven out. At the same time, part of the crude oil in 6–10 μm pore was pulled out because of the traction effect. During the second polymer flooding, the crude oil in the 20–40 μm pore was driven out. At the same time, part of the crude oil was driven to 10–20 μm and 60–90 μm. As the polymer molecular diameter was larger than the pore diameter and failed to enter the pore, the polymer viscoelastic effect (Due to its viscoelasticity, the polymer produced tensile effects on oil film or oil droplet in the flow process, which increased the carrying force and improved the displacement efficiency [29]) drove out most crude oil within 5–10 μm. In the subsequent water flooding, crude oil in 50–100 μm pore and 10–20 μm pore was driven out, and part of crude oil was driven to 5–10 μm pore.
The core 1-1 is a high permeability core, in which pore size is mainly distributed in 10–60 μm, and the capillary pores account for 62%. The accumulative distribution frequency of different pore sizes is shown in Fig. 6.
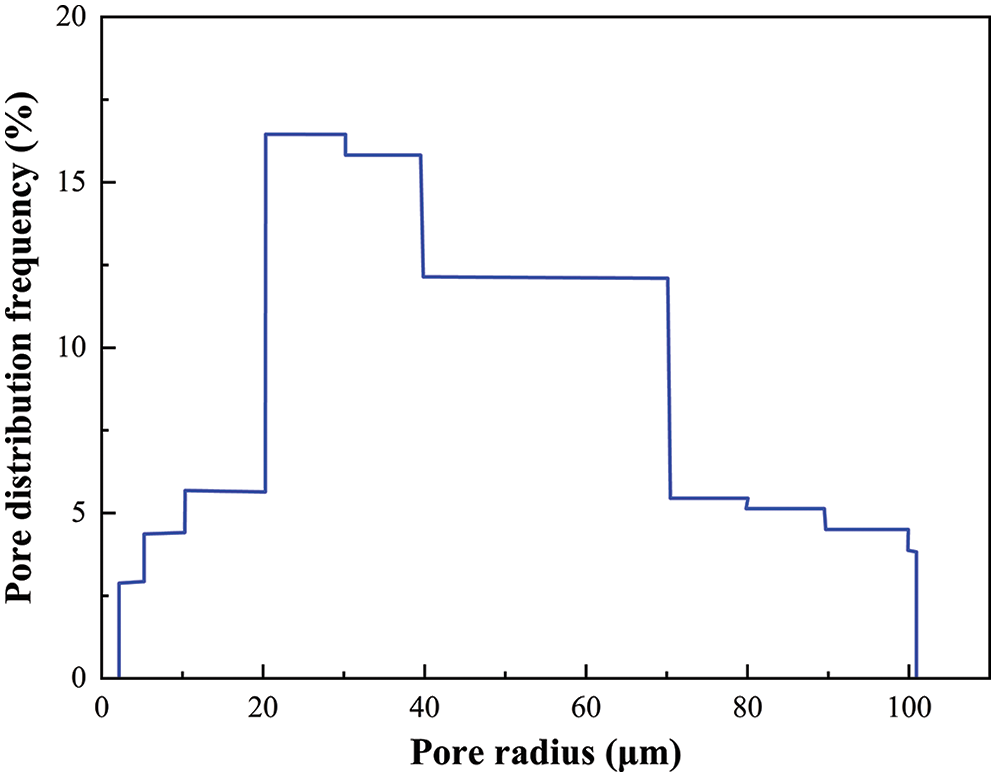
Figure 6: Pore cumulative distribution frequency of core 1-1
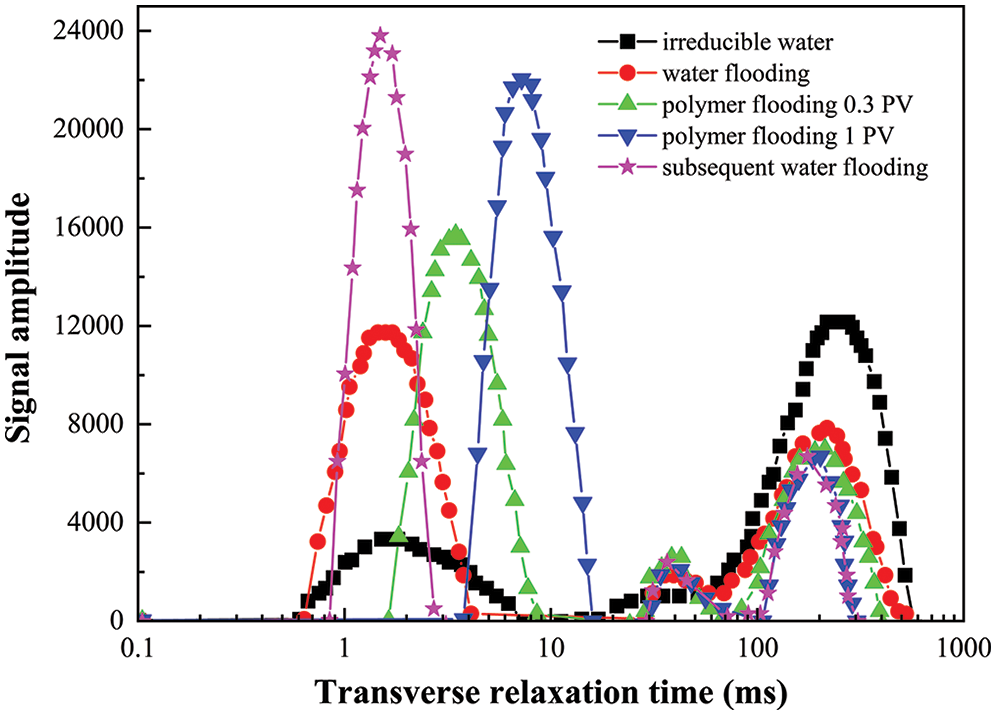
Figure 7: NMR spectrum of core 1-1 at different stages of displacement
This core is a high permeability core. Crude oil in the pore radius of 10-140 μm was all reduced when water flooding, mainly the pore diameter was greater than 30 μm. The displacement spectrum of core 1-1 is shown in Fig. 7. After 0.3 PV polymer injection, the polymer mainly displaced crude oil with pore size greater than 67 μm. The crude oil was pulled in pore with the size of 13–28 μm due to its viscoelasticity. No secondary crude oil migration occurred in high permeability core, and crude oil was displaced along the effective connected pore. After 1 PV polymer injection, the residual oil of 24–111 μm aperture continued to be uniformly driven out. Because of the high permeability of the core, the crude oil in the macro pore was continuously uniformly displaced. The crude oil in the 60–83 μm pore continued to decrease, and the crude oil in the 8–12 μm pore increased. The crude oil in the 12–20 μm pore decreased, and the crude oil migrated again.
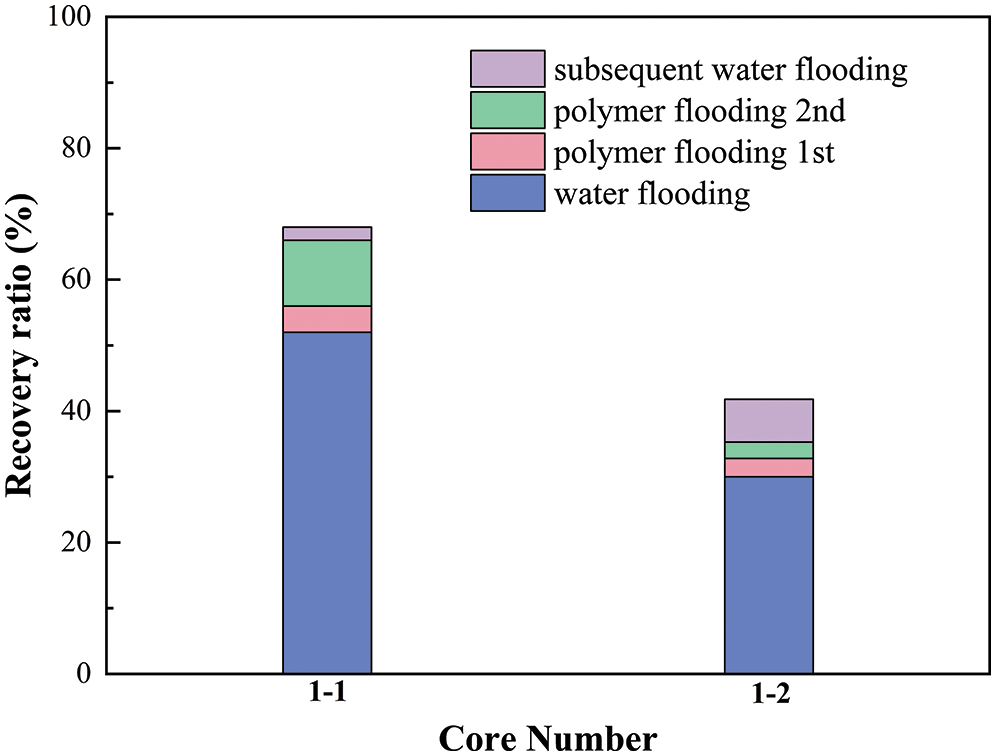
Figure 8: Recovery efficiency of core 1-1 and 1-2 at different stages of displacement
The crude oil recovery of high permeability core was higher than that of low permeability core in water flooding, polymer primary flooding and polymer secondary flooding. The crude oil recovery increment of low permeability core was higher than that of high permeability core in the subsequent water flooding, while ultimately the crude oil recovery of high permeability core was higher than that of low permeability core. The recovery efficiency of 1-1 and 1-2 is shown in Fig. 8.
The polymer flooding efficiency of high permeability cores was different to low permeability cores. When 0.3 PV was injected into the high permeability core, the polymer mainly entered the pore greater than 67 μm, and the cumulative frequency accounted for 24%. In low permeability core, polymer mainly entered pore larger than 40 μm, and the cumulative frequency was 10%. It could be seen that the polymer mainly entered high permeability pores. Secondary polymer flooding mainly displaced residual oil with pore diameter greater than 20 μm, and polymer broke through in high permeability were preferred in parallel injection. During the subsequent water flooding, the residual oil in low permeability core was distributed among 15–83 μm, the peak spectral line was 37 μm in pore diameter, and the high permeability core was mainly distributed in 28–77 μm. The peak of the spectrum was 50 μm.
4.2 High Porosity Heterogeneity
The permeability heterogeneity and porosity heterogeneity of the second group of cores are 1.47 and 1.38, respectively. The accumulative distribution frequency of different pore sizes is shown in Fig. 9. The Permeability of core 2-2 is 9.502 μm2, and pore radius greater than 30 μm accounts for 83% of the pore distribution. It is mainly large capillary pore and the pore radius is mainly 40–60 μm and 100–150 μm.
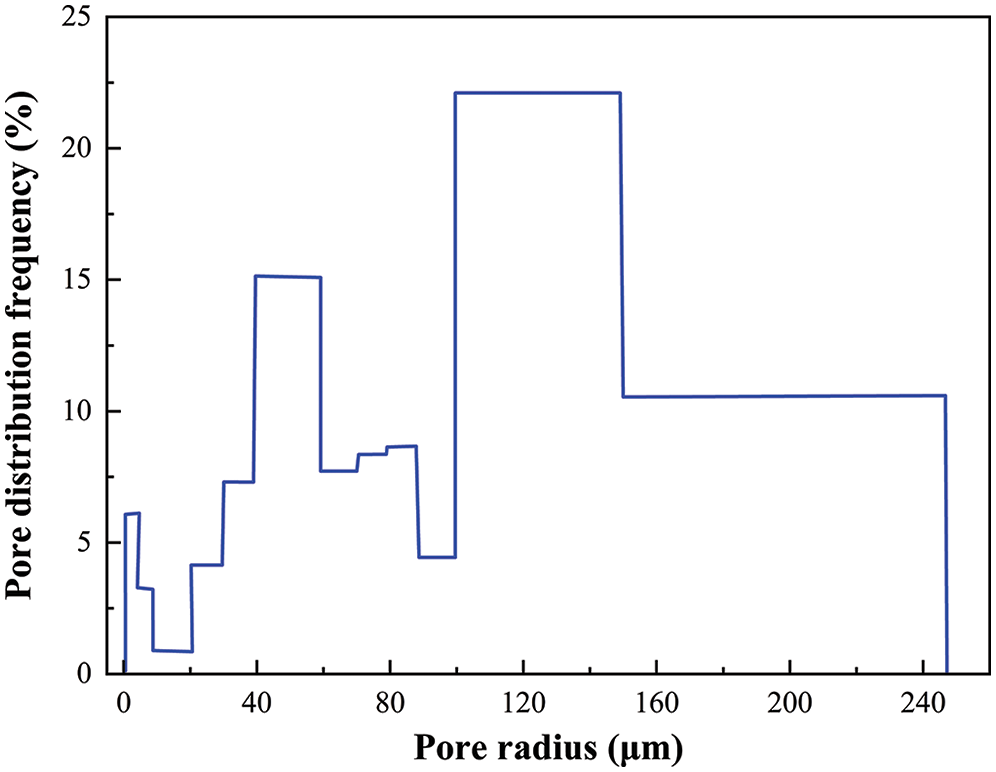
Figure 9: Pore cumulative distribution frequency of core 2-2
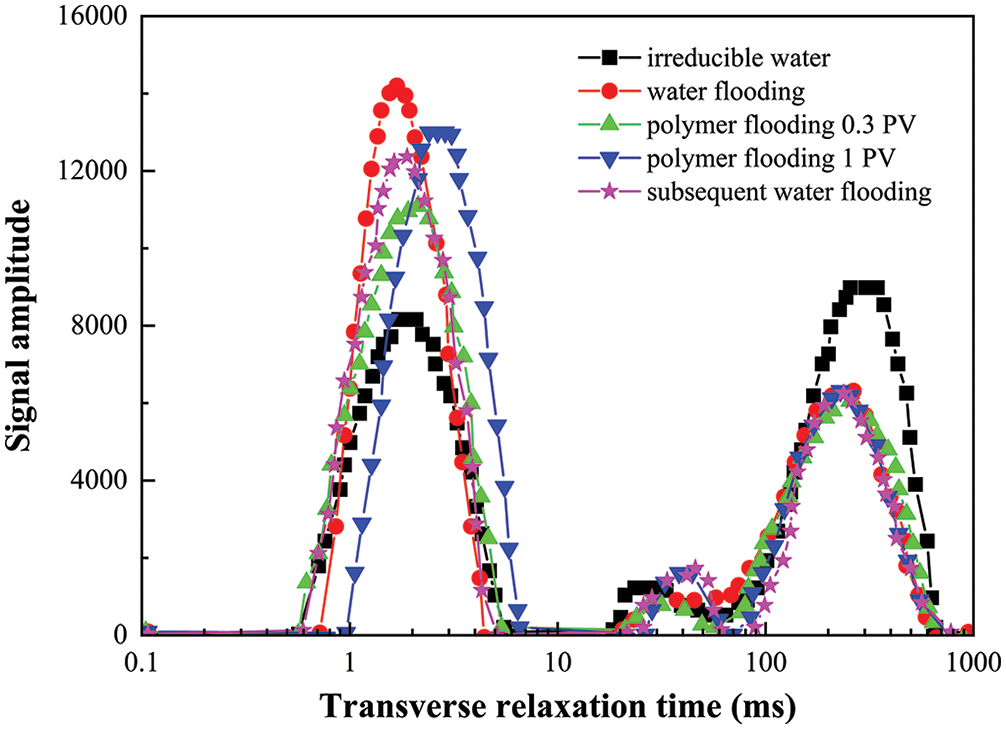
Figure 10: NMR spectrum of core 2-2 at different stages of displacement
Water flooding mainly drove crude oil with pore radius greater than 40 μm, but the pore radius which was greater than 80 μm contributed most to water flooding recovery. The displacement spectrum of core 2-2 is shown in Fig. 10. After 0.3 PV polymer injection, 50–70 μm crude oil was mainly displaced, 90–150 μm pore radius crude oil increased and crude oil migrated. When polymer secondary flooding was injected into 1 PV, 70–160 μm pore radius crude oil decreased, 37–70 μm pore radius crude oil increased and 20–37 μm pore radius crude oil decreased. In the subsequent water flooding, the pore size of the crude oil was reduced by more than 20 μm, and the pore size of 9–20 μm increased.
The pore diameter of core 2-1 is larger than 50 μm (large capillary pore) 64%, and the pore size mainly concentrates on 10–60 μm. The accumulative distribution frequency of different pore sizes is shown in Fig. 11.
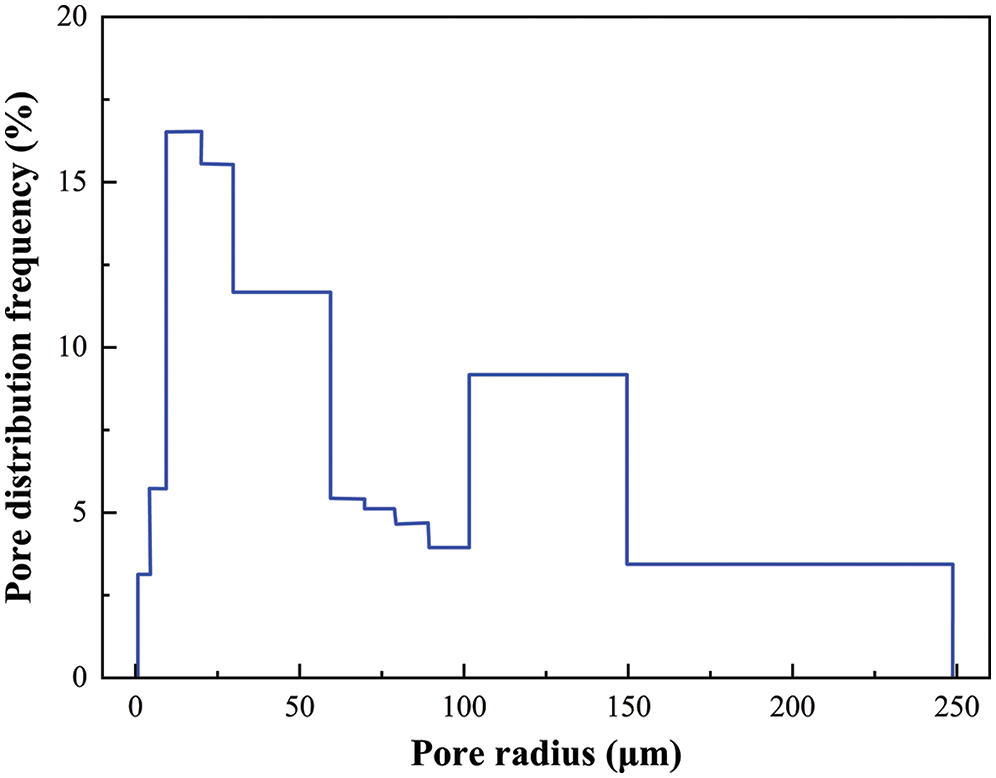
Figure 11: Pore cumulative distribution frequency of core 2-1
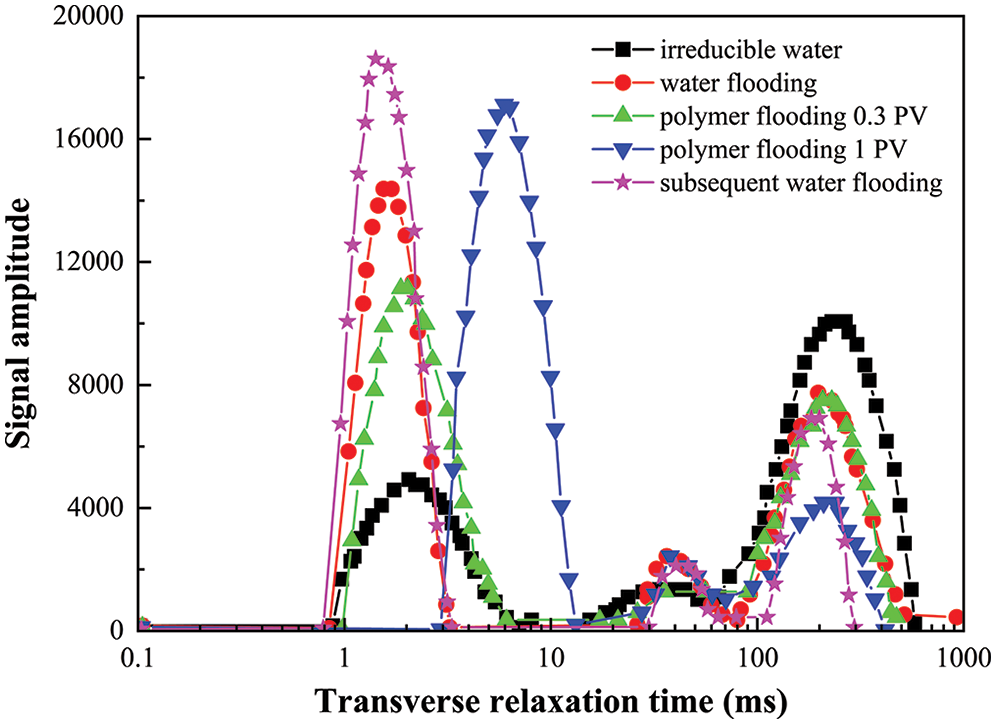
Figure 12: NMR spectrum of core 2-1 at different stages of displacement
Water flooding mainly drove crude oil in pores larger than 20 μm, and the crude oil in each pore was uniformly reduced. The displacement spectrum of core 2-1 is shown in Fig. 12. In the first polymer flooding, crude oil was mainly driven in the pores of 111–150 μm, 30–50 μm, and 14–24 μm. Crude oil in 7–14 μm pores was reduced. After 1 PV polymer injection, crude oil in 3–14 μm, 26–103 μm pores reduced, and crude oil in 15–20 μm pores increased. In the subsequent water flooding, the crude oil in the 30–60 μm pores increased, the crude oil in the remaining 15–30 μm pores was completely driven out, and the crude oil in the 8–13 μm pores increased. The crude oil underwent secondary migration.
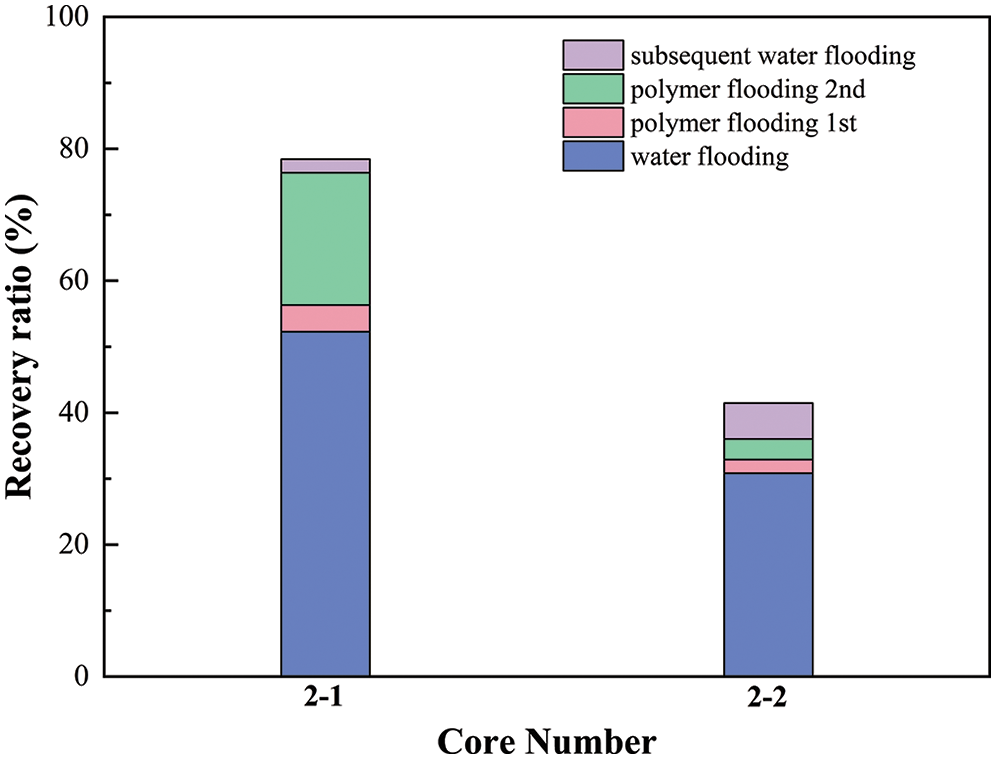
Figure 13: Recovery efficiency of core 2-1 and 2-2 at different stages of displacement
The recovery efficiency of 2-1 and 2-2 is shown in Fig. 13. The permeability heterogeneity of this group core is low. However, the porosity of core 2-1 is much higher than that of 2-2. Therefore, the crude oil recovery of high porosity core was higher than that of low porosity core in water flooding, polymer primary flooding and polymer secondary flooding. The crude oil recovery increment of low porosity core was high than that of high porosity core in the susequent water flooding, but ultimately the crude oil recovery of high porosity core was higher than that of low porosity core.
4.3 Comprehensive Analyzation of Permeability and Porosity
The permeability heterogeneity and porosity heterogeneity of the third group of cores are 4.87 and 1.17, respectively.
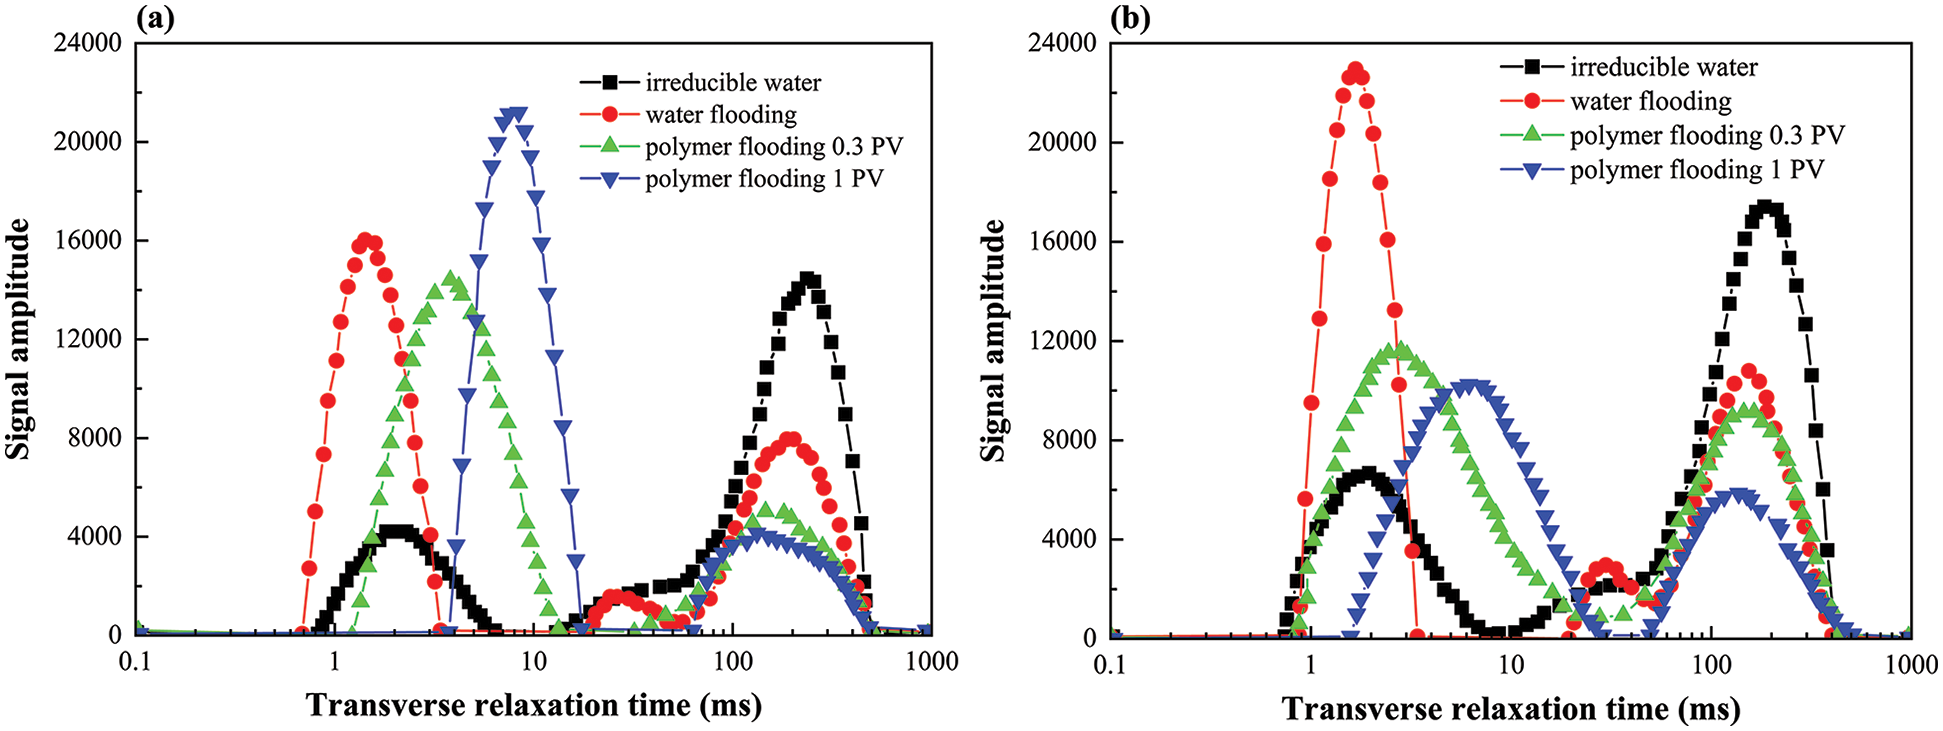
Figure 14: NMR spectrum of core 3-1 (a) and 3-2 (b) at different stages of displacement
The core 3-1 is a high permeability core. Most of the pores are larger than 40 μm. The displacement spectrum of core 3-1 is shown in Fig. 14a. In water flooding, the crude oil in 8–110 μm pores diameter decreased evenly, and the crude oil in 40–70 μm pores diameter decreased most. The oil displacement efficiency was high. Polymer mainly displaced crude oil in pore diameters larger than 30 μm and crude oil in 5–8 μm. Crude oil in pore diameters of 12–24 μm increased and secondary migration occurred. When the polymer was injected into 1 PV, the crude oil in pore of 8–15 μm decreased, the crude oil in pore of 8–16 μm and 30–90 μm decreased, the crude oil in pore of 16–30 μm increased, and the crude oil in pore of 60–120 μm remained unchanged. During the subsequent flooding, the crude oil in the pores larger than 60 μm continued to decrease, and crude oil increased in the pore of 30–60 μm.
The core 3–2 is a low permeability core. The displacement spectrum of core 3-2 is shown in Fig. 14b. In the process of water flooding, the crude oil in the pores of 11–110 μm uniformly decreased, and the crude oil in the pores of 40–70 μm decreased more and contributed more to the recovery efficiency of water flooding. At 0.3 PV polymer injection, the crude oil in the pores of 6–10 μm and 30–0 μm was driven out. At the same time, the crude oil in the pores of 10–20 μm increased, resulting in secondary crude oil migration. At 1 PV polymer injection, the crude oil in the pores larger than 24 μm was driven out again, and the crude oil in the pores of 8–15 μm was driven out again. In the subsequent water flooding, the crude oil in the pores larger than 60 μm was driven out, and part of the crude oil transport was shifted to the pores of 30–60 μm.
The permeability heterogeneity and porosity heterogeneity of the fourth group of cores are 1.75 and 1.41, respectively.
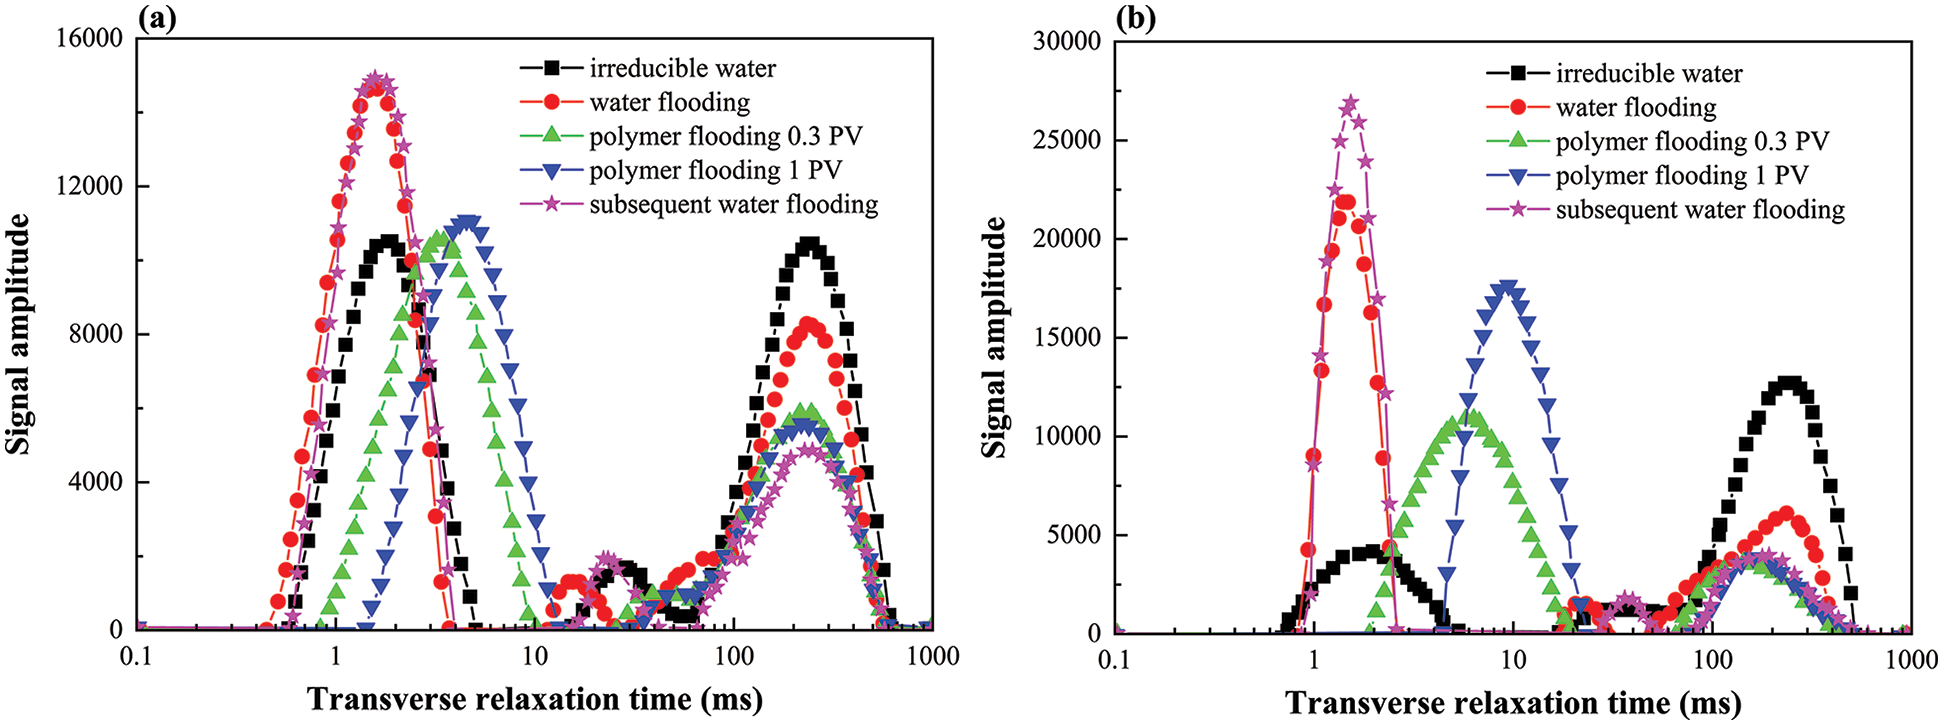
Figure 15: NMR spectrum of core 4-1 (a) and 4-2 (b) at different stages of displacement
In water flooding, the crude oil in 20–180 μm pores was driven out uniformly. The displacement spectrum of core 4-1 is shown in Fig. 15a. At 0.3 PV polymer injection, the crude oil in the pores of 40–130 μm and 7–10 μm was mainly driven out. At 1 PV polymer injection, the crude oil in the 50–70 μm pores decreased, while the crude oil in the 10–20 μm and 4–8 μm pores increased. In the subsequent water flooding, the residual oil within the pore diameter of more than 30 μm was mainly driven out, and the residual oil in the pores of 40–90 μm was the most.
In water flooding, crude oil with pore diameter greater than 20 μm was mainly driven out, and crude oil decreased most in 40–90 μm. The displacement spectrum of core 4–2 is shown in Fig. 15b. At 0.3 PV polymer injection, the crude oil in the 14–111 μm pores decreased, and the crude oil in the larger than 46 μm pore is mainly displaced. The crude oil in the 111–140 μm pore increased and secondary crude oil migration occurred. At 1 PV polymer injection, crude oil in 16–30 μm pore decreased, and 30–70 μm pore crude oil increased, and crude oil in 7–13 μm pore increased in the subsequent water flooding.
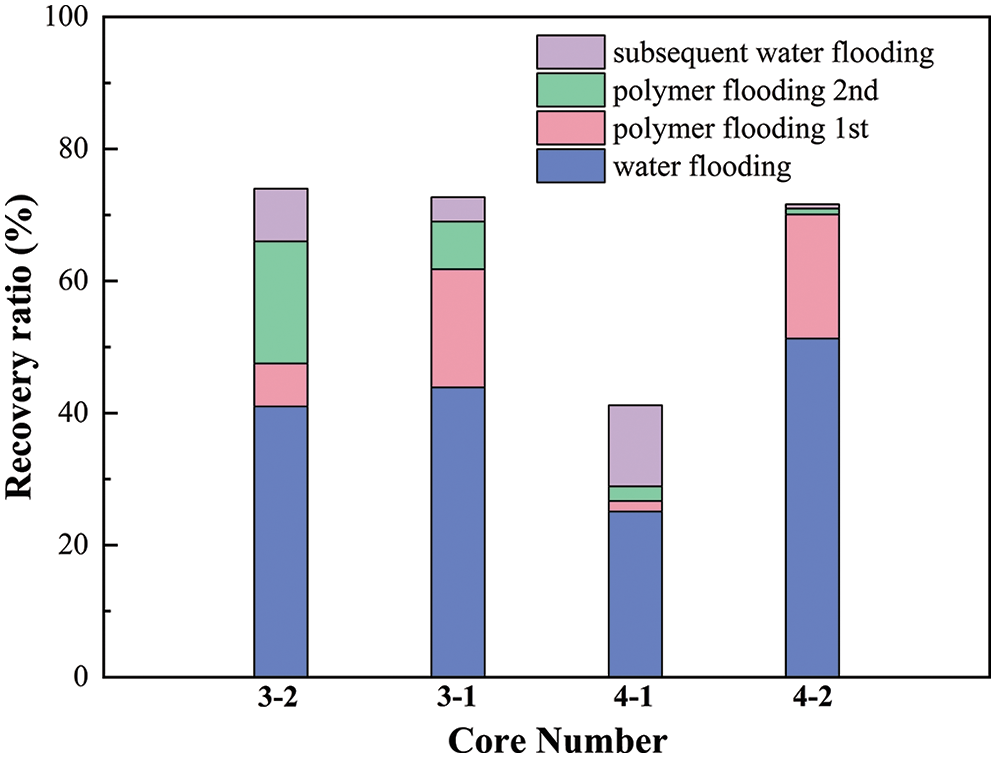
Figure 16: Recovery efficiency of cores at different stages of displacement
The recovery efficiency of two groups of parallel cores at each displacement stage is shown in Fig. 16. After 100% water cut of high permeability core, low permeability core was continued to drive until 100% water cut. The recovery efficiency of high permeability core in water flooding stage was higher than that of low permeability core. After 0.3 PV polymer injection in parallel, the enhanced crude oil recovery of high permeability core was higher than that of low permeability core. Continue to inject 1 PV polymer, the polymer was preferred in flooding of high permeability core, low permeability core stopped producing fluid. After polymer was injected into high permeability core alone, pressure rose. After 1 PV polymer injection, the recovery increment of low permeability core was three times higher than that of high permeability core. In the subsequent water flooding, polymer still took precedence over high permeability breakthrough. In water flooding and the first polymer flooding, the polymer mainly entered the high permeability core, and the low permeability core could not enter effectively because of the influence of pore size and its distribution, and the recovery efficiency was low.
For 4-1 and 4-2 parallel cores, the condition was similar to that of the above cores, but the permeability of core 4-1 is 2.5 times that of core 3-2. The recovery efficiency of core 4-1 in water flooding, polymer flooding was lower than that of core 3-2. Because the porosity of core 3-2 (0.29) was higher than that of core 4-1 (0.24). Therefore, the recovery efficiency of polymer flooding was not only related to permeability, but also to pore size and connectivity. Core 4-1 had large connected throats. Because of the difference in pore size distribution, polymer flooding could not enter medium pore size, and only flow along the large throat. The enhanced crude oil recovery of primary and secondary polymer flooding was low. In the subsequent water flooding, polymer displaced the crude oil in the smaller pore.
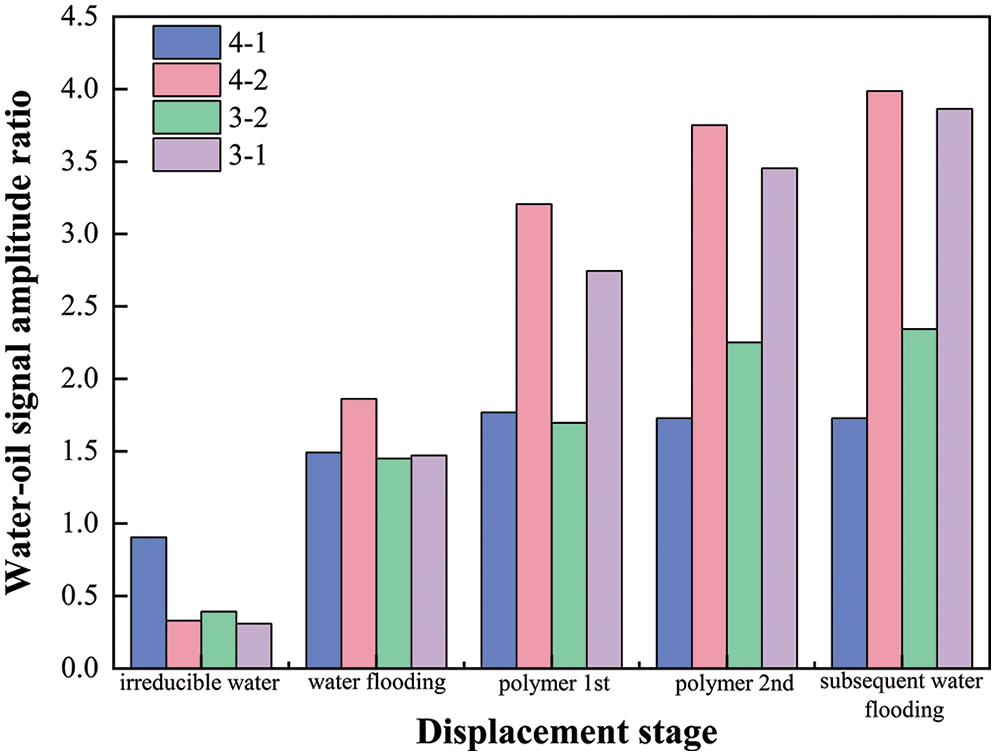
Figure 17: Signal ratio of water and crude oil
The signal amplitude ratio of parallel core water and crude oil is shown in Fig. 17. As the displacement stage progressed, more and more water entered the pores, resulting in the variation of water and oil signal amplitude. The water-oil signals of high permeability core increased more than similar parabola, and changed greatly in each displacement stage. The water-oil signals of low permeability cores increased faster than the initial ones, and then gently.
In this paper, polymer flooding in heterogeneous porous media was investigated by using nuclear magnetic resonance. The following conclusions could be drawn.
(1) During water flooding, the crude oil recovery improved with the increase of pore size. Water displaced crude oil in large pore size preferentially. The high permeability core gave priority to water immersion along the edge of large pore and throat to form viscous fingering.
(2) In the process of polymer flooding, the polymer preferentially entered along with the high permeability layer which was influenced by heterogeneity. The polymer has a dual effect, displacement effect and traction effect. The crude oil displacement effect is to drive out the large-aperture crude oil, the traction effect is to drive out the residual oil with low-aperture, so that crude oil in the pore is redistributed.
(3) The crude oil recovery efficiency is influenced by permeability and porosity. High permeability, high porosity and uniform pore distribution contribute to high recovery efficiency. No matter what kind of heterogeneity, the peak of oil-phase line indicates that the polymer flooding is mainly effective on pores larger than 40 μm.
Acknowledgement: We thank other colleagues of Shengli oil field for their kind help in this work.
Funding Statement: The author received no specific funding for this study.
Conflicts of Interest: The author declares that they have no conflicts of interest to report regarding the present study.
1. Feng, Q., Zhang, J., Wang, S., Wang, X., Cui, R. et al. (2017). Unified relative permeability model and waterflooding type curves under different levels of water cut. Journal of Petroleum Science and Engineering, 154(1), 204–216. DOI 10.1016/j.petrol.2017.04.031. [Google Scholar] [CrossRef]
2. Sun, K., Liu, H., Wang, Y., Ge, L., Gao, J. et al. (2020). Novel method for inverted five-spot reservoir simulation at high water-cut stage based on time-varying relative permeability curves. ACS Omega, 5(22), 13312–13323. DOI 10.1021/acsomega.0c01388. [Google Scholar] [CrossRef]
3. Rego, F. B., Botechia, V., Schiozer, D. (2017). Heavy oil recovery by polymer flooding and hot water injection using numerical simulation. Journal of Petroleum Science and Engineering, 153, 187–196. DOI 10.1016/j.petrol.2017.03.033. [Google Scholar] [CrossRef]
4. Pogaku, R., Fuat, N. H. M., Sakar, S., Cha, Z. W., Musa, N. et al. (2018). Polymer flooding and its combinations with other chemical injection methods in enhanced oil recovery. Polymer Bulletin, 75(4), 1753–1774. DOI 10.1007/s00289-017-2106-z. [Google Scholar] [CrossRef]
5. Saha, R., Uppaluri, R. V., Tiwari, P. (2018). Silica nanoparticle assisted polymer flooding of heavy crude oil: Emulsification, rheology, and wettability alteration characteristics. Industrial & Engineering Chemistry Research, 57(18), 6364–6376. DOI 10.1021/acs.iecr.8b00540. [Google Scholar] [CrossRef]
6. Cinar, Y., Jessen, K., Berenblyum, R., Juanes, R., Orr, F.,Jr (2014). An experimental and numerical investigation of crossflow effects in two-phase displacements. SPE Annual Technical Conference and Exhibition. DOI 10.2118/90568-MS. [Google Scholar] [CrossRef]
7. Silva, I. P., Aguiar, A. A., Rezende, V. P., Monsores, A. L., Lucas, E. F. (2018). A polymer flooding mechanism for mature oil fields: Laboratory measurements and field results interpretation. Journal of Petroleum Science and Engineering, 161(2014), 468–475. DOI 10.1016/j.petrol.2017.12.008. [Google Scholar] [CrossRef]
8. Shen, P., Wang, J., Yuan, S., Zhong, T., Jia, X. (2009). Study of enhanced-oil-recovery mechanism of alkali/surfactant/polymer flooding in porous media from experiments. SPE Journal, 14(2), 237–244. DOI 10.2118/126128-PA. [Google Scholar] [CrossRef]
9. Agi, A., Junin, R., Gbonhinbor, J., Onyekonwu, M. (2018). Natural polymer flow behaviour in porous media for enhanced oil recovery applications: a review. Journal of Petroleum Exploration and Production Technology, 8(4), 1349–1362. DOI 10.1007/s13202-018-0434-7. [Google Scholar] [CrossRef]
10. Akbari, S., Mahmood, S. M., Nasr, N. H., Al-Hajri, S., Sabet, M. (2019). A critical review of concept and methods related to accessible pore volume during polymer-enhanced oil recovery. Journal of Petroleum Science and Engineering, 182(7), 106263. DOI 10.1016/j.petrol.2019.106263. [Google Scholar] [CrossRef]
11. Firozjaii, A. M., Saghafi, H. R. (2020). Review on chemical enhanced oil recovery using polymer flooding: Fundamentals, experimental and numerical simulation. Petroleum, 6(2), 115–122. DOI 10.1016/j.petlm.2019.09.003. [Google Scholar] [CrossRef]
12. Li, J., Jiang, H., Xiao, K., Zhang, Z., Wang, Y. (2016). The relationship between the sweep efficiency and displacement efficiency of function polymer in heterogeneous reservoir after polymer flood. Particulate Science and Technology, 35(3), 355–360. DOI 10.1080/02726351.2016.1160461. [Google Scholar] [CrossRef]
13. Yu, Q., Liu, Y., Liang, S., Tan, S., Sun, Z. et al. (2019). Experimental study on surface-active polymer flooding for enhanced oil recovery: A case study of Daqing placanticline oilfield, NE China. Petroleum Exploration and Development, 46(6), 1206–1217. DOI 10.1016/S1876-3804(19)60274-0. [Google Scholar] [CrossRef]
14. Rosenbrand, E., Fabricius, I. L., Fisher, Q., Grattoni, C. (2015). Permeability in Rotliegend gas sandstones to gas and brine as predicted from NMR, mercury injection and image analysis. Marine and Petroleum Geology, 64, 189–202. DOI 10.1016/j.marpetgeo.2015.02.009. [Google Scholar] [CrossRef]
15. Toumelin, E., Torres-Verdín, C., Sun, B., Dunn, K. J. (2007). Random-walk technique for simulating NMR measurements and 2D NMR maps of porous media with relaxing and permeable boundaries. Journal of Magnetic Resonance, 188(1), 83–96. DOI 10.1016/j.jmr.2007.05.024. [Google Scholar] [CrossRef]
16. van der Zwaag, C., Stallmach, F., Skjetne, T., Veliyulin, E. (2001). NMR response of non-reservoir fluids in sandstone and chalk. Magnetic Resonance Imaging, 19(3–4), 543–545. DOI 10.1016/S0730-725X(01)00289-2. [Google Scholar] [CrossRef]
17. Zhang, G. Q., Hirasaki, G. (2003). CPMG relaxation by diffusion with constant magnetic field gradient in a restricted geometry: Numerical simulation and application. Journal of Magnetic Resonance, 163(1), 81–91. DOI 10.1016/S1090-7807(03)00108-3. [Google Scholar] [CrossRef]
18. Wang, R., Pavlin, T., Rosen, M. S., Mair, R. W., Cory, D. G. et al. (2005). Xenon NMR measurements of permeability and tortuosity in reservoir rocks. Magnetic Resonance Imaging, 23(2), 329–331. DOI 10.1016/j.mri.2004.11.044. [Google Scholar] [CrossRef]
19. Mai, A., Kantzas, A. (2002). An evaluation of the application of low field NMR in the characterization of carbonate reservoirs. SPE Annual Technical Conference and Exhibition. DOI 10.2118/77401-MS. [Google Scholar] [CrossRef]
20. Freedman, R., Heaton, N. (2004). Fluid characterization using nuclear magnetic resonance logging. Petrophysics, 45(3), 241–250. [Google Scholar]
21. Sun, X., Yao, Y., Liu, D., Zhou, Y. (2018). Investigations of CO2-water wettability of coal: NMR relaxation method. International Journal of Coal Geology, 188, 38–50. DOI 10.1016/j.coal.2018.01.015. [Google Scholar] [CrossRef]
22. Connolly, P. R., Yan, W., Zhang, D., Mahmoud, M., Verrall, M. et al. (2019). Simulation and experimental measurements of internal magnetic field gradients and NMR transverse relaxation times (T2) in sandstone rocks. Journal of Petroleum Science and Engineering, 175, 985–997. DOI 10.1016/j.petrol.2019.01.036. [Google Scholar] [CrossRef]
23. Wu, B., Zhou, K., He, Y., Chai, X., Dai, X. (2019). Unraveling the water states of waste-activated sludge through transverse spin-spin relaxation time of low-field NMR. Water Research, 155(1), 266–274. DOI 10.1016/j.watres.2019.02.031. [Google Scholar] [CrossRef]
24. Li, P., Sun, W., Wu, B., Gao, Y., Du, K. (2018). Occurrence characteristics and influential factors of movable fluids in pores with different structures of Chang 63 reservoir, Huaqing Oilfield, Ordos Basin, China. Marine and Petroleum Geology, 97(5), 480–492. DOI 10.1016/j.marpetgeo.2018.07.033. [Google Scholar] [CrossRef]
25. Zheng, S., Yao, Y., Elsworth, D., Wang, B., Liu, Y. (2020). A novel pore size classification method of coals: Investigation based on NMR relaxation. Journal of Natural Gas Science and Engineering, 81(4), 103466. DOI 10.1016/j.jngse.2020.103466. [Google Scholar] [CrossRef]
26. AlSofi, A. M., Blunt, M. J. J. S. J. (2010). Streamline-based simulation of non-Newtonian polymer flooding. SPE Journal, 15(4), 895–905. DOI 10.2118/123971-PA. [Google Scholar] [CrossRef]
27. Wang, R., Mair, R., Rosen, M., Cory, D., Walsworth, R. (2004). Simultaneous measurement of rock permeability and effective porosity using laser-polarized noble gas NMR. Physical Review E, 70(2), 93. DOI 10.1103/PhysRevE.70.026312. [Google Scholar] [CrossRef]
28. Shao, H., Wu, Y. C., Lin, Z., Taberna, P. L., Simon, P. (2020). Nanoporous carbon for electrochemical capacitive energy storage. Chemical Society Reviews, 49(10), 3005–3039. DOI 10.1039/D0CS00059K. [Google Scholar] [CrossRef]
29. Wang, C., Liu, P., Wang, Y., Yuan, Z., Xu, Z. (2018). Experimental study of key effect factors and simulation on oil displacement efficiency for a novel modified polymer BD-HMHEC. Scientific Reports, 8(1), 1–9. DOI 10.1038/s41598-018-22259-z. [Google Scholar] [CrossRef]
 | This work is licensed under a Creative Commons Attribution 4.0 International License, which permits unrestricted use, distribution, and reproduction in any medium, provided the original work is properly cited. |