| Energy Engineering |
DOI: 10.32604/EE.2021.015413
ARTICLE
A Simplified Model for SO2 Generation during Spontaneous Combustion of Coal Gangue
1Institute of Disaster Prevention Science and Safety Technology, Central South University, Changsha, 410075, China
2College of Forestry, Inner Mongolia Agricultural University, Hohhot, 010019, China
*Corresponding Author: Peng Lei. Email: leipeng2015@csu.edu.cn
Received: 17 December 2020; Accepted: 25 January 2021
Abstract: A simplified model for SO2 generation during spontaneous combustion of coal gangue was put forward and validated using the measured data. Using the proposed model, the effects of initial temperature inside the gangue and fresh air supply on SO2 generation were discussed. The results showed that, higher initial temperature inside the gangue could accelerate the oxidation rate of FeS2 and increase the maximum concentration of SO2. If initial temperature inside the gangue increased by about 37%, the total SO2 generation increased by 166%. Fresh air supply had less significant effect on the oxidation rate of FeS2. However, the higher the fresh air supply was, the more FeS2 could be oxidized, which ultimately produced more SO2. Although the computed results and the measured data concerning the inner locations inside the gangue had a certain degree of error, the proposed model can provide a relatively precise total release of SO2 within acceptable accuracy. Besides, this method provides a useful prototype to predict the generation of hazardous materials, such as CO, NOx, and chlorine during the spontaneous combustion of coal gangue.
Keywords: Coal gangue; spontaneous combustion; simplified model; SO2 generation
Nomenclature
| f: | Mass fraction |
| ω: | Mass source term |
| R: | Gas constant |
| L: | Length of the equivalent air inlet |
| T: | Temperature/°C |
| n: | Porosity |
| S: | Source term of a governing equation |
| Subscript | |
| mom: | Momentum |
| inert: | Inert material in coal gangue |
| Greek Letters | |
| β: | Degree of oxidation of coal gangue |
| ρ: | Density |
According to the National Bureau of Statistics of China, China used 3.85 billion tons of coal in 2019, which accounted for almost half of the total coal used worldwide. Coal gangue, an inevitable solid waste generated during coal mining and washing, is estimated to be approximately 10–15% of the raw coal produced, and has an inventory of more than 5.0 Gt in China with an annual increase of 0.33–0.55 Gt [1]. Such a tremendous amount of coal gangue is usually discarded and piled up on ground, and causes serious environmental problems [2], including the hazard of spontaneous combustion.
Spontaneous combustion of coal gangue not only releases hazardous trace elements (such as, As, Hg, and Pb) that contaminate the soil and water [3–6], but also produces massive harmful gases that pollute the air (such as, SO2, CO, and NOx) [7,8]. In 2013, approximately 1.13 Mt sulfur was released to the atmosphere due to the spontaneous combustion of coal gangue [9]. More attention is being focused on the harmful gases released from the spontaneous combustion of coal gangue [3,10–13].
Extensive studies have focused on the characteristics, influencing factors, and the mechanisms of the release of harmful gases during spontaneous combustion. Wang et al. [10] conducted experiments on the release characteristics of polycyclic aromatic hydrocarbons (PAHs) during spontaneous combustion, and studied the effect of temperature on the generation of PAHs. Zhang et al. [2,14] studied the effects of feedstock properties on spontaneous combustion and obtained the kinetic parameters for the reactions. The release characteristics of chlorine [15,16] and the permeability of coal gangue [17–19] were also studied in various works. Some new methods, including artificial neural network, have been used to study the ignition/combustion/pyrolysis characteristics of coal gangue [20–22]. These methods not only enhance our understanding about coal gangue, but more importantly, provide new principles to model the combustion of coal gangue. With regards to the mechanisms of spontaneous combustion, the coal-oxygen recombination theory is widely accepted [23,24]. According to this theory, coal gangue is a porous media with numerous internal voids, or rather wind channels [25], in which the air flows. The heat generated by the oxidation of active groups in coal gangue gradually accumulates, and then, triggers spontaneous combustion. However, the detailed mechanism still remains to be studied [26].
Current numerical simulations of the release of harmful gases during the spontaneous combustion of coal gangue involve fluid motion, oxidation, and heat transfer in porous media [25,27]. Inclusion of all these parameters in the numerical simulations makes the overall process complicated and time-consuming. Based on coal-oxygen recombination theory, the present paper presents a novel, more simplified model for the generation of SO2 from coal gangue. A scalar is introduced in the proposed model to indicate the change in the amounts of reactants (FeS2) in the coal gangue [9]. Moreover, the oxidation process is simulated using the loss of the scalar, which avoids the calculation of chemical reactions. This model is expected to enhance the current understanding of spontaneous combustion and provides a useful tool to predict the generation of hazardous materials and the release of pollutants during the spontaneous combustion of coal gangue.
Fresh coal gangue, located in Wuhai, China was selected as the prototype of the geometric model. There are three smoking points with different altitudes on its west-end surface. Each of them has the dimensions of approximately 0.3 m × 0.3 m. Moreover, the gangue can be seen as a huge frustum of pyramid, with a bottom surface of 480 m × 400 m and a height of 15 m, as shown in Fig. 1.
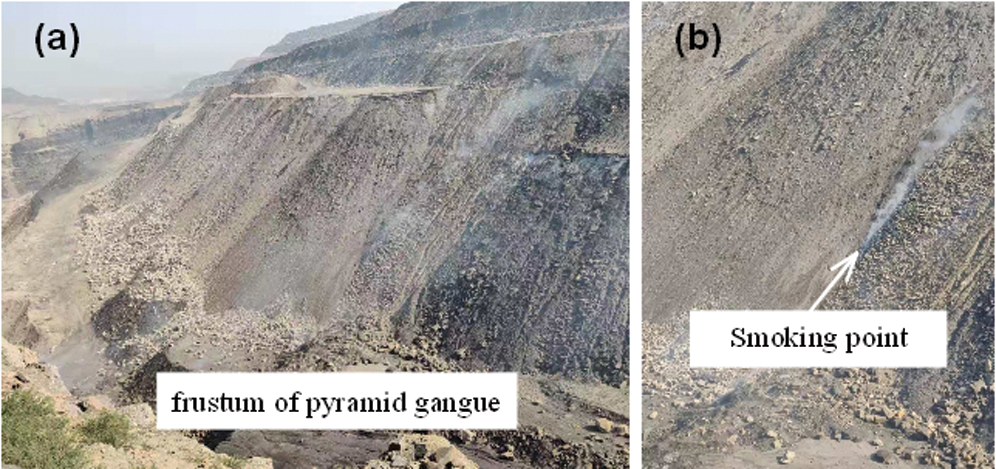
Figure 1: Appearance of the gangue (a) and its smoking points (b)
Under normal circumstances, the self-ignition spots were 1.5–2.5 m beneath the surface. At the depth of 3 m, the coal gangue was very compact and not prone to react with oxygen, as illustrated in Fig. 2. Meanwhile, because the geometric model was large and the non-oxidation zone produces little SO2, the current study only focuses the region until the depth of 5 m. In other words, this model only shells the coal gangue, whereas the shell is about 5 m thick. A similar approach is also used in some previous studies [28–30].
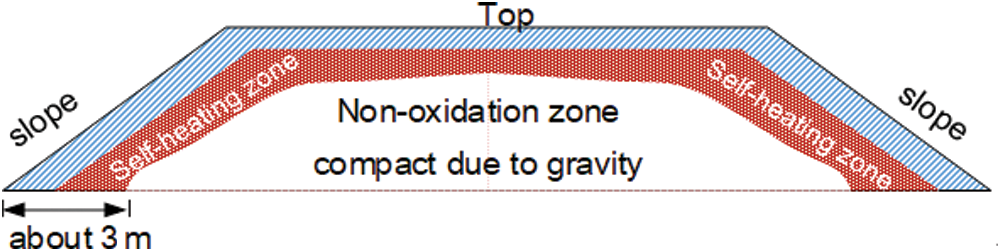
Figure 2: Illustration of different zones of coal gangue
Under normal circumstances, coal gangue is usually rammed using pavement rollers. In terms of the computational domain (5 m-thick shell of coal gangue), the porosity of upper part was relatively lower, while the porosity of lower part of the slope was higher. Due to this reason, the air was prone to enter the computational domain in the lower part of the slope. Meanwhile, in actual situations, there may exist countless small air inlets on the surface, which pose great challenge for modelling. Therefore, an equivalent air inlet that represents all the possible air inlets, located at the slope, was used in this work, as shown in Fig. 3. The equivalent air inlet had a length of L, and a width of 1 m.
Structural mesh was adopted in this study. The mesh had 5.07 million cells. The geometric model of coal gangue is illustrated in Fig. 3. In order to view the model in a better way, the geometric model was distorted slightly.
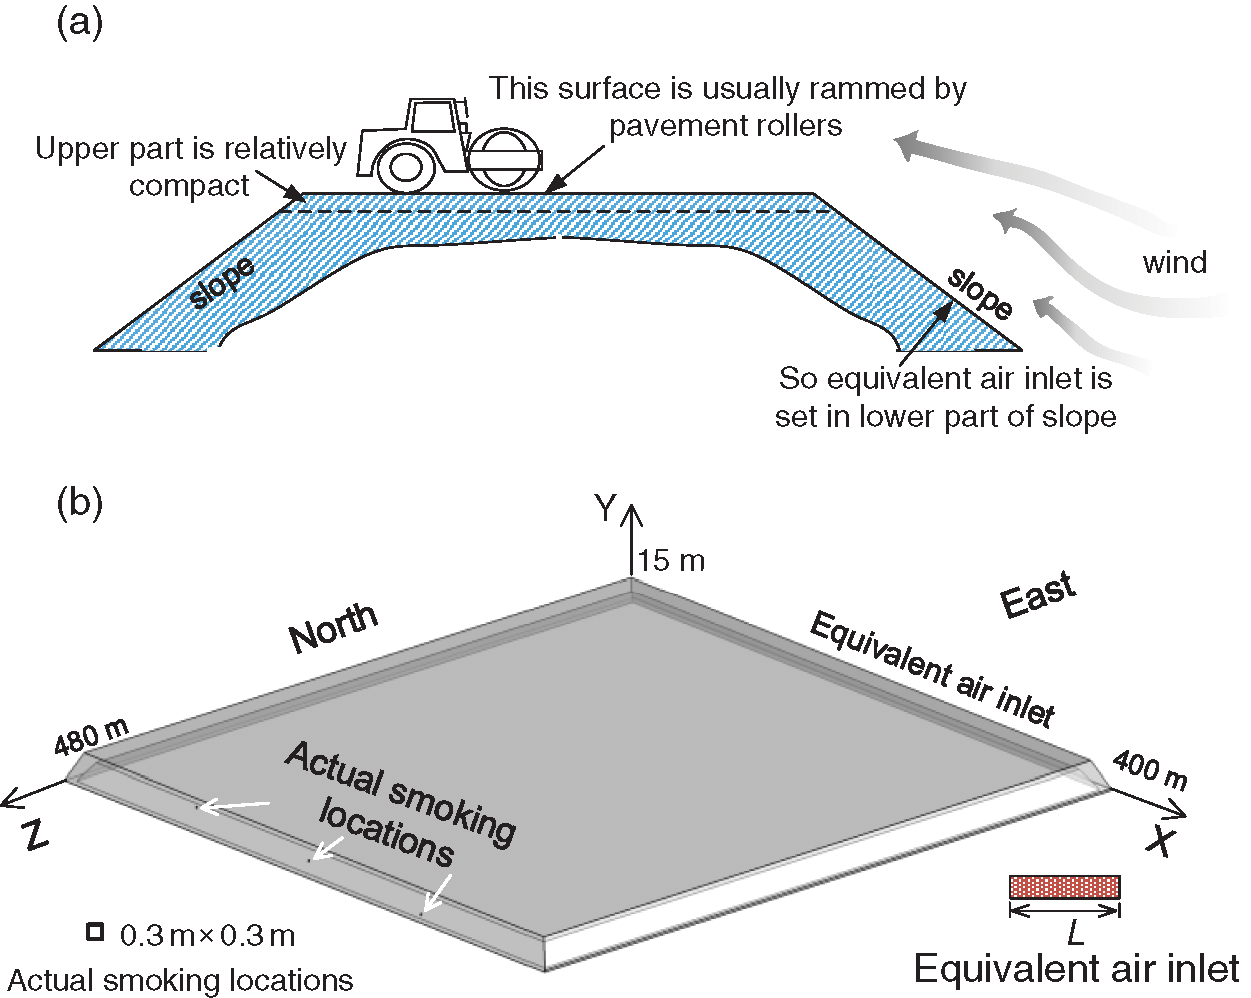
Figure 3: Schematic of the geometric model. (a) Cross section and (b) 3D model
In order to simplify the calculations, the following assumptions were made. (1) The characteristics of the coal gangue were isotropic. (2) The O2-comsumption rate during coal’s oxidation can be defined by simple Arrhenius equation [25]. (3) The absorption of water by coal gangue was neglected. (4) All the sulfur preserved in coal gangue existed in the form of FeS2. In order to simulate the oxidation of FeS2, the mass fraction of FeS2, denoted by
Because the porosity of coal gangue was very low (0.1–0.4%), the flow could be considered as three-dimensional incompressible, unsteady laminar flow [31]. Reynolds-averaged Navier Stokes equation and an energy conservation equation were used to solve the flow and temperature fields. The governing equations are described as below.
The fluid is composed of three species, consisting of O2, SO2 and N2. The mass conservation of O2 and SO2 [31] is expressed using Eq. (1).
Here,
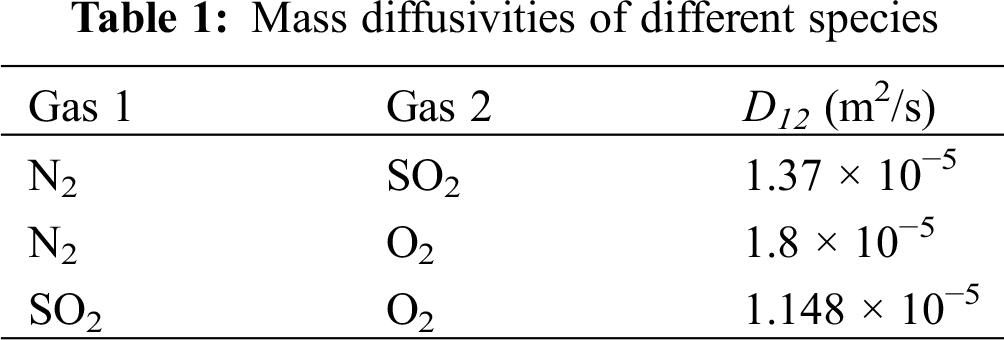
Because the sum of mass fractions of the three species was unity,
The mass source term in Eq. (1), denoted by Si, was due to the oxidation of FeS2, which consumed O2 and generated SO2. For simplicity, only one type of chemical reaction was considered, as given by Eq. (3).
Furthermore, there exists a simple relationship between the mass source of SO2 and the mass source of FeS2. Therefore, the mass source of SO2 is expressed using Eq. (4).
Similarly, the mass source of O2 is expressed using Eq. (5).
The mass conservation of FeS2 is expressed using Eq. (6).
Here,
Here,
Eq. (8) introduces a coefficient, denoted by β, which is a dimensionless indicator to describe the degree of oxidation of FeS2 in the coal gangue. In practice, the fresher the coal gangue is, the more prone it is to be oxidized. Therefore, it is reasonable to assign different reaction rates to coal gangue with different degrees of oxidation. By definition, β is a function of time, mass fraction of FeS2, and porosity, and is expressed using Eq. (9).
Here k is the ratio that is employed to control the rate of oxidation due to different characteristics of coal gangue. In this work, k was set to a value of 1 × 10⁻⁷. Actually, the rate of oxidation of FeS2 was very slow, and if the rate was not accelerated in the computation, it would take plenty of time. Therefore, k is reset to have the value of 5 × 10⁻⁴. Of course, it will bring some inaccuracies, because the accelerated oxidation process may increase the temperature. The elevated temperature accelerated the oxidation. Since FeS2 oxidation was very slow (activation energy was very high), this treatment was acceptable. By doing this, the computational time was significantly reduced.
Therefore, the governing equation of
Combining Eqs. (1)–(10), the mass fraction of O2, SO2 and N2, as well as
A momentum sink was added to the original momentum equations to simulate the loss in momentum caused by the porous solid. Generally, the loss in the momentum of fluid, caused by the porous media, consisted of the viscous loss term (Darcy’s law) and inertial loss term. Because the air velocity was very low (the flow could be treated as laminar flow), the inertial loss term could be removed. According to Darcy’s law, the viscous loss term in i direction, denoted by Si,mom, of the fluid can be described using Eq. (11).
Here α is the permeability of the fluid, and μ is the dynamic viscosity of the fluid that has the value of 18.1 × 10⁻⁶ Pa·s. According to preliminary experiments, α is a function of porosity and is proportional to n2.31. In this work, for coal gangue with the porosity of 0.1%, α was set to be 1.0 × 10⁻⁷.
Based on oxygen-recombination theory, it was the heat generated by the oxidation of the reactants that gradually accumulated and then triggered the spontaneous combustion. Herein, the reactants included FeS2 and coal. Concerning the generation of SO2, the released heat by the oxidation of coal also promoted the oxidation of FeS2. However, this promotion was limited, because the activation energy (denoted by E) was relatively high. Therefore, the change of
It should be noted that oxidation occurred only when the reaction conditions were appropriate. There is a critical temperature, below which the oxidation cannot be self-sustained. Normally, this critical temperature is 80–90°C (353–363 K). Some of the references have set this temperature to be 93°C (366 K) [26]. In the current work, the value was set to be 93°C. Oxidation process cannot proceed if the contents of reactants are very low. In this work, oxidation occurred only when
The boundary conditions were described as follows:
1. The inner surface and the bottom surface of the model were adiabatic.
2. The temperature of the outer surface of the model was equal to that of the ambient air (300 K).
3. The higher part of the coal gangue was compacted. Therefore, the porosity of the higher part of the coal gangue (y > 10 m) was 0.1%, which was smaller than that of the rest of the coal gangue (0.4%).
4. The initial mass fraction of FeS2 was set to be 3.75%, while the corresponding sulfur content of the gangue was 2%.
5. Because the prevailing wind direction was eastwardly, fresh air entered the computational domain from east. The inlet velocity was 0.5 m/s.
Prior to every calculation, the grids adjacent to the inner wall of the gangue were patched to have a temperature of 400 K to start the reactions. A finite volume method based on the implicit SIMPLE algorithm was employed to solve the system of Eqs. (1)–(12) with the boundary conditions defined above. Second order, upwind discretization was used for convective terms and a central difference scheme was used for diffusive terms.
The simulation was executed using FLUENT v14.5 over a workstation that had the specifications of 3.6 GHz processor, 16 GB RAM, and required approximately 68 h of CPU time to solve the 500 s evolution for a relatively stable mass fraction of SO2. Every 10 time steps, the three-dimensional flow field was stored, including velocity vectors, pressure distribution, temperature, species’ concentrations and density. Based upon the collected data, time history graphs were obtained in a forward post processing.
In order to validate the model, a comparison between the measured data and the calculated data is provided in Tab. 3. Since the study is focused on the total SO2 generation, more importance was attached to SO2 concentration at the smoking points. Monitors #1–#3 were located right at the surface of the smoking points, while Monitors #4–#6 were located 0.3 m beneath the center of the south/north/east surfaces, as illustrated in Fig. 4. The calculated data presented in Tab. 3 shows the values when the flow was relatively stable.

Figure 4: Schematic of the geometric model
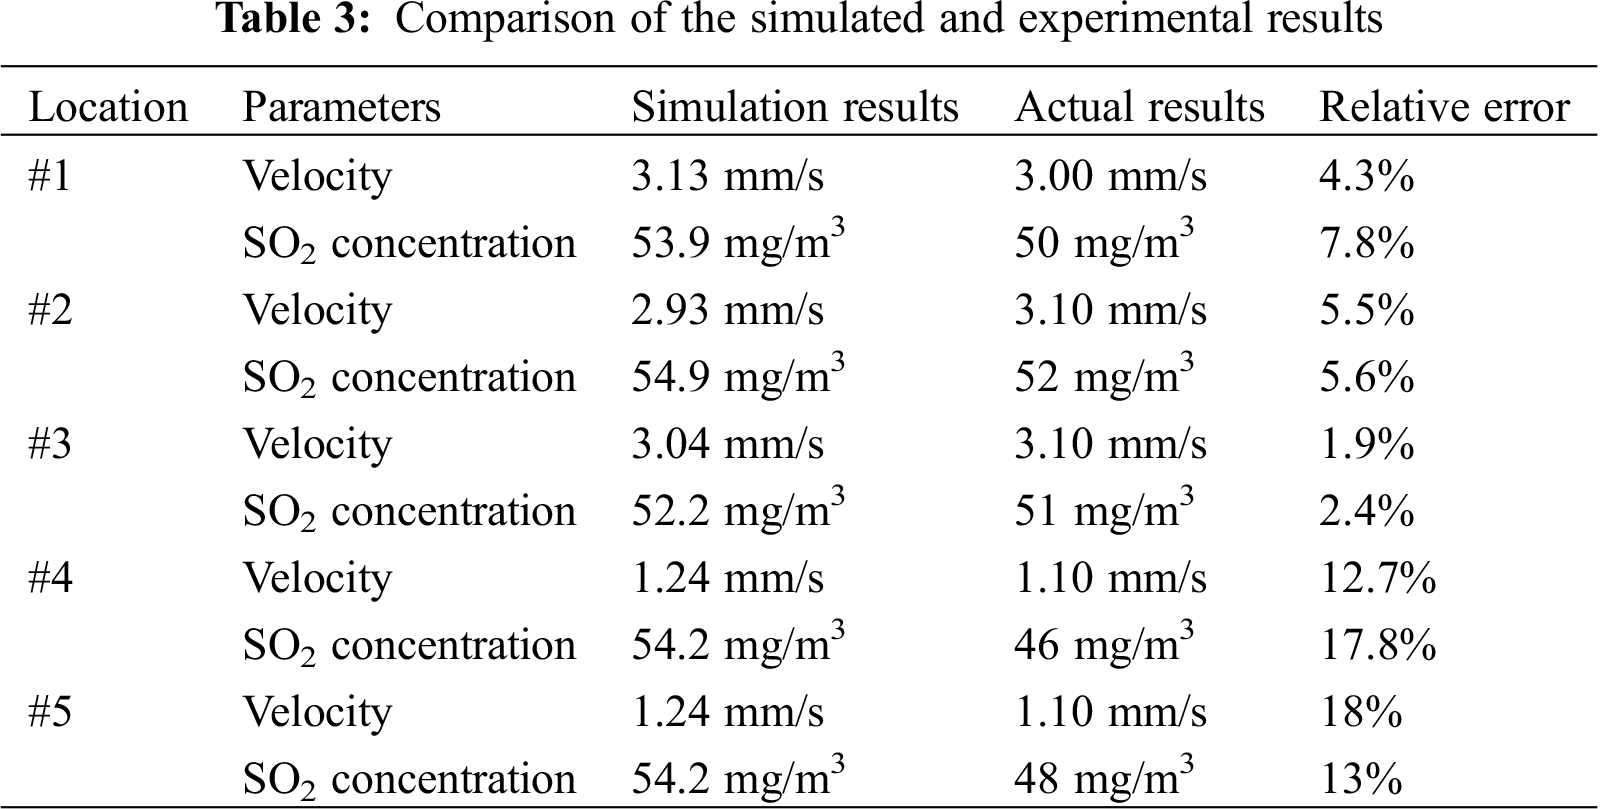
It can be seen from Tab. 3 that for Monitors #1–#3 (for smoking points), the errors between the simulated and experimental results were around 5%, which is acceptable. Meantime, for Monitors #4–#5, the errors were about 15%, which is relatively large. The reason why the calculated results are higher than measured results and why the errors inside the computational domain are larger can be explained as follows:
1. In the simulation, the generated mesh could not simulate the countless air leakage passages in the coal gangue. In actual situations, these passages are connected with the atmosphere and allow the heat and mass transfers between the coal gangue and the atmosphere. Therefore, a fraction of SO2 can be transported outwards. This error is inevitable because it is almost impossible to simulate the countless air leakage passages.
2. In the computation process, all the FeS2 within every cell in the mesh can be oxidized, while in practice, only the FeS2 around wind channels reacts with oxygen. Therefore, the results represent only the spatially averaged SO2 concentration. For quantities of one point inside the computational domain, the results are not very accurate.
3. A large error between the simulated results and the measured values of Point #2 is relatively large. This can be attributed to the influence of change in the seepage field that is caused by the failure to consider a depth below 5 m.
Contours of SO2 concentration for the inner surface and key slices of coal gangue are displayed in Fig. 5. The time was slowed down by 5000 times because the oxidation rate was accelerated by the same ratio in the proposed model.

Figure 5: SO2 concentration contours on the inner surface of the coal gangue
After calculations, the concentration of SO2 gradually grew where the temperature condition was met (temperature exceeded the value of 366 K). However, until the first 25 h, the concentration of SO2 was still very low. Then, the increase in SO2 concentration became obvious at about 70 h, which is when, some high-concentration patches emerged. At about 125 h, a low-concentration region on the east of the coal gangue was formed. This was due to the reason that fresh air entered the computational domain on the eastern side. The SO2 concentration field became relatively stable at about 350 h.
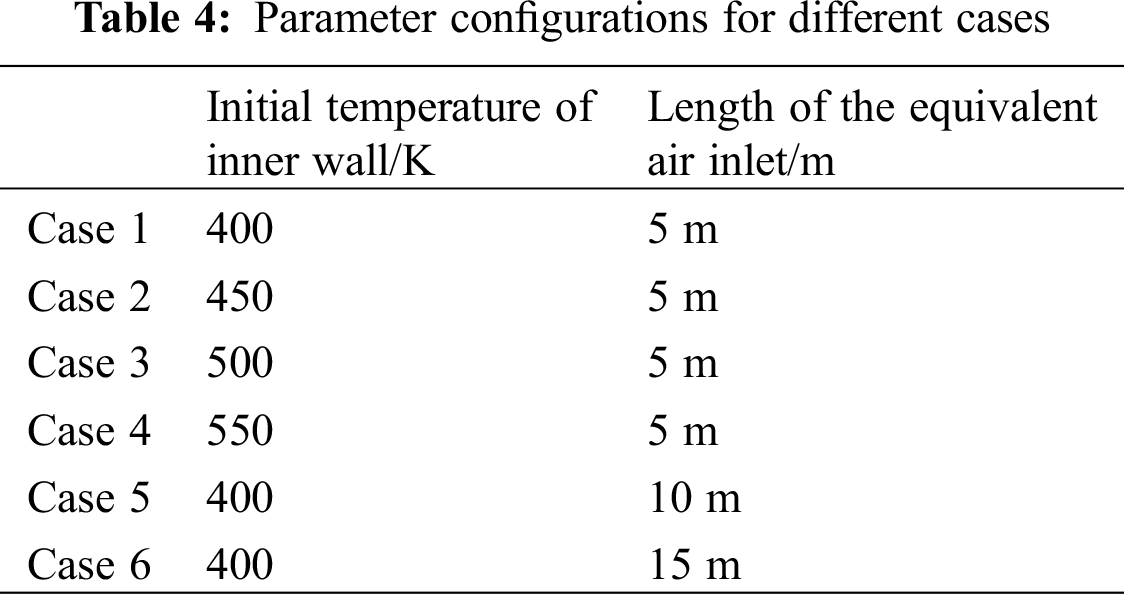
The flow fields and SO2 concentration inside the coal gangue were studied, where two factors, the initial temperature of the inner wall and the supply of fresh air, were considered. Fresh air supply was varied by adjusting the length of the equivalent air inlet, L.
The parameter configurations are listed in Tab. 4, and the results are compared and discussed as follows: Cases 1–4 are computed to discuss the effects of initial temperature of inner wall on the generation of SO2. Cases 1, 5 and 6 are computed to discuss the effects of fresh air supply on the generation of SO2.
3.1 Effect of Initial Temperature of Inner Wall on the Generation of SO2
The contours of SO2 concentration in Cases 1–4 are shown in Fig. 6. On the right hand side is the initial temperature of inner wall in each case. Three slices (X = 100 m, 200 m, and 300 m) are displayed to visualize the SO2 concentration inside the coal gangue.

Figure 6: Comparison of SO2 concentrations for Cases 1–4
Obviously, the higher the initial temperature, the higher the concentrations of SO2 were, and quicker the stable concentration field formed. At 10 h, there was little SO2 on the surface of the coal gangue for the case with the initial temperature of 400K, while there was approximately 48 mg/m3 of SO2 for the case with the initial temperature of 550K. At 25 h, SO2 can be hardly seen within the model for the case with the initial temperature of 400K. For the case with the initial temperature of 500K, the SO2 was visible, however it was much less than that for the case with the initial temperature of 550K. After 25 h, SO2 concentration continued to grow. At 125 h, the SO2 concentration for the case with the initial temperature of 400K was very low compared with the other three cases. At 350 h, the SO2 concentration fields became stable, whereas the case with lower initial temperature had lower SO2 concentration.
The SO2 concentration curves as a function of time for Monitors #1 and #4 for Cases 1–4 are shown in Fig. 7. It can be clearly seen that SO2 concentration increased with the increase in the initial temperature of the inner wall when the concentrations became stable, as shown in Fig. 7. Besides, the SO2 concentration for the cases with higher initial temperatures grew more quickly. The rates of increase in cases with initial temperatures of 400K, 450K, 500K and 550K were found to be 0.14 mg/(m3·h), 0.72 mg/(m3·h), 2.3 mg/(m3·h) and 4.7 mg/(m3·h), respectively. In other words, the rate of increase in SO2 concentration may increase by 3400%, while the maximum SO2 concentration may increase by 166% if the initial temperature of the inner wall is increased by 37%. It should be noted that both the rate of increase in concentration and the (stable) concentration grew very rapidly with the increase in temperature. This is due to the Arrhenius reaction rate term in Eq. (8), where temperature appears as an exponent. Therefore, the inner temperature of the coal gangue should be given more importance when studying the spontaneous combustion.

Figure 7: SO2 concentration curves as a function of time, (a) Monitor #1, (b) Monitor #2
3.2 Effect of Fresh Air Supply on the Generation of SO2
The contours of SO2 concentration in Cases 1, 5 and 6 are shown in Fig. 8. On the right hand side is the length of the equivalent air inlet for each case. Three slices (X = 100 m, 200 m, and 300 m) are displayed to visualize the SO2 concentration inside the coal gangue.

Figure 8: Comparison of SO2 concentrations among different cases
As it can be seen from Fig. 8, the rates of SO2 generation for Cases 1, 5 and 6 were very similar to each other. Moreover, the concentration fields stabilized at about 350 h, after which time, the contours were omitted in this paper. However, there were some differences among the three cases, and the differences emerged at around 125 h. The case with the larger length of the equivalent air inlet had larger low-concentration region. Apparently, this was because the fresh air contained no SO2.
The SO2 concentration curves as a function of time for Monitors #1 and #4 in the above three cases are shown in Fig. 9. The rates of increase of SO2 concentration in different cases were almost the same to each other, and had the value of approximately 0.14 mg/(m3·h). The SO2 concentrations of Monitor #4 in different cases were very similar to each other. However, SO2 concentration of Monitor #1 in Case 6 was lower, and was about 20% lower than that of Monitor #1. This is mainly because the velocity of Monitor #1 in Case 6 was higher. It should be noted that coal gangue in Case 6 generated the most amount of SO2, as can be seen in the right hand side of Fig. 9a. The blue lines in Fig. 9a are obtained by integrating the product of SO2 concentration and the velocity of Monitor #1 with respect to time. They denote the total SO2 released. Clearly, the case with higher fresh air supply generated more SO2, which agrees well with the experimental results.

Figure 9: SO2 concentration curves as a function of time, (a) Monitor #1, (b) Monitor #4
Based on coal-oxygen recombination theory, a simplified model for SO2 generation during spontaneous combustion of coal gangue was formulated. Using the proposed model, the effects of initial temperature of inner wall and the fresh air supply were discussed by varying the initial temperature of the inner wall and the length of the equivalent air inlet. The main conclusions of this work are as follows:
1. With a user-defined scalar introduced to indicate the mass loss of FeS2, the proposed model only focused on the mass and heat transfers of the fluid. Though there were relatively large error in the predicted quantities inside the computational domain, the results (SO2 concentration, and velocity) agreed well with the measured results at the smoking points. If the focus was on the total SO2 generated, then the results are acceptable. Furthermore, the proposed model is simple, time-saving and economical.
2. Higher initial temperature of inner wall can accelerate the oxidation rate of FeS2 and increase the maximum concentration of SO2. Besides, the increase of maximum concentration of SO2 grew much more quickly than the increase of temperature. It is found that if the initial temperature of the inner wall increased by 37%, the rate of increase in SO2 concentration could increase by 3400%, while the maximum SO2 concentration may increase by 166%. This is because, the temperature appeared as an exponent in the calculation of oxidation rate.
3. Fresh air supply had a less significant influence on the oxidation rate of FeS2 than the initial temperature. Larger equivalent air inlet area meant more fresh air supply and lower SO2 generation, because SO2 was diluted. However, more fresh air supply could oxidize more FeS2, which meant more SO2 can be generated. When the equivalent air inlet area increased by three times, the total amount of SO2 increased by about two times. Therefore, some measures that can reduce the fresh air supply could be effective in reducing the total SO2 generation.
As a typical porous media, coal gangue has very complex internal structure, including numerous tiny channels, in which air flows. Therefore, it is almost impossible and at the same time unnecessary, to model the gangue, and then, thoroughly calculate the internal flow fields. Therefore, there exist some relatively large errors between the computational results and the measured data. However, the proposed model can provide a relatively precise SO2 release in smoking points with an acceptable accuracy, which was also the focus of the current work. Furthermore, the proposed model can provide a novel and economic tool to calculate the pollutants (such as CO) coming from coal gangue.
Funding Statement: The authors appreciate and acknowledge the financial support provided by the Major Science and Technology Projects of Inner Mongolia Autonomous Region under Grant No. RZ190001148 and Fund of Education Department of Inner Mongolia Autonomous Region under Grant No. NJZY21480.
Conflicts of Interest: The authors declare that they have no conflicts of interest to report regarding the present study.
1. Liang, Y., Liang, H., Zhu, S. (2016). Mercury emission from spontaneously ignited coal gangue hill in Wuda coalfield, Inner Mongolia, China. Fuel, (182), 525–530. DOI 10.1016/j.fuel.2016.05.092. [Google Scholar] [CrossRef]
2. Zhang, Y., Zhang, Z., Zhu, M., Cheng, F., Zhang, D. (2019). Decomposition of key minerals in coal gangues during combustion in O2/N2 and O2/CO2 atmospheres. Applied Thermal Engineering, 148, 977–983. DOI 10.1016/j.applthermaleng.2018.11.113. [Google Scholar] [CrossRef]
3. Querol, X., Izquierdo, M., Monfort, E., Alvarez, E., Font, O. et al. (2008). Environmental characterization of burnt coal gangue banks at Yangquan, Shanxi Province, China. International Journal of Coal Geology, 2(75), 93–104. DOI 10.1016/j.coal.2008.04.003. [Google Scholar] [CrossRef]
4. Zhai, X., Wu, S., Wang, K., Drebenstedt, C., Zhao, J. (2017). Environment influences and extinguish technology of spontaneous combustion of coal gangue heap of Baijigou coal mine in China. Energy Procedia, 136(6), 66–72. DOI 10.1016/j.egypro.2017.10.326. [Google Scholar] [CrossRef]
5. Zhao, Y., Zhang, J., Chou, C., Li, Y., Wang, Z. et al. (2008). Trace element emissions from spontaneous combustion of gob piles in coal mines, Shanxi, China. International Journal of Coal Geology, 73(1), 52–62. DOI 10.1016/j.coal.2007.07.007. [Google Scholar] [CrossRef]
6. Wang, S., Luo, K. (2017). Atmospheric emission of mercury due to combustion of steam coal and domestic coal in China. Atmospheric Environment, 162(2), 45–54. DOI 10.1016/j.atmosenv.2017.05.015. [Google Scholar] [CrossRef]
7. Wu, Y., Yu, X., Hu, S., Shao, H., Liao, Q. et al. (2019). Experimental study of the effects of stacking modes on the spontaneous combustion of coal gangue. Process Safety and Environmental Protection, 123, 39–47. DOI 10.1016/j.psep.2018.12.025. [Google Scholar] [CrossRef]
8. Finkelman, R. B. (2004). Potential health impacts of burning coal beds and waste banks. International Journal of Coal Geology, 59(1–2), 19–24. DOI 10.1016/j.coal.2003.11.002. [Google Scholar] [CrossRef]
9. Wang, S., Luo, K., Wang, X., Sun, Y. (2016). Estimate of sulfur, arsenic, mercury, fluorine emissions due to spontaneous combustion of coal gangue: An important part of Chinese emission inventories. Environmental Pollution, 209, 107–113. [Google Scholar]
10. Wang, H., Cheng, C., Chen, C. (2018). Characteristics of polycyclic aromatic hydrocarbon release during spontaneous combustion of coal and gangue in the same coal seam. Journal of Loss Prevention in the Process Industries, 55, 392–399. DOI 10.1016/j.jlp.2018.07.004. [Google Scholar] [CrossRef]
11. Yang, Z., Zhang, Y., Liu, L., Wang, X., Zhang, Z. (2016). Environmental investigation on co-combustion of sewage sludge and coal gangue: SO2, NOx and trace elements emissions. Waste Management, 50, 213–221. DOI 10.1016/j.wasman.2015.11.011. [Google Scholar] [CrossRef]
12. Jabłońska, B., Kityk, A. V., Busch, M., Huber, P. (2017). The structural and surface properties of natural and modified coal gangue. Journal of Environmental Management, 190, 80–90. [Google Scholar]
13. Onifade, M., Genc, B. (2020). A review of research on spontaneous combustion of coal. International Journal of Mining Science and Technology, 30(3), 303–311. DOI 10.1016/j.ijmst.2020.03.001. [Google Scholar] [CrossRef]
14. Zhang, Y. Y., Guo, Y. X., Cheng, F. Q., Yan, K. Z., Yan, C. (2015). Investigation of combustion characteristics and kinetics of coal gangue with different feedstock properties by thermogravimetric analysis. Thermochimica Acta, 614, 137–148. DOI 10.1016/j.tca.2015.06.018. [Google Scholar] [CrossRef]
15. Peng, B., Li, X., Zhao, W., Yang, L. (2018). Study on the release characteristics of chlorine in coal gangue under leaching conditions of different pH values. Fuel, 217, 427–433. DOI 10.1016/j.fuel.2017.12.123. [Google Scholar] [CrossRef]
16. Zhou, C., Liu, G., Fang, T., Wu, D., Lam, P. K. S. (2014). Partitioning and transformation behavior of toxic elements during circulated fluidized bed combustion of coal gangue. Fuel, 135, 1–8. DOI 10.1016/j.fuel.2014.06.034. [Google Scholar] [CrossRef]
17. Zhao, H., Wang, T., Zhang, H., Li, Y., Wei, Z. (2019). Permeability characteristics of coal containing gangue under the effect of adsorption. Journal of Petroleum Science and Engineering, 174, 553–562. DOI 10.1016/j.petrol.2018.11.028. [Google Scholar] [CrossRef]
18. Deng, J., Zhao, J., Zhang, Y., Huang, A., Liu, X. et al. (2016). Thermal analysis of spontaneous combustion behavior of partially oxidized coal. Process Safety and Environmental Protection, 104, 218–224. DOI 10.1016/j.psep.2016.09.007. [Google Scholar] [CrossRef]
19. Park, H., Rangwala, A. S., Dembsey, N. A. (2009). A means to estimate thermal and kinetic parameters of coal dust layer from hot surface ignition tests. Journal of Hazardous Materials, 168(1), 145–155. DOI 10.1016/j.jhazmat.2009.02.010. [Google Scholar] [CrossRef]
20. Bi, H., Wang, C., Lin, Q., Jiang, X., Jiang, C. et al. (2020). Combustion behavior, kinetics, gas emission characteristics and artificial neural network modeling of coal gangue and biomass via TG-FTIR. Energy, 213(1), 118790. DOI 10.1016/j.energy.2020.118790. [Google Scholar] [CrossRef]
21. Wang, X., Lin, Q., Wang, C., Zhou, K., Zhang, P. et al. (2019). The ignition characteristics and combustion processes of coal gangue under different hot co-flow conditions in O2/CO2 atmosphere: In pellet form. Combustion Science and Technology, 191(3), 419–434. DOI 10.1080/00102202.2018.1493468. [Google Scholar] [CrossRef]
22. Bi, H., Wang, C., Lin, Q., Jiang, X., Jiang, C. et al. (2021). Pyrolysis characteristics, artificial neural network modeling and environmental impact of coal gangue and biomass by TG-FTIR. Science of the Total Environment, 751, 142293. DOI 10.1016/j.scitotenv.2020.142293. [Google Scholar] [CrossRef]
23. Deng, J., Li, B., Xiao, Y., Ma, L., Wang, C. et al. (2017). Combustion properties of coal gangue using thermogravimetry–Fourier transform infrared spectroscopy. Applied Thermal Engineering, 116, 244–252. DOI 10.1016/j.applthermaleng.2017.01.083. [Google Scholar] [CrossRef]
24. Zhang, N., Li, H., Liu, X. (2016). Hydration mechanism and leaching behavior of bauxite-calcination-method red mud-coal gangue based cementitious materials. Journal of Hazardous Materials, 314(1–2), 172–180. DOI 10.1016/j.jhazmat.2016.04.040. [Google Scholar] [CrossRef]
25. Xia, T., Zhou, F., Wang, X., Zhang, Y., Li, Y. et al. (2016). Controlling factors of symbiotic disaster between coal gas and spontaneous combustion in longwall mining gobs. Fuel, 182(12), 886–896. DOI 10.1016/j.fuel.2016.05.090. [Google Scholar] [CrossRef]
26. Zhang, Y., Zhao, J., Ma, Z., Yang, F., Cheng, F. (2019). Effect of oxygen concentration on oxy-fuel combustion characteristic and interactions of coal gangue and pine sawdust. Waste Management, 87, 288–294. DOI 10.1016/j.wasman.2019.01.040. [Google Scholar] [CrossRef]
27. Zheng, H., Wang, J., Yu, Q. (2018). Simulation of spontaneous combustion region in coal piles under multi-field coupling. International Journal of Coal Preparation & Utilization, 1–13. DOI 10.1080/19392699.2018.1538976 [Google Scholar] [CrossRef]
28. Pei, X., Zhang, R., Du, G., Yan, M., Duan, H. (2009). Mathematical model for spontaneous combustion of waste dump and its simulation analysis in xinjian coal mine. Mining Safety and Environmental Protection, 36(4), 11–13 (in Chinese). [Google Scholar]
29. Song, Z. (2015). Thermogravimetric and numerical investigations on couplings of chemical reaction, hydraulic field and thermal field of coal fires. China University of Mining and Technology, Beijing. [Google Scholar]
30. Huang, W. (2004). Study on spontaneous combustion mechanism and prevention technology of coal Gangue (Ph.D. Thesis). Chongqing University, Chongqing. [Google Scholar]
31. Versteeg, H. K., Malalasekera, W. (2007). An introduction to computational fluid dynamics: The finite volume method. Pearson Education. [Google Scholar]
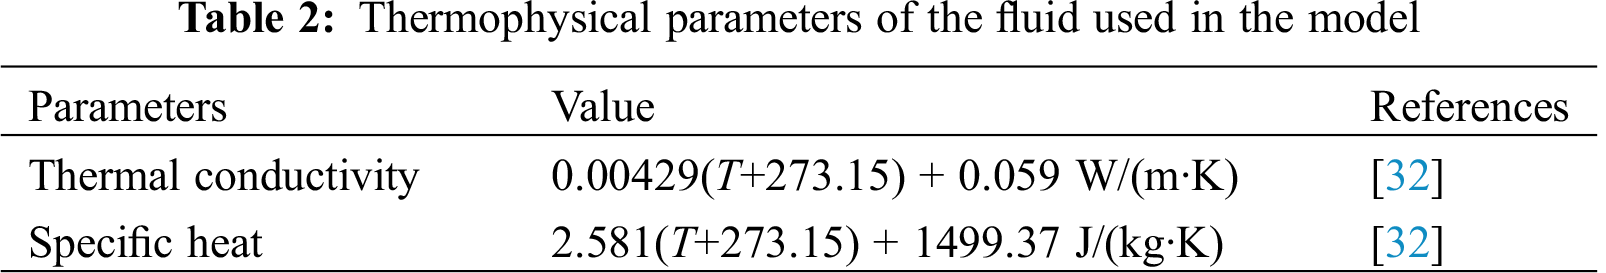
32. Liang, Z., Pan, Y., Feng, M., Du, Y., Li, G. et al. (2018). Study on thermal property of coal Gangue. Coal Technology, 37(10), 231–233. [Google Scholar]
 | This work is licensed under a Creative Commons Attribution 4.0 International License, which permits unrestricted use, distribution, and reproduction in any medium, provided the original work is properly cited. |