| Energy Engineering |
DOI: 10.32604/EE.2021.016131
ARTICLE
Statistical Model for Impact and Energy Absorption of 3D Printed Coconut Wood-PLA
1Green Kingdom Solutions Sdn. Bhd., Taman Salak Selatan, Kuala Lumpur, 57100, Malaysia
2College of Engineering, Universiti Malaysia Pahang, Gambang, Pahang, 26300, Malaysia
3Faculty of Mechanical & Automotive Engineering Technology, Universiti Malaysia Pahang, Pekan, Pahang, 26600, Malaysia
*Corresponding Author: M. Samykano. Email: mahendran@ump.edu.my
Received: 09 February 2021; Accepted: 27 May 2021
Abstract: Fused deposition modeling (FDM)-3D printing has been the favored technology to build functional components in various industries. The present study investigates infill percentage and infill pattern effects on the printed parts’ impact properties through the 3D printing technique using coconut wood-filled PLA composites. Mathematical models are also proposed in the present study with the aim for future property prediction. According to the ASTM standard, fifteen specimens with different parameter combinations were printed using a low-cost FDM 3D printer to evaluate their impact properties. Statistical analysis was performed using MINITAB to validate the experimental data and model development. The experimental outcomes reveal the honeycomb pattern with 75% infill density achieves the highest energy absorption (0.837 J) and impact energy (5.1894 kJ/m2). The p-value from statistical analysis clearly shows that all the impact properties are less than the alpha value of 0.05, suggesting all the properties are vital to determine the impact properties. The validation process affirms that the generated mathematical model for the energy absorbed and the impact energy is reliable at an acceptable level to predict their respective properties. The errors between the experimental value and the predicted value are 3.98% for the energy absorbed and 4.06% for impact energy. The findings are expected to provide insights on the impact behavior of the coconut wood-filled PLA composites prepared by FDM-3D printing and a mathematical model to predict the impact properties.
Keywords: Impact energy; energy absorption; response surface methodology; coconut wood; ANOVA
At present, the application of 3D printers has gained researchers’ interest worldwide. 3D printing technology facilitates the fabrication of products under the control of 3D CAD data. 3D printing technology is considered one of the techniques in the additive manufacturing process. Additive manufacturing (AM) processes promising privileges include accuracy, precision in the final products, and optimized use of base materials, which reduces the wastage and enhances the cost efficiency of the procedure. Cost efficiency and time consumption are the primary benefits of AM technologies. Fused deposition modeling (FDM) is used extensively to process thermoplastic materials-based components production among all AM processes. FDM technology works base on the injection of melted filament onto the building platform through the nozzle. The printing process is followed by reinforcement of each layer onto the subsequent layer.
FDM technology proved efficient in producing highly accurate products from high-efficiency processes. However, the printing process parameters were shown to affect the mechanical properties of the final products significantly. There are several advantages of using an FDM printer, such as cost efficiency, convenience, and high material usage efficiency [1,2]. As such, FDM printing technology not only been used to print small models for display [3] but also functional components such as bio-medical devices [4–6], tissue engineering [7,8], aerospace components [9], and automotive parts [10]. However, FDM printing technology takes a long time to print and provides poor mechanical behavior. Several FDM parameters were reported to influence the product’s properties, such as layer thickness, deposition line width, extrusion temperature, raster angles, printing velocity, and printing orientation [11]. The most significant factors that would affect the product’s tensile properties reported to be the deposition line width and the printing orientation [12]. The common types of filaments available in the market for FDM are Polylactic Acid (PLA) and Acrylonitrile Butadiene Styrene (ABS). PLA is usually used in food packaging, biodegradable medical devices, and implantation materials such as craniofacial or tissue engineering. Many industrial sectors prefer PLA since PLA is environmentally friendly and easy to operate. ABS, in turn, could be harmful to the environment [13]. Metal particles, ceramics, and carbon fibers-filled filament are the most advanced materials used in the FDM procedure. Wood-based filament has gained considerable interest because they are biodegradable as they are formed through renewable sources. This filament also provides good thermal stability to the printed products. Besides, the wood-based filament is a non-toxic element and has high corrosion resistance. However, the majority of the wood-based filaments are water-sensitive [14]. According to the researchers, the wood-based components’ mechanical properties highly rely on the printing orientation due to the fiber anisotropy [15]. Guessasma et al. [16] investigated the mechanical performance of wood-based filament using the FDM technique. They proved that wood-based filament is printable over a wide range of temperatures and exhibits a marked heat accumulation tendency at high printing temperatures. Kain et al. [17] investigated the influence of various infill orientations on specific material characteristics of fused layer modeling for wood/PLA composites. They reported a direct interaction between the infill orientation and the resulting mechanical performance of the test specimen. Sun et al. [18] investigated the strength and biodegradable properties of PLA-based composites accompanied with wood filler using FDM at different infill settings. They reported that 3D printed composites with PLA-based filaments containing 30 wt.% wood fiber exhibit resistance to biodegradation by common decay fungi. Kariz et al. [19] evaluated the effect of humidity on 3D printed specimens from wood-PLA filaments. They proved that specimens made from filaments with higher wood content had higher moisture content, more extensive dimensional swelling, and a lower modulus of elasticity.
The present study investigates infill percentage and infill pattern effects on the printed parts’ impact properties through the 3D printing technique using coconut wood-filled PLA composites. A statistical model is developed based on the acquired experimental data accompanied by response surface methodology. This is the first study investigating the effects of infill percentage and infill patterns on the impact properties of the FDM 3D printing technique using response surface methodology to the best of the authors’ knowledge. The developed coconut wood-filled PLA composite as an integrated filament with a variation of infill percentage and infill patterns is considered for this analysis. The response surface methodology is adopted to develop the mathematical models related to impact properties, focusing on varying infill percentages and infill patterns. Impact test results reflect that infill percentage, infill pattern, the interaction effect of infill pattern with infill percentage, the second-order term of infill pattern, and the second-order term of infill percentage significantly impact both impact properties which is the energy absorbed and impact energy. Honeycomb infill pattern with 75% infill percentage gives the highest energy absorbed and impact energy in the experiment. The validation process affirms that the generated mathematical model for the energy absorbed and the impact energy is reliable at an acceptable level to predict their respective properties. The errors occur between the experimental value, and the predicted value is 3.98% for the energy absorbed and 4.06% for impact energy. The optimum impact properties are honeycomb infill pattern and 75% infill percentage. Thus, the effect of infill percentage is essential in the impact properties. A high infill percentage develops highly packed composition of product that can withstand a higher level of energy.
The material used in this research is coconut wood-filled PLA in the form of filament. The filament is then melted in the 3D printer nozzle and injected into the building platform to form a 3D shape object. The filament is composed of 40% coconut wood particles and 60% PLA. Coconut wood is selected due to its good thermal stability and high corrosion resistance. In this research project, the standard filament diameter of 1.75 mm (±0.05 mm) is used. It is from FormFutura, which is located in the Netherlands. The EasyWood coconut wood filaments characteristics are: the color of the filaments is in wood color, and the processing temperature is between 200°C until 240°C. An additional notable characteristic of EasyWood coconut wood filament is it can be printed without a heating board. This is due to its lower shrinkage, distortion-free, and hard to be warped off upon the printed parts are cooled. Fig. 1 demonstrates the adopted methodology for the conducted research work.
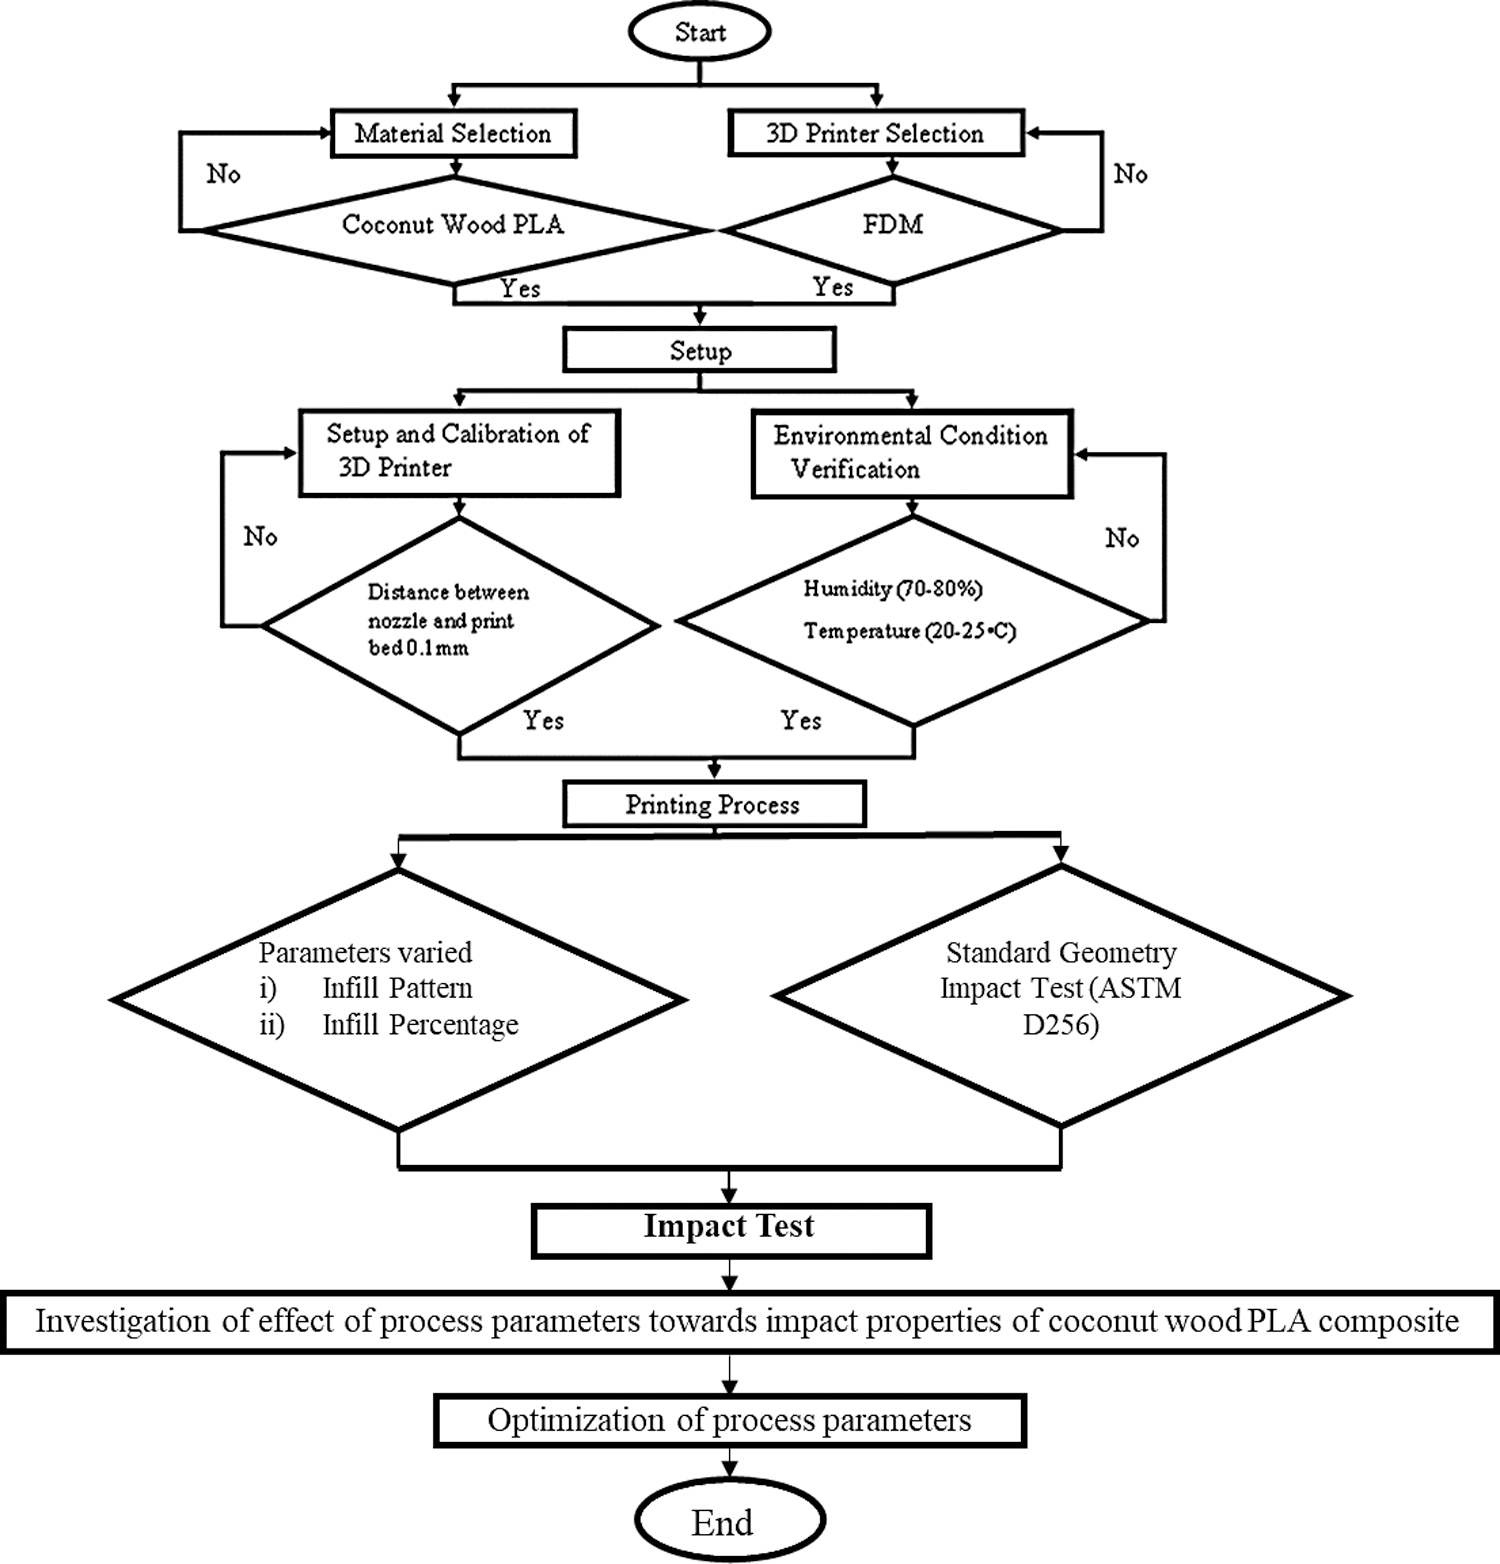
Figure 1: Methodology flow chart
2.1 Printing Process of the Specimen
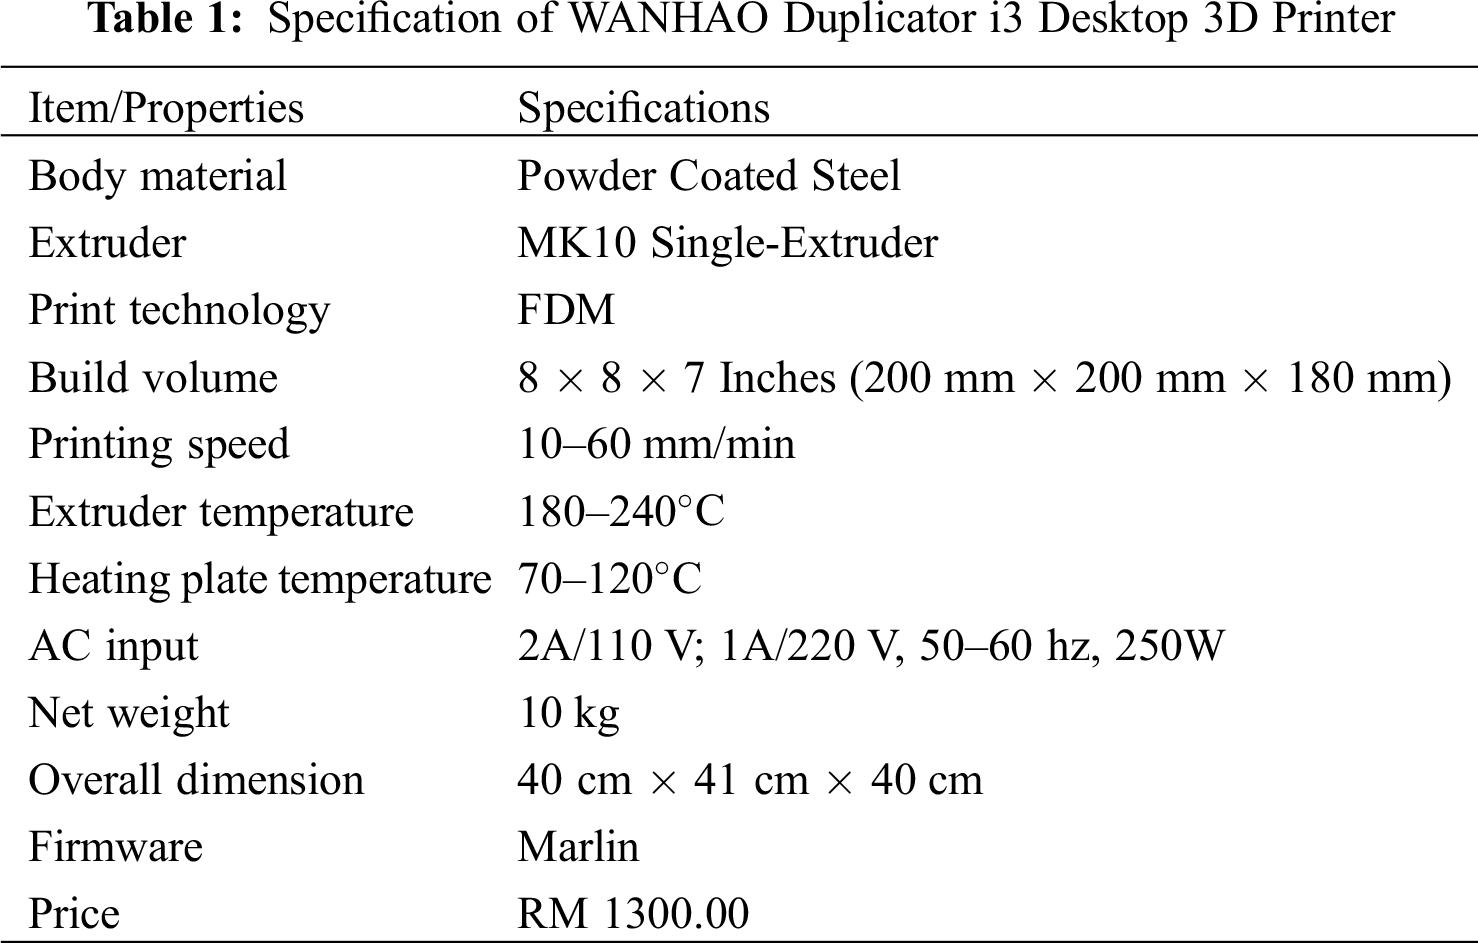
In this research, the selected 3D printer is WANHAO Duplicator i3 desktop 3D printer. This 3D printer has fulfilled all the minimum requirement that needed to print the specimen for mechanical testing. Firstly, the maximum extruder temperature is 240°C (coconut wood filament requires 200°C) to melt the filament. The printing speed of the 3D printer is in the range of 10 to 60 mm/min. The next consideration is the bed temperature. Although the coconut wood filament does not require a heated bed to print, it can also be printed on the heated bed, giving better quality. Tab. 1 shows the specification of the WANHAO Duplicator i3 Desktop 3D printer.
2.2 Machine Constant Parameter
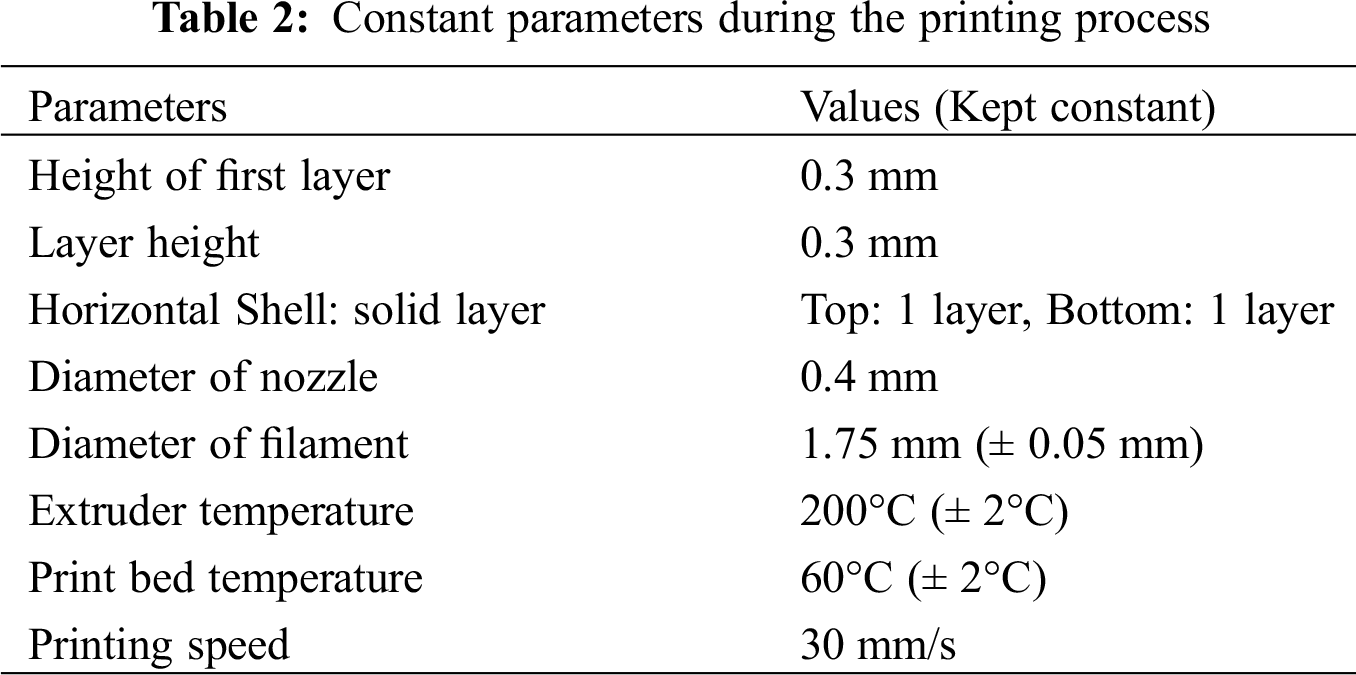
Throughout the printing process, all the parameters were kept constant except the selected varying parameters. This is to ensure that the experiment can be conducted successfully with a satisfying outcome, which means the properties will only be affected by the varying parameters. The Repetier–Host is used as slicing software in this work compatible with most firmware. The printing parameters are manipulated or keep constant with the help of this software. All the parameters that were kept constant in this research are summarized in Tab. 2.
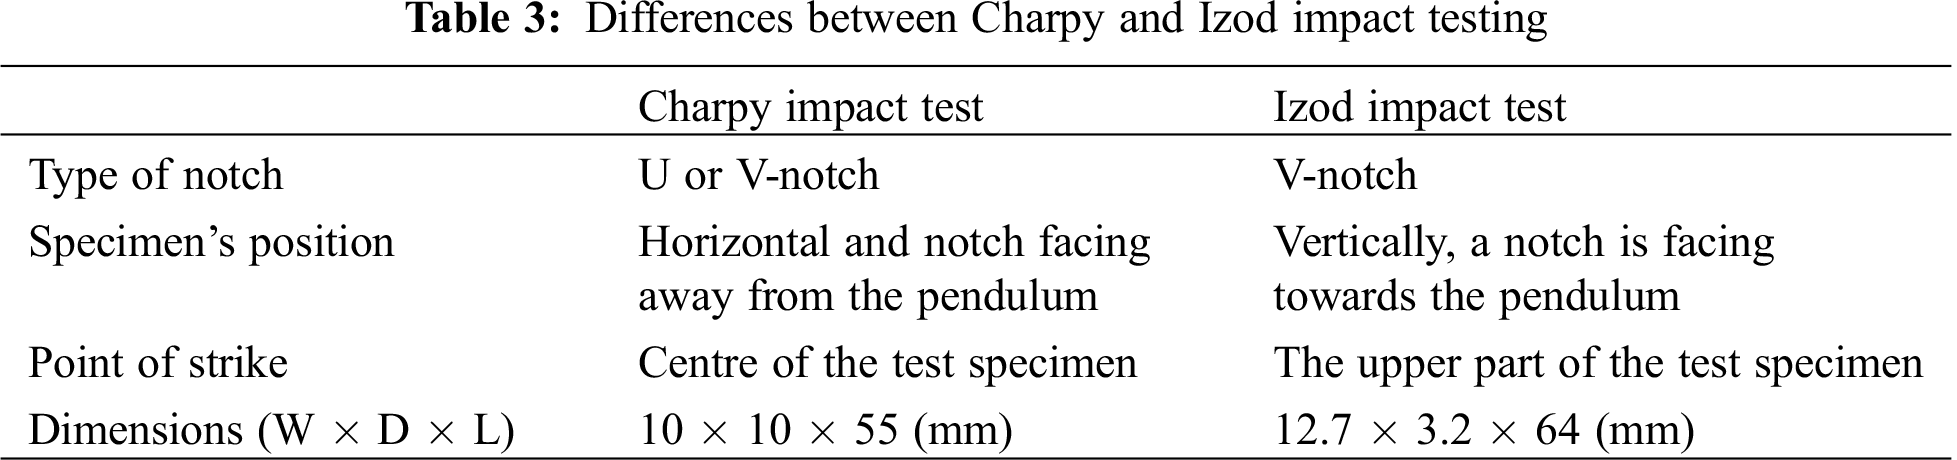
The impact test is a method to determine the amount of energy that a material can absorb before failure. Generally, there are three impact test types: Charpy impact test, Izod impact test, and Keyhole impact test. The only difference between the three tests is the direction of the specimen placed. In this research study, the Izod impact test is used. For the Izod impact test, the printed specimen will be placed vertically, whereas the printed specimen is placed horizontally for the Charpy impact test. The ASTM standard used for this Izod impact test is ASTM D256. CEAST 9050 impact pendulum is used to conduct the Izod impact test. The pendulum has an energy range between 0.5 to 50 J. Tab. 3 shows the difference between the Charpy impact test and the Izod impact test. Fig. 2 shows the Izod test specimens’ parts and dimensions by referring to the ASTM D256 standard. The software used to perform statistical evaluation is MINITAB 18. The primary purpose of using this software is to perform a statistical evaluation of the effect of the printing parameters against the impact properties of the printed coconut wood PLA.
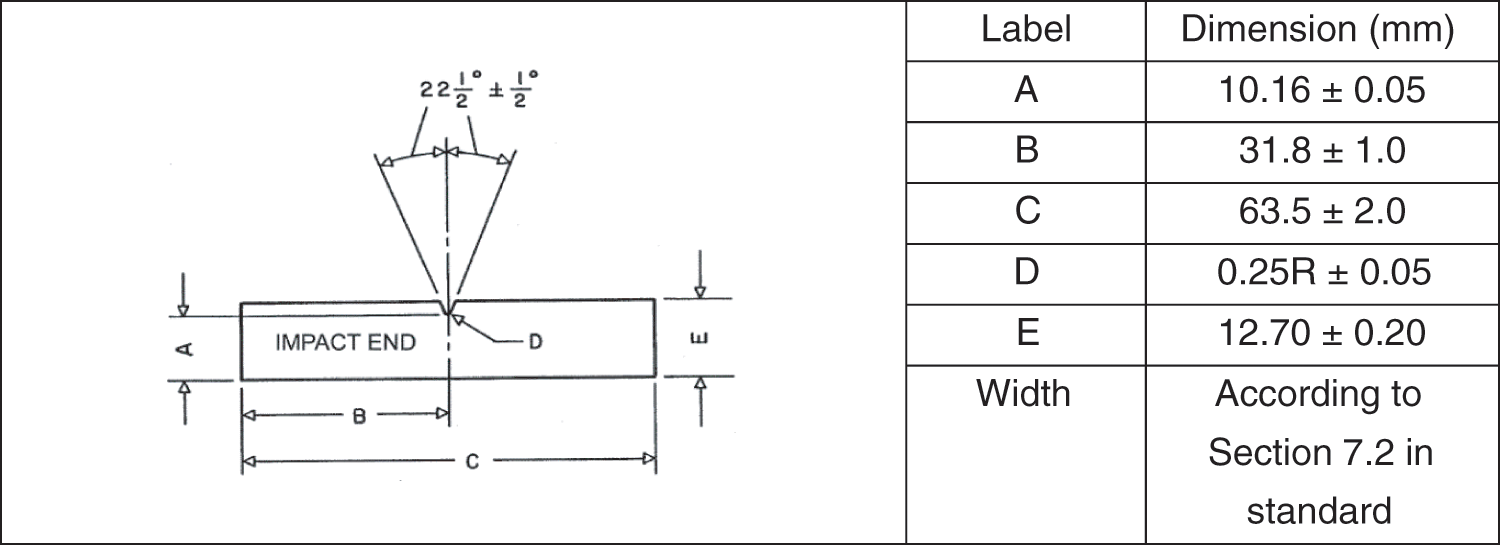
Figure 2: Parts and dimension of the Izod test specimen according to ASTM
The impact properties, comprising energy absorbed and impact energy, are investigated comprehensively in this research study. Energy absorbed is the amount of energy that the specimen gains after being hit in the testing. The value of energy absorbed can be obtained from the time the load starts to rise until the first occurrence of 0 loads after the maximum point. The obtained value can be used to represent the toughness of a material. Thus, the higher the value obtained means the tougher the material. The impact of energy is a measurement of the work performed to break down a specimen. When the striker is released to hit the sample, the sample will immediately absorb the energy from the striker, causing the specimen to yield. At this moment, the specimen starts to undergo plastic deformation at the notch. The sample continues to absorb the striker’s energy and work-hardens at the plastic zone at the notch. The specimen’s fractures upon it reached the maximum energy absorption. In this experiment, the energy absorbed is obtained from the machine software, whereas the impact of energy is calculated manually. Therefore, it does not require any stress-strain curve in this experiment. The average for all the impact properties is listed in Tab. 4.
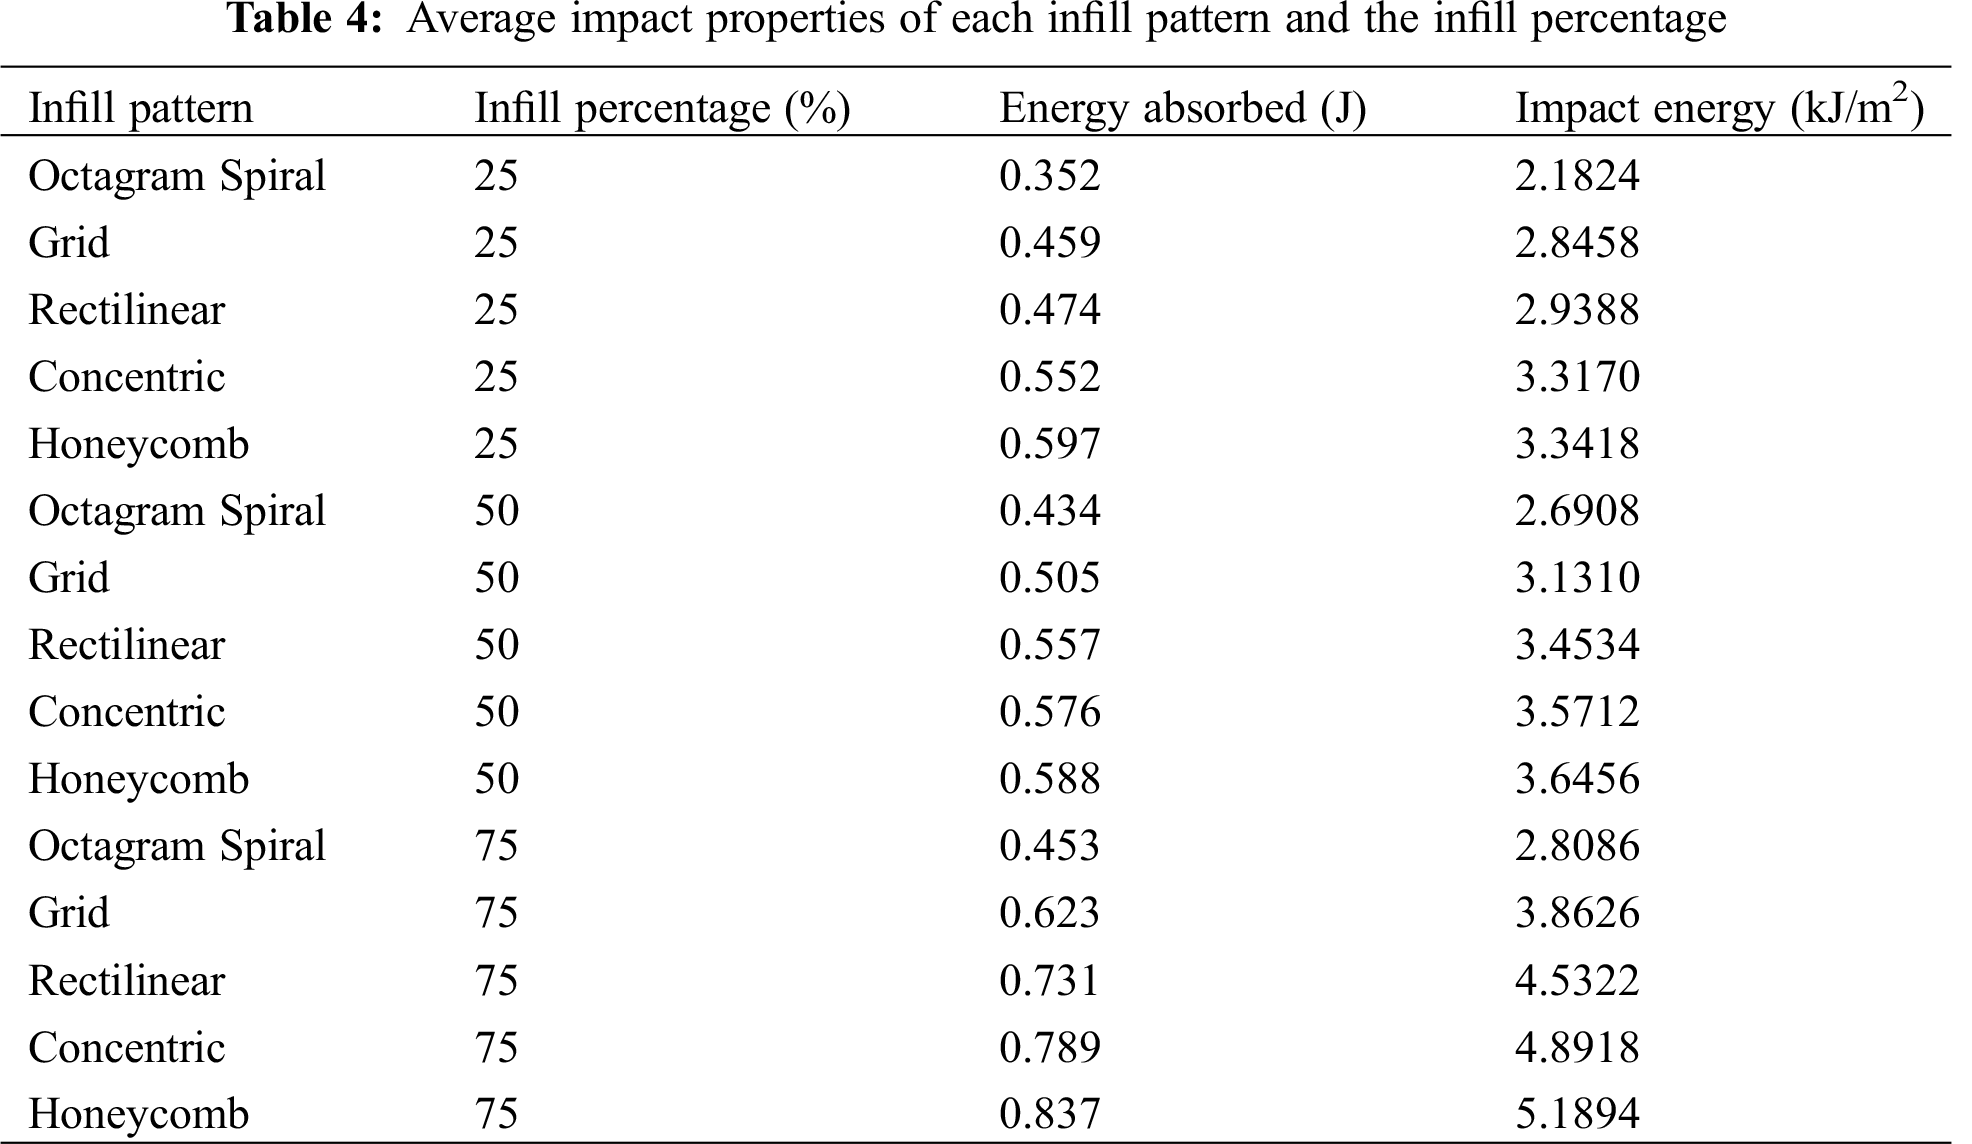
Based on the summarized results in Tab. 4 and Fig. 3, the highest energy absorbed belongs to the specimen with 75% infill percentage and honeycomb infill pattern, which contributes 0.837 J compared to other samples. From Fig. 3, it is obviously clear that with respect to each infill pattern, when the infill percentage increases, the value of the energy absorbed by the specimen would also increase. This is observed for each infill pattern as the highest energy absorbed is obtained by the 75% infill percentage, followed by the 50% and 25% infill percentages. However, the specimen with a honeycomb pattern observed to absorb the highest energy in all the infill percentages, followed by the concentric, rectilinear, grid, and octagram spiral pattern.
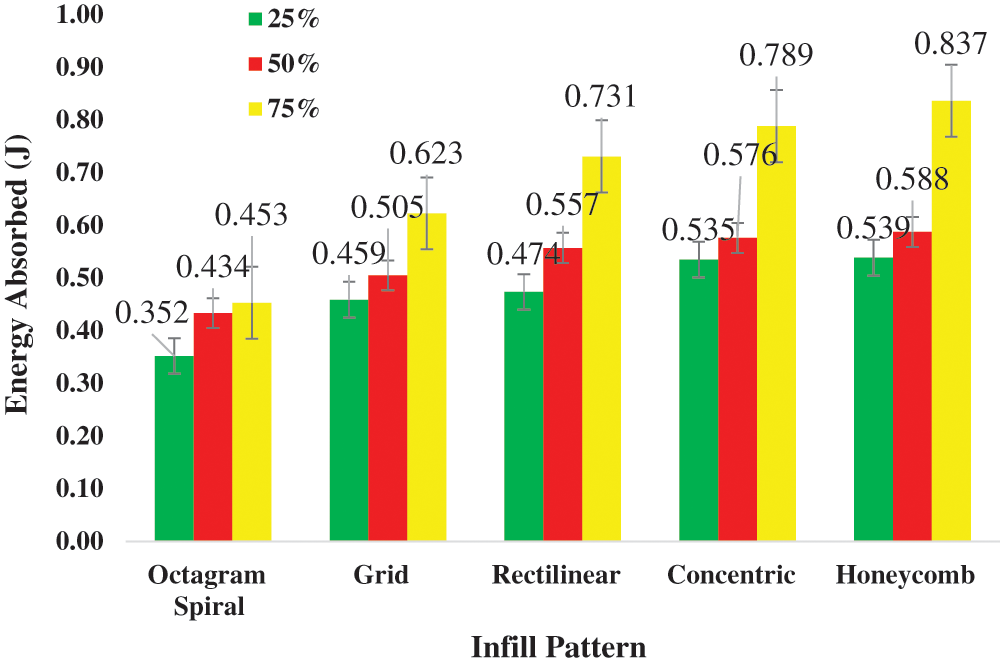
Figure 3: Experimental results of energy absorbed with respect to various infill patterns
Based on the summarized results in Tab. 4 and Fig. 4, the highest impact energy was obtained for the specimen with a 75% infill percentage with a concentric pattern of 5.1894 kJ/m2. Based on the acquired results, it is clearly seen that the impact energy increased with respect to the infill pattern while the infill percentage increases simultaneously. Meanwhile, these results prove that the 75% infill percentage has the highest impact energy, followed by the 50% and 25% infill percentages. Overall, the specimen with the honeycomb pattern has the highest impact energy, followed by the concentric, rectilinear, grid, and octagram spiral pattern. The acquired results are attributed to more contact points/sheared points per unit area perpendicular to the impactor [20]. This proves more resistance of the developed composite against the impactor, which in response facilitates more energy absorption.
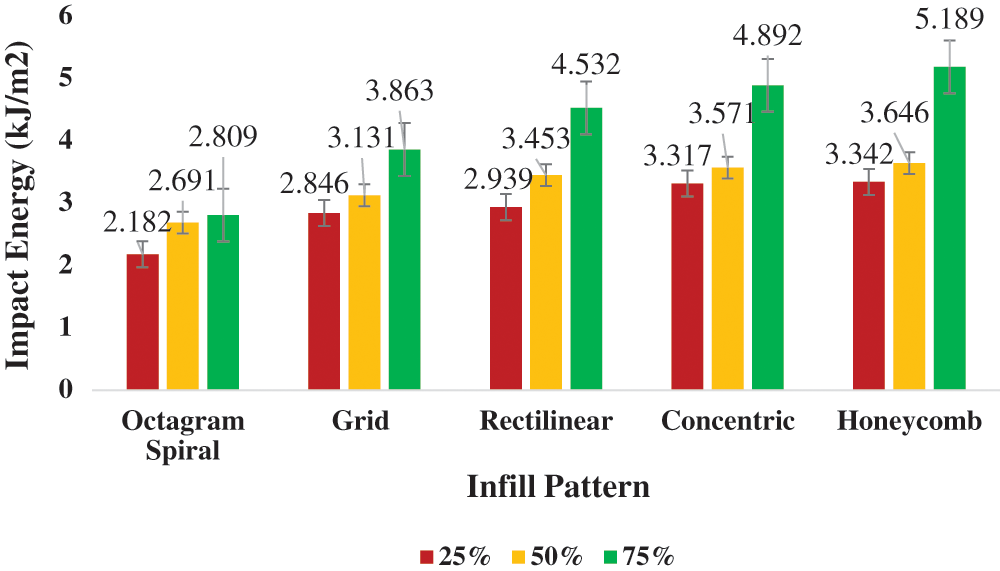
Figure 4: Experimental results of impact energy with respect to various infill patterns
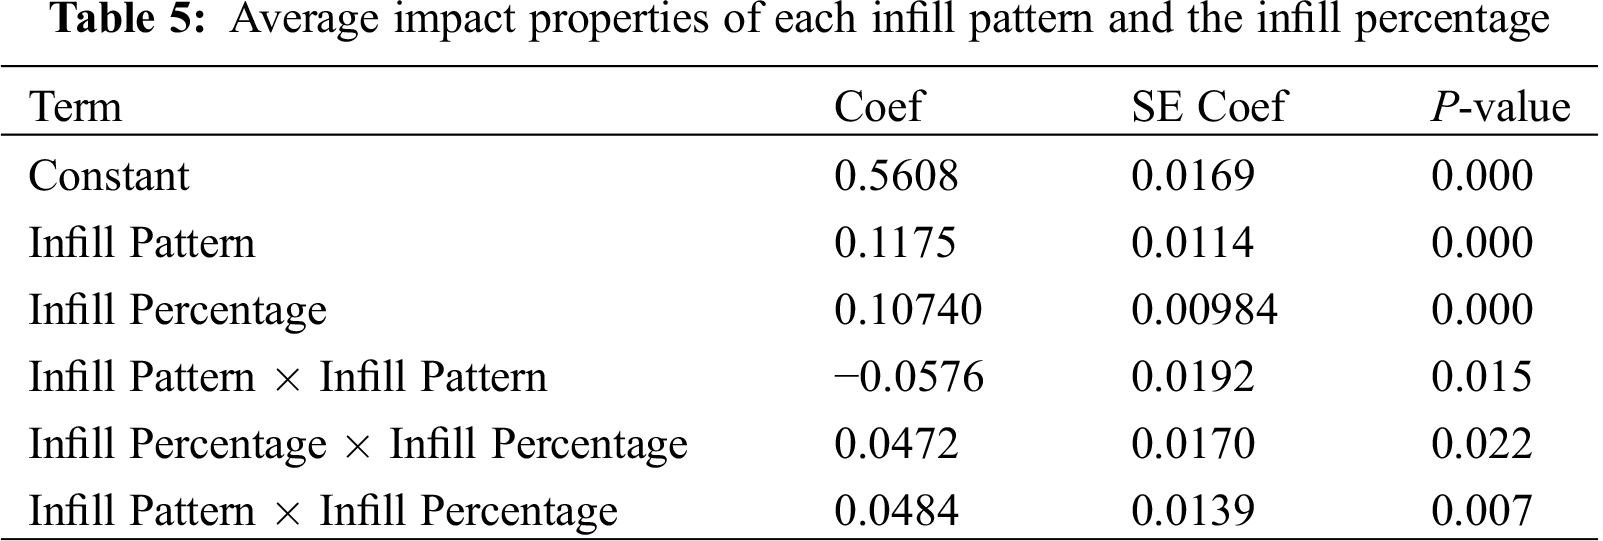
Tab. 5 states that the coefficients ‘Coef’, standard errors in estimating the coefficients ‘SE coef’ and p-value. The factors are likely to significantly impact if the p-value calculated is lower than the alpha value, which is 0.05. If the alpha value exceeds 0.05, it means the particular factor is not significant and will not affect much on the mechanical properties. Based on Tab. 5, infill pattern, infill percentage, a second-order term of infill pattern, a second-order term of infill percentage, the interaction effect of infill pattern and infill percentage gives significant effect since its p-value is 0.000, 0.000, 0.015, 0.022, and 0.007, respectively, which is smaller than the alpha value 0.05.
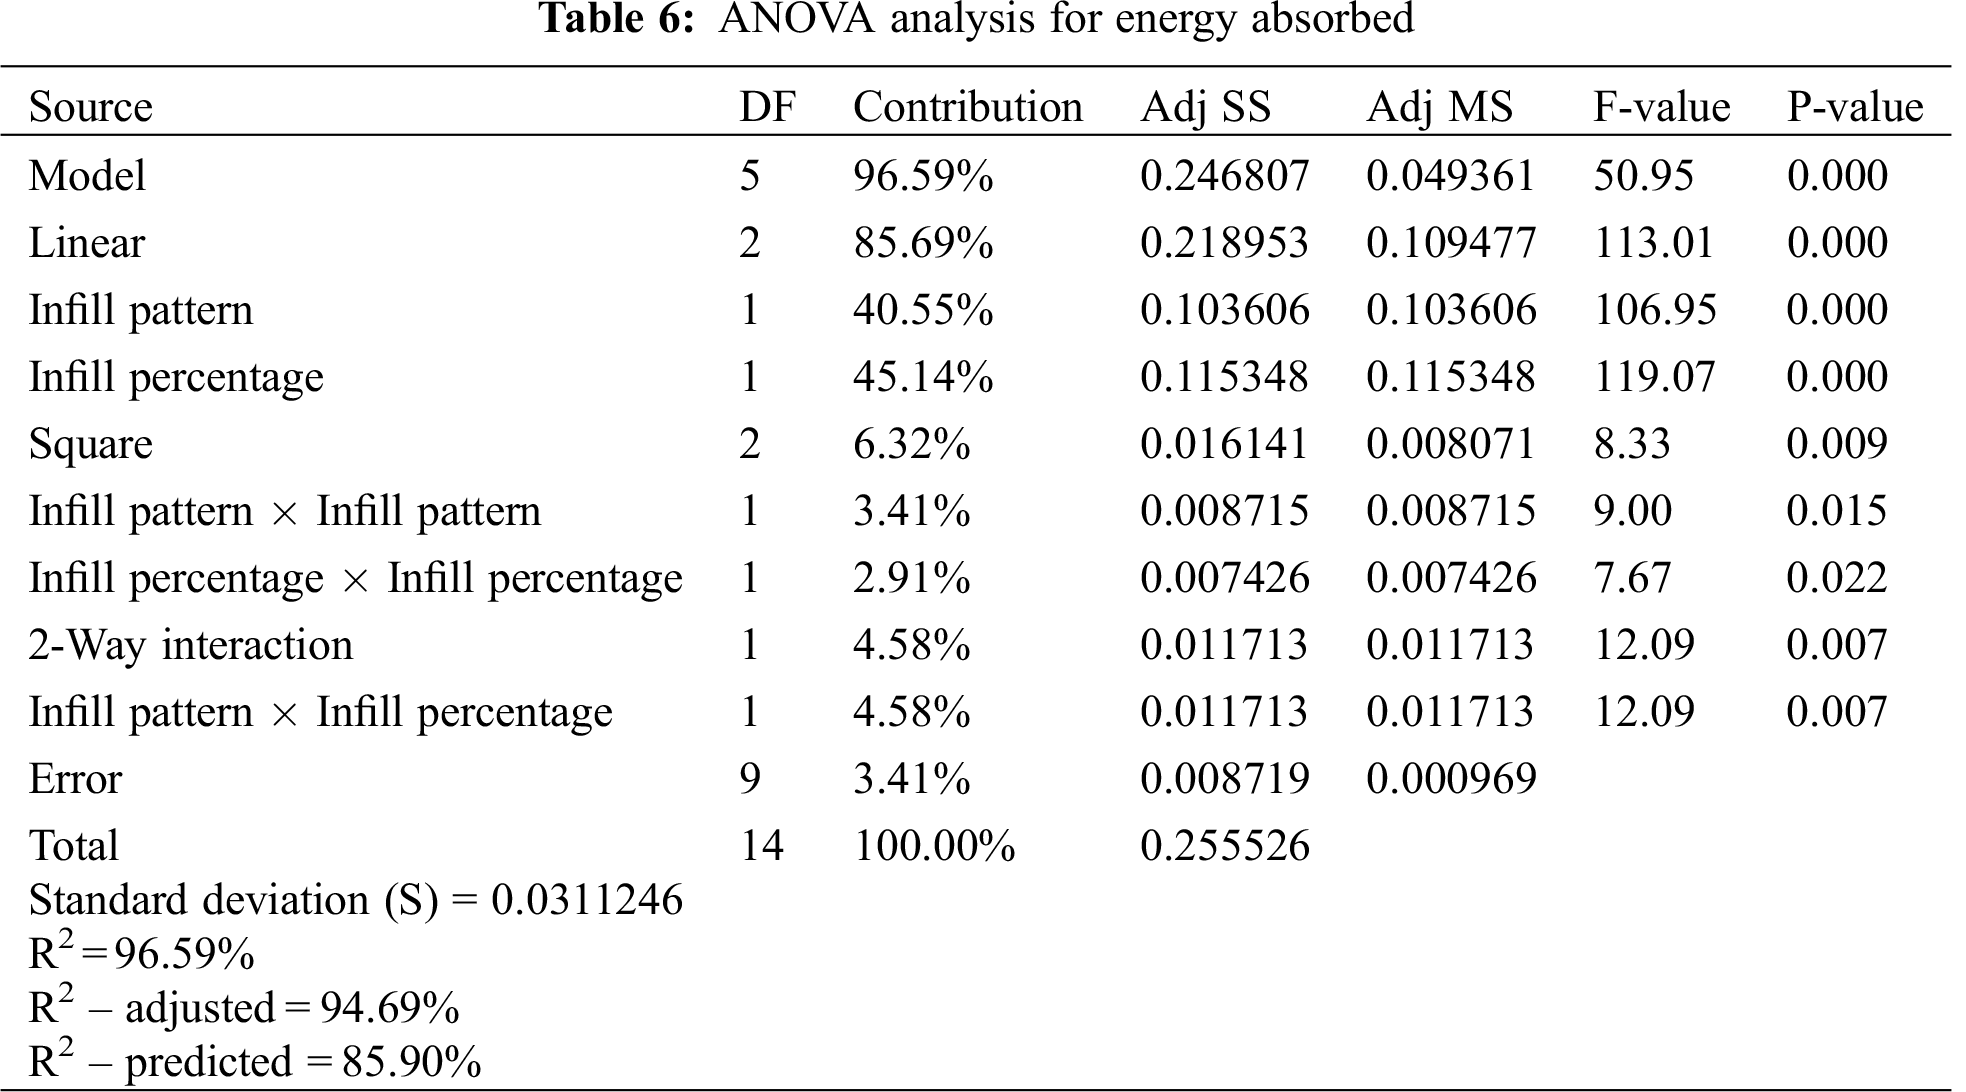
According to Fig. 5, each bar length is observed proportional to the absolute value of the estimated effects at a 95% confidence level. Thus, it is identified that infill pattern, infill percentage, the second-order term of infill pattern, the second-order term of infill percentage, and interaction effect of infill pattern and infill percentage show a significant influence on the energy absorbed. Tab. 6 proves the statement as all of the above factors has the highest contribution to determining the material’s energy. Referring to Tab. 6, the value of R2 is equal to 96.59%, indicating that the higher the value of R2, the better the model fits the data. The S value equal to 0.0311246 suggests that the models’ lower S value predicts the response better. Meanwhile, adjusted R2 equal to 94.69% is responsible for the number of predictors in the model that describes the relationship’s significance. The higher adjusted R2 indicates that the proposed mathematical model presents an impressive elaboration of the relationship between the properties and the response. On the other hand, the model’s predictive ability level, known as predicted R2, is 85.90%. The p-value obtained for the model is 0.000, which is less than the alpha value of 0.05. These results suggest that the model considered is statistically significant. The model produced from this analysis is as shown in Eq. (1).
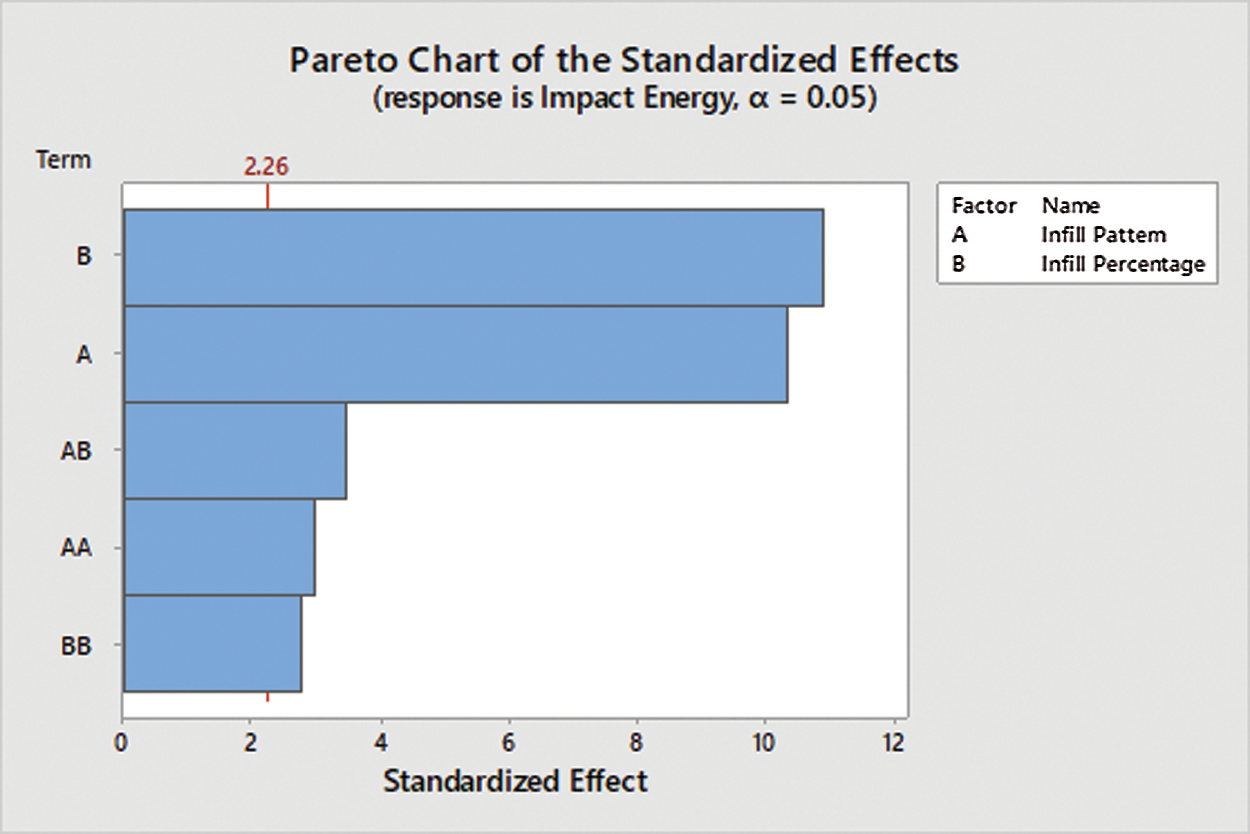
Figure 5: Pareto effects of energy absorbed with respective experiment parameters
A comparison is made between the energy absorbed from the experimental procedure and the theoretical results from the model generated, as shown in Tab. 7 and Fig. 6. Based on the results obtained, the difference between the experimental value and the theoretical value was found to be negligible. The mathematical model error for the energy absorbed ranges from smallest 0.28% to highest 12.17%, with the mean value of 3.98%. Therefore, the mathematical model could be highly recommended to regenerate the specimen with almost the same energy level absorbed with less error from the predicted value.
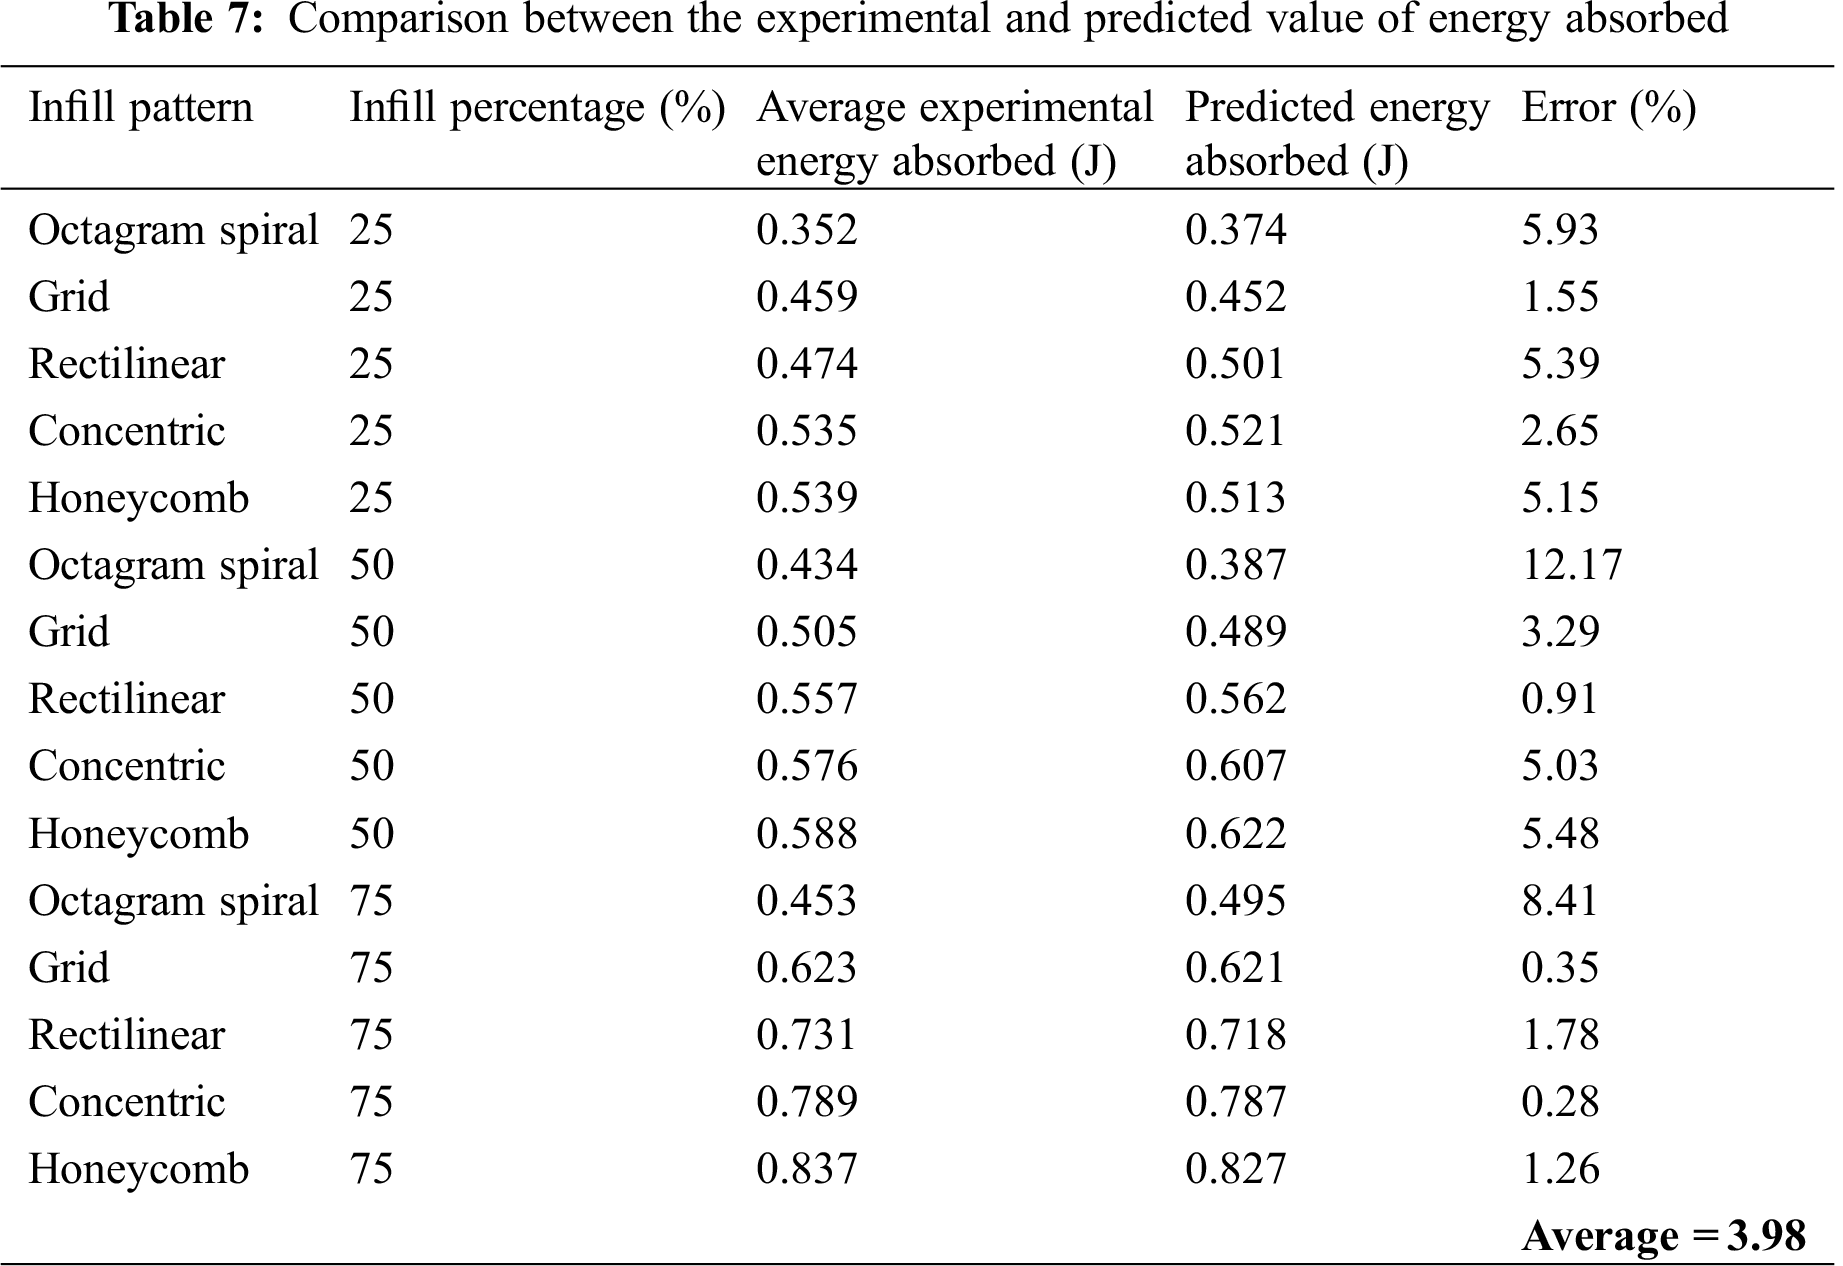
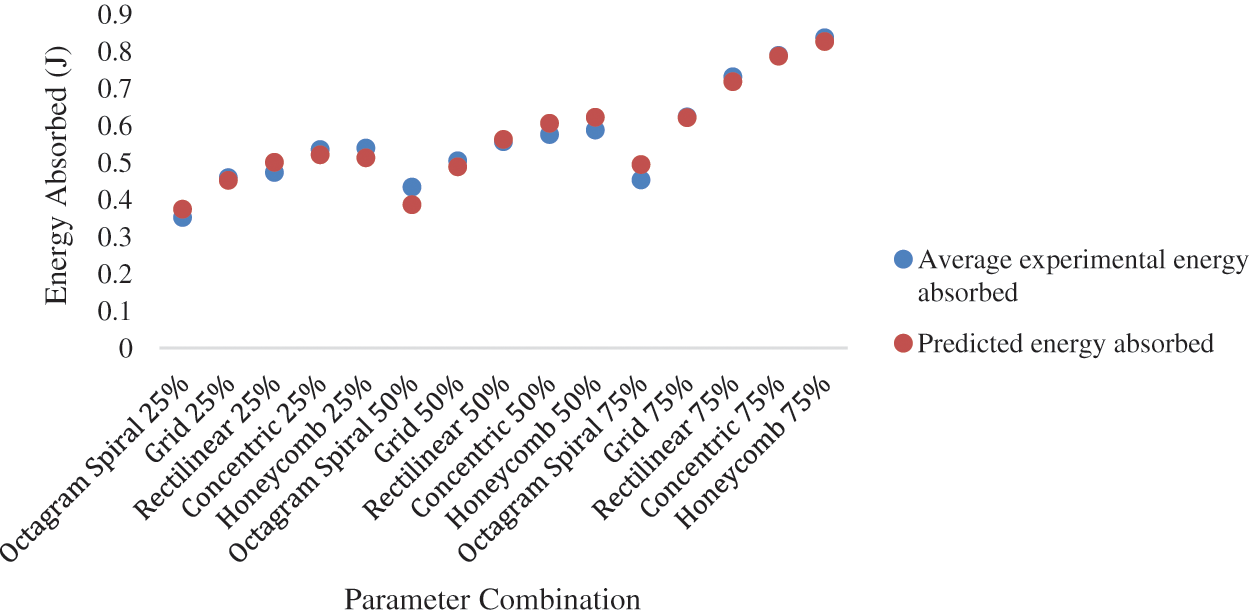
Figure 6: Comparison of experimental and predicted data of energy absorbed
Another analysis was conducted is to find out the maximum energy absorbed through the response optimization method. This response optimization helps identify the preferable value of the printing parameters used in the given constraint or a specific range to produce the highest energy absorbed. According to the analysis, it is clearly shown that the maximum energy absorbed, which could be reached, is 0.824 J, and it can be achieved by the parameter combination of honeycomb pattern and 75% infill percentage.
In this research, the primary purpose is to evaluate the impact properties of coconut wood-filled 3D printed components by using fused deposition modeling. The experimental and statistical evaluation performed elaborates on the effect of the infill pattern and infill percentage on the impact properties of printed coconut wood. In conclusion, the impact test reflects that infill percentage, infill pattern, the interaction effect of infill pattern with infill percentage, the second-order term of infill pattern, and second-order term of infill percentage give a significant impact on both impact properties, which is the energy absorbed and impact energy. Honeycomb infill pattern with 75% infill percentage gives the highest energy absorbed and impact energy in the experiment. The p-value clearly shows that all the impact properties are less than the alpha value of 0.05, which means that all the properties are essential to determine the impact properties. The validation process affirms that the generated mathematical model for the energy absorbed and the impact energy is reliable at an acceptable level to predict their respective properties. The errors occur between the experimental value, and the predicted value is 3.98% for the energy absorbed and 4.06% for impact energy. The optimum impact properties are honeycomb infill pattern and 75% infill percentage. Thus, the effect of infill percentage is essential in the impact properties due to high infill percentage will give the highly packed composition of product which can withstand a higher level of energy.
Funding Statement: The authors are grateful to Universiti Malaysia Pahang (https://www.ump.edu.my) for the financial support provided under the Grants RDU190350, RDU190351, and RDU190352.
Conflicts of Interest: The authors declare that they have no conflicts of interest to report regarding the present study.
1. Abdullah, F. (2016). Fused deposition modeling (FDM) mechanism. International Journal of Research in Science and Engineering, 7, 41–43. [Google Scholar]
2. Mireles, J., Espalin, D., Roberson, D., Zinniel, B., Medina, F. et al. (2012). Fused deposition modeling of metals. Proceedings of the Solid Freeform Fabrication Symposium. pp. 6–8Austin, TX, USA. [Google Scholar]
3. Bertsch, A., Bernhard, P., Vogt, C., Renaud, P. (2000). Rapid prototyping of small size objects. Rapid Prototyping Journal, 6(4), 259–266. DOI 10.1108/13552540010373362. [Google Scholar] [CrossRef]
4. Sitthi-Amorn, P., Ramos, J. E., Wangy, Y., Kwan, J., Lan, J. et al. (2015). Multifab: A machine vision assisted platform for multi-material 3D printing. Acm Transactions on Graphics (Tog), 34(4), 1–11. DOI 10.1145/2766962. [Google Scholar] [CrossRef]
5. Zein, I., Hutmacher, D. W., Tan, K. C., Teoh, S. H. (2002). Fused deposition modeling of novel scaffold architectures for tissue engineering applications. Biomaterials, 23(4), 1169–1185. DOI 10.1016/s0142-9612(01)00232-0. [Google Scholar] [CrossRef]
6. Gu, P., Li, L. (2002). Fabrication of biomedical prototypes with locally controlled properties using FDM. CIRP Annals, 51(1), 181–184. DOI 10.1016/S0007-8506(07)61495-4. [Google Scholar] [CrossRef]
7. Bose, S., Vahabzadeh, S., Bandyopadhyay, A. (2013). Bone tissue engineering using 3D printing. Materials Today, 16(12), 496–504. DOI 10.1016/j.mattod.2013.11.017. [Google Scholar] [CrossRef]
8. Stevens, M. M. (2008). Biomaterials for bone tissue engineering. Materials Today, 11(5), 18–25. DOI 10.1016/S1369-7021(08)70086-5. [Google Scholar] [CrossRef]
9. Chua, C. K., Leong, K. F., Lim, C. S. (2010). Rapid prototyping: Principles and applications (with companion CD-ROM). Singapore: World Scientific Publishing Company. DOI 10.1142/5064. [Google Scholar] [CrossRef]
10. Pham, D., Dimov, S. S. (2012). Rapid manufacturing: The technologies and applications of rapid prototyping and rapid tooling. London: Springer Science & Business Media. DOI 10.1007/978-1-4471-0703-3. [Google Scholar] [CrossRef]
11. Wu, W., Ye, W., Wu, Z., Geng, P., Wang, Y. et al. (2017). Influence of layer thickness, raster angle, deformation temperature and recovery temperature on the shape-memory effect of 3D-printed polylactic acid samples. Materials, 10(8), 970. DOI 10.3390/ma10080970. [Google Scholar] [CrossRef]
12. Christensen, K., Davis, B., Jin, Y., Huang, Y. (2018). Effects of printing-induced interfaces on localized strain within 3D printed hydrogel structures. Materials Science and Engineering: C, 89, 65–74. DOI 10.1016/j.msec.2018.03.014. [Google Scholar] [CrossRef]
13. Kulich, D. M., Gaggar, S. K., Lowry, V., Stepien, R. (2002). Acrylonitrile–butadiene–styrene polymers. Encyclopedia of Polymer Science and Technology, 1. DOI 10.1002/0471440264.pst011. [Google Scholar] [CrossRef]
14. Yan, F., Robert, Z., de Lamothe, Ń., de, M., International Potash Institute (1968). The coconut palm. International Potash Institute, Berne. [Google Scholar]
15. Le Duigou, A., Castro, M., Bevan, R., Martin, N. (2016). 3D printing of wood fibre biocomposites: From mechanical to actuation functionality. Materials & Design, 96, 106–114. DOI 10.1016/j.matdes.2016.02.018. [Google Scholar] [CrossRef]
16. Guessasma, S., Belhabib, S., Nouri, H. (2019). Microstructure and mechanical performance of 3D printedwood PLA/PHA using fused deposition modelling: Effect of printing temperature. Polymers, 11(11), 1778. DOI 10.3390/polym11111778. [Google Scholar] [CrossRef]
17. Kain, S., Ecker, J. V., Haider, A., Musso, M., Petutschnigg, A. (2020). Effects of the infill pattern on mechanical properties of fused layer modeling (FLM) 3D printed wood/polylactic acid (PLA) composites. European Journal of Wood and Wood Products, 78(1), 65–74. DOI 10.1007/s00107-019-01473-0. [Google Scholar] [CrossRef]
18. Sun, Y., Lee, D., Wang, Y., Li, S., Ying, J. et al. (2020). Effect of infill value on decay resistance, thermal, and mechanical properties of 3D printed polylactic acid composites filled with wood fibers. BioResources, 15(3), 6724–6734. [Google Scholar]
19. Kariz, M., Sernek, M., Kuzman, M. K. (2018). Effect of humidity on 3D-printed specimens from wood-pLA filaments. Wood Research, 63(5), 917–922. [Google Scholar]
20. Aloyaydi, B., Sivasankaran, S., Mustafa, A. (2020). Investigation of infill-patterns on mechanical response of 3D printed poly-lactic-acid. Polymer Testing, 87, 106557. DOI 10.1016/j.polymertesting.2020.106557. [Google Scholar] [CrossRef]
 | This work is licensed under a Creative Commons Attribution 4.0 International License, which permits unrestricted use, distribution, and reproduction in any medium, provided the original work is properly cited. |