| Energy Engineering |
DOI: 10.32604/EE.2021.016732
ARTICLE
Evaluation of Thermal Comfort and Energy Usage for an Enclosed Cavity Indifferent Climatic Zones of India
1School of Mechanical Engineering, Shri Mata Vaishno Devi University, Katra, Jammu & Kashmir, 182320, India
2School of Energy Management, Shri Mata Vaishno Devi University, Katra, Jammu & Kashmir, 182320, India
3School of Architecture and Landscape, Shri Mata Vaishno Devi University, Katra, Jammu & Kashmir, 182320, India
*Corresponding Author: Yatheshth Anand. Email: yatheshthanand@gmail.com
Received: 21 March 2021; Accepted: 07 June 2021
Abstract: The utilization of energy in building sectors comprises 30–40% of the entire global energy consumption. Most of the energy is being utilized for cooling & heating the buildings. These cooling and heating depend on the nature of climate for different places. In this, the detailed analysis of the building envelope across five areas (viz. Srinagar, Jaisalmer, New Delhi, Thiruvananthapuram and Bangalore) representing different climatic zones had been carried out. Simulations are performed for these locations using eQUEST and ANSYS software. Three of the result output from the eQUEST simulation are used to assess the different cases. These outputs are: total electrical energy consumption of the year, peak cooling load & peak heating load for a particular time of the year. Temperature variations and airflow for a fan with moisture influence are also simulated for five different locations by using the radiation model and shear stress transport in ANSYS. The internal temperature distribution in accordance with an occupant is also compared and discussed for the five regions. Lastly, the predicted mean vote and predicted percentage of dissatisfaction are found to be in the range of −0.50 to −0.99 for all zones that signifies 13% to 30% of people are dissatisfied with the indoor environment.
Keywords: Thermal comfort; climatic zones; peak loads; buildings
Nomenclature
| MR = | Metabolic rate in W/m2 |
| WE = | External work in W/m2 |
| P = | Partial pressure of water vapor in Pascal. |
| T = | Represents the temperature of the air (K) |
| fcl = | Denotes factor for clothing area |
| Tcl = | Temperature of clothing (K) |
| Tr = | Radiant temperature (K) |
| icl = | Clothing insulation |
| h = | Convective heat transfer coefficient in W/m2 °C |
| TR = | Ton of refrigeration |
Among the 30–40% of building’s energy consumption, 80% of energy is required for maintaining the level of comfort [1]. With the increase in energy demand, the direct impact was observed on the level of greenhouse gas emission [2]. So, it is important to reduce these greenhouse gases (GHG). The integration of renewable energy sources in buildings is a smart way to decrease the environmental issues related to increased energy consumption and GHG emissions However, it is also required to bear in mind the point of comfortable indoor environment for the occupants with the energy efficient building because people mostly spent their time in the indoors, and an inappropriate indoor environment can results in a reduced work efficiency [3]. Therefore, appropriate measures/techniques are needed that works to achieve the required comfort. Some of the studies that presented different appropriate measures are: Rijal et al. 2007 proposed the study that evaluates energy usage and thermal comfort in the buildings with open windows. As a result of the study, an appropriate algorithm has been developed for simulation which assists in designing of a comfortable and energy efficient building [4]. Similarly, it was evident that passive building characteristics such as improved walls, glazed windows and modified structural designs leads to the reduction of energy consumptions [5]. Recently in 2021 a statistical-based optimization technique had been used in the study to develop an energy efficient as well as a thermally comfortable environment and as results 20% of the heat energy savings was achieved [6]. Although, for a thermally comfortable environment it is also important to check the quality of indoor air in which occupant has to spend their time. So, effect of the airflow generated from air conditioner and fan on the air quality was examined by considering humidity level, velocity and temperature distribution inside an envelope [7]. As a result they revealed that the terms IAQ and thermal comfort are somehow interdependent. Affecting one will simultaneously impact other also.
Climate is an important aspect in the daily living of human beings. The change in the climatic conditions directly affects the mental and physical characteristics of a human being. So, it is standard expertise to evaluate the different climatic conditions, so that, the effect of mental and physical effort on human beings will be checked [8]. Classification of buildings according to the climate is an advancement for the functional design of buildings. The elements of climate which promote and shows the different rate of heat dissipation from the human skin requires some special building features to achieve thermal comfort and these aspects are grouped to form a climatic zone. The major components of climate which show the effect on human comfort are air humidity, air movement, temperature, solar radiation, and rainfall. It is possible to estimate the indoor thermal environment in a building only when the climatic elements and needs of a site are thoroughly analyzed. However, due to the interaction between the natural stresses and the building component, it is difficult to achieve an ideal indoor thermal environment. Although, it is possible to design a building that provides comfort at a minimized cost.
Various researchers studied the effect of climate on building energy consumption. Kumar 2017 studied thermal performance of the building for five climatic zones in India based on different window glass and building materials, results show combination of the brick wall made of mud with bronze reflective glass is the best energy-efficient model [9]. Pingel 2007 studied the concept of natural ventilation in buildings, six naturally ventilated buildings were constructed and studied for the warm and humid climatic zone [10]. However, the above studies generally studied the range of building characteristics in different climatic regions for checking of variation in the energy consumption. Apart from these passive building characteristics, energy consumption also depends on the active systems like conditioning systems that are installed to maintain the required comfort level. So, it is important to check the effect of outdoor climatic conditions on these active systems. Elgendy et al. 2017 proposed a study that consider the effect outdoor conditions on an air-conditioning system. It was evident from the study that increase in the outdoor air temperature effects the coefficient of performance of system and decrease it by 51.6% [11]. While several researchers have simulated buildings through software like eQUEST, ANSYS, and TRNSYS to study as well as to calculate energy consumption and appropriate thermal comfort conditions in buildings. Song et al. 2015 simulate the building of library in Tianjin Polytechnic University using eQUEST [12]. Variables like light power density, indoor design temperature, and air supply temperature were considered, and based on these variables the effect on total energy consumption was studied. However, the researchers like Fahmy et al. 2019 modeled and simulated the historic building of Al Azhar for three types of different wall materials in eQUEST [13]. While researchers over the world are working on fluid flow, thermal analysis, and pressure study in buildings using CFD (Computational fluid dynamics). Arun et al. 2005 studied the flow of air inside an enclosure by comparing the three models, i.e., SST (shear stress transport) k-ω, k-ε (renormalization group) and Reynolds stress model. As a result of the simulation, they found SST k-ω best among the three [14]. Similarly, Verma et al. 2018 modeled and simulated a ceiling fan for a hostel room in a university by using the SST k-ω model [15]. For thermal analysis, Balocco et al. 2008 compared the simulation results based on thermal performances of the wall without insulation as well as wall with external insulation and found that the external cladding was an effective approach to reducing cooling and heating loads with improved thermal indoor thermal comfort [16].
However, it is evident from the literature that indoor and outdoor conditions of the buildings with different conditioning systems are greatly impacted by change in the climate. So, in this communication, a novel approach is considered that includes use of Fluent, a module of Ansys and eQUEST. It involves utilization of Fluent for evaluating the influence of climatic conditions on occupant’s comfort across five climatic zones with special consideration on humidity and solar assessment. However, eQUEST was utilized to study the impact of different climatic conditions on energy consumption. Atlast, the results obtained from the simulations were utilized to calculate the indices like a predicted mean vote (PMV) and predicted percentage dissatisfaction (PDD) for estimating thermal comfort inside the room.
The envelope that has selected in the study is considered as an office room with a single floor area of 12.41 m2. The envelope is simulated for five different locations based on different climatic zones of India. The geographical position of locations are given in Fig. 1 and correspondingly the psychrometric values that are selected in study are listed in Tab. 1. The room is rectangular with walls having an area of 10.05 m2 and 13.45 m2, respectively. An occupant is considered inside the room with an equipped air conditioner and ceiling fan which is shown in Fig. 2.

Figure 1: Geographical position of the locations under different sets of climatic zones

Figure 2: Side view of building envelope

3 Problem Definition & Methodology
With the increase in the comfort requirement of humans, fulfilling energy demand in the building is an important area of research. So, it is required to look out for the proportion of energy usage in buildings. More specifically, cooling and heating loads calculations of a building we can select an efficient system that leads to lower energy consumption with a higher level of comforts. In this communication, a typical room is selected for analysis of various loads using eQUEST. For this, a simplified heat balance method is used by eQUEST to calculate the system and space loads. In the “LOADS” function, the heat gain for the zone is calculated by defining zone temperature from weather data files. Then, the cooling load is calculated based on internal energy sources and envelope gains. After that weighting factors method (hourly thermal load calculation) applied to zone materials to evaluate the amount of energy stored that on a later stage is released into space. eQUEST uses design days based on user-defined or ASHRAE data. The data defined is used as input in the “LOAD” subroutine to evaluate peak values. These values can be used to select and size the appropriate HVAC system based on the climatic conditions. Another problem, which is observed in the daily life of a human is inadequate thermal comfort in an envelope. So, it is important to figure out the inner conditions of the envelope with better thermal comfort and quality of indoor air. CFD-based calculations are used in this study which works on the principle of the Navier Strokes equation (NSE). The effect of solar radiation is also applied to the envelope by using Solar loading for human comfort modeling. This uses a solar ray tracing algorithm for incident solar radiation on an envelope which results in predicting the direct illumination energy source. Based on the results obtained from the simulations, the thermal sensation scale of Fanger [18] viz PMV followed by PDD-based calculations were performed to study the thermal comfort inside the building envelope the thermal sensation scale is presented by Fig. 3. Equation of PMV is given as:

Figure 3: Thermal sensation scale
where ‘icl’ represents the clothing insulation which has been taken as 0.50 for a casual clothing. On the solution of the above equation, it helps in obtaining the PDD value. PDD denotes the proportion of people that feels discomfort with the corresponding envelope environment. Equation of PDD is given as:
For making analysis realistic, a similar building envelope was developed in the two programs. In eQUEST building was selected as an office building with an area of 12.41 m2 and a DX-cooling system. The roof and floor are considered to be consist of 0.2032 m thick with no external insulation. Walls are modeled by a custom layer of brick with 0.1016 m thickness and 0.7211 W/m-K thermal conductivity. No doors and windows are considered on the envelope as it has been assumed that air-conditioners is working for maintaining the indoor temperature with all windows and doors to be closed. So, the simulations are conducted for closed volume. For analysis five days a week is considered to be occupied and two weekend days to be unoccupied with 8 working hours with an occupant. As the room is considered as an office room and in between the office hours space is utilized by a single person. An air conditioner as a DX-cooling sytem and a ceiling fan are considered inside the envelope which consists as the major energy consumption devices.
Standard conditions are used for an air conditioner that is provided in the DOE 2.2 database. Relative humidity, global radiations, dry bulb temperature, dew point temperature, wet bulb temperature are some parameters that are provided according to the different locations weather data. In ANSYS 18.2, design modeler is used to create a three-dimensional(3D) model of the envelope with a volume approximated to be 37 m3 and a height of 3 m. Similarly, the envelope created is considered as a typical office room with a fan and an air-conditioner. Modeling of the fan is a complex task and requires large computational power. For reducing this power and time, the circular disk is developed as a ceiling fan as air originates from fan fins only. So, axial theta and radial component are provided to the outer ring of the fan as momentum sources but it should be ensured that no air is originating from the central hub. 0.2 and 0.6 m are the hub diameter and fin length used for study respectively. 3D model of envelope created by ANSYS is shown in Fig. 4. In order to discretize the envelope into a number of parts meshing of ANSYS 18.2 is used. So, every node of the mesh structure is accompanied by the volume. The mesh structure is generated by using adaptive size functions having a total of 11722 nodes and 52130 elements. 60 and 8 N/m3 are given as the axial and theta momentum source for downward motion and rotation of air originates from the fan. Effect of relative humidity (RH) has been taken inside the envelope according to different locations and therefore Humidity ratio (HR) has been involved in the room as the input parametrs. The values of RH and HR for five different locations are given in Tab. 1. Global radiations are considered using different latitude and longitude angles of the locations. Air conditioner inlet has been taken on the wall from which air is originating with temperature and velocity of 297 K and 3 m/s respectively and the total air flow inside the envelope have been influenced by combined effect generated from air conditioner and fan. The occupant considered has a metabolic rate of 80 W/m2 which is taken as heat flux originated from the body while the person is standing in an office [19] with heat coefficient rate taken as 8.41 W/m2-K. Also, the different boundary conditions are listed in Tab. 2.

Figure 4: Isometric view of building envelope in ANSYS

Bellos 2016 building model has been recreated for the validation of eQUEST results [20]. In their study, energy consumed by cooling and heating systems calculated from eQUEST and was compared with TRNSYS results. 100 m2 of the area with 3 m of height was considered as dimensions in their study with customized layer materials of walls, roof and ground having an overall heat transfer coefficient of 0.39 W/m2-K, 0.37 W/m2-K and 0.30 W/m2-K, respectively. The comparison between their results (Bellos 2016) and the recalculated values of cooling and heating energy load is shown in Fig. 5a. Similarly, validation of ANSYS 18.2 approach has been done by recreating the room 1 of [21] in design modeler of workbench. They have considered ceiling fan as a cylindrical disc in their study with 1.4 m & 0.2 m swept and hub diameter respectively. 8 points are considered in two vertical planes with height of 0.65 & 0.15 m from the floor for measurement of velocity inside the room. In the analysis, comparison between the simulated and the measured values of air velocity in the room is represented by Fig. 5b.

Figure 5: (a) Comparison of results in Bellos 2016 [20] (b) Velocity comparison between simulated and measured values of Room 1 [21]
In this study, eQUEST and ANSYS simulations on building envelope are performed for five different locations of India. Results simulated from eQUEST are shown in Figs. 6a and 6b which include representation of annual energy consumption and peak thermal load for envelope respectively. Jaisalmer, Thiruvananthapuram, Srinagar, Bengaluru and New Delhi are the five locations studied and by concerning their data files, annual energy consumption by space cooling, ventilation, and pump auxiliaries are discussed. With this, peak thermal load calculation for a maximum temperature day of a year is also reported. Peak thermal load graph in Fig. 6b represents that Jaisalmer, Thiruvananthapuram, and New Delhi show the maximum capacity of thermal cooling load. The annual energy consumption is also seen in these locations because these zones are high-temperature regions and consume maximum energy for space cooling. The maximum thermal heating load is noticed in the Srinagar region with minimum actual energy consumption because it is a cold and cloudy region, consumes a lower amount of energy for space cooling but requires energy for space heating. Bangalore being a moderate climatic zone requires a normal amount of energy for space cooling and less amount of thermal heat load depends on the longest cold nights. So, it is important to study the effect of different climatic zones on building envelopes.
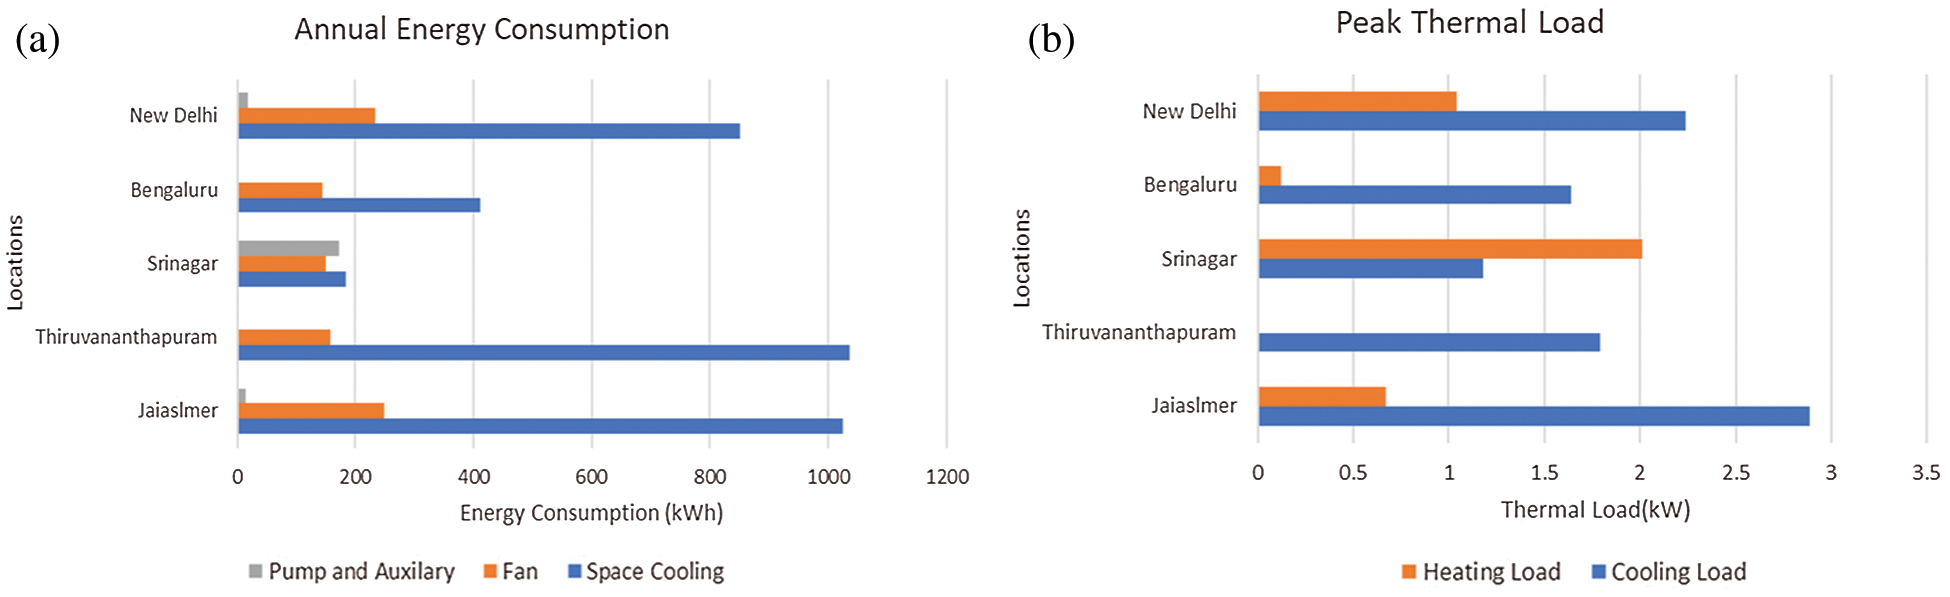
Figure 6: (a) Annual energy consumption (b) Peak thermal load
Similarly, results simulated from CFD-based simulations are used for the analysis of airflow, variation of temperature and range of humidity inside a typical office envelope for different longitudes and latitudes of the locations. Based on these results, PMV-PDD is checked to derieve the envelope indoor thermal comfort level for the people in the selected space. Air flows generated in the space due to ceiling fans and air conditioner are no-uniform in nature. So, it is important to select a best-fitted turbulence model. SST (k-ω) is chosen based on the study by [21].
For, studying change in indoor air quality due to presence of moisture inside the envelope, the species transport model is adopted. Along with that, the effect of climate on the envelope is studied for five locations using the solar ray-tracing model. The solar radiation incident at the south-facing wall of the envelope and results in the rise in temperature of that area, conduction takes place from the south side is represented by three planes at the centre of the envelope. Velocity streamlines show the movement of air generated from the air-conditioner and ceiling fan and how it behaves inside the envelope is represented by Fig. 7. The velocity of air in the envelope ranges from 0 to 3.712 m/s. In our conditions, we have simulated that velocity remains the same inside the envelope for all zones. Figs. 8a–8e show the temperature contours inside the envelope for five zones. The temperature of all zones are ranging from 297 to 314.50 K. The maximum and minimum peak temperature is noticed for Jaisalmer and Srinagar, i.e., 314.50 & 308.8 K respectively. The heat is conducted inside the envelope from the walls depending on the ambient conditions. Some red color zones near the walls show the conduction from the wall to the inner volume. Some sky-blue color regions are also observed which shows the temperature inside the envelope ranges from 297–300 K. However, the blue zone is seen just below the air conditioner which represents a little lower temperature. Also, in terms of temperature, it has been observed almost uniformity is attained inside the envelope.

Figure 7: Velocity streamlines of air originate from an air conditioner and ceiling fan
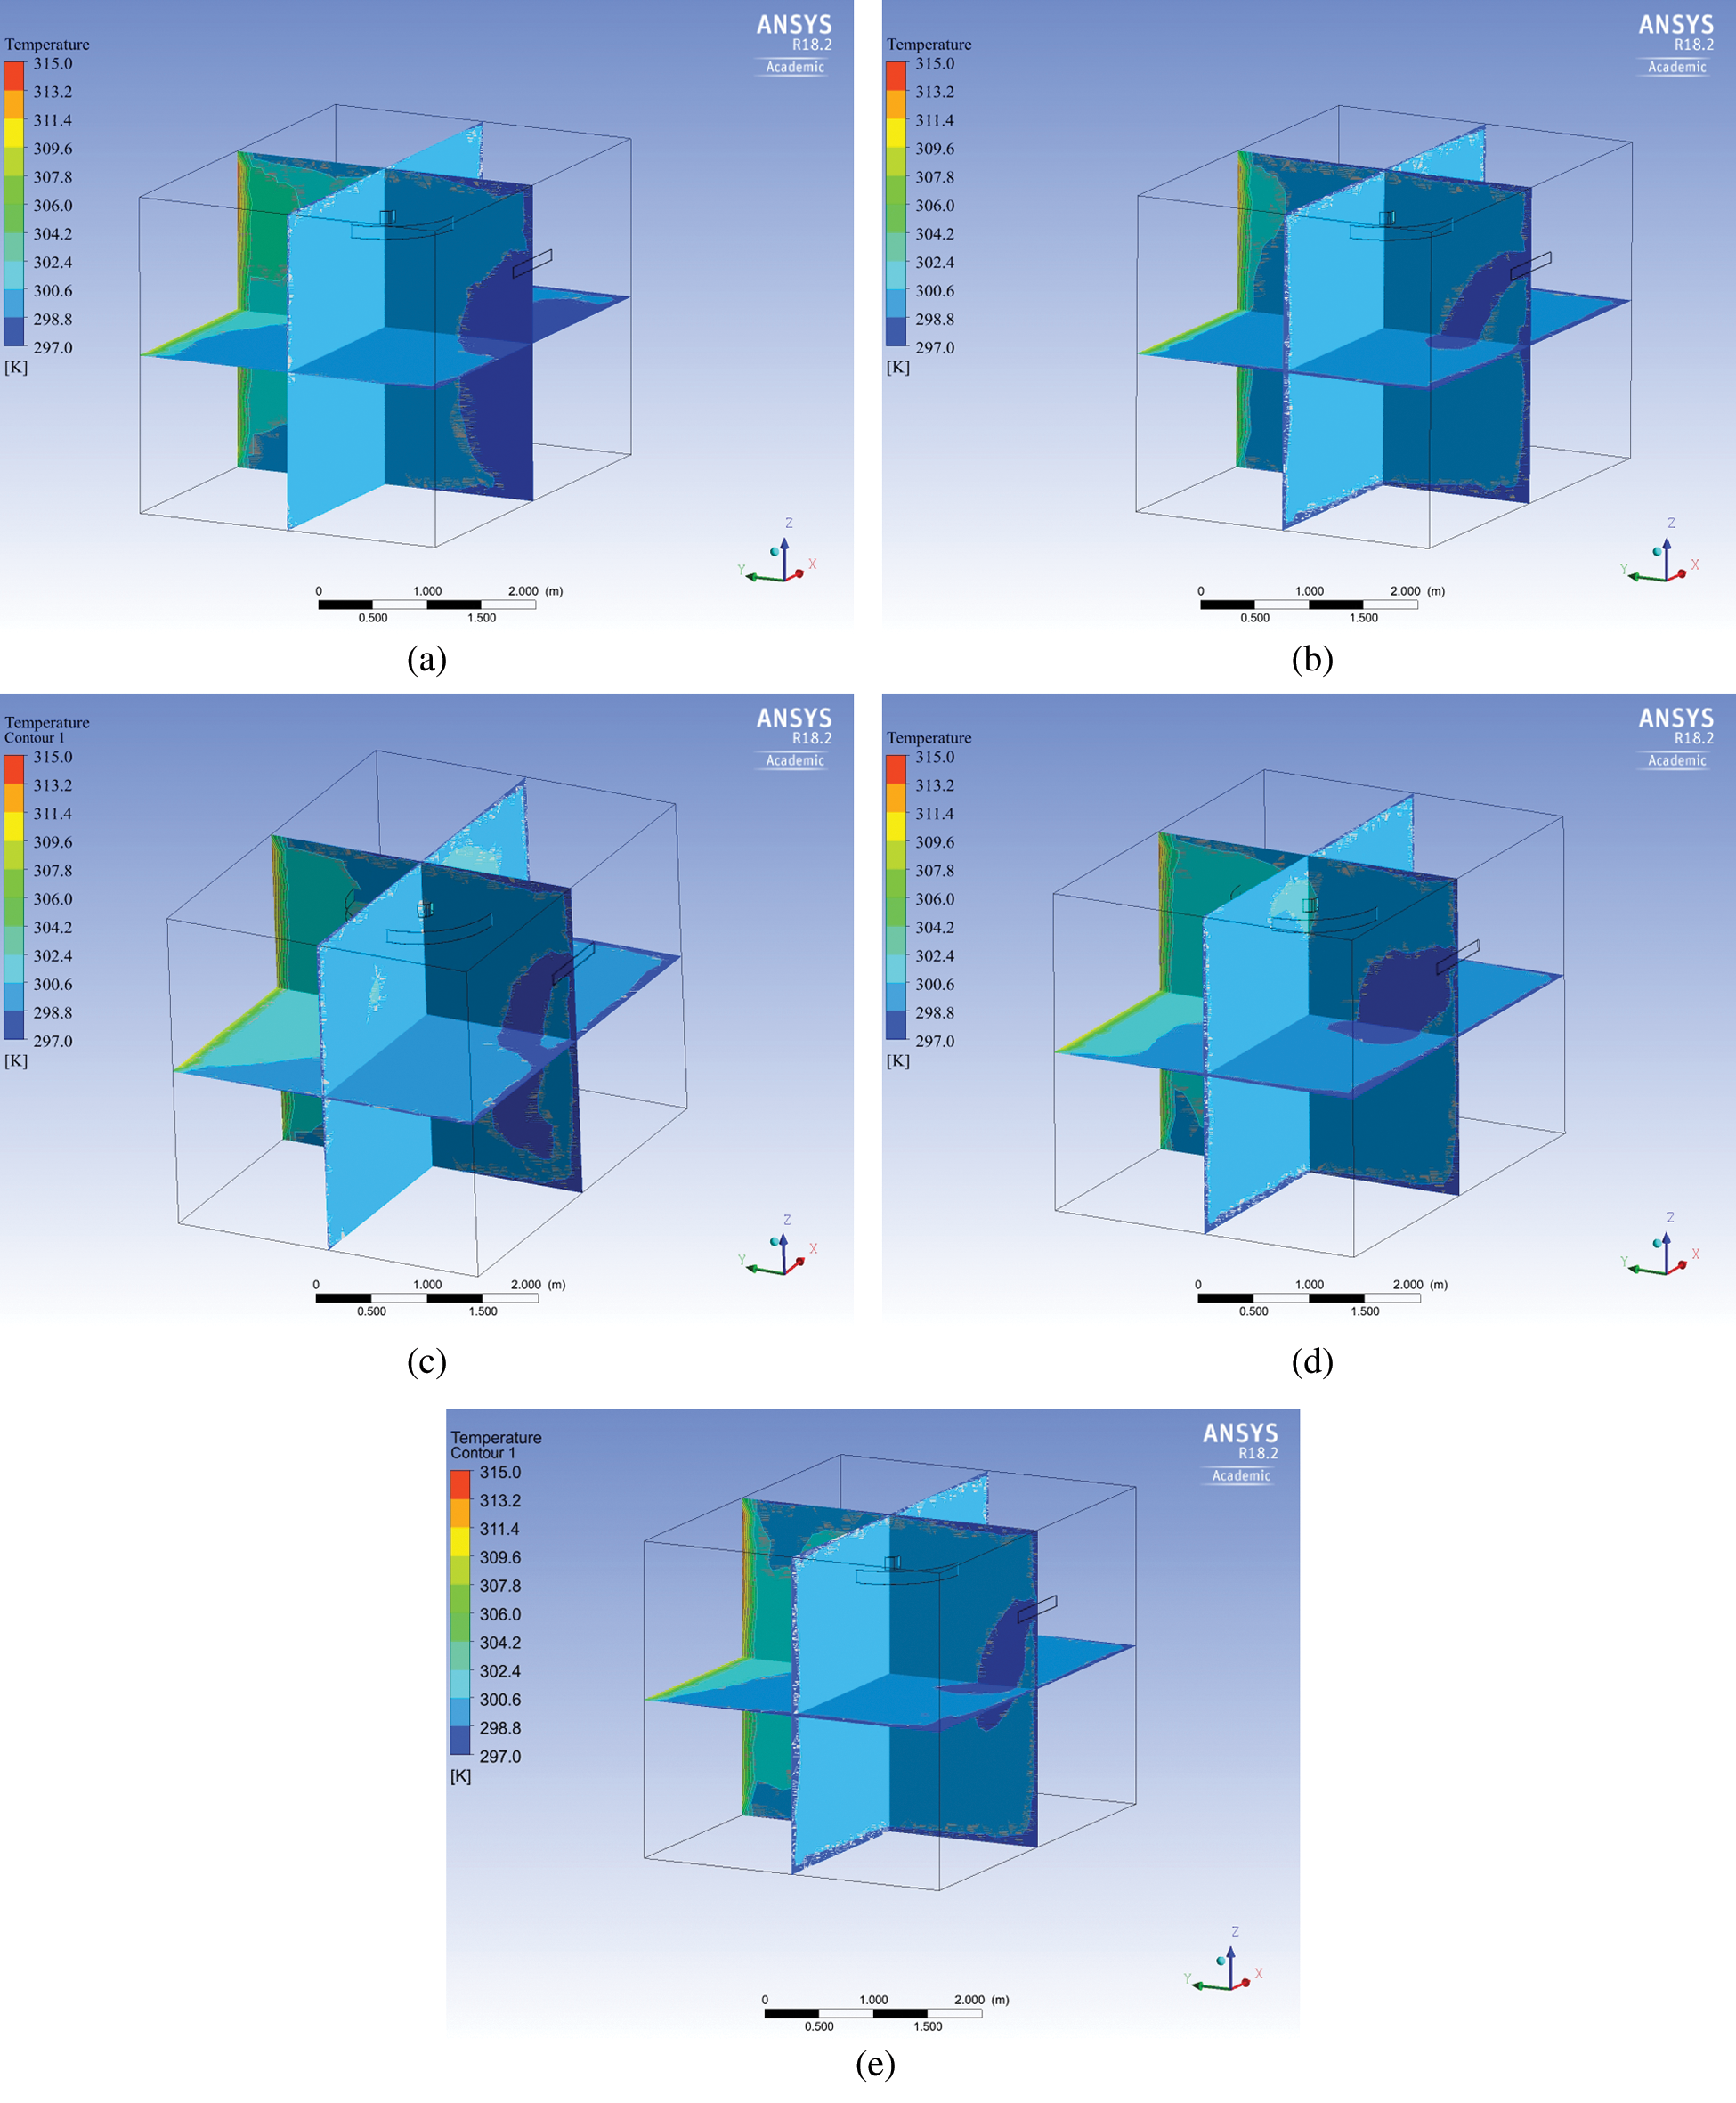
Figure 8: Temperature contour inside the room (a) Jaisalmer, (b) Thiruvananthapuram, (c) Srinagar, (d) Bengaluru & (e) New Delhi
Here, Figs. 9a–9e represent the moisture behavior which is present inside the envelope in terms of air relative humidity (RH). By observing the contours of all locations, 88.9% humidity has been noticed for Thiruvananthapuram as it is a warm and humid climatic zone and 44.01% for Jaisalmer which comes under the hot and dry climatic zone. However, there is a blue color patch that shows humidity lesser than 1% for all locations. This is because the air comes from the air conditioner and it acts as a dehumidifier. Also, it has been observed that RH is dependent on the climatic conditions of the zones. It is seen that inside the envelope the RH ranges from 19.2% to 55% which is shown by the orange color. So, RH is uniformly distributed in the envelope.

Figure 9: Relative humidity contour inside the room (a) Jaisalmer, (b) Thiruvananthapuram, (c) Srinagar, (d) Bengaluru & (e) New Delhi

Figure 10: Envelope showing the selected points considered for studying PMV and PDD

Figure 11: (a) Predicted mean vote & (b) Predicted percentage difference of five locations
Based on the data simulated from ANSYS PMV and PDD have been calculated for five locations by taking a reference plane at the center of the envelope. So, the plane is considered at 1.5 m height with 10 equidistant reference points which is shown in Fig. 10. On the basis of the length of the plane the different values of temperature and pressure are noted in ANSYS. The calculated values of PMV & PDD inside the envelope with respect to reference points for five locations are shown by Figs. 11a and 11b. It has been observed that the value of PMV is ranged from −0.50 to −0.99 for all zones. As per Franger, −1 to +1 is the range of comfort for people with men vote value. The maximum values of PMV are negative due to the usage of a higher capacity of an air conditioner in a small envelope. However, the percentage people dissatisfaction for these locations is observed in the range of 13% to 30% on the basis of PMV values. As noticed some of the values are reaches to −1 which is maximum in the case of envelope walls. Although it is not necessary to evaluate the value of PMV-PDD much nearer to these points as people will not stuck with the envelope wall. So, on the basis of results it is evident that climate plays a crucial role in designing of the building with respect to achieving thermal comfort.
By analyzing the envelope based on two software’s for the five locations, following conclusion were made.
(i)eQUEST results represent that Jaisalmer is having the maximum annual energy consumption among five zones, i.e., 1286 kWh due to the highest requirement of space cooling in that region. Similarly, cold and cloudy region Srinagar shows the minimum thermal annual energy consumption of 505.04 kWh due to the minimum demand of thermal cooling load in that region.
(ii)Air is originating from the artificial sources viz. ceiling fan and airconditioner. Hence, streamlines of air inside the envelope are going to spread similarly in each of the cases and air velocity in each case varies between 0 and 3.72 m/s, respectively.
(iii)The peak envelope temperature has been ranging between 314.5 to 308.8 K depending on the different climatic zones. Relative humidity ranges between 19.2% to 55% inside the envelope for all zones.
(iv)PMV-PPD showed in Figs. 9a and 9b gives a range of −0.50 to −0.99 for all zones and signifies that 13% to 30% of people are dissatisfied with the indoor environment of that zones, respectively.
It is evident from the PMV range, i.e., −0.50 to −0.99 which is a slightly cool condition (according to Fanger thermal sensation scale) for the occupants that is due to the usage of overrated equipment in the envelope. However, on the basis of PMV values, we can also define the optimal equipment for each climatic zone through which energy consumption in the building will reduce. In addition, buildings with passive concepts can also be designed by studying the climatic and indoor environment conditions for achieving thermal comfort with lower energy consumption.
Funding Statement: The authors received no specific funding for this study.
Conflicts of Interest: The authors declare that they have no conflicts of interest to report regarding the present study.
1. Global Alliance for Buildings and Construction, International Energy Agency and the United Nations Environment Programme. 2019 global status report for buildings and construction: Towards a zero-emission, efficient and resilient buildings and construction sector. [Google Scholar]
2. Zhao, H. X., Magoulès, F. (2012). A review on the prediction of building energy consumption. Renewable and Sustainable Energy Reviews, 16(6), 3586–3592. DOI 10.1016/j.rser.2012.02.049. [Google Scholar] [CrossRef]
3. Katafygiotou, M. C., Serghides, D. K. (2014). Thermal comfort of a typical secondary school building in Cyprus. Sustainable Cities and Society, 13, 303–312. DOI 10.1016/j.scs.2014.03.004. [Google Scholar] [CrossRef]
4. Rijal, H. B., Tuohy, P., Humphreys, M. A., Nicol, J. F., Samuel, A. et al. (2007). Using results from field surveys to predict the effect of open windows on thermal comfort and energy use in buildings. Energy and Buildings, 39(7), 823–836. DOI 10.1016/j.enbuild.2007.02.003. [Google Scholar] [CrossRef]
5. Douthat, T., Morgan, J. D., Alibašić, H., Grant, A. (2020). Passive building characteristics, and summertime residential energy use: A spatial analysis of energy efficiency in gainesville, FL. Building and Environment, 169, 106542. DOI 10.1016/j.buildenv.2019.106542. [Google Scholar] [CrossRef]
6. Hawila, A. A. W., Merabtine, A. (2021). A statistical-based optimization method to integrate thermal comfort in the design of low energy consumption building. Journal of Building Engineering, 33, 101661. DOI 10.1016/j.jobe.2020.101661. [Google Scholar] [CrossRef]
7. Verma, S. K., Anand, Y., Anand, S. (2020). Analysis for determining the impact of air quality and thermal comfort in an enclosed cavity. Materials Today: Proceedings, 28, 2205–2211. DOI 10.1016/j.matpr.2020.04.254. [Google Scholar] [CrossRef]
8. Cortesão, J. P. A. G. (2013). Thermal retrofitting of public spaces in compact urban areas: A bioclimatic approach, (Doctoral dissertation), Universidade do Porto, Portugal. [Google Scholar]
9. Kumar, G. K., Saboor, S., Babu, T. A. (2017). Study of various glass window and building wall materials in different climatic zones of India for energy efficient building construction. Energy Procedia, 138, 580–585. DOI 10.1016/j.egypro.2017.10.163. [Google Scholar] [CrossRef]
10. Doctor-Pingel, M., Vardhan, V., Manu, S., Brager, G., Rawal, R. (2019). A study of indoor thermal parameters for naturally ventilated occupied buildings in the warm-humid climate of southern India. Building and Environment, 151, 1–14. DOI 10.1016/j.buildenv.2019.01.026. [Google Scholar] [CrossRef]
11. Elgendy, E., Melike, M., Fatouh, M. (2018). Experimental assessment of a split air conditioner working with R-417A under different indoor and outdoor conditions. International Journal of Refrigeration, 85, 268–281. DOI 10.1016/j.ijrefrig.2017.10.005. [Google Scholar] [CrossRef]
12. Song, J., Zhang, X., Meng, X. (2015). Simulation and analysis of a university library energy consumption based on EQUEST. Procedia Engineering, 121, 1382–1388. DOI 10.1016/j.proeng.2015.09.028. [Google Scholar] [CrossRef]
13. Fahmy, M., Mahmoud, S., Abdelalim, M., Mahdy, M. (2019). Generic energy efficiency assessment for heritage buildings; Wekalat El-Ghouri as a case study, Cairo, Egypt. Energy Procedia, 156, 166–171. DOI 10.1016/j.egypro.2018.11.122. [Google Scholar] [CrossRef]
14. Arun, M., Tulapurkara, E. G. (2005). Computation of turbulent flow inside an enclosure with central partition. Progress in Computational Fluid Dynamics, An International Journal, 5(8), 455–465. DOI 10.1504/PCFD.2005.007681. [Google Scholar] [CrossRef]
15. Verma, S. K., Anand, Y., Anand, S. (2018). CFD based modelling of a ceiling fan in a room. International Journal of Scientific and Technical Advancements, 4(2), 219–224. [Google Scholar]
16. Balocco, C., Grazzini, G., Cavalera, A. (2008). Transient analysis of an external building cladding. Energy and Buildings, 40(7), 1273–1277. DOI 10.1016/j.enbuild.2007.11.008. [Google Scholar] [CrossRef]
17. D. O. O., Y. (2020). Detailed climate information and monthly weather forecast | weather atlas, Thiruvananthapuram, India. Weather Atlas. https://www.weather-ind.com/en/india/thiruvananthapuram-climate. [Google Scholar]
18. Fanger, P. O. (1970). Thermal Comfort: analysis and applications in environmental engineering. Danish Technical Press. Copenhagen, Denmark. DOI 10.1177/146642407209200337. [Google Scholar] [CrossRef]
19. Thermal environmental conditions for human occupancy (2013). Atlanta, GA, ASHRAE. [Google Scholar]
20. Bellos, E., Tzivanidis, C., Kouvari, A., Antonopoulos, K. A. (2016). Comparison of heating and cooling loads of a typical building with TRNSYS and eQUEST. Energy, transportation and global warming, pp. 327–338, Springer, Cham. [Google Scholar]
21. Anand, S. V. S. A. Y., Verma, S. K., Anand, S. (2018). Transient 3-D modelling of ceiling fan for achieving thermal comfort. Building Performance Analysis Conference and SimBuild. ASHRAE and IBPSA-USA, Chicago, IL. [Google Scholar]
 | This work is licensed under a Creative Commons Attribution 4.0 International License, which permits unrestricted use, distribution, and reproduction in any medium, provided the original work is properly cited. |