| Energy Engineering |
DOI: 10.32604/EE.2021.015124
ARTICLE
Classification and Visualization of Surrounding Rock Mass Stability Based on Multi-Dimensional Cloud Model
1China University of Mining & Technology (Beijing), Beijing, 100083, China
2Peking University, Beijing, 100871, China
3China Three Gorges Projects Development Co., Ltd., Chengdu, 610041, China
*Corresponding Authors: Liming Xue. Email: liming-xue@163.com; Zhixue Zheng. Email: zx-zheng@pku.edu.cn
Received: 22 November 2020; Accepted: 19 March 2021
Abstract: The classification of the stability of surrounding rock is an uncertain system with multiple indices. The Multi-dimensional Cloud Model provides an advanced solution through the use of an improved model of One-dimensional Cloud Model. Setting each index as a one-dimensional attribute, the Multi-dimensional Cloud Model can set the digital characteristics of each index according to the cloud theory. The Multi-dimensional cloud generator can calculate the certainty of each grade, and then determine the stability levels of the surrounding rock according to the principle of maximum certainty. Using this model to 5 coal mine roadway surrounding rock examples and comparing the results with those of One-dimensional and Two-dimensional Cloud Models, we find that the Multi-dimensional Cloud Model can provide a more accurate solution. Since the classification results of the Multi-dimensional Cloud Model are difficult to be presented intuitively and visually, we reduce the Multi-dimensional Cloud Model to One-dimensional and Two-dimensional Cloud Models in order to visualize the results achieved by the Multi-dimensional Cloud Model. This approach provides a more accurate and intuitive method for the classification of the surrounding rock stability, and it can also be applied to other types of classification problems.
Keywords: Multi-dimensional cloud model; surrounding rock stability; uncertain; visualization
Over the last several decades, some of the inevitable requirements and trends regarding global economic development have involved the gain of increased underground space, resources and security. Internationally, there is a great deal of consensus regarding the importance of developing high quality underground engineering projects with high levels of safety [1]. In the construction of underground space, excavation causes the disturbance and redistribution of the rock stress field [2], which destroys the underground roadway. One of the key issues regarding making sure that the construction process is safe involves ensuring the stability of the surrounding rock [3]. Therefore, determining the stability grade of the surrounding rock is important for formulating the corresponding underground engineering measures, and has great practical significance for the safe construction and efficient production of underground engineering [4].
The stability of surrounding rock depends on the physical-mechanical properties of the rock mass, groundwater conditions, discontinuity parameters and other factors [5]. However, due to the complexity of the physical system and the difficulty of obtaining relevant parameters regarding the surrounding rock, it is difficult to accurately judge the stability of the underground surrounding rock [6]. In order to accurately determine the stability grade of the surrounding rock, researchers have proposed a variety of methods, including the RQD (Rock Quality Designation) Classification Method, Q Classification Method, and RMR (Rock Mass Rating) Classification Method [7–9]. However, the classification of surrounding rock stability is extremely complex, so a great variety of parameters need to be considered.
As research on the stability of surrounding rock have been expanded, it has been recognized that the collected index information is usually vague, random and uncertain. As such, fuzzy mathematics, PP-PSO (Projection Pursuit-Particle Swarm Optimization), Extension Theory, and Neural Network [10–13] have been widely used in the classification of surrounding rocks, and it has achieved some success in practical application. However, the above theories are not accurately able to reflect the uncertainty of the system. The Fuzzy Synthesis Method ignores the randomness of the system and eliminate the fuzziness by using the determined membership degree. The Neural Network has a slow convergence rate and falls into a local optimal situation. The Projection Pursuit Model relies heavily on sample data. The Cloud Model uses “cloud drops” instead of membership functions to make the degree of certainty fluctuate randomly within a certain range, which is meant to reflect the randomness and the uncertainty of the system. Li et al. [14] classified the stability of the surrounding rock through the use of the One-dimensional Cloud Model, but did not get the influence of each index on the comprehensive evaluation grade, and this did not reflect the correlation of multiple indices. This paper uses the Multi-dimensional Cloud Model to classify the stability of surrounding rock.
The Multi-dimensional Cloud Model [15,16] expands on the One-dimensional Cloud Model, using each evaluation index as the one-dimensional attribute of the Multi-dimensional Cloud Model to obtain the stability grade of the surrounding rock under the comprehensive impact of each index. The Multi-dimensional Cloud Model has been applied in customer group similarity judgment [17] and rock burst prediction [18]. Due to dimensional limitations, it is difficult to visualize the multi-dimensional cloud image. Therefore, this paper performs dimensionality reduction processing on the multi-dimensional cloud chart to realize the visualization of the stability classification of the surrounding rock.
The Cloud Model [19] is an uncertain transformation model that is concerned with a qualitative concept and quantitative description. It aims to achieve the mapping between qualitative and quantitative aspects by building a cloud generator.
2.1 Multi-Dimensional Cloud Model
The Multi-dimensional Cloud Model is derived from the expansion of the Cloud Model in order to express the concept of multi-index uncertainty. According to the theory behind the Multi-dimensional Cloud Model, the n-dimensional Cloud Model usually consists of 3n digital features to quantitatively describe the concept of multiple indices. (Ex1, Ex2…Exn); (En1, En2…Enn); (He1, He2…Hen) represent the expectation, entropy and super entropy of the different indices, respectively. The conceptual chart of the Two-dimensional Cloud Model is shown as Fig. 1. The expected value (Exi) is the centroid of the projection plane. Entropy (Eni) represents the boundary curve of the projection (the ambiguity), and super-entropy (Hei) reflects the thickness of the cloud (the randomness and dispersion).
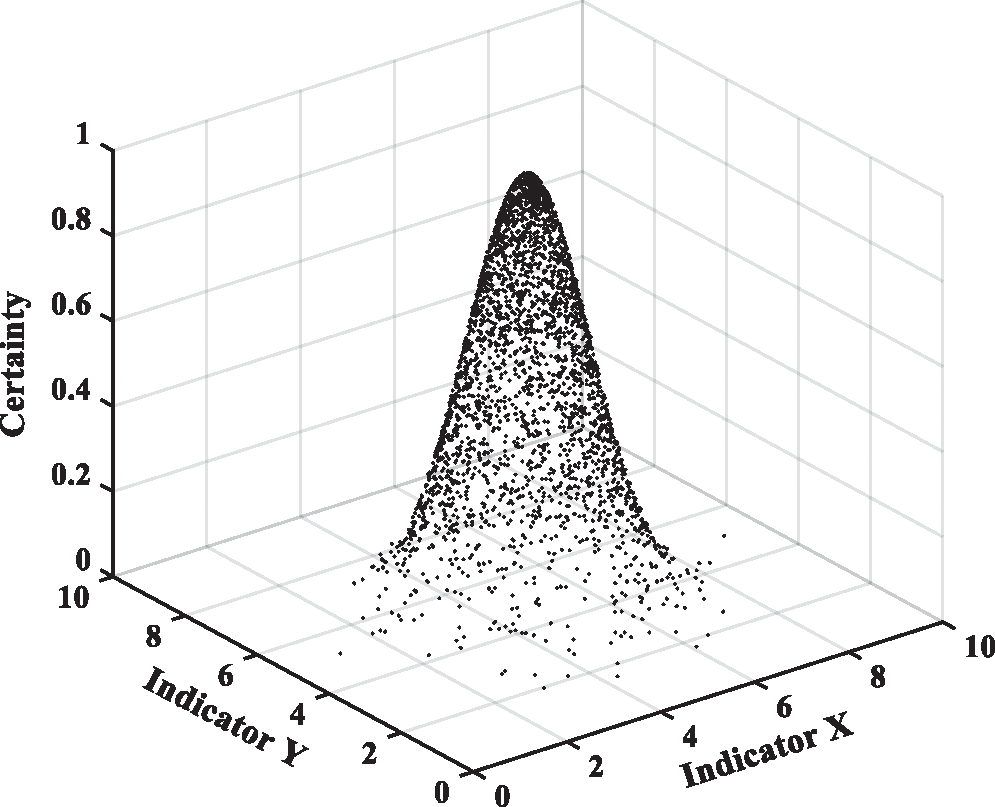
Figure 1: Two-dimensional cloud model
2.2 Multi-Dimensional Cloud Generator
Input: expected value (Ex1, Ex2…Exn); entropy (En1, En2…Enn); super entropy (He1, He2…Hen); the number of cloud drops N.
(1) Generate an n-dimensional normal random number x = (x1, x2…xn) with expected value (Ex1, Ex2…Exn) and variance (En1, En2…Enn).
(2) Generate an n-dimensional normal random number y = (y1, y2…yn) with expected value (En1, En2…Enn) and variance (He1, He2…Hen).
(3) Calculate certainty μi:
(4) (xi, μi) is a cloud drop.
Repeat Steps (1)∼(4) until N cloud drops are generated.
3 Classification of Surrounding Rock Mass Stability
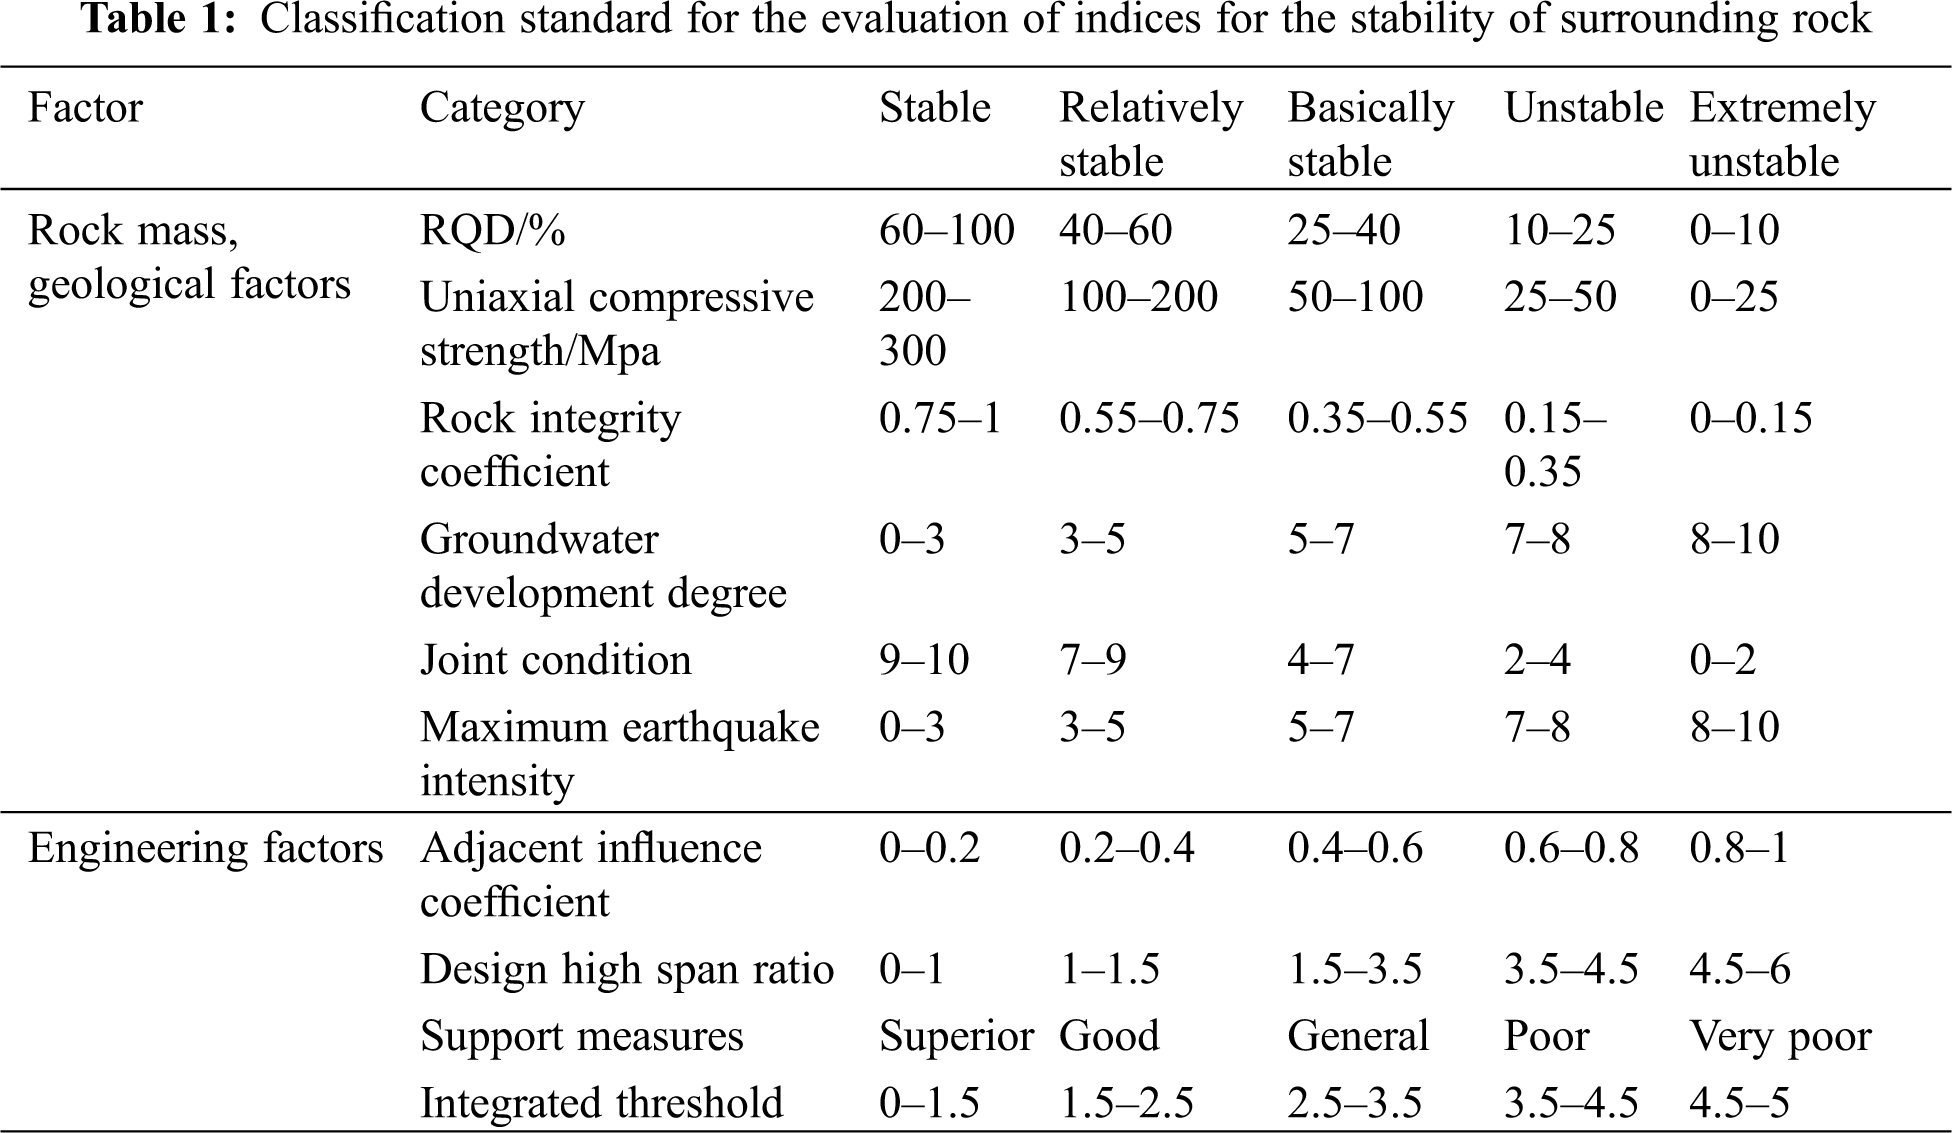
The selection of indices is the premise of the stability classification of the surrounding rock and also the basis of the model. Based on the existing research results, the stability classification index of the surrounding rock is determined by using association ruler mining and cloud transformation [20]. As shown in Tab. 1, a two-dimensional index system of rock mass is established with geological factors and engineering factors for the stability classification of the surrounding rock. The integrated threshold is used to construct the scale cloud chart.
3.2 Generation of Multi-Dimensional Cloud Model
According to the index classification system in Tab. 1, we determine the digital characteristics (Exij, Enij, Heij) of each grade according to formulas (2)–(4) below [21]:
In formulas (2)–(4): xij1 and xij2 represent the minimum and maximum boundary values of the index grades respectively. The super entropy (He) is taken from experience and can be adjusted as the actual situation changes. In this paper, the value range is 0.01–0.1. Taking the comprehensive threshold as an example, the numerical characteristics of each grade are calculated as shown in Tab. 2, and the grade scale cloud chart is shown as Fig. 2.
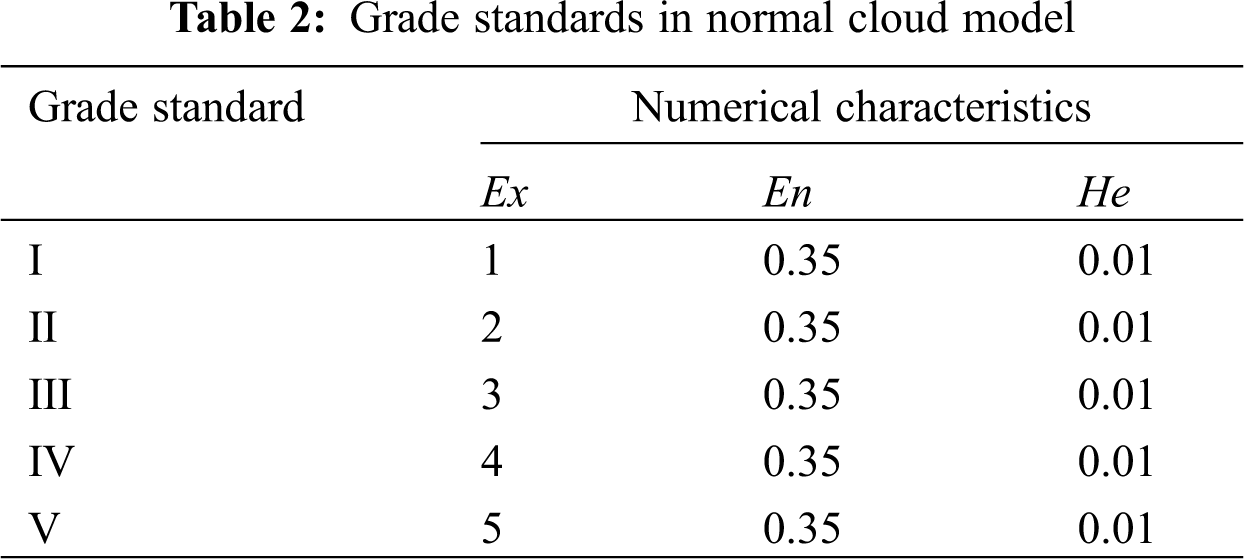
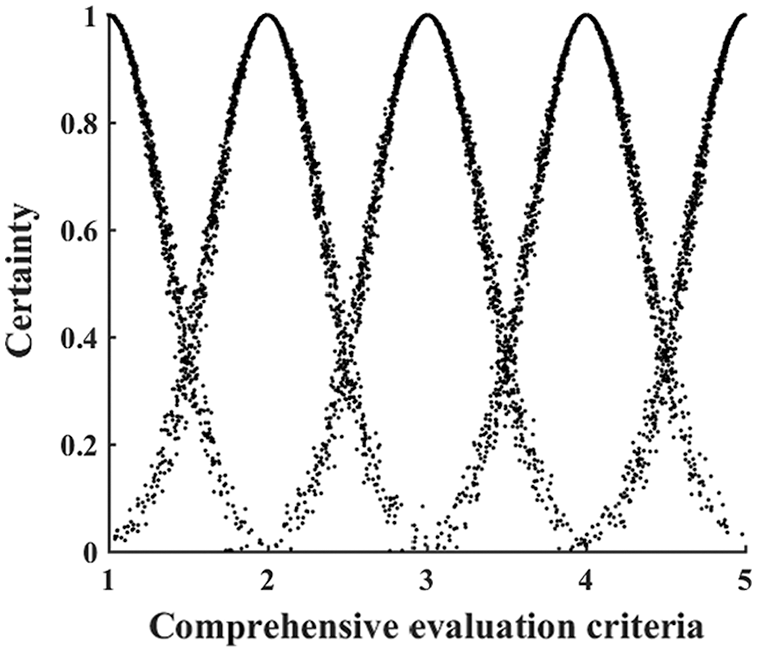
Figure 2: Normal cloud model comprehensive evaluation
According to the principles of index system construction, the weights are determined through the improved AHP method [22,23], and the judgment matrix is constructed based on the experience of relevant experts. Finally, the weight of each index is calculated.
The importance of the evaluation targets is sorted according to the experts’ opinions. Here, ri is denoted as the importance of Zj relative to Zj+1, and the importance of Zj relative to Zj+2 as ri · ri+1, i = 1, 2, …, m. From this we can get the judgment matrix A, as shown in formula (5):
In the formula (5), ri represents the importance scale value of the i-th index relative to the (i + 1)-th index.
According to the judgment matrix A, the weight of each index is:
3.4 Comprehensive Evaluation of Multi-Dimensional Cloud Model
The index data xij is brought into the multi-dimensional cloud generator to calculate the degree of certainty of each grade. Considering the index weight, formula (1) is improved to get formula (7). The certainty of each grade is calculated, and the evaluation grade is determined according to the principle of maximum certainty.
In the formula (7), wj represents the weight of each index.
4 Classification Results of Engineering Example
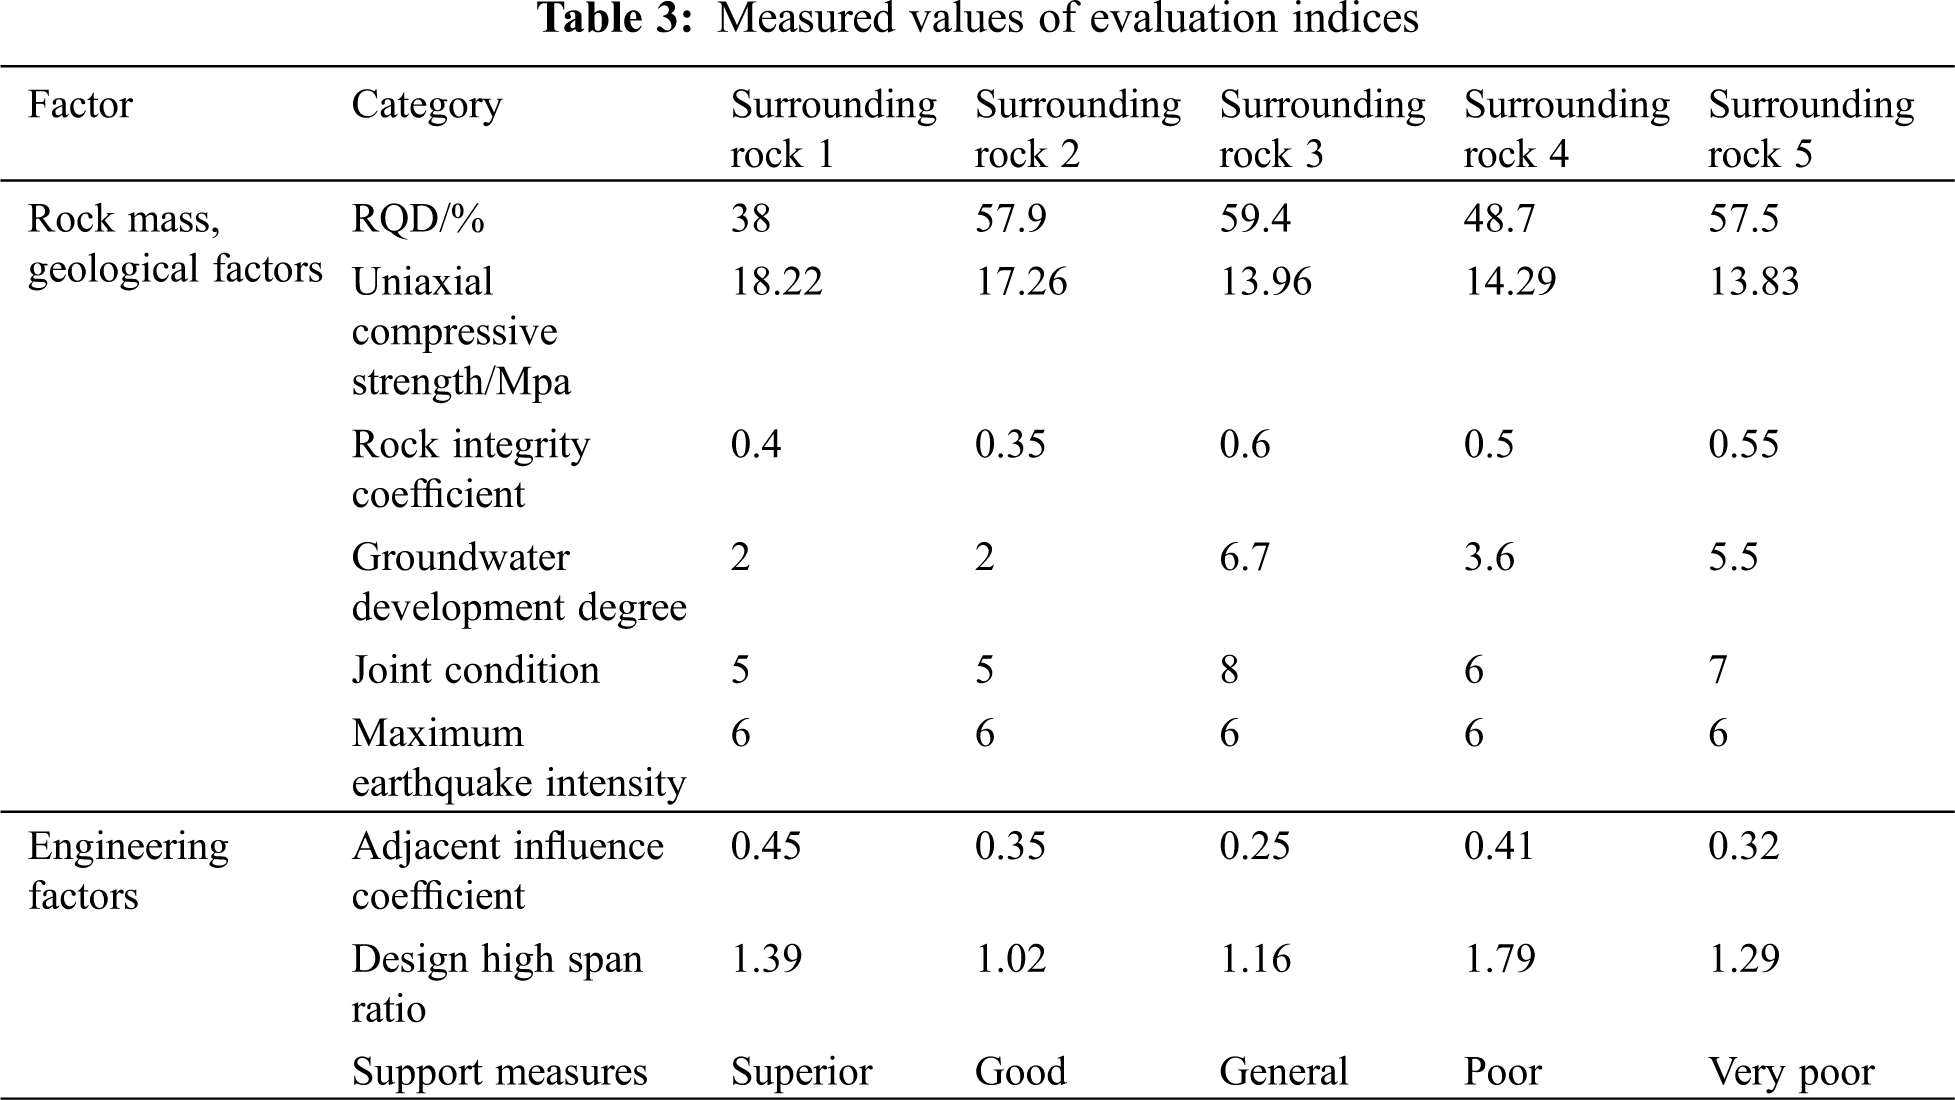
In order to verify the accuracy of the Model, 5 sections of surrounding rock of a coal mine roadway are selected as classification examples. This mine does not have a systematic understanding of the deformation and destruction of the surrounding rock in its complex roadways. In order to supplement the mine’s geological data, we conducted various tests and a systematic study of the surrounding rock in the mining area. The Hydraulic Fracturing Method and Borehole Penetration Method were used to obtain the data from the surrounding rock.
The selected 5 sections of the roadway rock formations consist primarily of sandstone, which is stable and relatively complete. Project 1 and Project 2 are distributed in a low stress area with stable surrounding rock and a weak degree of groundwater development, but there are many weak intercalations that use bolting net combined support; Project 3 is distributed in a moderately high stress area with good rock integrity, a high degree of groundwater development, the weak rock stratum is thick, the joints are well developed, and here, a bolt-mesh-anchor combined support is used; Project 4 is distributed in a medium stress area with relatively good integrity, no obvious cracks, the adjacent projects have a great impact, and use a bolt-net-beam-cable combined support; Project 5 is distributed in a medium stress area, with obvious fissures and weak intercalations, low rock strength, a bolt-mesh-anchor combined support is used, and there are no large deformation and other accidents within the service life of different projects. The index data for the surrounding rock are shown in Tab. 3.
The weight of each index is determined by AHP as (0.148, 0.0485, 0.16, 0.074, 0.042, 0.0275, 0.0835, 0.166, 0.2505). Through incorporating the surrounding rock data and index weights into formula (7), the different grades of certainty are then obtained. Next, the stability grade of the surrounding rock is determined through the principle of maximum certainty, and compared with the One-dimensional and Two-dimensional Cloud Models to verify the accuracy of the results. The results are shown in Tab. 4.
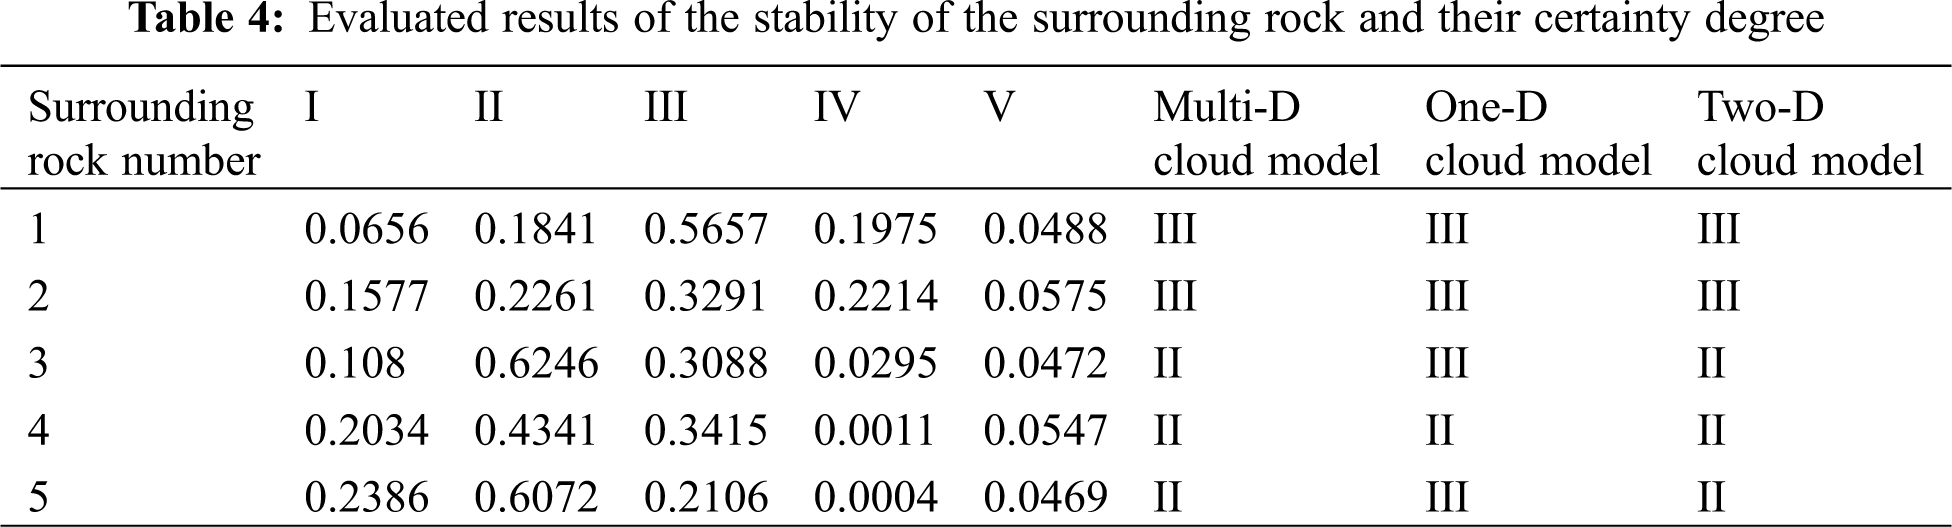
As in Tab. 4, the classification results of the Multi-dimensional Cloud Model and Two-dimensional Cloud Model are found to be completely consistent. The results of surrounding rock 3 and rock 5 in One-dimensional Cloud Model are at Level III, while the results in the Two-dimensional and Multi-dimensional Cloud Models are at Level II. This is because the comprehensive evaluation values of the surrounding rock 3 and rock 5 that were obtained from the One-dimensional Cloud Model are not far from the Level III threshold (2.5), and it is difficult to determine the evaluation grade. Two-dimensional and Multi-dimensional Cloud Models couple different systems or indices to render classification results more accurate. In the actual investigation, the deformation of the surrounding rock is small, and the instability phenomenon is not noted within the service life of the mine. The actual situation of the relatively stable rock mass is consistent with the evaluation results, thus the accuracy of the results of the Multi-dimensional Cloud Model are verified.
5 Visualization of Surrounding Rock Mass Stability
The visualization chart of the N-dimensional Cloud Model is (N + 1)-dimensional, that is, the visualization chart of the Two-dimensional Cloud Model is three-dimensional, so the Multi-dimensional Cloud Model is difficult to visualize. Therefore, this paper reduces the dimensionality of the Multi-dimensional Cloud Model to a One-dimensional Cloud Model or Two-dimensional Cloud Model to realize the visualization of the Multi-dimensional Cloud Model.
In the Multi-dimensional Cloud Model, each index is constructed into one-dimensional Cloud Models and then coupled into a Multi-dimensional Cloud Model. The structure of the Index Cloud Model is shown in formulas (8)–(10). The surrounding rock 1 is taken as an example for visualization research. The numerical characteristics of the Cloud Model of each index level are shown in Tab. 5, and the cloud chart is shown as Fig. 3.
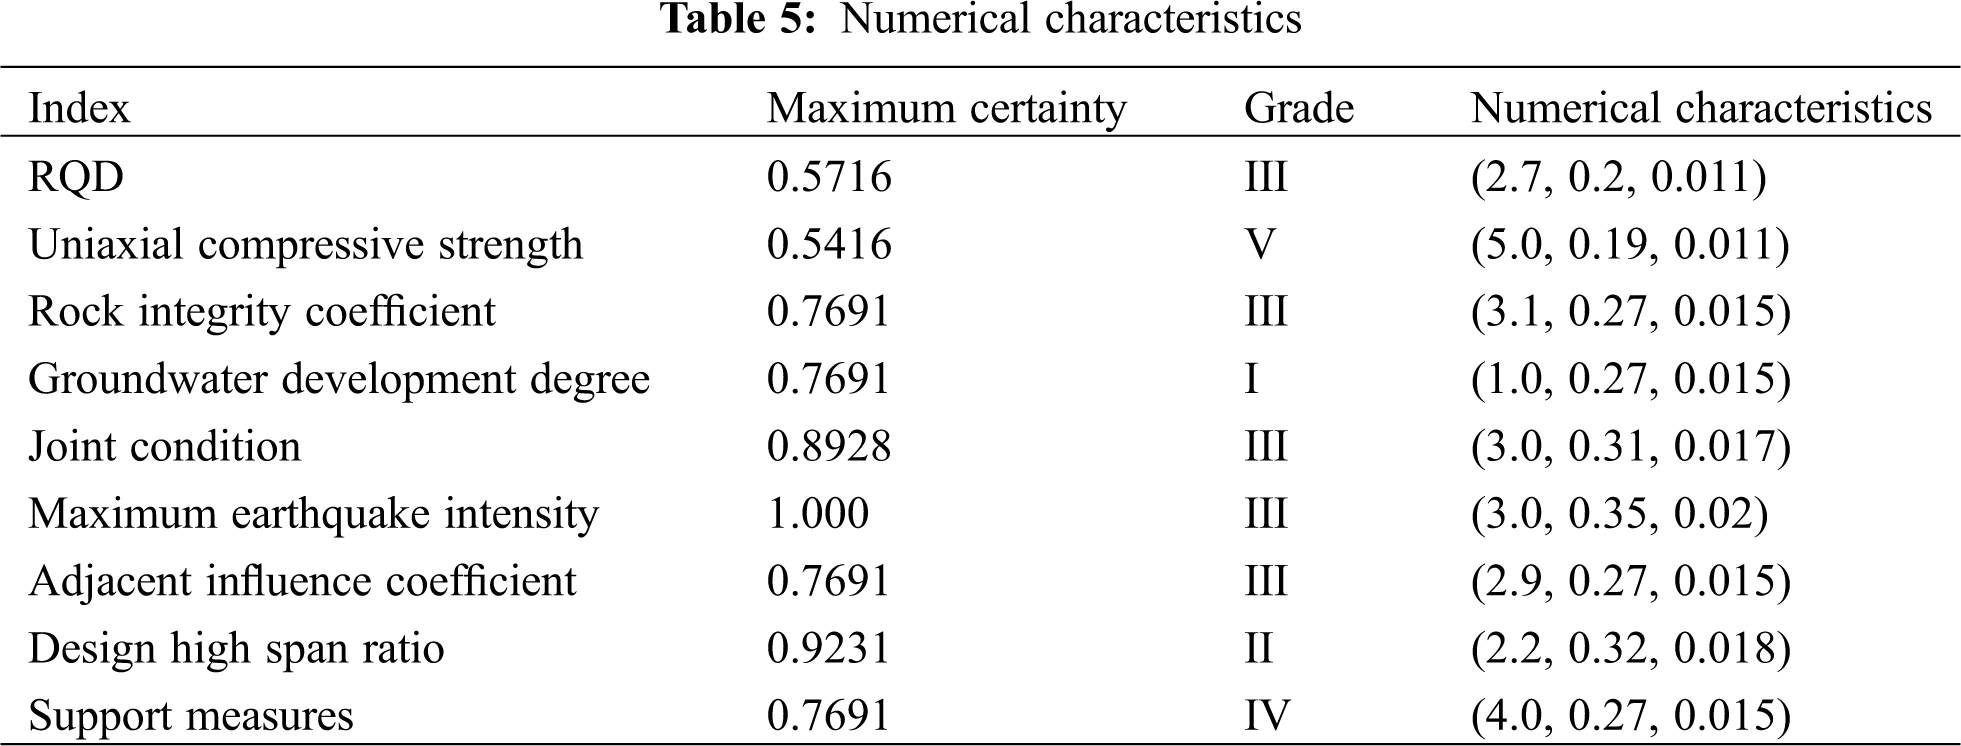
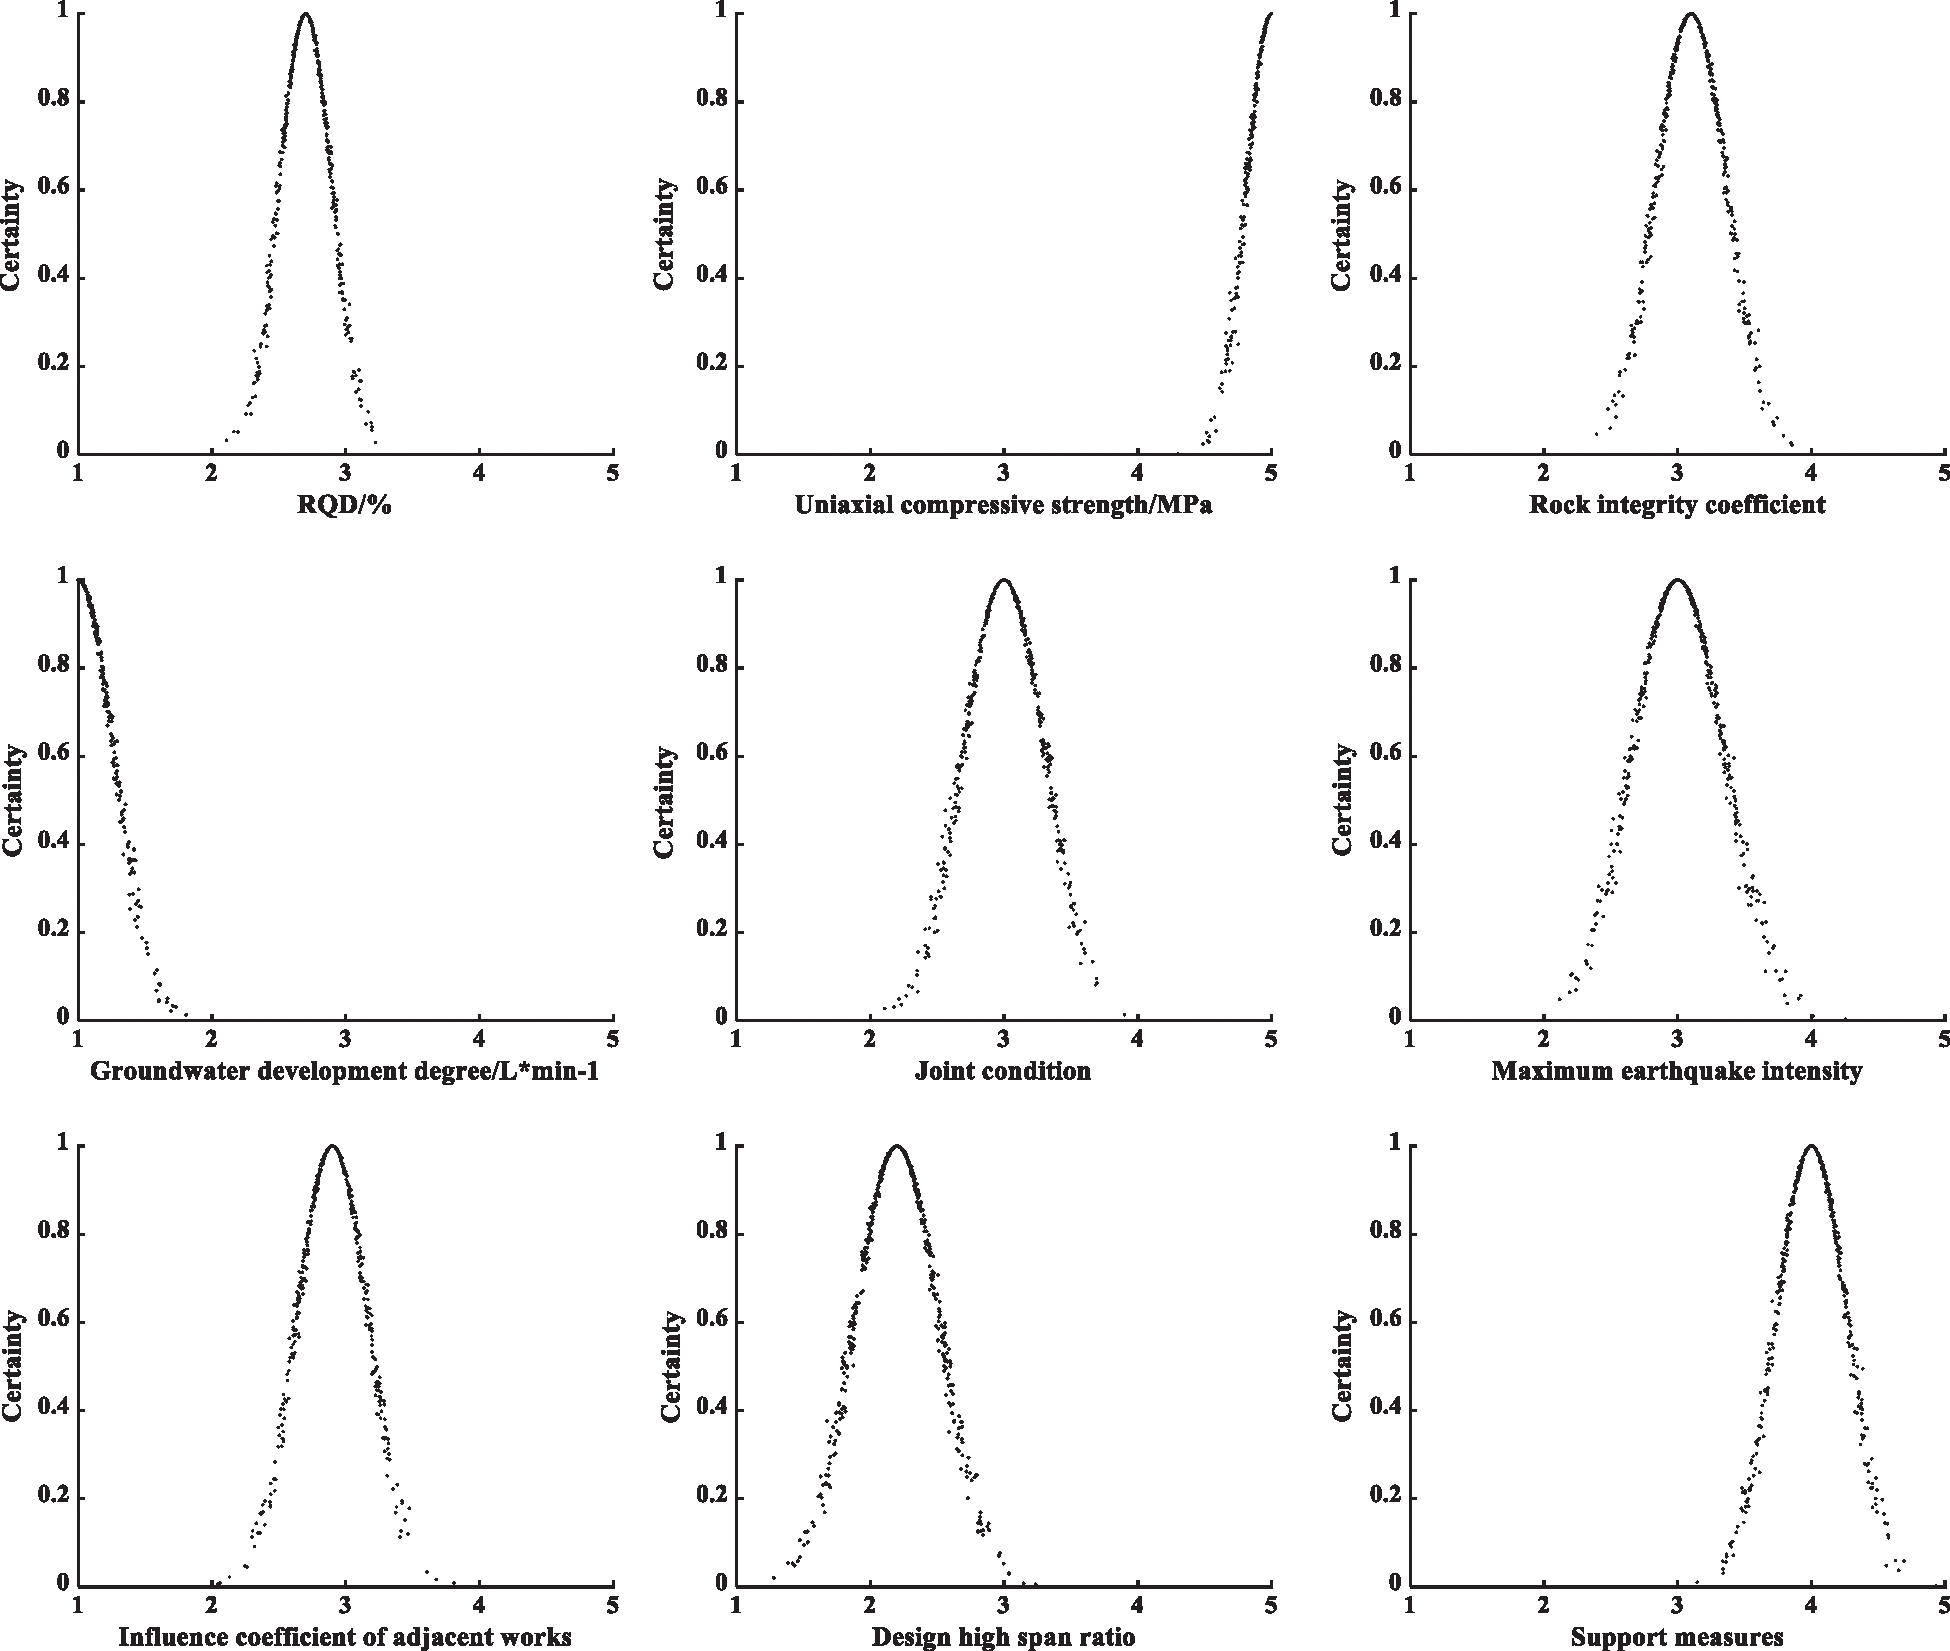
Figure 3: Cloud model chart of each index grade of the surrounding rock 1
In formulas (8)–(10): μ is the certainty matrix, μi* = max (μi1, μi2…μip). En and He are the entropy and super entropy of the integrated threshold, respectively.
The stability classification of surrounding rock 1 is represented by the cloud charts shown as Fig. 3. After coupling, it becomes a 10-dimensional Cloud Model chart that cannot be visualized. As such, it can be represented through a comprehensive cloud (either a One-dimensional Cloud Model or Two-dimensional Cloud Model) [24], and its digital characteristics are obtained through formulas (11)–(13):
We then coupling each index cloud chart of the surrounding rock 1 and perform dimension reduction to obtain a one-dimensional grade cloud chart. Then, by comparing the cloud chart with the grade standard cloud chart (Fig. 2), the stability grade can be determined, as shown in Fig. 4. We then couple the cloud chart of each index in the surrounding rock mass and geological factors and reduce the dimension to obtain a one-dimensional grade cloud chart. Similarly, as shown in Fig. 5, a one-dimensional grade cloud chart can be obtained after coupling various indices in the engineering factors, and then coupling the two cloud charts to get a two-dimensional visualization cloud chart. As shown in Fig. 6, the stability grade is then determined by projecting to the judgment space. As Figs. 4–6 show, the multi-dimensional Cloud Model is reduced to a one-dimensional and two-dimensional cloud chart in order to realize the classification visualization.
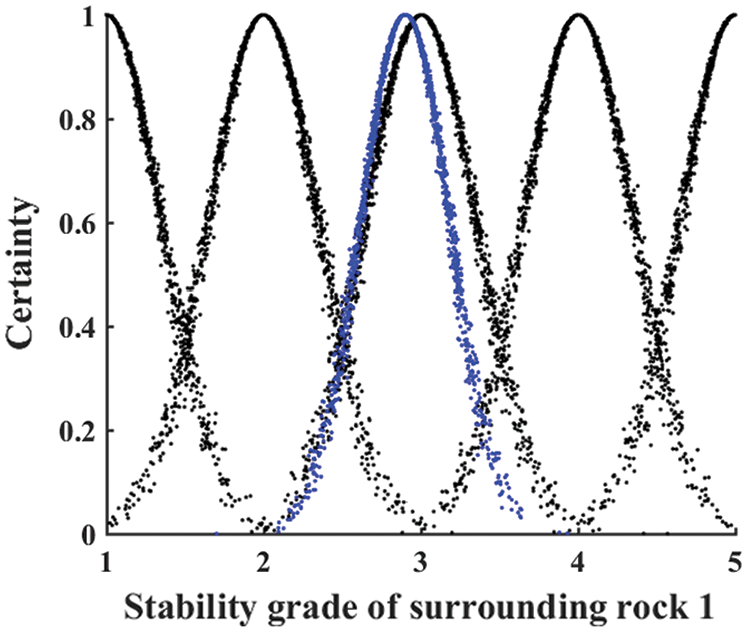
Figure 4: One-dimensional visualization level cloud of surrounding rock 1
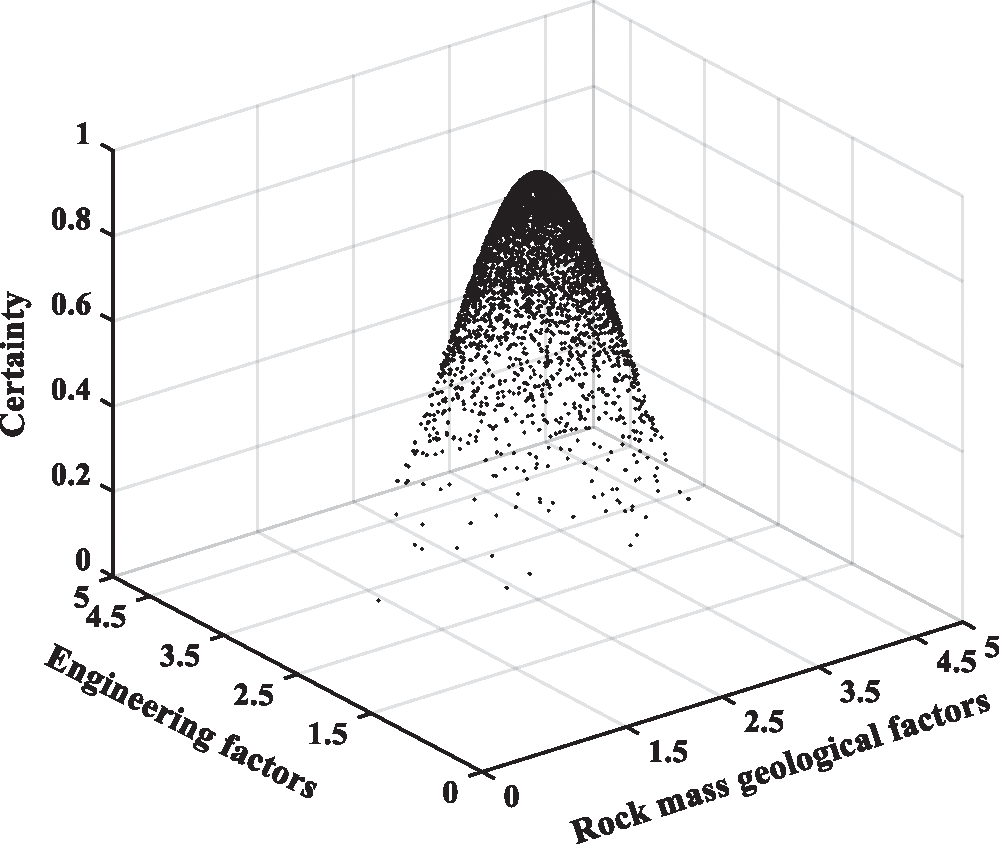
Figure 5: Two-dimensional visualization level cloud of surrounding rock 1
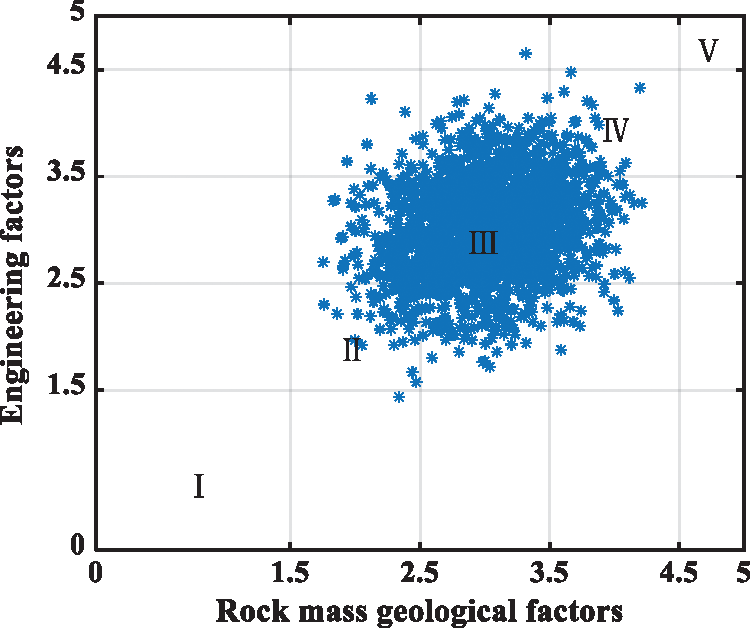
Figure 6: Surface of a decision space of surrounding rock 1
The classification of surrounding rock stability is determined by various uncertain factors, resulting in an extremely complex problem. This paper introduces a Multi-dimensional Cloud Model that has obvious advantages in terms of both the qualitative and quantitative transformations of the stability evaluation of the surrounding rock. The multi-dimensional cloud model takes each evaluation index as a one-dimensional attribute, which can effectively improve the processing speed of index data. Compared with one-dimensional cloud model and two-dimensional cloud model, the one-dimensional cloud model and the two-dimensional cloud model lack the consideration of the correlation between multiple indicators, and it is difficult to reflect the evaluation results under the combined influence of multiple factors, which affects the accuracy of the results to a certain extent. The multi-dimensional cloud model can not only consider the impact of the interaction between multiple indicators, but also systematically reflect the impact of the coupling of various indicators on the comprehensive evaluation results.
Through verification by example, the results obtained are found to be similar to those of other models, and are also consistent with the actual situation, which indicates that the Multi-dimensional Cloud Model evaluation method is effective and feasible with respect to the evaluation of surrounding rock stability. Furthermore, the Multi-dimensional Cloud Model reflects the overall situation of surrounding rock stability and the uncertainty of each index belonging to different grades, which also provides a new reference for surrounding rock stability evaluation and other similar projects.
Funding Statement: This work is supported by the National Natural Science Foundation of China (No. 52074296).
Conflicts of Interest: The authors declare that they have no conflicts of interest to report regarding the present study.
1. Wallace, M. I., Ng, K. C. (2016). Development and application of underground space use in Hong Kong. Tunnelling and Underground Space Technology, 55, 257–79. DOI 10.1016/j.tust.2015.11.024. [Google Scholar] [CrossRef]
2. Mahdevari, S., Shahriar, K., Sharifzadeh, M., Tannant, D. D. (2017). Stability prediction of gate roadways in longwall mining using artificial. Neural Computing and Applications, 28(11), 3537–55. DOI 10.1007/s00521-016-2263-2. [Google Scholar] [CrossRef]
3. Idris, M. A., Nordlund, E., Saiang, D. (2016). Comparison of different probabilistic methods for analyzing stability of underground rock excavations. Electronic Journal of Geotechnical Engineering, 21, 6555–85. [Google Scholar]
4. Mohammadreza, H. N., Mohsen, T. M., Mohsen, S. (2017). Classification and assessment of rock mass parameters in choghart iron mine using P-wave velocity. Journal of Rock Mechanics and Geotechnical Engineering, 9(11), 1–11. DOI 10.1016/j.jrmge.2016.11.006. [Google Scholar] [CrossRef]
5. Idris, M. A., Basarir, H., Nordlund, E., Wettainen, T. (2013). The probabilistic estimation of rock masses properties in malmberget mine, Sweden. Electronic Journal of Geotechnical Engineering, 18(B), 269–287. [Google Scholar]
6. Sakellariou, M. G., Ferentinou, M. D. (2005). A study of slope stability prediction using neural networks. Geotechnical and Geological Engineering, 23, 419–45. DOI 10.1007/s10706-004-8680-5. [Google Scholar] [CrossRef]
7. Arild, P. (2005). Measurements of and correlations between block size and rock quality designation (RQD). Tunnelling and Underground Space Technology, 20, 362–377. DOI 10.1016/j.tust.2005.01.005. [Google Scholar] [CrossRef]
8. Arild, P. (2009). Combining the RMR. Q, and RMi classification systems. Tunnelling and Underground Space Technology, 24, 491–492. DOI 10.1016/j.tust.2008.12.002. [Google Scholar] [CrossRef]
9. Martin, B., Bruce, H., Rudrajit, M. (2020). Coal mine roof rating (CMRRrock mass rating (RMR) and strata control: Carborough downs mine, bowen basin. Australia. International Journal of Mining Science and Technology, 30, 225–234. DOI 10.1016/j.ijmst.2020.01.003. [Google Scholar] [CrossRef]
10. Xu, F., Xu, W. Y., Wen, S., Liu, Z. B., Zhao, Y. X. (2010). Projection pursuit based on particle swarm optimization for evaluation of surrounding rock stability. Rock and Soil Mechanics, 31(11), 3651–3655. DOI 10.16285/j.rsm.2010.11.036. [Google Scholar] [CrossRef]
11. Wang, H. D., Cao, Y. H. (2013). Evaluation of surrounding rock stability based on improved matter-element extension model with variable weight. China Safety Science Journal, 23(8), 23–29. DOI 10.16265/j.cnki.issn1003-3033.2013.08.016. [Google Scholar]
12. Wang, J. X., Zhou, Z. H., Zhao, T., Yu, Y. X., Long, G. et al. (2016). Application of alpha stable distribution probabilistic neural network to classification of surrounding rock stability assessment. Rock and Soil Mechanics, 37(S2), 649–657. DOI 10.16285/j.rsm.2016.S2.082. [Google Scholar] [CrossRef]
13. Shi, S. S., Li, S. C., Li, L. P., Zhou, Z. Q., Wang, J. (2014). Advance optimized classification and application of surrounding rock based on fuzzy analytic hierarchy process and tunnel seismic prediction. Automation in Construction, 37, 217–222. DOI 10.1016/j.autcon.2013.08.019. [Google Scholar] [CrossRef]
14. Li, J., Wang, M. W., Xu, P., Xu, P. C. (2014). Classification of stability of surrounding rock using cloud model. Chinese Journal of Geotechnical Engineering, 36(1), 83–87. DOI 10.11779/CJGE201401006. [Google Scholar] [CrossRef]
15. Guo, R. X., Xia, J. B., Dong, S. F., Long, M. (2010). Multiple attribute evaluation method based on multidimensional cloud model. Computer Science, 37(11), 75–77. [Google Scholar]
16. Zhang, G. Y., Sha, Y., Liu, X. H., Liu, Y. H. (2004). High dimensional cloud model and Its application in multiple attribute evaluation. Transactions of Beijing Institute of Technology Transactions of Beijing Institute of Technology, 24(12), 1065–1069. [Google Scholar]
17. Wang, H., Li, B. (2012). Similarity metric of multi attribute group based on multidimensional cloud model. Industrial Engineering and Management, 17(6), 76–82. DOI 10.19495/j.cnki.1007-5429.2012.06.013. [Google Scholar] [CrossRef]
18. Guo, J., Zhang, W. X., Zhao, Y. (2018). A multidimensional cloud model for rock burst prediction. Chinese Journal of Rock Mechanics and Engineering, 37(5), 1199–1206. DOI 10.13722/j.cnki.jrme.2017.1522. [Google Scholar]
19. Li, D. E., Du, Y.(2005). Uncertainty in artificial intelligence, pp. 143–183. Beijing: National Defense Industry Press. [Google Scholar]
20. Xue, L. M., Li, C. M., Zheng, Z. Z., Meng, S., Wang, E. et al. (2019). The index system of stability of surrounding rock based on TP-tree and cloud transform. Railway Standard Design, 63(7), 1–9. DOI 10.13238/j.issn.1004-2954.201806220006. [Google Scholar] [CrossRef]
21. Liu, B. X., Li, H. L., Yang, L. B. (2009). Cloud decision analysis method. Control and Decision, 24(6), 957–960. DOI 10.13195/j.cd.2009.06.159.liubx.030. [Google Scholar] [CrossRef]
22. Ludovic, A. V., Franck, M., Jean, C. B. (2011). Using a delphi process and the analytic hierarchy process(AHP) to evaluation the complexity of projects. Expert Systems with Applications, 38(5), 5388–5405. DOI 10.1016/j.eswa.2010.10.016. [Google Scholar] [CrossRef]
23. Zhang, Q. W., Zhang, Y. Z., Zhong, M. (2014). A cloud model based approach for multi-hierarchy fuzzy comprehensive evaluation of reservoir-induced seismic risk. Shui Li Xue Bao, 45(1), 87–95. DOI 10.13243/j.cnki.slxb.2014.01.012. [Google Scholar] [CrossRef]
24. Du, X. Y., Yin, Q. J., Huang, K. L., Liang, D. N. (2008). Transformation between qualitative variables and quantity based on cloud models and its application. Systems Engineering and Electronics, 30(4), 772–776. [Google Scholar]
 | This work is licensed under a Creative Commons Attribution 4.0 International License, which permits unrestricted use, distribution, and reproduction in any medium, provided the original work is properly cited. |