| Energy Engineering |
DOI: 10.32604/EE.2021.015248
ARTICLE
Research on the Flow and Heat Transfer Characteristics of a Water-Cooling Plate in a Heat Dissipation System
Department of Energy, Power and Mechanical Engineering, North China Electric Power University, Baoding, 071003, China
**Corresponding Author: Zhuang Wei. Email: weizhuang99@foxmail.com
Received: 03 December 2020; Accepted: 15 March 2021
Abstract: The water-cooling heat dissipation technology can solve the heat dissipation and noise problems of the calculation plate. Therefore, the structural design of the water-cooling plate directly affects its flow and heat transfer characteristics, which restricts the promotion and application of the technology. To this end, the water-cooling plate of a heat dissipation system was taken as the research object, and its flow and heat transfer characteristics were numerical simulated and experimental studied. Through comparative analysis, the rationality of the numerical simulation method was verified. Based on this, three improved schemes of water-cooling plate structure were proposed and numerical simulation was carried out, and the optimal model was verified by experiments. The results of the study show that compared with the original water-cooling plate, the optimized water-cooling plate has increased internal flow velocity and distributes uniformly, increased heat transfer amount by 4.2%, and the average temperature of the calculation plate decreased by 5.3%.
Keywords: Calculation plate; water-cooling plate; flow and heat transfer characteristics
The calculation plate has pretty strong computing power, but it produces high heat [1–4]. High temperature will affect the performance of the calculation plate, it needs to be cooled. Xu et al. [5] used the method of numerical simulation, considering the heat transfer amount and pressure loss of water-cooling plate radiators with different structures, obtained the influence of internal structure layout on heat transfer characteristics. Ding et al. [6] compared laminar flow and turbulent flow models to study the flow state inside the water-cooling plate in the form of straight channel, then obtained an accurate temperature distribution after accurate modeling, which was conducive to improving the heat transfer efficiency. Foreign scholars used water cooling method to cool the batteries of cheap optical devices so as to keep their temperature in the appropriate range [7]. In 2002, Intel published a water cooling scheme for IA-64 microprocessor [8].
At present, there are two main heat dissipation methods for calculation plate [9–11], namely, air cooling heat dissipation and water cooling heat dissipation. Air cooling heat dissipation refers to that a rapidly rotating fan directly blows the heat source, thus forcing away the heat emitted by the heat source [12,13]. Its advantages include obvious heat dissipation efficiency, simple installation, small size and low price. However, it is highly dependent on the environment. If the ambient temperature rises or over-frequency works, the cooling effect of air cooling will be reduced. Moreover, the fan will produce a lot of noise when rotating at high speed, which is not suitable for quiet occasions.
Water cooling heat dissipation refers to that the circulating water flows through the water-cooling plate which is close to the calculation plate under the action of the pump to take away the heat generated by the calculation plate. It is mainly composed of the distributor, the water-cooling plate, the pump and the heat dissipation discharge [14,15]. Water cooling heat dissipation has the advantages of low working noise, stable heat dissipation and small environmental constraints, besides the heat transfer coefficient of water cooling heat dissipation is 100∼1000 times larger than that of air cooling heat dissipation coefficient. Therefore, its heat dissipation efficiency is higher. Nevertheless, there is still space for further improvement of the flow and heat transfer characteristics of the water-cooling plate in the cooling system.
Water cooling and air cooling have their own advantages and disadvantages. Taking into account the increasing demand for living conditions, noise reduction has become an inevitable trend. The importance and novelty of in-depth research on water cooling technology is that the water cooling method has good heat dissipation effect and low noise. In addition, this method is less affected by the environment, which is more in line with the needs of modern people. Meanwhile, it has great practical value to improve the heat dissipation performance of the water-cooling plate matched with its calculation plate [16,17]. Therefore, this study took the water-cooling plate in the heat dissipation system of a caculation plate as the research object. Numerical simulation and experimental study were used to analyze the flow and heat transfer characteristics in the internal flow channel of the water-cooling plate. Based on the comprehensive analysis results, the improvement scheme of the water-cooling plate structure was proposed, and the optimal model was determined to improve the heat dissipation performance of water-cooling plate.
2 Experimental and Numerical Simulation Methods
2.1 Experimental Research Methods
2.1.1 Experimental System and Purpose
Fig. 1 shows 11 main components of the original water-cooling plate experimental system. On one side of the calculation plate, there were many micro-integrated circuits to form a heat source. On the other side, a water-cooling plate with good thermal conductivity was adhered to by silicon grease. The 220 V AC power supply was used in the experiment, and the laptop controlled the calculation task and recorded the temperature of the calculation plate in real time.

Figure 1: Original water-cooling plate experiment system diagram 1---Heat transfer of water storage device; 2---Heat transfer and cold water storage device; 3---Catheter; 4---Circulating water pump; 5---Flow meter; 6---Water-cooling plate; 7---Calculating plate; 8---Water cooling plate inlet thermometer; 9---Water-coling plate outlet thermometer; 10---Cables; 11---Laptops
The purpose of the experiment is to improve the internal flow condition and enhance the heat transfer effect without changing the size of the external structure of the water-cooling plate.
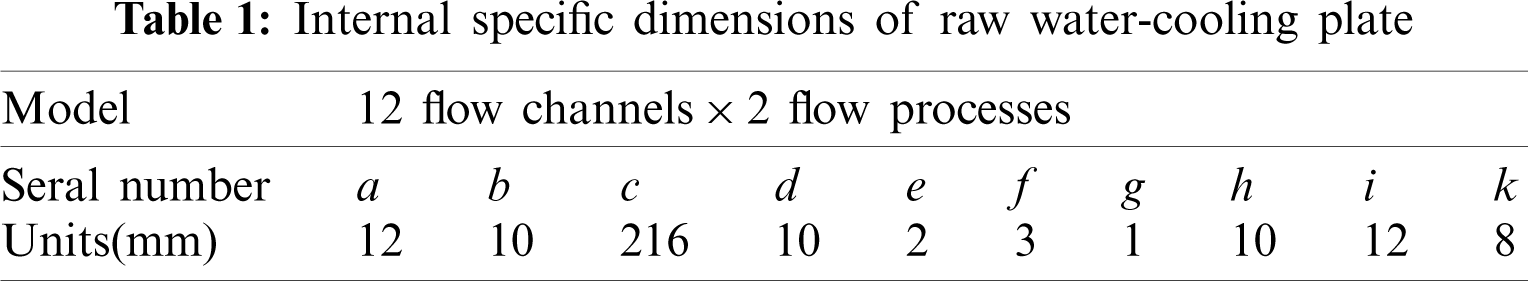
Figs. 2 and 3 show the external and internal structures of the original water-cooling plate. The water-cooling plate was made of aluminum alloy with good heat transfer performance. Cold water entered into the water-cooling plate from the lower inlet, then the water flowed out from the upper outlet after absorbing heat. The specific structure and size are shown in Tab. 1.

Figure 2: External structure diagram of original water-cooling plate. (a) Main view, (b) Side view, (c) Vertical view

Figure 3: Internal structure diagram of the original water-cooling plate. (a) Internal cross section, (b) Internal longitudinal section
2.1.2 Experimental Methods and Procedures
When the output power of the caculation plate is 480 W and the flow rate is 1 L/min, the temperature of the inlet and outlet water was measured by a temperature measuring instrument (R6100) to calculate the heat transfer amount, and the temperature of the stabilized plate was recorded by computer. The calculation formula is shown in Eq. (1).
In the formula: ϕ is heat transfer amount, W; λ is thermal conductivity, and the material is mainly aluminum, 237 W/(m ⋅ K); A is heat transfer area, m2; t is temperature, K; x is the length, m; h is the convection heat transfer coefficient, W/(m2 ⋅ K); c is the specific heat capacity, which is 4.2 × 10³ J/(kg.k) for water and 0.3 × 10³ J/(kg.k) for aluminum; qm is mass flow, kg/s.
2.2 Numerical Simulation Method
2.2.1 Physical Model Establishment and Grid Division
Based on the actual measurement data, the physical model of original water-cooling plate was established by SolidWorks according to 1:1 ratio. The overall structure and central section are shown in Fig. 4.

Figure 4: Physical model of original water-cooling plate. (a) Comprehensive model, (b) Center section
2.2.2 Laminar Flow Model and Its Governing Equation
For incompressible liquid water, the internal Reynolds number is far less than 2300, so it is in laminar flow. Laminar model was used after considering simulation accuracy and economy [18,19]. The heat transfer process of water-cooling plate mainly includes the heat conduction of conculation plate and its convective heat transfer with water-cooling plate. The control equations are shown in Eqs. (2)–(5).
In the formula: v is kinematic viscosity, m2/s; ρ is density, kg/m3; u, v and w are the components of filtration velocity in the x, y and z directions, m/s; p is the pressure on the fluid element, Pa.
2.2.3 Single Value Conditional Setting and Grid Independence Verification
Parameter setting under the premise of consistent with the flow rate at the experimental entrance:
(1) Water density of 28.5°C: 995.68 kg/m3;
(2) Dynamic viscosity: 0.847 × 10⁻³ Pa⋅s;
(3) Inlet boundary: speed inlet with a size of 0.34 m/s;
(4) Outlet boundary: pressure outlet, with a relative pressure of 0 Pa;
(5) Flow passage wall: standard wall boundary;
(6) Laminar flow: SIMPLE algorithm, second-order upwind format;
(7) Wall condition: one side wall heat flux 17537 W/m2, one side wall adiabatic.
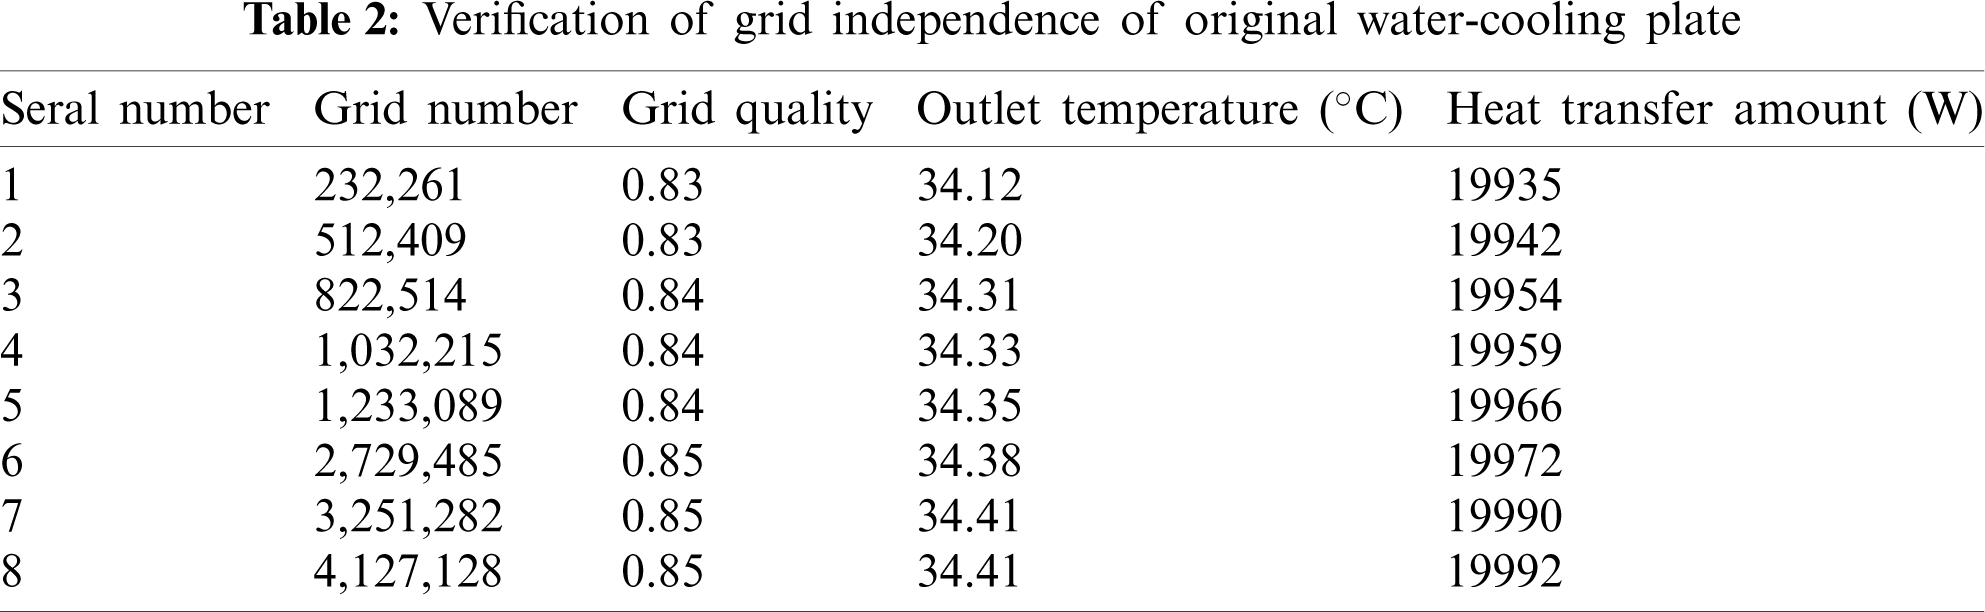
The grid independence verification results of the above physical model are shown in Tab. 2, and the final grid number was determined to be approximately 3.25 million. Similar treatment was applied to the subsequent improvement scheme of water-cooling plate structure.
2.3 Comparative Analysis of Experimental and Simulation Results
Fig. 5 shows the comparison of original water-coolinng plate experiment and simulation results. It can be seen from Fig. 5a, as time goes on, the experimental value of outlet temperature continues to rise until the stable value is 34.41°C. Moreover, the experiment is basically consistent with the simulated growth trend of outlet temperature, and the relative error value is less than 5%.

Figure 5: Comparison of original water-cooling plate experiments and simulation results. (a) Change of outlet temperature over time, (b) Change of heat transfer amount over time
From the Fig. 5b, the heat transfer experimental amount data shows a trend of sustained growth over time. The measured data in Eq. (1) can be obtain to calculate calculation plate to produce the total amount heat of 28800 W. Total heat transfer amount with cold water is 19990 W. The average stable temperature is 39.3°C. The experimental and simulated heat transfer growth trend is approximately consistent, and the relative error of heat transfer is less than 3% at 60 s.
The reasons for some errors between the experimental and simulation results are as follows: 1) The grid division of numerical simulation is not fine enough. 2) Counting error in original water-cooling plate experiment. Although there are some errors between the simulation and experimental results, the simulation results can reflect the change of outlet temperature and heat transfer amount of original water-cooling plate with time accurately, which verifies the rationality of the numerical simulation method and the physical model established in this study.
3 Improvement Scheme and Numerical Simulation Analysis of Water-Cooling Plate Structure
3.1 Formulation of Structural Improvement Plan for Water-Cooling Plate
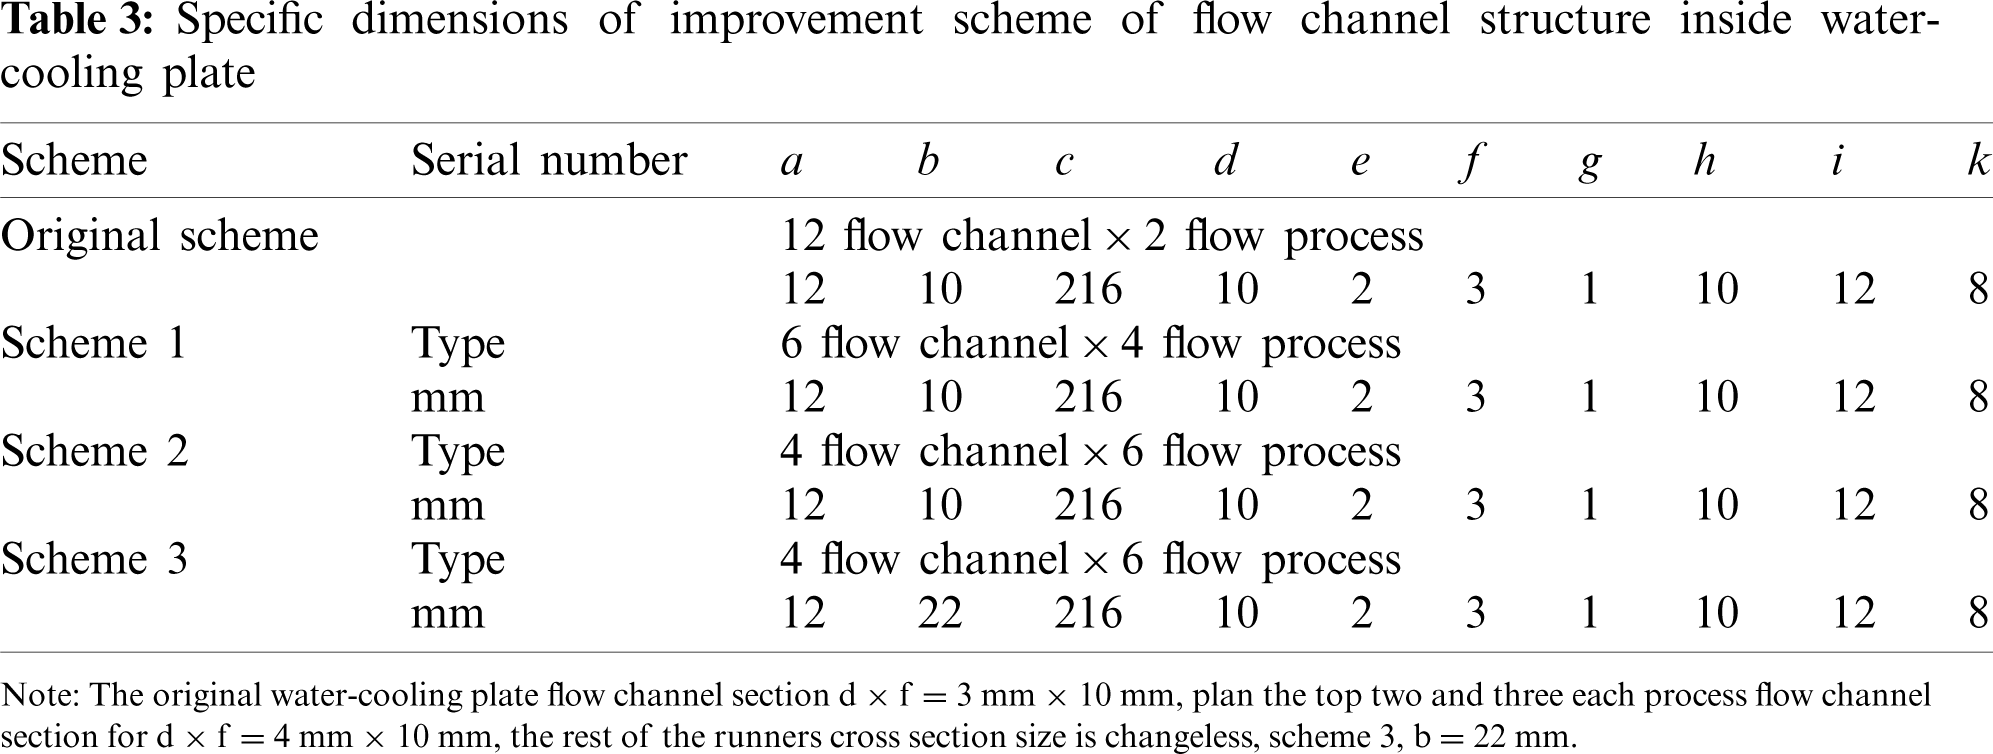
Representing the characteristics of fluid diversion, when there are too many the internal flow channels, the fluid will be diverted to the nearest and less resistant flow channel, and there is almost no fluid passing through the remaining channels [20]. In the optimization process, the factors such as production difficulty, pipeline reconstruction cost and production cost should be comprehensively considered. According to the simulation results of the original model and the characteristics of fluid diversion, without changing the external size and external structure, a progressive structure transformation was adopted to increase the number of internal processes of the water cooling plate and reduced the number of flow channels. This structure was used to optimize the flow velocity distribution and enhance heat transfer. The three progressive structural improvement schemes (shown below as Scheme 1, 2 and 3) are shown in Tab. 3.
3.2 Numerical Simulation Analysis
Since the water-cooling plate is the symmetrical structure, the velocity contour of the middle section of each scheme is shown in Fig. 6.

Figure 6: Velocity cloud diagram of middle section of different programs. (a) Original scheme, (b) Scheme 1, (c) Scheme 2, (d) Scheme 3
It can be seen from Fig. 6 that the flow velocity distribution in the flow channel of the original water-cooled plate scheme is quite uneven and the flow velocity is universal. In addition, the fluid heat transfer coefficient is small. These causes lower heat transfer amount. Compared with the original scheme, the velocity distribution in the first scheme is improved a lot, and the velocity is obviously higher than the original scheme. The velocity distribution of Scheme 2 is not significantly different from that of Scheme 1. However, the average velocity of each process is higher than that of Scheme 1 due to the reduction in the number of flow channels in each process. Compared with the Scheme 2, the velocity distribution in the Scheme 3 is more uniform, but the average velocity change is small. In conclusion, the velocity distribution of the three improved schemes is much better than that of the original scheme.
Fig. 7 shows the comparative analysis of specific data of flow velocity distribution in each scheme of water-cooling plate.

Figure 7: Velocity distribution in the middle section of different water-cooling plate programs
The flow channel numbers are defined as 1--24 from bottom to top. Fig. 7 shows that in the three improvement schemes, only the flow velocity in the 5–7 channel of the first scheme has decreased. Besides the flow velocity in the channel of the other improvement schemes has increased, which will also help to improve the heat transfer coefficient and heat transfer amount between the fluid and the wall in the water-cooling plate. From the aspect of velocity distribution, the velocity distribution of the improved scheme 3 is the most uniform.
Fig. 8 shows the average flow of all channels in each scheme of the water-cooling plate.

Figure 8: Average velocity of middle section in each scheme
As can be seen from Fig. 8, compared with the original scheme, the flow velocity of Scheme 2, 3 and 1 increase by 185%, 176% and 102%, respectively. Therefore, from the point of the average velocity, the flow velocity of Scheme 2 is the highest.
The variation of the outlet temperature of each scheme over time is shown in Fig. 9.

Figure 9: Different programs outlet temperature changes with time
Fig. 9 shows that the outlet temperature of the three improved water-cooling plate schemes changes with time until it is stable, and the response speed of the temperature changes with time in Scheme 2 is the fastest. When the temperature changes tend to be flat, there is little difference between the three improved schemes and the original scheme. Hereby, from the perspective of response speed, Scheme 2 is better. In terms of the outlet water temperature, the outlet temperature of Scheme 1 is the highest and the heat transfer performance is better.
Fig. 10 shows the contrast of the outer wall temperature contour of each scheme.
It can be seen from Fig. 10 that the wall temperature distribution of the three schemes is relatively reasonable. The average temperature of the outer wall in Scheme 1, 2 and 3 is 38.15°C, 35.47°C and 38.95°C, respectively, which are all lower than the simulation temperature of the original scheme of 40.35°C. From the aspect of the wall temperature, the Scheme 2 is better.
The comparison of accumulated heat transfer amount and pressure loss when the outlet temperature of each scheme of water-cooling plate reaches stability is shown in Fig. 11.
As can be seen from Fig. 11, compared with the original scheme, the heat transfer amount in Schemes 2, 1 and 3 increased by 9.5%, 5.3% and 2.9%, respectively. As for the pressure loss, compared with the original scheme, the pressure in Schemes 2, 1 and 3 increased by 210%, 156% and 90%, respectively. Scheme 2 has the highest heat transfer amount and the highest pressure loss. As each of the three schemes has advantages and disadvantages, further analysis is needed to determine the final optimization scheme.
In order to make a more comprehensive analysis of the advantages and disadvantages of the water-cooling plate reconstruction scheme, a “comprehensive evaluation index R” which considers both heat transfer amount and power consumption ratio is introduced for analysis. The specific method is as follows: the heat transfer amount Q (W) divided by the product of flow resistance P (Pa) and flow velocity V(L/h), that is, the ratio of the heat transfer amount and water pump power is R (Eq. (6)).
The greater the value of R is, the greater the heat transfer amount under the same power consumption will be, and the better the modification scheme of the water-cooling plate will be. By plugging in the data, the R values of the three reconstruction schemes are approximately 8546, 3860 and 4539, respectively. It can be seen that Scheme 1 is obviously better than the other two.

Figure 10: Temperature contour of the outer wall surface of different models. (a) Original scheme, (b) Scheme 1, (c) Scheme 2, (d) Scheme 3

Figure 11: Comparison of simulation results of heat transfer amount and pressure loss of different programs. (a) Cumulative heat transfer amount comparison, (b) Pressure loss comparison
Considering the size and distribution of flow rate, heat transfer amount, pressure loss, easy discharge of bubbles, comprehensive evaluation index R value and actual cost, Scheme 1 was finally selected as the optimal scheme.
4 Analysis of Experimental Results of Optimal Water-Cooling Plate Scheme
4.1 Comparison of Experimental and Simulation Results of the Optimal Water-Cooling Plate Scheme
Scheme 1 was made into a physical object using the modified production line. Under the premise of a given inlet flow rate, the temperature of the inlet and outlet water was measured by a temperature measuring instrument to calculate the heat transfer amount. Meantime, the temperature of the calculation plate was recorded by a laptop. The experimental procedure was the same as that of the original water-cooling plate. The comparison and analysis of the experimental and simulation results are shown in Fig. 12.

Figure 12: Comparison of optimal program experiment and simulation results. (a) Outlet temperature changes with time, (b) Heat transfer amount changes with time
According to the Fig. 12, the experiment and the simulated outlet temperature change and heat transfer amount growth trend are approximately consistent over time. The relative error at each moment is less than 3%, and that of adjacent wall temperature is less than 3%. Therefore, the rationality of the optimal numerical simulation method is verified.
4.2 Comparison of Experimental Results Between the Optimal Water-Cooling Plate Scheme and the Original Scheme
As can be seen from Fig. 13a, with the change of time, the outlet temperature of the optimal scheme from the beginning to stabilization is always higher than the outlet temperature of the original scheme. Fig. 13b shows that the cumulative heat transfer amount of the optimal scheme is 20834 W, which is 4.2% higher than that of the original scheme of 19990 W. After the experimental stability of the optimal scheme, the temperature of the conculation plate is 37.2°C, which is 5.3% lower than that of the original scheme at 39.3°C. The effect of increasing heat transfer amount and reducing the temperature of the conculation plate is achieved.

Figure 13: Comparison of experimental results between the optimal scheme and the original scheme. (a) Outlet temperature changes with time, (b) Heat transfer amount changes with time
The experiment and numerical simulation of the original water-cooling plate were carried out in this study, and the rationality of the simulation method and the physical model was verified. Three structural improvement schemes were simulated, and the optimal scheme was selected and verified by experiments. The main conclusions are as follows:
(1) The original water-cooling plate has low heat transfer amount due to the unreasonable structure of the internal flow channel;
(2) After comprehensive consideration of all factors, Scheme 1 was selected as the optimal scheme;
(3) After optimization, the heat transfer amount of the water-cooling plate increased by 4.2% compared with the original scheme, and the average temperature of the calculating plate decreased by 5.3%.
Funding Statement: The authors received no specific funding for this study.
Conflicts of Interest: The authors declare that they have no conflicts of interest to report regarding the present study.
Reference
1. Zhao, Z., Cheng, G. J. (2017). Computer embedded system development at the core of technical analysis. 2nd International Conference on Materials Engineering and Information Technology Applications, Qingdao, Shandong, China, Atlantis Press. [Google Scholar]
2. Hu, X., Liu, G. P., Wang, Y. P., Ye, P., Zong, B. et al. (2014). Experimental study of flow boiling in microchannel system for high-heat-flux power eiectronic devices. Energy Enginnering, 33(7), 7–23. [Google Scholar]
3. Cheng, Z. (2018). Discussion on the relationship between artificial intelligence and integrated circuits. Electronic Manufacturing, 4(2), 67–68. DOI 10.16589/j.cnki.cn11-3571/tn.2018.02.030. [Google Scholar] [CrossRef]
4. Ma, C. (2018). Development of core technology of computer embedded system. Electronic Technology and Software Engineering, 4(10), 144. [Google Scholar]
5. Xu, P. P., Wu, G., Cao, Y. N., Kong, H. Y. (2012). Research on performance of water-cooling plate radiator based on icepak. Electronic and Mechanical Engineering, 34(3), 35–39. DOI 10.19659/j.issn.1008-5300.2018.03.009. [Google Scholar] [CrossRef]
6. Ding, J., Li, J. H., Chen, Y. P., Zhang, C. L. (2011). Influence of flow state and heat source simplified method on imitation of true junction of IGBT water-cooling plate. Electromechanical Transmission and Transmission, 4(5), 21–25. DOI 10.13890/j.issn.1000-128x.2011.05.010. [Google Scholar] [CrossRef]
7. Yu, X. L., Zhang, R. T., Feng, Q. K. (2009). Research on heat transfer performance of new cold plate for high-power module. Power Electronics Technology, 43(12), 79–81. [Google Scholar]
8. Zeng, P., Cheng, G., Liu, J. (2007). Development of single-phased water-cooling radiator for computer chip. Chinese Journal of Mechanical Engineering-English Edition, 20(2), 77–81. DOI 10.3901/CJME.2007.02.077. [Google Scholar] [CrossRef]
9. Yu, C., Wang, F., A. S. N., Ding, J. H. (2019). Experimental study on heat dissipation of high heat flux chip with small variable load cooling device. Energy Engineering, 4(1), 74–79. DOI 10.16189/j.cnki.nygc.2019.01.013. [Google Scholar] [CrossRef]
10. Song, H. J., Yan, Q., Zhu, X. D. (2017). Design and research on the cooling effect of a computer water cooling system. Research and Exploration in Laboratory, 36(3), 55–58. [Google Scholar]
11. Sun, Y. (2019). Preliminary design study of certain computer water-cooling pump//IOP conference series: Earth and environmental science. IOP Publishing, 252(3), 032167. DOI 10.1088/1755-1315/252/3/032167. [Google Scholar] [CrossRef]
12. Pan, Z. W., Wen, C. X., Luo, J. (2019). Air-cooled heat dissipation design of closed case of vehicle controller. Mechanical & Electrical Information, 4(27), 130–132. DOI 10.19514/j.cnki.cn32-1628/tm.2019.27.070. [Google Scholar] [CrossRef]
13. Song, H. J., Qiang, Q., Zhu, X. D., Wang, G., Lan, S. S. (2019). Design and cooling effect of a laptop computer water cooling system. Research and Exploration in Laboratory, 36(3), 55–58. [Google Scholar]
14. Li, Z. M., Liu, W., Zhao, Y. Q., Liu, Y. J., Qiu, M. (2017). Experimental study on cooling electric equipment with high heat fiux based on liquid metal. Energy Engineering, 36(4), 66–70. DOI 10.16189/j.cnki.nygc.2020.02.016. [Google Scholar] [CrossRef]
15. Sahini, M., Kshirsagar, C., Kumar, M., Agonafer, D., Fernandes, J. et al. (2017). Rack-level study of hybrid cooled servers using warm water cooling for distributed vs. centralized pumping systems. Thirty-Third Annual Semiconductor Thermal Measurement and Management Symposium, pp. 155–162. [Google Scholar]
16. Wen, X. J., Du, G. P., Li, Z. Y. (2017). Design of high power electrochemical power source based on synchronous rectification technology. Energy Engineering, 36(4), 45–50. [Google Scholar]
17. Liu, L., Yu, H., Xia, E. (2018). Water block for water-cooling CPU radiator: U.S. Patent 10,136,552. [Google Scholar]
18. Wang, S. L. (2011). Higher engineering fluid mechanics. Beijing China: China Electric Power Press. [Google Scholar]
19. Wang, F. J. (2004). Computational fluid dynamics analysis. Beijing China: Tsinghua University Press. [Google Scholar]
20. Wang, W. C., Zhao, X. K., Liang, S. Y. (2019). Study on local resistance characteristics of double fan parallel connected station. China Science and Technology of Work Safety, 15(7), 81–86. [Google Scholar]
 | This work is licensed under a Creative Commons Attribution 4.0 International License, which permits unrestricted use, distribution, and reproduction in any medium, provided the original work is properly cited. |