| Energy Engineering |
DOI: 10.32604/EE.2021.016291
ARTICLE
Techno-Economic Analysis of a Grid-Connected Waste to Energy Gasification Plant: A Case Study
Department of Electrical Power Engineering, Universiti Teknologi Malaysia, Johor Bahru, 81310, Malaysia
*Corresponding Author: Ahmed Abubakar Elwan. Email: elwanabuahmad@gmail.com
Received: 23 February 2021; Accepted: 16 July 2021
Abstract: With population growth around the world, municipal waste disposal and continued energy demand becomes some of the major challenges to deal with. In order to address these, an approach is required for an optimal waste management system that offers the population benefit with a lower environmental impact. This study evaluates the technical-economic and environmental impact analysis of a grid-connected waste to energy (WtE) plant to power a Univerisiti Teknologi Malaysia (UTM) community. The energy recovery potential of the waste stream was assessed using the life cycle assessment (LCA) method with GaBiTM software (version 4). A technical, economic and environmental analysis was then carried out for the grid-connected WtE system using HOMERPro software with gasification conversion technology. The cash flow analysis was based on levelized costs of energy (LCOE) and total net present value (NPV). The results gave an NPV for the system at USD 1.11 × 10⁷, with most of the effects resulting from the grid operating costs and the LCOE of USD 0.43/kWh compared to the grid unit price of USD 0.7/kWh which corresponds to a saving of $ 0.27/kWh in energy purchase. From an environmental point of view, the results showed a significant reduction in carbon dioxide emissions from around 2,000 tons per year to around 400 tons per year. With regard to the amount of waste sent to landfills, the results show a significant improvement from 142,605.5 kg/year to 0.13 kg/year.
Keywords: Waste to energy; techno-economic analysis; solid waste; gasification
Solid waste generation and high energy demands are two compelling global challenges related to population growth. Researchers and policy makers have linked these challenges to factors such as lifestyle changes, increased manufacturing and use of products that are less likely to be recycled or composted [1]. According to the United Nations (UN), the world population is expected to increase from 7.7 billion in 2019 to 9.7 billion in 2050 and 11.2 billion by the end of the century [2]. The UN also predicts an end to the rapid world population growth by the end of the century [2]. Fig. 1 shows the world population growth from 1700–2100. As the population grows, the amount of municipal waste is expected to grow as well. This has the following effects on health and the environment. Depletion of land for landfills, increased environmental and health threats from emissions to air, land and water. Increase in global waste management spending as global waste management spending [3] rises to $ 2,080.0 billion in 2019 and is estimated to reach US $ 2,339.8 billion by 2027 [4]. This means diverting funds intended for critical services such as health, education or transport in order to use them for waste management.
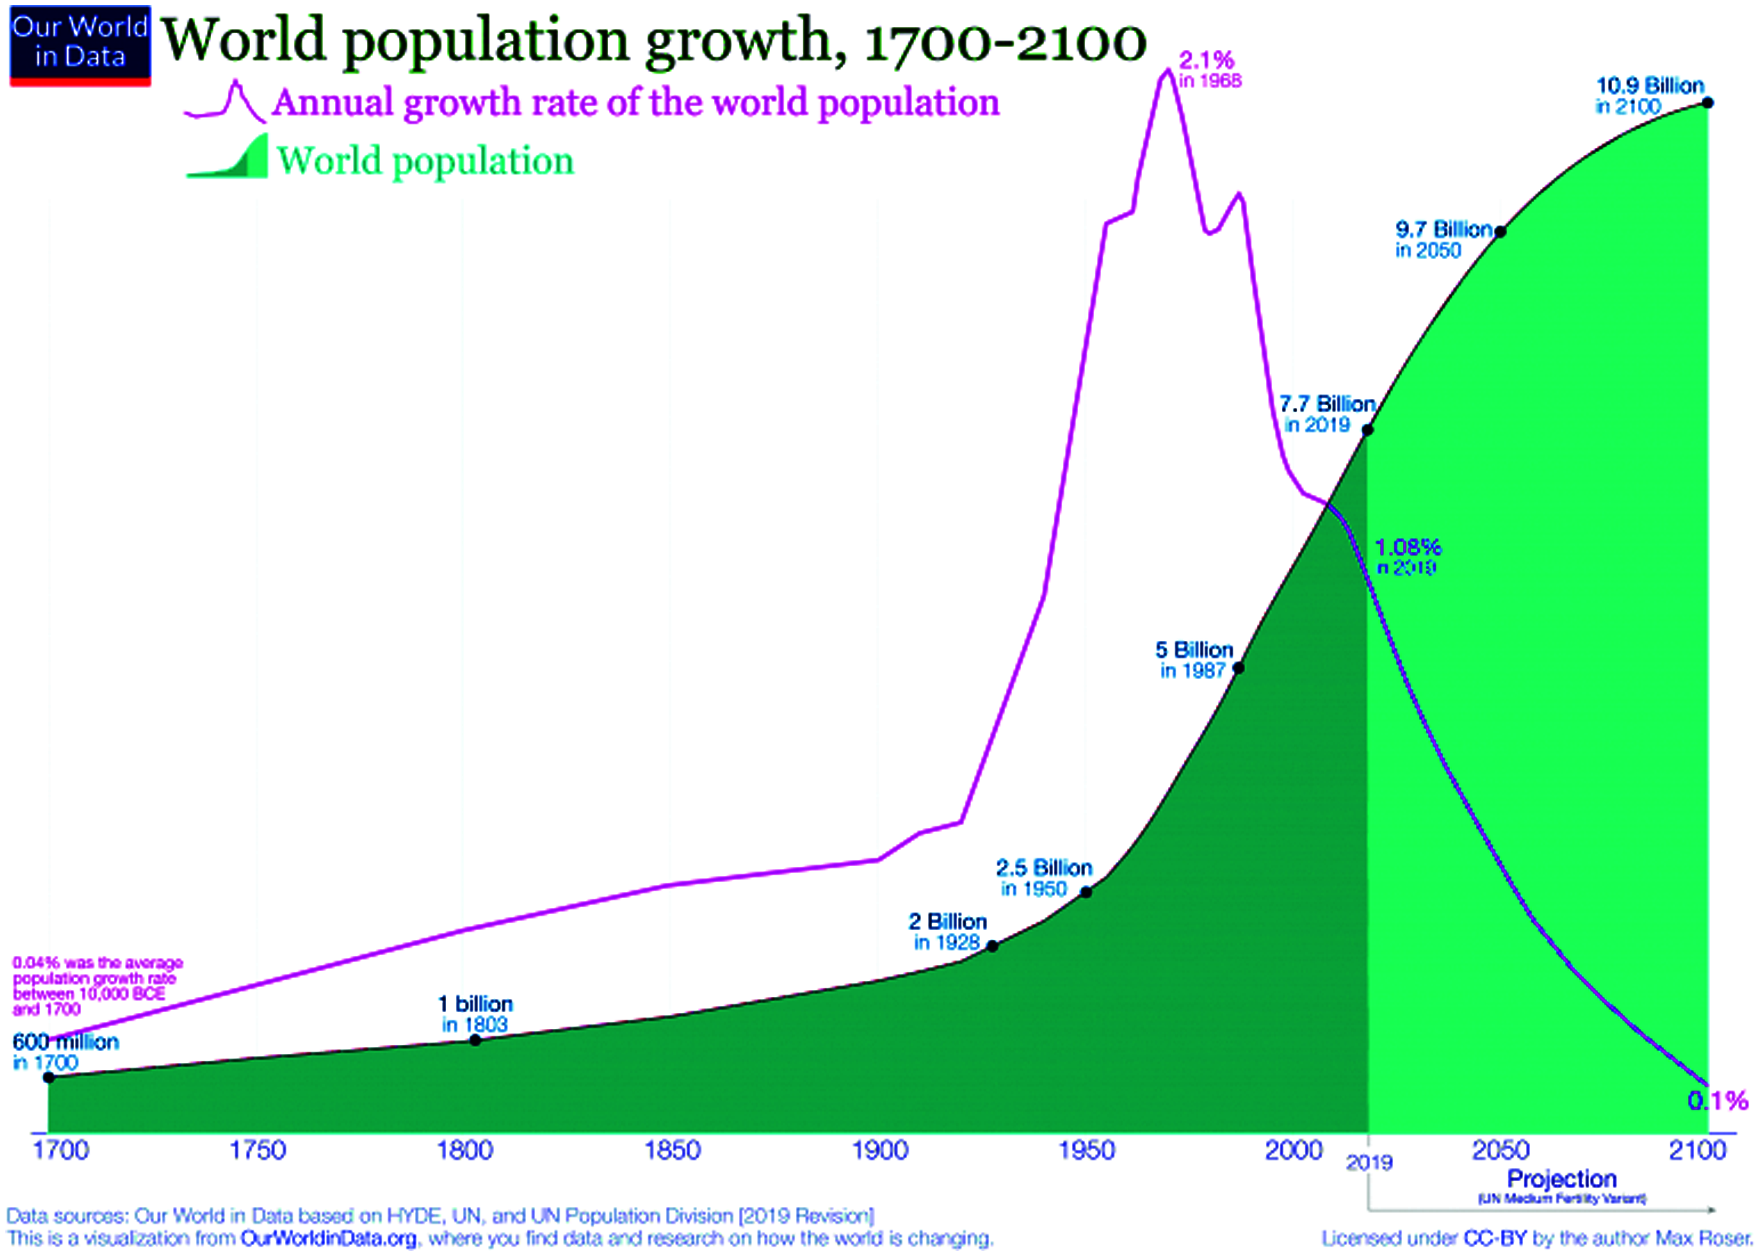
Figure 1: World population growth [2]
Several municipal solid waste disposal methods are used to ensure effective control and management. Fig. 2 shows the hierarchy of waste management (reduction, reuse/recycling, reuse and disposal of residual waste). The figure shows that waste reduction (avoiding the generation of waste through repeated use of products) is most desirable, then reuse/recycling, which is applicable where waste cannot be avoided, and then recovery category (materials and energy), while the last category is to take everything others that cannot be recycled or recovered in landfills and landfills [5].
Despite efforts to reduce, recycle and reuse the generated waste, there is large amount of waste from sites that need to be disposed of in landfills. A site-specific condition is taken when choosing effective options from the various options available or when choosing the most appropriate method [3]. An important waste management strategy that is gaining increased recognition is the energy recovery of municipal waste, known as Waste-to-Energy (WtE). WtE's strategy offers several advantages, including: reducing the amount of materials to be landfilled, preventing air and water pollution, improving the recycling rate that normally occurs during the waste treatment process, and when used as a substitute for fossil fuels in power generation, it can be used to achieve the goal to do justice to an environmentally friendly and sustainable energy generation as well as an increasing penetration of renewable energies (RE) [6].
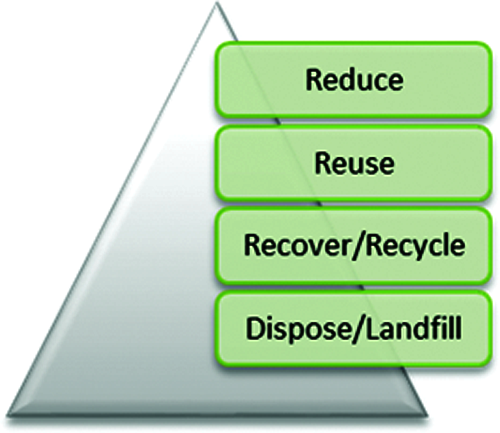
Figure 2: Waste management hierarchy
Although WtE has several advantages, it also has disadvantages, including: high installation costs, especially when adding to the air pollution control system, highly qualified personnel are required for operation, most technologies are in the development phase and some of them are emission-intensive, especially for combustion technology. This approach (WtE) could be an option for waste disposal with energy recovery potential (electrical or heat) that can be delivered to areas with little access to basic energy supply. However, technical and economic problems highlighted earlier prevent the widespread use of WtE systems, especially in developing countries [7].
In order to implement WtEs, the usability of the generated waste for electricity generation must first be determined. Studies on the feasibility of WTE for energy recovery are often carried out under two major topics, which are referred to as technical-economic and environmental analysis. From a technical point of view, the amount of energy (heat or electricity) that can be recovered from the waste is analyzed. The environmental aspect deals with the resulting environmental impacts from the recovery as in [3,7–10]. Life cycle assessment methodology is a widely used tool for carrying out impact assessments for both energy recovery and the environmental impact [11]. Life cycle assessment is a computer-based instrument for assessing environmental impact and benefits of a product or service throughout its entire life cycle [12]. From an economic point of view, there are widespread concepts for evaluating the profitability of an energy recovery project such as net present value (NPV), internal rate of return (IRR) and localized energy costs (LCOE). Studies from [13] use the concepts of net present value (NPV), internal rate of return (IRR) and amortization time to evaluate the economic feasibility of a WtE energy project.
This paper is intended to use the GaBiTM (version 4) software to perform a grave-to-grave life cycle assessment of solid waste from the UTM community to determine power generation potential or otherwise, the study also uses HOMERPro for economic benefit or otherwise of a grid-connected WtE (from UTM generation waste). This WtE serves the electricity demand of part of the community, and finally its suitability to be integrated as an option in the waste management policy of the university. The life cycle assessment is based on the general principles of the ISO 14000 standards and is carefully adapted to the examined case. Two different investigations are required for this work; First investigation is how much electricity in MW/year to generate from UTM waste and what effects this has on the environment. In the second investigation, the profitability of the grid connection of the generated electricity is to be determined. The data used for this work came from; the waste office of the university, the HOMERPro database and from reviewed literature.
This study was divided into three phases: (1) Investigation of the composition of the waste stream through waste separation taking into account the number of inhabitants and the waste collection points. (2) Using GaBiTM (version 4) LCA modeling software in the estimation of energy potential from solid waste. (3) HOMERPro was used to carry out a technical-economic assessment for a grid-connected WtE taking advantages of incentives for reselling excess to the grid. Results obtained will be useful to policy makers in promoting the use of WtE in powering communities and integrating WtE as an option for waste management. Fig. 3 highlights the flow chart for this study, starting with the determination of the waste composition and ending with the analysis of the results from the simulations. Each step is discussed in the following sections:
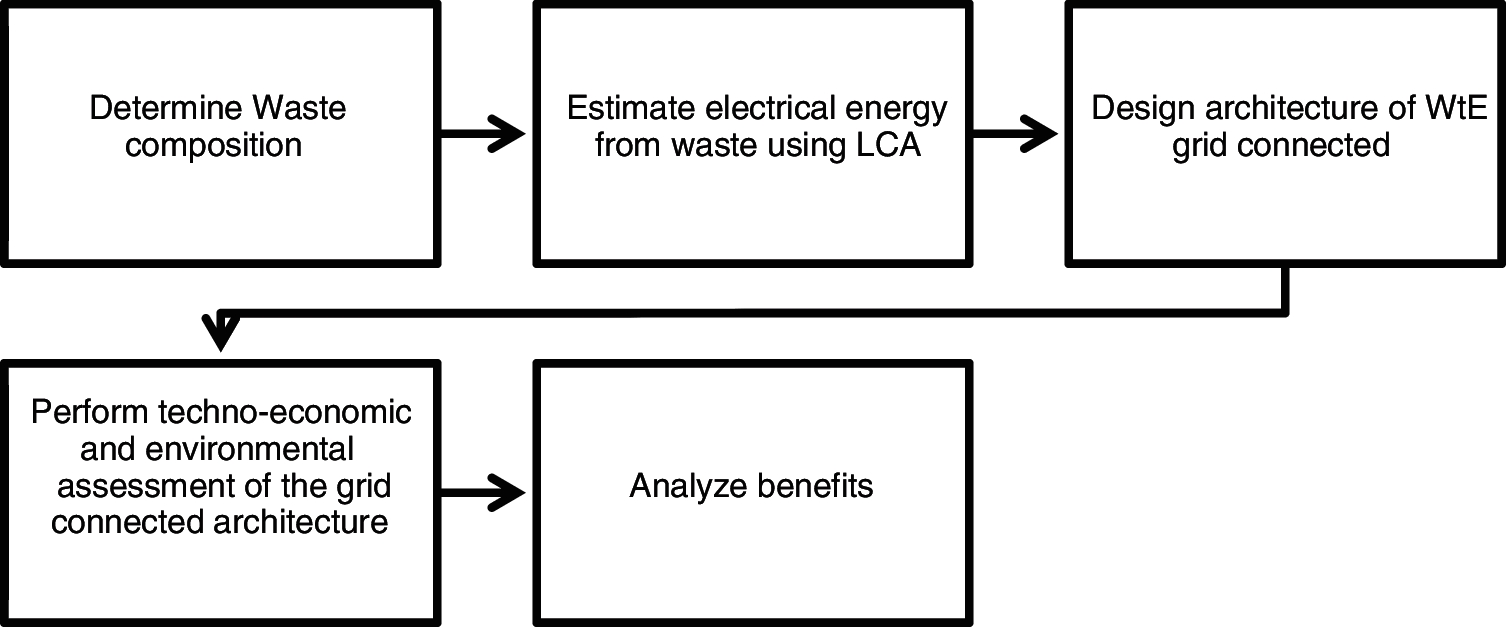
Figure 3: Study flowchart
Universiti Teknologi Malaysia (UTM) Johor campus is located in Skudai Johor Bahru in the state of Johor Malaysia. The campus consists of an administration building, student union, central library, 17 dormitories, 100 guest houses, 12 faculties, commercial area, cafeterias, and a health center. The UTM community generates around 3520.4 tons of waste annually. UTM has taken several green and environmentally friendly initiatives to reduce the amount of waste in landfills [6]. Hence, it has become necessary to assess the environmental impact of the large amount of waste generated and also to explore new ways of managing waste, including potential useful products that can be recovered from the waste. These opportunities will help curb the huge amount of garbage that ends up in landfills, reduce the expense of disposing of that garbage, and generate electricity to power some areas of the university community. The electricity generated from the WtE will supply an estimated electrical load of 14 kW per day and 60 MW per year.
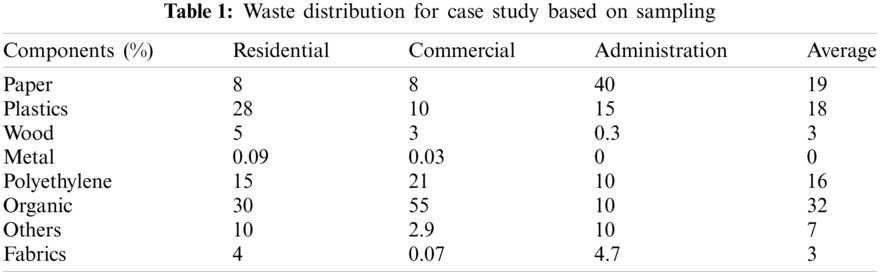
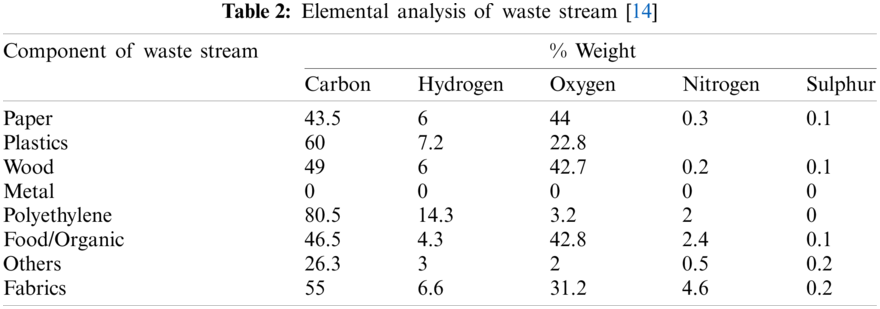
The study area has a daily waste generation potential of 11 tons, the waste generated is categorized as follows; Plastics, paper, wood, glass, polyethylene, organic waste/food and others (this includes all waste that cannot be assigned to any category) [3] shown in Tab. 1. The Global Warming Potential of the wastes is shown in Tab. 2. The first step in successfully determining the composition of the waste is to have an adequate representative of the waste [14] this can be achieved by sampling. For this study, a four-step approach based on the guidelines of the California Integrated Waste Management Board (CIWMB) was chosen as follows:
(1) Select approach
(2) Consider health and safety
(3) Collect representative data
(4) Analyze data.
Steps 1 and 2 are the preparatory stages, Step 3 is an onsite activity and Step 4 is for results and analysis. Sorting and categorization of representative samples was done by physical observation of samples [15,16]. Classification of the sorted samples was based on seven (7) categories; plastics, paper, glass, metal, food/organics and others.
2.1.2 Sampling and Waste Classification
For this study, the generator sampling method was chosen as the sampling approach, which is based on the minimum sample size required to determine a nonparametric (distribution-free) one-sided confidence limit on a percentile [17,18] as in Eq. (1).
where α is probability of a type I error, p the proportion of waste that have to comply with the standard, and n is number of samples to be used. To use confidence level in samples to be used then Eq. (1) is transformed into Eq. (2) for a fixed number of samples with the statistical performance index (1−α).
For this study, the number of samples required to have a confidence of 80%, that is, (1−α) = 80% is seven (7.2). Pareto 80/20 rule was used in the distribution of sampling points where 20% of the sample gives 80% of the result required. The criterion for 80/20 allocation was dependent on population density in the area. The summary of the results from the sampling process is shown in Tab. 1 while the elemental analysis for the waste composition is as in Tab. 2 below.
All waste generated by the community is high in organic content, therefore high greenhouse gas emissions can be expected when disposed off in landfills or open area, but there is also great potential for energy recovery from the carbon content if it is used.
In order to investigate the economic viability of electricity and the associated effects on the environment, the software GaBiTM (version 4) was used to carry out a life cycle assessment of the amount and type of waste generated by the university. Technically in waste management, the life cycle assessment is used to examine the potential effects of waste from its generation to its landfill, which is referred to as from grave to grave [19]. Over the decades, the use of life cycle assessments in MSW Management Systems (MSWM) has grown in popularity, as shown in many review studies. Organizations such as the International Organization of Standards (ISO) have also contributed to the development of the life cycle assessment methodology [20]. The life cycle assessment, as applied in municipal waste based on the type of waste stream such as solid waste, plastics, paper and cardboard, was reviewed in [21–23]. Also [24,25] examined life cycle assessment studies for biowaste and organic waste.
In order to simulate energy recovery potential from waste in the university community with GaBiTM Life Cycle Assessment (LCA) tool, the process flows for all inputs, outputs, system boundaries and functional units are defined. In this life cycle assessment, the input is waste from human activities and the outputs are useful resources from recycling or energy and landfilled goods that are sent to landfill for disposal. The system boundary takes into account all activities that contribute to the life cycle assessment. In this case, the waste stream, the transport of the waste, the WtE plant to be used for recovery and the landfill where the final waste is taken. And the functional unit is the total amount of waste generated. In this life cycle assessment, no raw material extraction or processing is taken into account during the life cycle assessment process. This approach of LCA is often referred to as the grave-to-grave or gate-to-gate method of LCA [26]. The model in Fig. 4 consists of three basic levels, the input level, the system/limit level and the output levels. The functional unit for the simulation is the total annual waste generation (3,025.42 tons).
Figure 4: LCA Simulation Model
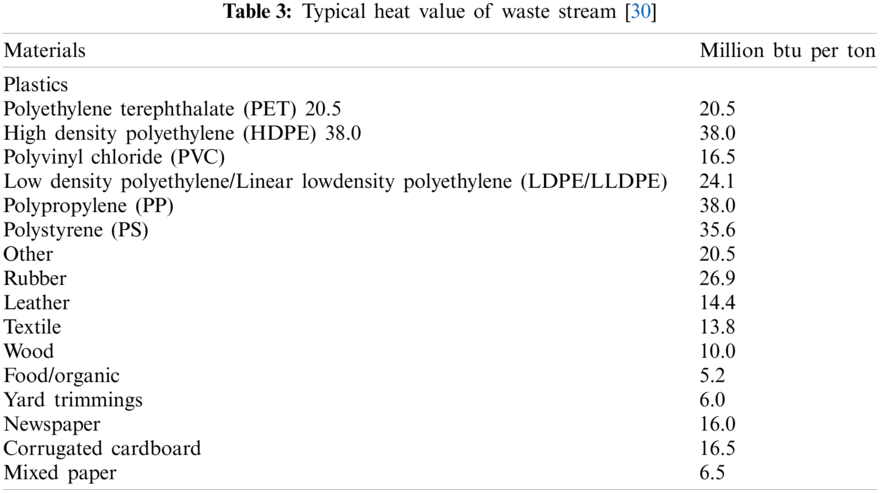
Due to its composition, solid waste has different calorific values depending on the percentage contribution of each component, which has a major influence on the total energy generated from WTE [27]. After recycling, the average calorific value of one ton of municipal waste is (8–12 MJ/kg, as received that is about a third of coal with 25–30 MJ/kg [28] and it can generates an estimated 600 kWh of electricity [29]. Typical calorific values for waste streams are given in Tab. 3.
2.3 Energy Economic Modelling and Simulation
The economic indices used in HOMERPro for the simulation of this work are; Capital expenditure (CAPEX), operating and maintenance expenses (OPEX), fuel costs and recovery/replacement costs at the end of life. Typical cost values for each technology are shown in Tab. 4. In general, the cost (capital or investment) is similar in both developed and developing countries. The differentiating costs are labor costs and operating and maintenance costs, which can be much lower in developing countries [31].
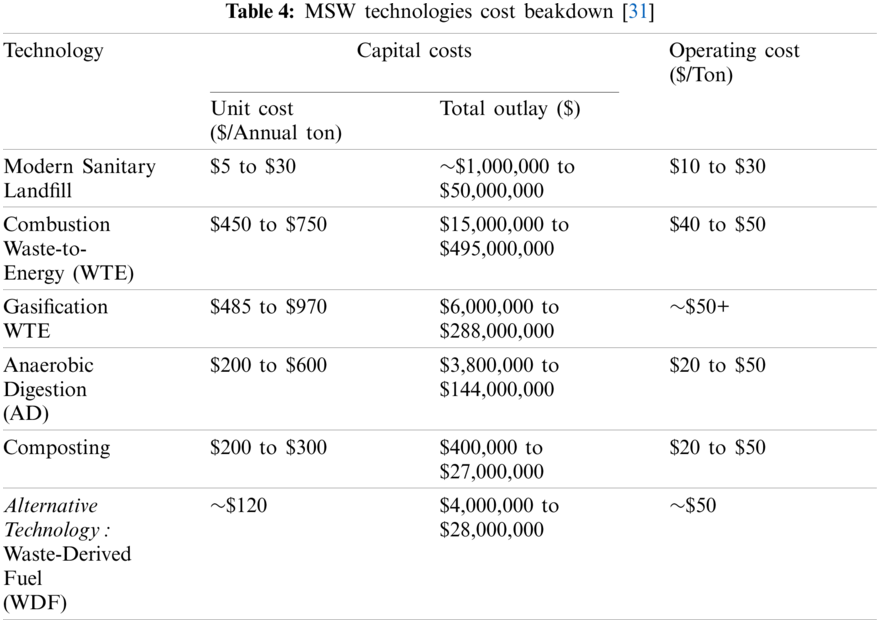
Capital costs of the WTE system is the total costs for system components and installation. Capital costs implied that the total sum of costs for all components that are required to build the WtE system is considered. Tab. 4 shows that the WTE gasification plant is capital intensive because exhaust air treatment unit has to be installed. Capital cost is expressed as capital cost per ton and can be calculated using Eqs.(3)–(5) [32].
where CCPT is capital cost per ton UCC is unit capital cost CRF is the capital recovery factor CF is the capacity factor the value is between 0 and 1.
where DR is the discount rate Lifetime is the expected lifetime for the facility.
Note: The total capital cost for the WTE facility is the summation over all waste components as in Eq. (5).
where TCC is the total capital cost FR is the feed rate.
However, the O&M costs of a WTE facility can include labor costs, overhead costs, auxiliary fuel costs, electricity costs, and maintenance costs. The operating costs do not include duties, taxes and costs for the disposal of residual waste. It also does not include income generated for the system through the sale of electricity or gate fees [19]. The operating cost coefficient depends on the unit operating costs, the rate at which waste enters the facility, and the amount of electricity to be generated. In summary, the operating and maintenance costs are dependent on the complexity of the system. The cost relationship is as given in Eqs. (6)–(9).
where
Total revenue from recycling/component recovery is given by Eq. (7).
where RR = Recovery revenue FR = feed rate.
where Revenue per ton can be obtained from Eq. (9).
Additional revenue for the system is from the acceptance and treatment of waste, known as the tipping fee. The tipping fee includes revenue that may come from the sale of recycled materials. The revenue from the receipt of a ton of municipal waste received (i.e., tipping fee) is $ 11.3/t; however, tipping fee is an offset to fuel costs in the analysis. To obtain the tipping fee, the relationship in Eq. (10) is used.
where TP is the tipping fee, DC is disposal cost of the waste and T is the total waste disposed of.
2.4 Gasification Conversion Technology
The gasification process is the production of generator gas by partially burning solid fuel at high temperatures of around 1,000oC in a reactor called a gasifier. The reactor consists of two separate chambers, the primary and the secondary combustion chamber. The products of the gasification process generally contain nitrogen, water vapor, carbon dioxide and excess oxygen. Fig. 5 shows typical products from a gasification process. These gases are produced by the reaction of water vapor and carbon dioxide through a heating process [33]. The choice of gasification depends on two types of combustor viz; starved air combustor and excess air combustor When using the starved air combustor, air is supplied to the primary chamber at sub-stoichiometric levels, resulting in a flue gas rich in unburned hydrocarbons. At the entrance of the second chamber, air is mixed with the hot flue gas to complete the burning inside the second chamber. At the end, energy is recovered in a boiler that can be used for heating or turning a turbine to generate electricity. The second type is the excess air combustors these are similar to starved air combustors the major difference is that air is supplied in excess of stoichiometric requirements and a has a provision for recirculation to balance temperatures in both chambers.
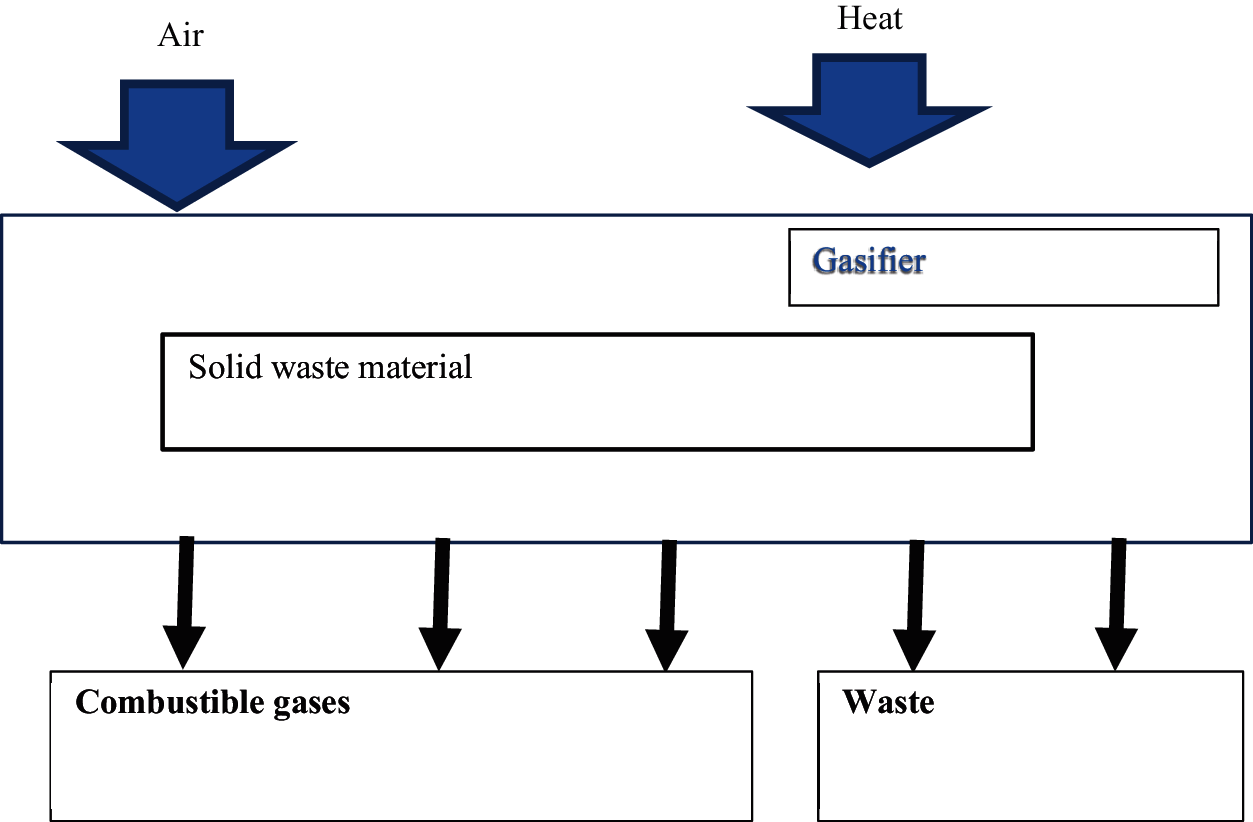
Figure 5: Gasification process
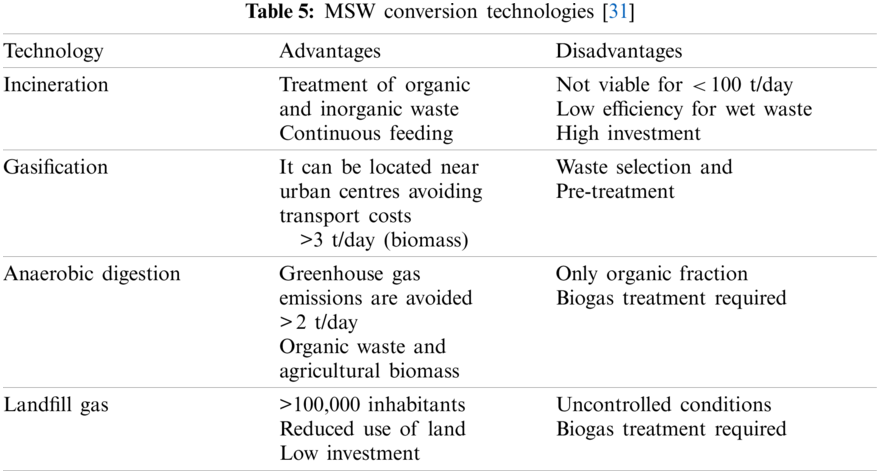
Although WTE gasification has a high capital cost [30] and a complex operational process, it was selected for this study because it does not support open burning option of solid waste for energy generation and therefore it is less likely to generate emissions. Public disharmony as is experienced with most combustion technologies through strong oppositions can be degenerated [34]. It can also be located near communities, which reduces the cost of transporting waste generated from facilities as shown in Tab. 5. Summary of the technical conditions that make a technology feasible/impracticable in each community can be seen in Tab. 5. Further advantages of using gasification technology is the likelihood of locating the plant close to communities as in [8] this will help to maintain constant waste supply to the plant, save in transport costs and avoiding electrical network expansion. The efficiency value used for the selected technology is 23% [31] a typical value given in the literature for WTE systems.
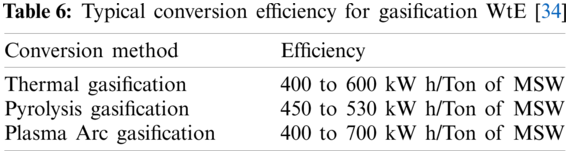
The gasification of municipal waste has a relatively higher energy conversion efficiency than incineration and can be increased by using it as a CHP [31]. Tab. 6 shows the energy efficiency for the gasification of municipal waste. Thermal gasification was chosen for the study, as it is less expensive to operate with sophisticated technology. However, it also requires a little more investment in the cleaning system and it involves using fossil fuels in starting the system.
The load profile considered for the case study is an estimated consumption pattern, with an average demand of 60 MW per year and a daily peak of 14 kW as shown in Fig. 6.
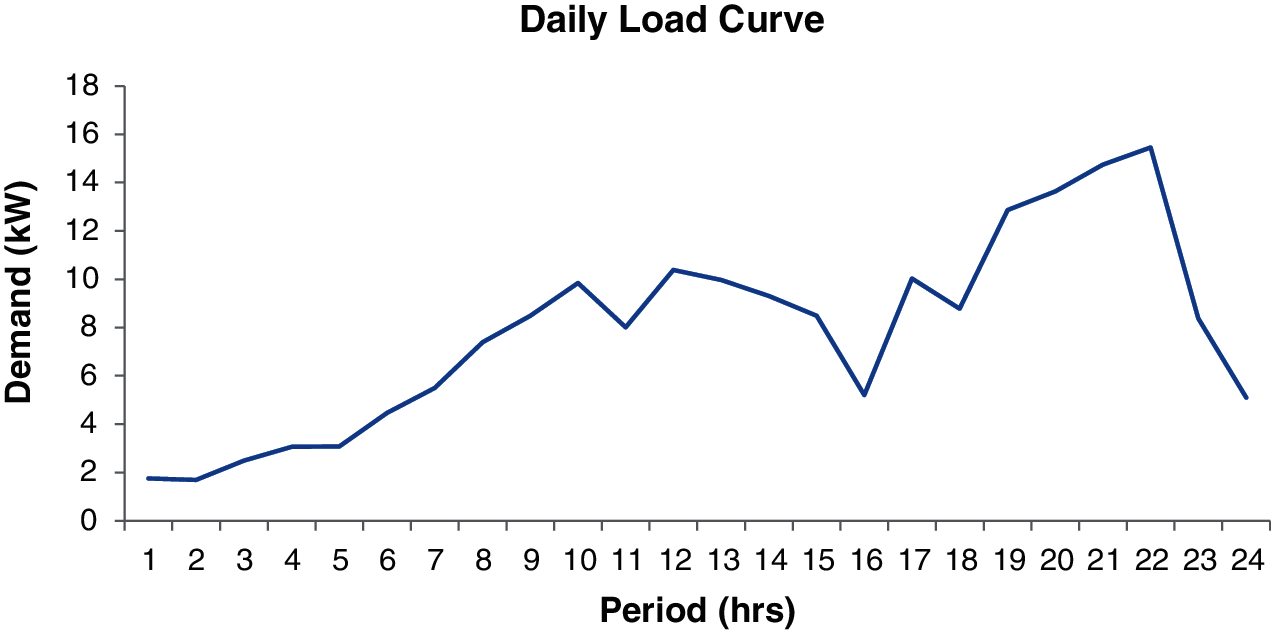
Figure 6: Typical daily load curve
2.5.2 Electrical Energy Purchases and Sales
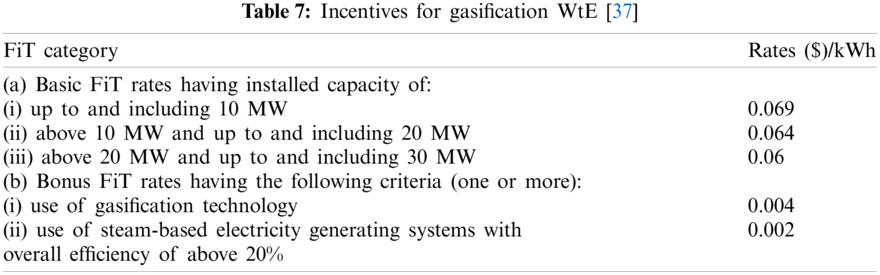
Policies and incentives put in place by the Malaysian government included several key renewable energy (RE) initiatives that dated back as far as 1997 after Malaysia signed the Kyoto Protocol with a commitment to reduce greenhouse gas emissions. In 1999 Malaysia introduced RE as an alternative power generation system by establishing the fifth fuel strategy [35]. Other initiatives such as energy efficiency (EE) in 2008 [36] followed. Malaysia achieved the greatest impact on the RE market with the introduction of the Fit In Tariff (FiT) in 2011. This incentive was based on a quota and was administered by SEDA. This scheme has incentivized EE developers with a bonus [35] as shown in Tab. 7. As seen in Fig. 7; the excess capacity is sold back to the grid.
The price for electricity sold plus regulated incentives is USD 0.74/kWh and the price for purchased energy from the grid is USD 0.67/kWh [35]. The incentive is provided by the Malaysian government to promote participation in WtE.
3 HOMERPro Optimization Process/Simulation
The aim is to optimize cost, power generation and environmental impact of the proposed system. HOMERPro carries out such optimizations for WtEs under different assumptions and uncertainties. Optimization is the determination of optimal values of controllable variables such as the size or quantity of each component of the system [38]. A flow diagram of the optimization process with HOMERPro is shown in Fig. 8.
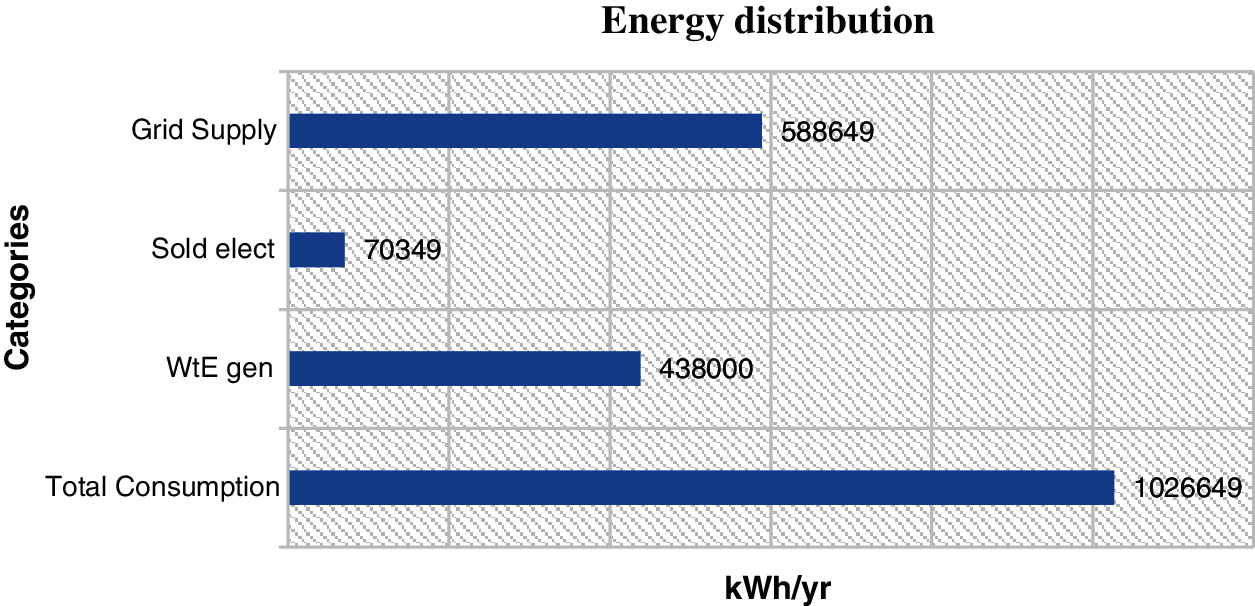
Figure 7: Energy distribution showing excess energy sold to grid
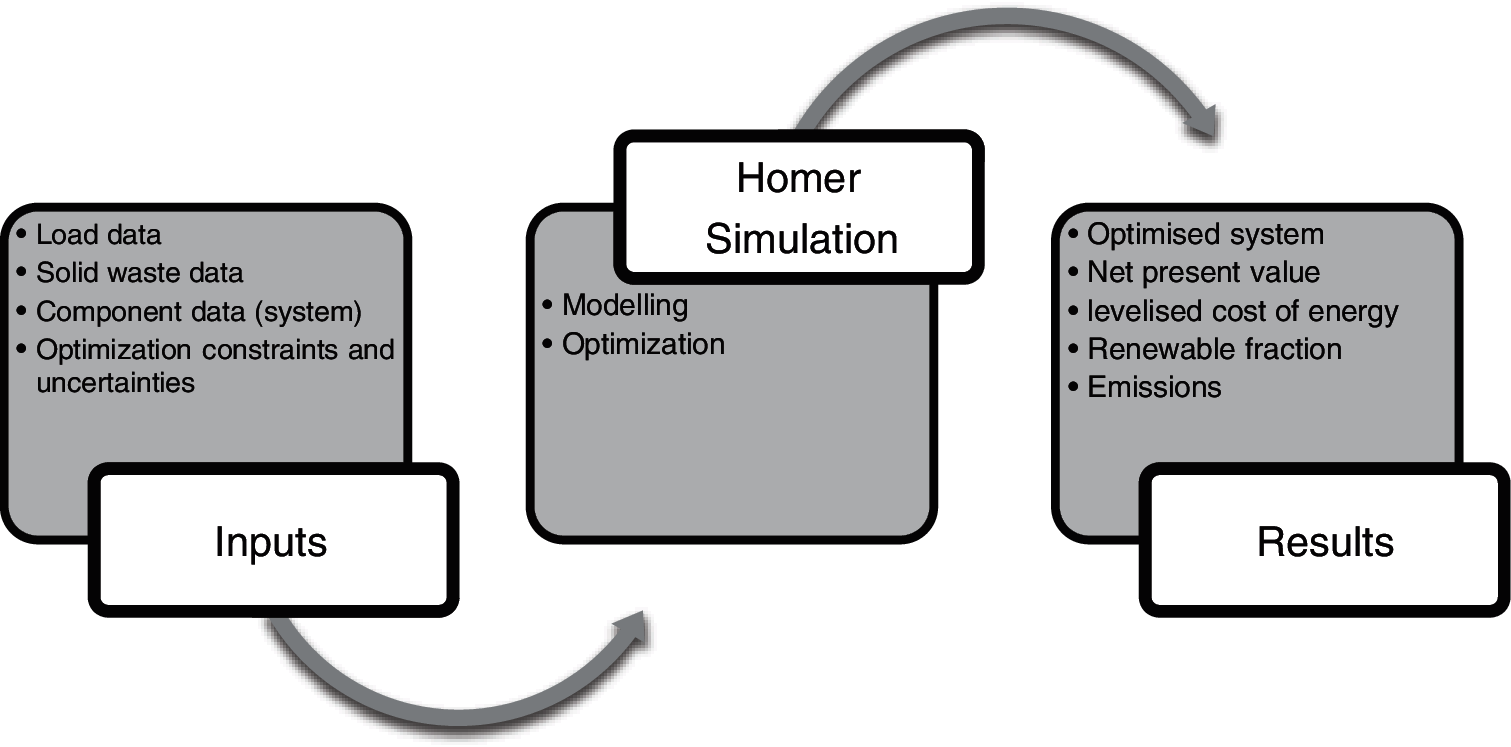
Figure 8: Optimization model using HOMERPro
In order to simulate the system in HOMERPro, a 50 kw output generator was selected as the WtE gasification plant and the expected annual amount of waste to be converted is 3.5 kt. The generator is expected to produce power to serve the given loads as shown in the load curve (Fig. 6) at any given time period. In times of low demand, excess electricity is sold to the grid. In addition, the following parameters are used for the simulation for both the generator and the waste considered: Gasification ratio of the generator is 0.2, the average calorific value (LV) for the waste is 23 MJ/kg, which is typical for waste with a high organic content proportion, the moisture content of the waste is used at 45% [8] and due to maintenance and other activities an 82% active operating days was assumed. The network is considered to be available to compensate for any supply bottlenecks in the system and also to absorb the surpluses generated by the plant.
To model the economic characters of the WtE grid connected in HOMERPro, the Net Present Cost (NPC) and localized Cost of energy (LCOE) of the system are used and for the environmental aspect in HOMERPro, emission reduction and renewable fraction is investigated. These relationships is given in Eqs. (11)–(13) HOMER uses NPC to represent the system's life cycle cost [39]. The NPC is calculated by Eq. (11).
where TAC = total annualized cost; CRF = capital recovery factor And CRF is evaluated using Eq. (4) previously highlighted.
To calculate the average cost of useful electricity produced by the system in $/kWh HOMER uses localized cost of energy (LCOE) and can be calculated as given from Eq. (12) [40].
where Cann, tot is the annual total cost, $ and E is the total electricity consumption in kWh/year.
To quantify renewable contributions for the WtE grid connected system, renewable fraction is used to determine its contribution. Eq. (13) gives the relationship [39].
where Eann, tot, the annual total energy generation of the system, EWtE biomass generator electricity generation.
The results of the simulations are presented and discussed using the three impact categories technical, economic and environmental impact. In the environmental impact category, the sub-categories discussed are emissions to air and water, effects on industrial soil in terms of emissions and landfilled goods. In terms of economic impact category, results were discussed based on NPV, annualized costs and LCOE. In the technical impact category, the amount of electricity contribution in relation to generation and consumption, generated excess electricity and related findings were discussed. Tables and figures are used to show the results for all cases under different impact categories.
4.1 Environmental Impact Assessment
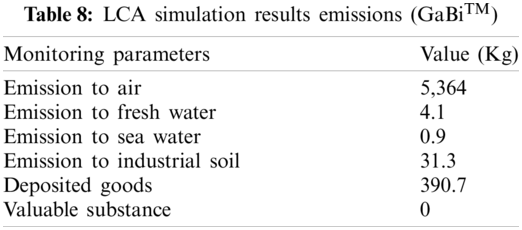
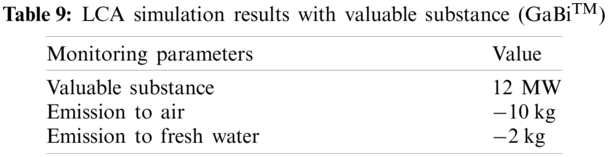
The results of the GaBiTM life cycle assessment simulation are shown in Tabs. 8 and 9. While Tab. 8 shows the life cycle assessment results in which all of the waste incurred was disposed to landfill, Tab. 9 shows the life cycle assessment results for the energy recovery simulation. Approximately 5,364 kg of emissions annually was released into the air, the largest source of environmental pollution from the landfill. The main components of these emissions are the greenhouse gases (carbon dioxide (45%) and methane (55%)). Also around 390.7 kg are deposited in the landfill for the period the landfill was operated. Normally the maximum lifetime is 100 years. Other emission includes emission to water both fresh and sea water in addition to industrial soil.
Results from the life cycle assessment based on the energy recovery from the generated waste are shown in Tab. 9. With regard to the environmental impact, a drastic reduction in emissions was observed with a valuable recovery in terms of electricity. From the table, it can be deduced that the gasification process can generate around 12 MW of electricity with an overall negative impact on the environment. The total emission into the air was reduced from 5 tons to −10 kg CO2 equivalent (53700%), the freshwater emission was reduced by 300% from 4 kg to −2 kg CO2 equivalent without resulting in an emission in industrial soil or an emission in the seawater.
The results in Tab. 10 are the environmental impacts of the HOMERPro simulation for the grid-connected WtE system. Greenhouse gases (GHG) from the system make up the highest proportion of total emissions, carbon dioxide at 374,201 kg/year, sulfur dioxide with 1613 kg/year. The unburned emissions are only 0.97 kg/year and the deposited particles 0.13 kg/year.
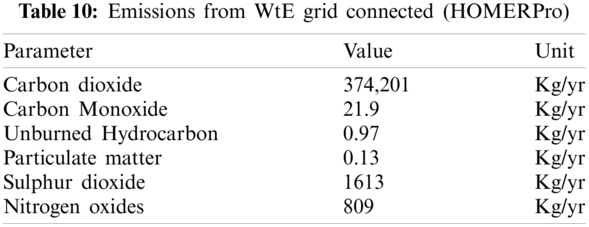
Comparison of Tabs. 8–10, (Emissions from landfilling of waste, the generation of electricity by a WtE system and with the hybrid WtE), shows an increase in emissions because the emission is largely due to the connection to the Grid, and the grid is assumed fossil-fueled.
4.2 Economic Impact Assessment
Figs. 9 and 10 as well as Tabs. 11 and 12 highlight the results of HOMERPRo simulations, in which various optimization conditions and efficiencies were combined in order to achieve optimal electrical performance and costs. The system-optimized costs using the NPV indices are shown in Fig. 9 and Tab. 11. In Fig. 9 most of the costs are related to operation and maintenance, while fuel costs make a negative contribution and the salvage or end of life value for the system is also negative.
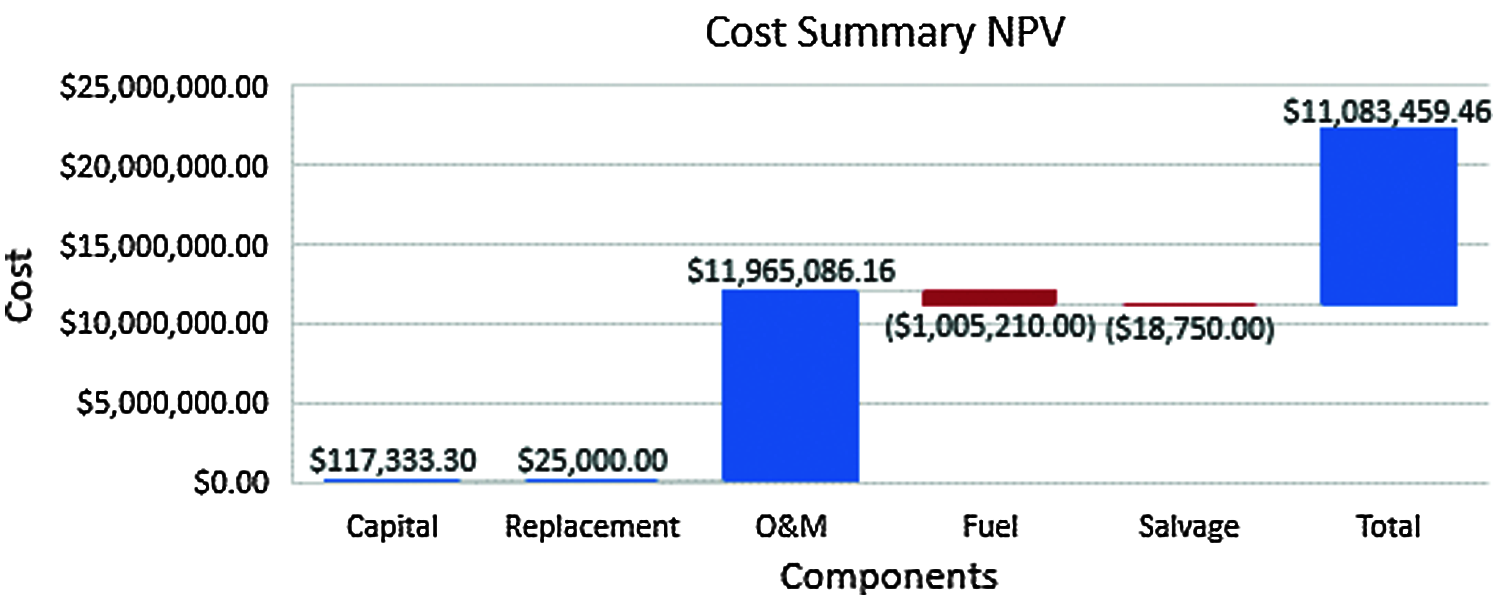
Figure 9: Cost contribution per component (NPV) using HOMERPro
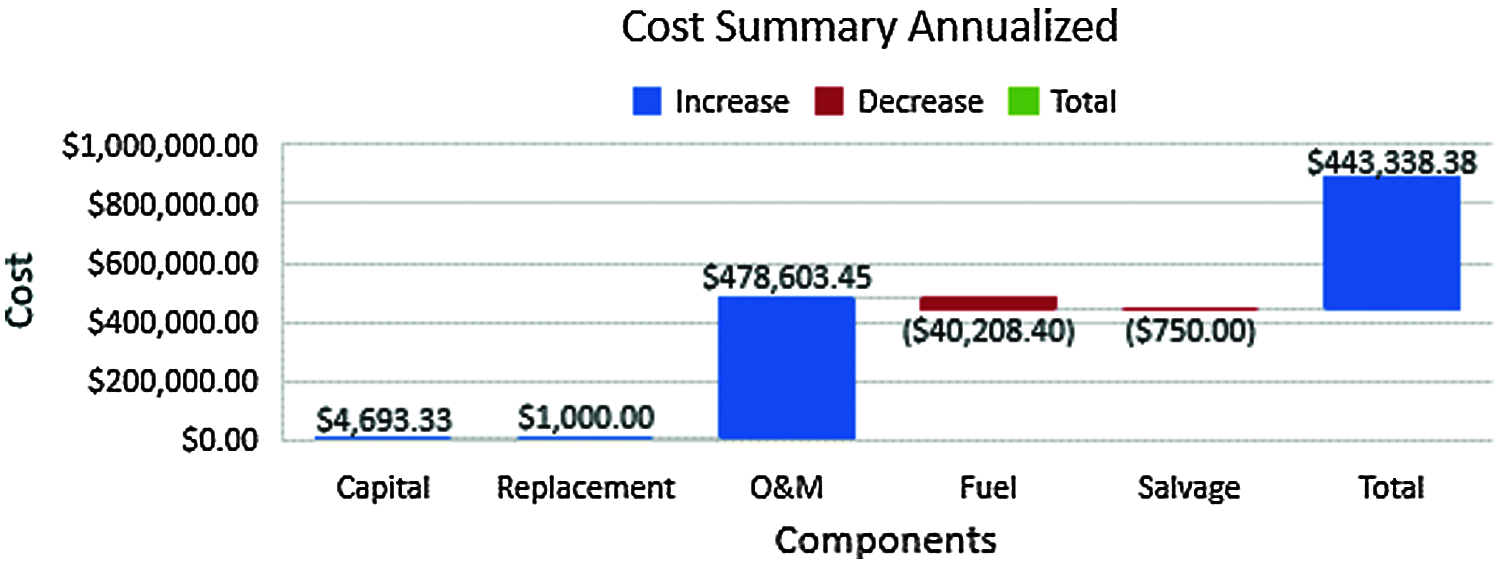
Figure 10: Cost contribution per component (Annualized) using HOMERPro
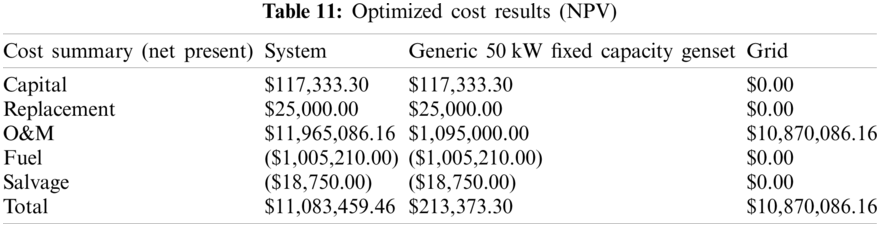
From Tab. 11, the Biomass generator has $117,333 as capital cost, $25,000 as replacement cost after its life time and $1,005,210 to keep the generator in good condition to continue functioning while the grid uses $10,870,086 for O&M making it the highest single cost for any system component.
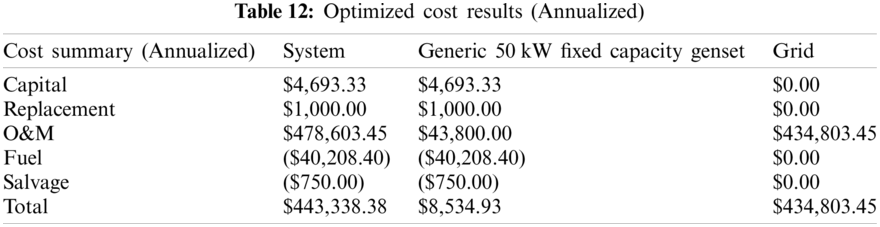
Fig. 10 and Tab. 12 give annualized cost for the optimized system. The Biomass generator has $4,693.33 as capital cost, $1,000 as replacement cost after its life time and $43,800 to keep the generator in good condition to continue functioning while the grid uses $434,803.45 for O&M making it the highest single cost for any system component.
As seen on both Tabs. 11 and 12, the fuel cost is assumed to be the total tipping cost of waste disposal when taken landfill. Fuel cost for the NPV and annualized based analysis is –$1,005,210 and –$40,208.40, respectively.
Fig. 11 compares the cost difference when the total consumption is supplied from the grid with that of energy been supplied by the hybrid WtE plant been modelled.
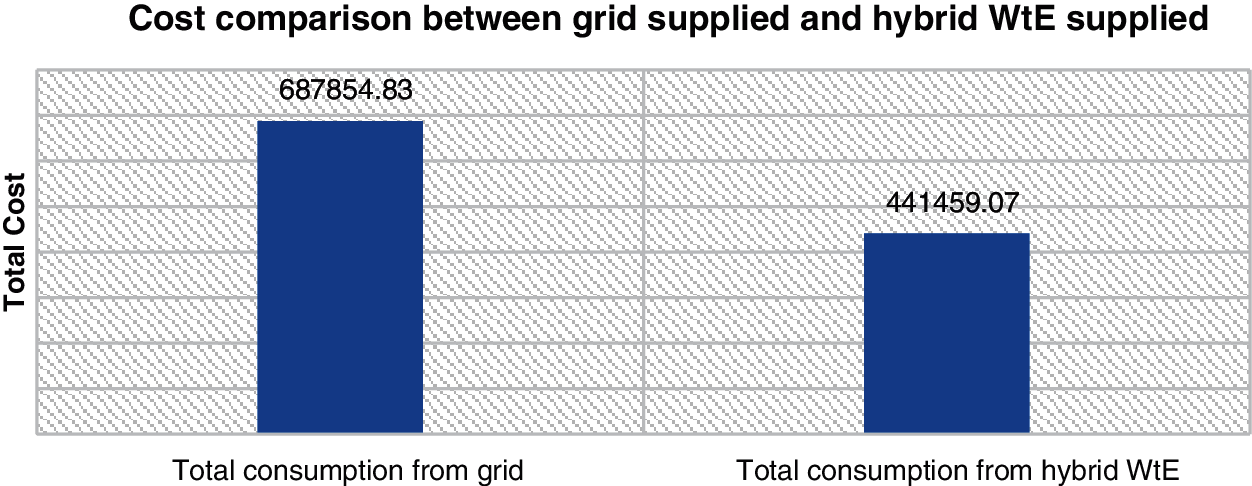
Figure 11: Cost comparison grid supplied and hybrid WtE
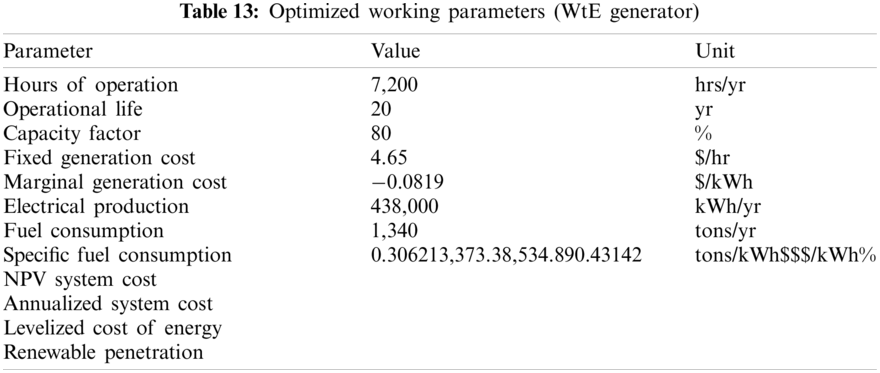
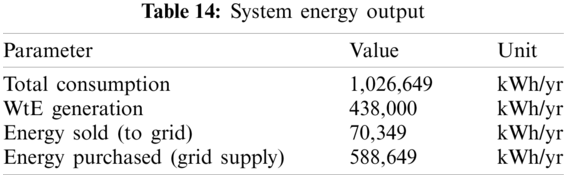
From the results in Tab. 13, it can be seen that the optimal operating hours were 7200 h/year for maintenance times and a capacity factor of 80% due to inefficiencies and other factors. In relation to the share of renewable energies, it is 42% of total energy consumption. With regard to the generation of electrical energy, the optimal production quantity is 438,000 kWh/year with a nominal output of the gasification generator of 50 kW. The LCOE is $ 0.431/kWh. The total electrical energy consumed is 1,026,649 kWh/year, of which 93.1% (956,300) was consumed by the primary consumer (needs of the community), while the other 6.9% (70,349) of the total electrical energy was fed into the grid.
While the generator is expected to generate electricity to serve the given loads at any given time period, the grid supports during periods of high demand and while the WtE may not be able to cover the total consumption. The surplus electricity generated from the WtE was fed back into the grid and sold. Tab. 14 shows the results of the total energy generated by the WtE plant, the load served and the excess energy of the generator as well as the amount of electricity that is processed between the grid and the generator in relation to the total consumption. Of the total consumption, 42% (438,000 kWh) from the WtE and the purchased energy (grid feed-in) 58% (588,649 kWh) and around 70,349 kWh were fed back into the grid as energy sales.
This study was to carry out a technical, economic and environmental analysis of a grid-connected gasification WtE system in order to cover part of the load requirements of the UTM community. The main conclusions are as follows: 1) The amount of solid waste generated by UTM can be used as a fuel source to generate electricity that can meet some demand. 2) By using WtE for the UTM community, the amount of waste to be dumped is significantly reduced. These help to improve waste management in UTM. 3) It is shown that it makes economic sense to connect WtE two fronts; First, the system is fully optimized, with the WtE generator selling excess energy back to the grid and supporting the grid when the generation is below the required demand. Second, the amount to be paid per kWh, which is represented by the levelized cost of electricity, is below the normal price of electricity from the grid. Although WtEs have a high initial cost of capital, the amount realized as dumping fees can be used to lower overall system costs. Government support in the form of loans or incentives is also required in order to attract many interests. Restriction for the study is that the study was carried out with an evaluation version of the HOMERPro software and therefore many more details from the study could not be presented.
Acknowledgement: This work was supported/funded by the Ministry of Higher Education under Fundamental Research Grant.
Funding Statement: This work was supported/funded by the Ministry of Higher Education under Fundamental Research Grant. Grant No. FRGS/1/2018/TK07/UTM/02/6. https://www.mohe.gov.my/en/initiatives-2/187-program-utama/penyelidikan/548-research-grants-inf-ormation.
Conflicts of Interest: The authors declare that they have no conflicts of interest to report regarding the present study.
1. Asase, M., Yanful, E. K., Mensah, M., Stanford, J., Amponsah, S. (2009). Comparison of municipal solid waste management systems in Canada and Ghana: A case study of the cities of London, Ontario, and Kumasi, Ghana. Waste Management, 29(10), 2779–2786. DOI 10.1016/j.wasman.2009.06.019. [Google Scholar] [CrossRef]
2. Jorge, H. (2020). https://databank.worldbank.org/source/population-estimates-and-projections. [Google Scholar]
3. Moya, D., Aldás, C., López, G., Kaparaju, P. (2017). Municipal solid waste as a valuable renewable energy resource: A worldwide opportunity of energy recovery by using waste-to-energy technologies. Energy Procedia, 134, 286–295. DOI 10.1016/j.egypro.2015.03.247. [Google Scholar] [CrossRef]
4. https://www.globenewswire.com/news-release/2020/09/02/2087466/0/en/The-global-waste-management-market-was-valued-at-2-080-0-billion-in-2019-and-is-expected-to-reach-2-339-8-billion-by-2027-registering-a-CAGR-of-5-5-from-2020-to-2027.html. [Google Scholar]
5. Hadidi, L. A., Ghaithan, A., Mohammed, A., Al-Ofi, K. (2020). Deploying municipal solid waste management 3R-wTE framework in Saudi Arabia: Challenges and future. Sustainability, 12(14), 5711. DOI 10.3390/su12145711. [Google Scholar] [CrossRef]
6. Elwan, A., Arief, Y. Z., Adzis, Z., Saad, M. H. I. (2013). The viability of generating electricity by harnessing household garbage solid waste using life cycle assessment. Procedia Technology, 11, 134–140. DOI 10.1016/j.protcy.2013.12.172. [Google Scholar] [CrossRef]
7. Malav, L. C., Yadav, K. K., Gupta, N., Kumar, S., Sharma, G. K. et al. (2020). A review on municipal solid waste as a renewable source for waste-to-energy project in India: Current practices, challenges, and future opportunities. Journal of Cleaner Production, 277, 123227. DOI 10.1016/j.jclepro.2020.123227. [Google Scholar] [CrossRef]
8. Fernández-Gonzalez, J. M., Grindlay, A. L., Serrano-Bernardo, F., Rodríguez-Rojas, M. I., Zamorano, M. (2017). Economic and environmental review of waste-to-energy systems for municipal solid waste management in medium and small municipalities. Waste Management, 67, 360–374. DOI 10.1016/S0956-053X(98)00146-9. [Google Scholar] [CrossRef]
9. Elwan, A., Arief, Y. Z., Adzis, Z., Muhamad, N. A. (2015). Life cycle assessment-based environmental impact comparative analysis of composting and electricity generation from solid waste. Energy Procedia, 68, 186–194. DOI 10.1016/j.egypro.2015.03.247. [Google Scholar] [CrossRef]
10. Viau, S., Majeau-Bettez, G., Spreutels, L., Legros, R., Margni, M. et al. (2020). Substitution modelling in life cycle assessment of municipal solid waste management. Waste Management, 102, 795–803. DOI 10.1016/S0956-053X(98)00146-9. [Google Scholar] [CrossRef]
11. Christensen, T. H., Damgaard, A., Levis, J., Zhao, Y., Björklund, A. et al. (2020). Application of LCA modelling in integrated waste management. Waste Management, 118, 313–322. DOI 10.1016/j.wasman.2020.08.034. [Google Scholar] [CrossRef]
12. Yuguda, T. K., Li, Y., Xiong, W., Zhang, W. (2020). Life cycle assessment of options for retrofitting an existing dam to generate hydro-electricity. The International Journal of Life Cycle Assessment, 25(1), 57–72. DOI 10.1016/j.rser.2016.12.123. [Google Scholar] [CrossRef]
13. Beegle, J. R., Borole, A. P. (2018). Energy production from waste: Evaluation of anaerobic digestion and bio-electrochemical systems based on energy efficiency and economic factors. Renewable and Sustainable Energy Reviews, 96, 343–351. DOI 10.1016/j.rser.2016.12.123. [Google Scholar] [CrossRef]
14. Morris, M., Waldheim, L. (1998). Energy recovery from solid waste fuels using advanced gasification technology. Waste Management, 18(6–8), 557–564. DOI 10.1016/S0956-053X(98)00146-9. [Google Scholar] [CrossRef]
15. Malakahmad, D., Amirhossein, D., Nasir, C. M., Za'im Zaki, M., Kutty, S. R. M. et al. (2010). Solid waste characterization and recycling potential for university technology petronas academic buildings. American Journal of Environmental Sciences, 6(5), 422–427. [Google Scholar]
16. Budhiarta, I., Siwar, C., Basri, H. (2012). Current status of municipal solid waste generation in Malaysia. International Journal on Advanced Science Engineering Information Technology, 2(2), 16–21. [Google Scholar]
17. Hahn, G. J., Meeker, W. Q. (2011). Statistical intervals: A guide for practitioners, vol. 92. USA: John Wiley & Sons. [Google Scholar]
18. Cocârţă, D. M., Neamţu, S., Deac, A. R. (2016). Carcinogenic risk evaluation for human health risk assessment from soils contaminated with heavy metals. International Journal of Environmental Science and Technology, 13(8), 2025–2036. DOI 10.1007/s13762-011-0009-3. [Google Scholar] [CrossRef]
19. Parascanu, M. M., Kaltschmitt, M., Rödl, A., Soreanu, G., Sánchez-Silva, L. (2021). Life cycle assessment of electricity generation from combustion and gasification of biomass in Mexico. Sustainable Production and Consumption, 27, 72–85. DOI 10.1016/j.spc.2020.10.021. [Google Scholar] [CrossRef]
20. Theodore, M. K., Theodore, L. (2009). Introduction to environmental management, 1st ed., pp. 37–46. Boca Raton: CRC Press. DOI 10.1201/9781420089080. [Google Scholar] [CrossRef]
21. Istrate, I. R., Iribarren, D., Gálvez-Martos, J. L., Dufour, J. (2020). Review of life-cycle environmental consequences of waste-to-energy solutions on the municipal solid waste management system. Resources, Conservation and Recycling, 157, 104778. DOI 10.1016/j.resconrec.2020.104778. [Google Scholar] [CrossRef]
22. Zhang, H., Pap, S., Taggart, M. A., Boyd, K. G., James, N. A. et al. (2020). A review of the potential utilisation of plastic waste as adsorbent for removal of hazardous priority contaminants from aqueous environments. Environmental Pollution, 258, 113698. DOI 10.1016/j.envpol.2019.113698. [Google Scholar] [CrossRef]
23. Villanueva, A., Wenzel, H. (2007). Paper waste–recycling, incineration or landfilling? A review of existing life cycle assessments. Waste Management, 27(8), S29–S46. DOI 10.1016/j.wasman.2007.02.019. [Google Scholar] [CrossRef]
24. Bernstad, A., la Cour Jansen, J. (2012). Review of comparative LCAs of food waste management systems–current status and potential improvements. Waste Management, 32(12), 2439–2455. DOI 10.1016/j.wasman.2007.02.019. [Google Scholar] [CrossRef]
25. Morris, J., Matthews, H. S., Morawski, C. (2013). Review and meta-analysis of 82 studies on end-of-life management methods for source separated organics. Waste Management, 33(3), 545–551. DOI 10.1016/j.wasman.2007.02.019. [Google Scholar] [CrossRef]
26. Elwan, A., Arief, Y. Z., Muhamad, N. A., Bashir, N., Adzis, Z. (2006). Solid waste as a renewable feedstock: A review. Renewable Energy, 1, 2. [Google Scholar]
27. Ali, J., Rasheed, T., Afreen, M., Anwar, M. T., Nawaz, Z. et al. (2020). Modalities for conversion of waste to energy—Challenges and perspectives. Science of the Total Environment, 727, 138610. DOI 10.1016/j.scitotenv.2020.138610. [Google Scholar] [CrossRef]
28. Situmorang, Y. A., Zhao, Z., Yoshida, A., Abudula, A., Guan, G. (2020). Small-scale biomass gasification systems for power generation (<200 kW classA review. Renewable and Sustainable Energy Reviews, 117, 109486. DOI 10.1016/j.rser.2019.109486. [Google Scholar] [CrossRef]
29. Abdur, R. M. (2011). Prospect of electric energy from solid wastes of rajshahi city corporation: A metropolitan city in Bangladesh. 2nd International Conference on Environmental Engineering and Applications, vol. 17. Singapore. [Google Scholar]
30. Panepinto, D., Zanetti, M. C. (2018). Municipal solid waste incineration plant: A multi-step approach to the evaluation of an energy-recovery configuration. Waste Management, 73, 332–341. DOI 10.1016/j.wasman.2007.02.019. [Google Scholar] [CrossRef]
31. Leme, M. M. V., Rocha, M. H., Lora, E. E. S., Venturini, O. J., Lopes, B. M. et al. (2014). Techno-economic analysis and environmental impact assessment of energy recovery from municipal solid waste (MSW) in Brazil. Resources, Conservation and Recycling, 87, 8–20. DOI 10.1016/j.resconrec.2014.03.003. [Google Scholar] [CrossRef]
32. Young, G. C. (2010). Municipal solid waste to energy conversion processes: Economic, technical, and renewable comparisons. USA: John Wiley & Sons. [Google Scholar]
33. World Bank (2011). Viability of current and emerging technologies for domestic solid waste treatment and disposal: Implications on dioxin and furan emissions. Washington DC. https://openknowledge.worldbank.org/handle/10986/12803. [Google Scholar]
34. Alzate, S., Restrepo-Cuestas, B., Jaramillo-Duque, Á. (2019). Municipal solid waste as a source of electric power generation in Colombia: A techno-economic evaluation under different scenarios. Resources, 8(1), 51. DOI 10.3390/resources8010051. [Google Scholar] [CrossRef]
35. Abdullah, W. S. W., Osman, M., Ab Kadir, M. Z. A., Verayiah, R. (2019). The potential and status of renewable energy development in Malaysia. Energies, 12(12), 2437. DOI 10.3390/en12122437. [Google Scholar] [CrossRef]
36. Oh, T. H., Hasanuzzaman, M., Selvaraj, J., Teo, S. C., Chua, S. C. (2018). Energy policy and alternative energy in Malaysia: Issues and challenges for sustainable growth–An update. Renewable and Sustainable Energy Reviews, 81, 3021–3031. DOI 10.1016/j.rser.2019.109486. [Google Scholar] [CrossRef]
37. SEDAN (2021). http://dual.seda.gov.my/reportal/fit/. [Google Scholar]
38. Barakat, S., Samy, M. M., Eteiba, M. B., Wahba, W. I. (2016). Feasibility study of grid connected PV-biomass integrated energy system in Egypt. International Journal of Emerging Electric Power Systems, 17(5), 519–528. DOI 10.1515/ijeeps-2016-0056. [Google Scholar] [CrossRef]
39. Dalton, G. J., Lockington, D. A., Baldock, T. E. (2009). Case study feasibility analysis of renewable energy supply options for small to medium-sized tourist accommodations. Renewable Energy, 34(4), 1134–1144. DOI 10.1016/j.renene.2008.06.018. [Google Scholar] [CrossRef]
40. Niaz, H., Liu, J. (2020). Dynamic model for solar hydrogen via alkaline water electrolyzer: A real-time techno-economic perspective with and without energy storage system. 2020 20th International Conference on Control, Automation and Systems (ICCASpp. 814–819. Singapore, IEEE. [Google Scholar]
 | This work is licensed under a Creative Commons Attribution 4.0 International License, which permits unrestricted use, distribution, and reproduction in any medium, provided the original work is properly cited. |