| Energy Engineering |
DOI: 10.32604/EE.2021.017563
ARTICLE
Comprehensive Study, Design and Economic Feasibility Analysis of Solar PV Powered Water Pumping System
1Department of Electrical and Electronics Engineering, GMR Institute of Technology, Rajam, Andhra Pradesh, India
2Department of Electrical and Electronics Engineering, Vardhaman College of Engineering, Shamshabad, Hyderabad, Telangana, India
3Power Projects Private Limited, Chennai, Tamil Nadu, India
*Corresponding Author: K. Karthick. Email: kkarthiks@gmail.com; karthick.k@gmrit.edu.in
Received: 20 May 2021; Accepted: 09 August 2021
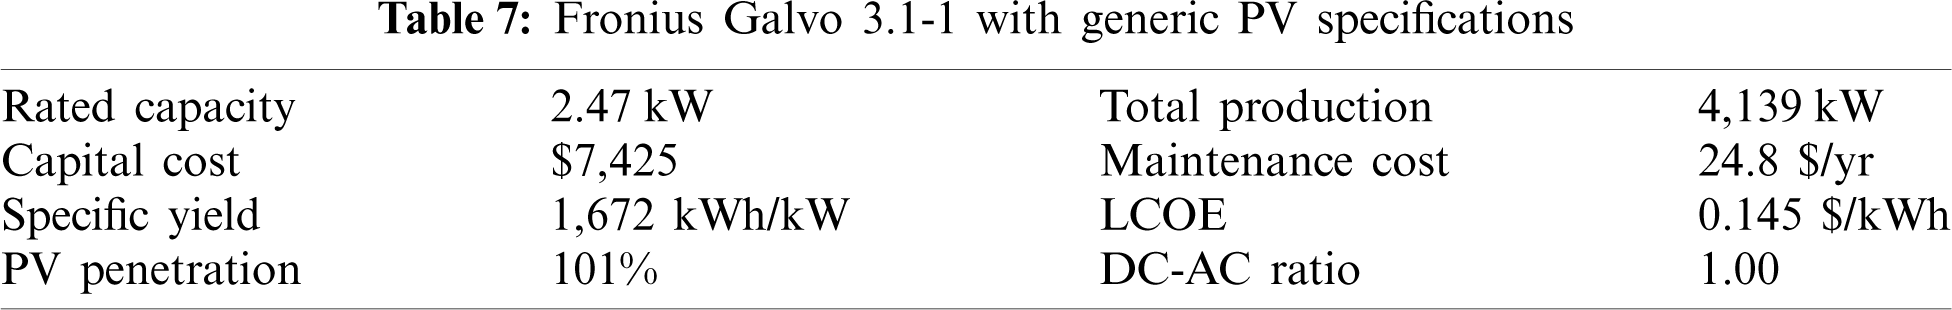
Abstract: The energy efficient product can be operated with longer duration. They offer wonderful solutions compared to other conventional water pumping system as it needs less maintenance, simple in installation, zero fuel cost, longer operating life, highly reliable and free from production of greenhouse gases. In this paper we analyzed the different topologies of DC–DC converter in terms of their operating region of MPPT, quality of input and output currents. We discussed the MPPT algorithms to address partial shading effects in SPV array, present state of the technology, factors affecting the performance of the system, efficiency improvements and identified the research gaps. Also, the economic feasibility analysis has been done for the real time scenario using the Homer Pro software. The estimation of total dynamic head and horse power calculation has been done to decide the total load capacity. The economic analysis results such as cumulative cash flow over project lifetime of 25 years are presented. It is observed that the capital investment requirement is $7,425 for installing Fronius PV system that has a nominal capacity of 2.47 kW and annualized savings will be $134.93. In the long-term perspective, the return on investment is −2.18% as per the present tariff plan.
Keywords: DC–DC converter; economic feasibility analysis; MPPT; solar photo voltaic; solar pumps; water pumping system
| Nomenclature | |
| ABC | Artificial Bee Colony |
| ANN | Artificial neural network |
| AoI | Angle of incidence (AoI) |
| bgl | Below ground level |
| bhp | Brake horsepower |
| BLDC | Brushless DC |
| Gpm | Gallons per minute |
| IMD | Induction motor drive |
| INC | Incremental conductance |
| MPP | Maximum power point |
| MPPT | Maximum power point tracking |
| P& | Perturb and observe |
| PSC | Partial shading condition |
| PMSM | Permanent magnet synchronous motor |
| PV | Photovoltaic |
| RMSE | Root mean square error |
| SEPIC | Single ended primary inductor converter |
| SPV | Solar photovoltaic |
| SPVWPS | Solar photovoltaic water pumping system |
| THD | Total Dynamic Head |
| VSI | Voltage source inverter |
| Whp | Water horsepower |
The non-renewable sources of energy, like coal, oil and gas become expensive due to global raise in energy demand. The use of fossil fuels has a negative impact on the atmosphere and globally 37.5% of CO2 emissions occurs each year due to fossil fuels in electric power production [1]. Solar energy is one of the pollution free energy resource and earth receives about 1.8 ∗ 1011 MW solar power [2]. The solar energy has an added advantage that it has the ability to be transformed into electrical energy by photovoltaic energy systems. The PV has significant features like noise less operation, maintenance free, less in weight and simple in structure [3]. The PV standalone system can be implemented in remote areas and it is used in agricultural water pumping, heating, air-conditioning and lighting, etc [4].
The open circuit voltage method, short circuit current method, P&O method, INC method, ANN, and fuzzy techniques are all MPPT techniques that are used to track MPP. The open circuit voltage method and short circuit current are simple but needs periodic load shedding and the ANN approach increases the complexity. The INC and P&O techniques are linear techniques that are low-cost to implement and have a quick convergence speed [5]. Selection of suitable DC–DC converter with less voltage ripple in its output is also an important factor to improve overall performance of PV system. For water-pumping applications, various electrical drives are used in the past. Conventional MPPT techniques are ineffective to mitigate partial shading effects in PV arrays.
The DC motors needs frequent maintenance due to the presence of brush and commutator and because of that ac motors more preferable. In AC motors, an induction motor is an extensively used machine because of their robustness, less cost and low maintenance. However, the features like compact design, high efficiency, good dynamic response, high torque-to-inertia ratio, high air gap flux density, and good power factor associated with energy efficient motors like BLDC motors and permanent magnet synchronous motors make it ideally suitable for water-pumping application [6]. The water flow rate dependents on solar radiation condition and PV array size. A well-designed PV system will give good impact on long term economic aspect as compared to conventional pumping systems. The microgrid is a decentralized power supply system that can be operated in with island mode as well as grid synchronized mode based on the requirement. The objective of the article is to provide the comprehensive study of the SPVWPS system, research status, design aspect and the economic feasibility analysis. The economic feasibility analysis is carried out using Homer Pro software for the geographical location GMR institute of technology campus, Rajam, Srikakulam District, Andhra Pradesh, India.
2 Solar PV Water Pumping System
The SPVWPS has the primary components as Solar PV array, charge controller, pump controller, with or without energy storage battery, inverter, pump/motor and fixed or tracking system. The SPVWPS can broadly be categorized into following types according to their components.
• Depending on energy storage
• Battery integrated
• Direct SPVWPS
• Depending on electrical input power
• DC SPVWPS
• AC SPVWPS
• According to pump types
• Surface mounted type
• Deep well type
• Depending on power tracking
• Tracking SPV panels/arrays
• Fixed SPV panels/arrays
2.2 Research and Current Status of SPVWPS
Filho et al. [7] developed PV pumping system without batteries. To minimize the panel number, a high gain, high efficiency boost converter is used by them to provide regulated voltage to a frequency converter. This is composed of three-phase induction motor and submerged centrifugal pump. The developed open-loop system reveals that the system performance, counting from the exit of the photovoltaic modules, is 6.94% for maximum power extracted from photovoltaic modules. Since the boost and the frequency converter show yields of 92.52% and 95%, respectively, in the same range of power, it was observed that most of the energy dissipated occurs in the motor-pump assembly.
Karbakhsh et al. [8] developed low-cost solar PV energized water pump with the two-switch fly back inverter and employed sensorless MPPT method. For the most efficient use of both the solar PV panel and the electric motor, their control strategy uses a sensorless MPPT algorithm and constant v/f control. They verified the results of a DSP-based solar micro-DC to AC converter of two-switch fly back type for a fractional horsepower WPS.
Rezkallah et al. [9] implemented a novel active power control through improved MPPT algorithm to advance the SPV system performance to standalone water pumping station. The enhanced P&O algorithm is used to attain the MPPT with lesser oscillations. To evaluate the system's power quality and harmonic distortions, an LCL filter with anti-windup proportional resonant controller is used. Mahmoud et al. [10] studied the feasibility and economic aspect of SPVWPS for remote areas of Egypt. They have shown that PV-battery storage based SPVWPS can be employed effectively at East Owienat area. The water unit cost of PV based pumping systems is much lesser than diesel-based pumping system.
Coelho et al. [11] employed an algorithm for detecting MPP and for validating the concept the Buck-Boost, Boost, SEPIC, Cuk, and Zeta converters are analyzed with resistive voltage regulated dc bus. It is observed that the zeta converter may be operated to decrease or increase the voltage output and the boundless region can be obtained because of this feature for MPPT of an SPV array. Zhou et al. [12] designed the PV array model and the array's MPP tracked with INC Method. The simulated and practical results show that the PV model has better tracking performance and dynamic characteristics. Sreewirote et al. [13] planned and built a solar water pump with a battery charger controller. Their research looked at the performance of a solar water pump device in terms of temperature, voltage, and current. The performance analysis has shown the effectiveness of solar water pump in comparison with normally used diesel engine water pump by farmers.
Yousuf et al. [14] developed a three-phase asynchronous motor (induction motor) controller for a SPVWPS. They focused on optimal efficiency techniques to drive an induction motor using three-phase inverter. A three-phase induction motor prototype model has been established by them with 320 W solar panel with a three-phase inverter and cost-effective gate drive circuit. Priyadarshi et al. [15] developed a hybrid ANN fuzzy logic-based control with flower pollination algorithm as a MPPT and employed to amend RMSE of PV modeling. They employed the Luo converter with electronic commutation circuit to drive BLDC motor. It is observed that Luo converter has better voltage gain transfer, high power density and can track the optimal power from SPV modules.
Zhao et al. [16] discussed that performance ratio is a significant parameter of assessing the efficiency and quality of SPVWPS, that to be forecasted properly to offer supervision for regulating the loss assessments of each part. They developed a performance ratio prediction model using grey clustering and a curvelet neural network, and they examined the performance ratio as well as other primary factors that influence SPVWPS performance.
Sharma et al. [17] have developed a compact grid interfaced unidirectional SPVWPS without inductive transformer element. The variable v/f-based control system is used to control the induction motor using VSI, and INC based MPPT control is implemented. The overall efficiency of the developed system by them can be calculated as, ηsystem = ηMPPT × ηIM × ηpump. The efficiency of the system is ηsystem = 0.98 × 0.8 × 0.75 = 0.588. It is observed that the efficiency of the system can be enhanced by employing higher efficiency (IE4 class) motors.
Kumar et al. [18] proposed a BLDC motor drive for SPVWPS that is cost-effective, simple, and energy efficient. A zeta converter is used to extract the maximum power from the PV array. The control algorithm eliminates phase current sensors and adapts a fundamental frequency switching of VSI without supplementary control circuit to prevent power losses induced by high switching frequency. The BLDC motor is soft-started using an INC-based MPPT algorithm with a zeta converter, and the SPVWPS is designed and modelled under dynamic conditions. At a typical solar insolation level of 1000 W/m2, the system has an efficiency of 83% whereas it is 71% even at 400 W/m2. The zeta converter is losing its significance in terms of unbounded MPPT region and pulsating input current. The instantaneous conductance is equivalent to the INC of a PV array as a result the INC approach becomes more complex and computationally intensive.
Kumar et al. [19] developed another system that has single stage SPV energy feeding a BLDC motor-pump with INC-MPPT technique adopted for optimal operation of solar PV array. The proposed control method by them eliminates phase current sensors. There are no additional controls for speed control or soft start on this machine. The optimal power of the SPV array controls the motor speed. The PV array output power is reduced under partial shading conditions. The BLDC motor provides a better water delivery even at low electrical power.
Mudlapur et al. [20] addresses the partial shading issues on PV fed induction motor SPVWPS. The PV panels feed the input to a boost converter, which uses a duty ratio to track the maximum power from the PV panels. The overall system efficiency is low. The effect of solar radiation [21] and total head on water output of SPVWPS can be analyzed with the optimized PV array configuration. The various algorithms stated above that provides the good performance, because they work on the maximum value theory. However, they suffer on oscillations near MPP and also modified control techniques are facing complexity in implementation. The economic feasibility analysis must be carried out before the implementation of the project to identify their suitability with geographical location.
2.3 Importance of the Economic Feasibility Analysis
Large IMDs and power converters linked to the distribution network causes power quality degradation. Due to the existence of large IMDs, power quality is low in industries, households, and commercial establishments. Apart from massive IMDs, voltage distortion in utilities and unbalancing operations impact negatively on the distribution system's power quality [22]. The solar PV technology can be employed in a broader context for an ecologically a good substitute for diesel and electricity (based on fossil fuels) powered water pumps [23,24]. SPVWPS can be installed where the grid connectivity is not accessible and the access to fossil fuels is not possible due to inadequate transportation infrastructure. Furthermore, the use of SPVWPS is the more suitable choice because of natural bond between the accessibility of solar power and requirement of water.
Synchronization and Integration of various components to form SPVWPS faces difficulty in its operation which results in poor overall efficiency. The interdisciplinary technical expertise is required for its maintenance and operation. Economic feasibility analysis is required to provide the net benefit in long term aspect even though the system is technically well developed. The solar energy data is required to know the suitability of the SPVWPS of respective areas. The dynamic software HOMER Pro is having the data of renewable energy sources that assists us in determining the most cost-effective approach and risk-mitigation methods.
The Fig. 1 shows the general block diagram of the SPVWPS. Solar energy is converted into electricity by the photovoltaic array, which is used to power the motor pump set. The system can be used to pump water from the open well, bore well, pond, etc. and installation requires a shadow-free area. The MPPT is performed by DC–DC converter [25]. To power the motor, phase currents and DC bus voltage will be sensed, and pulse width modulated pulses will control the VSI.
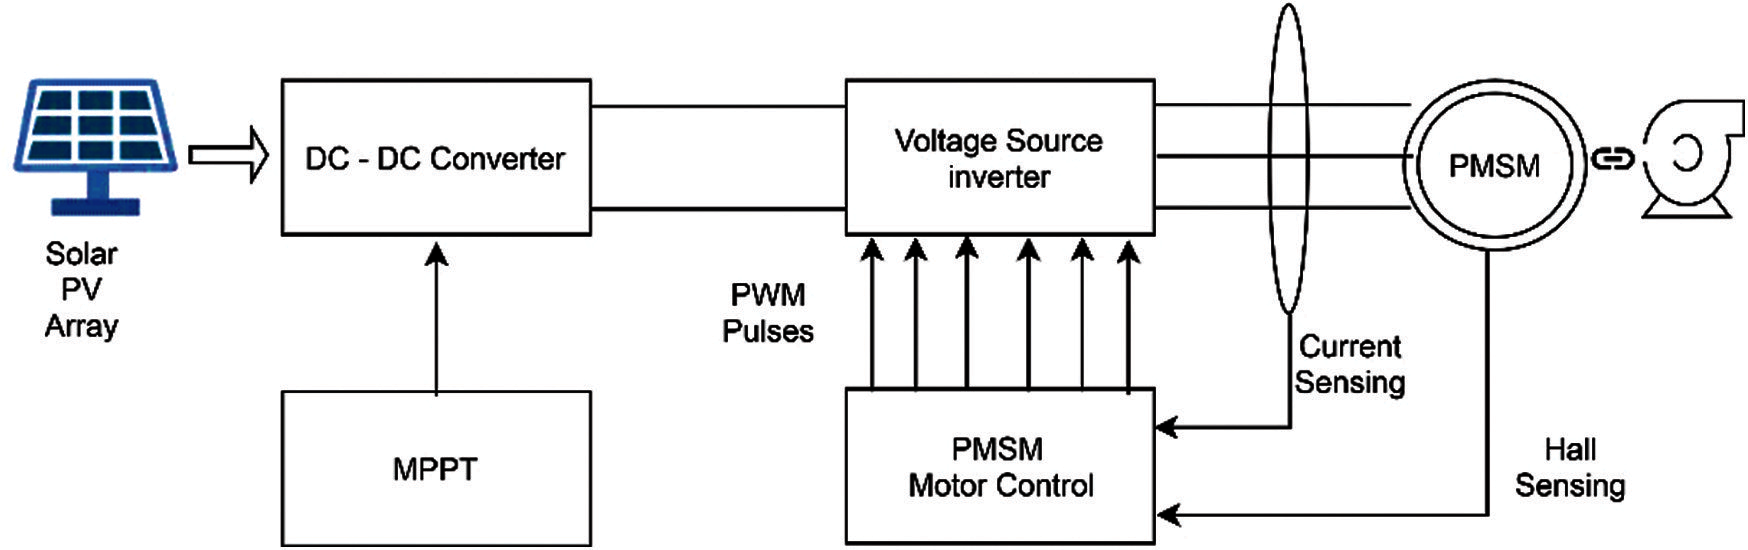
Figure 1: Block diagram of SPVWPS
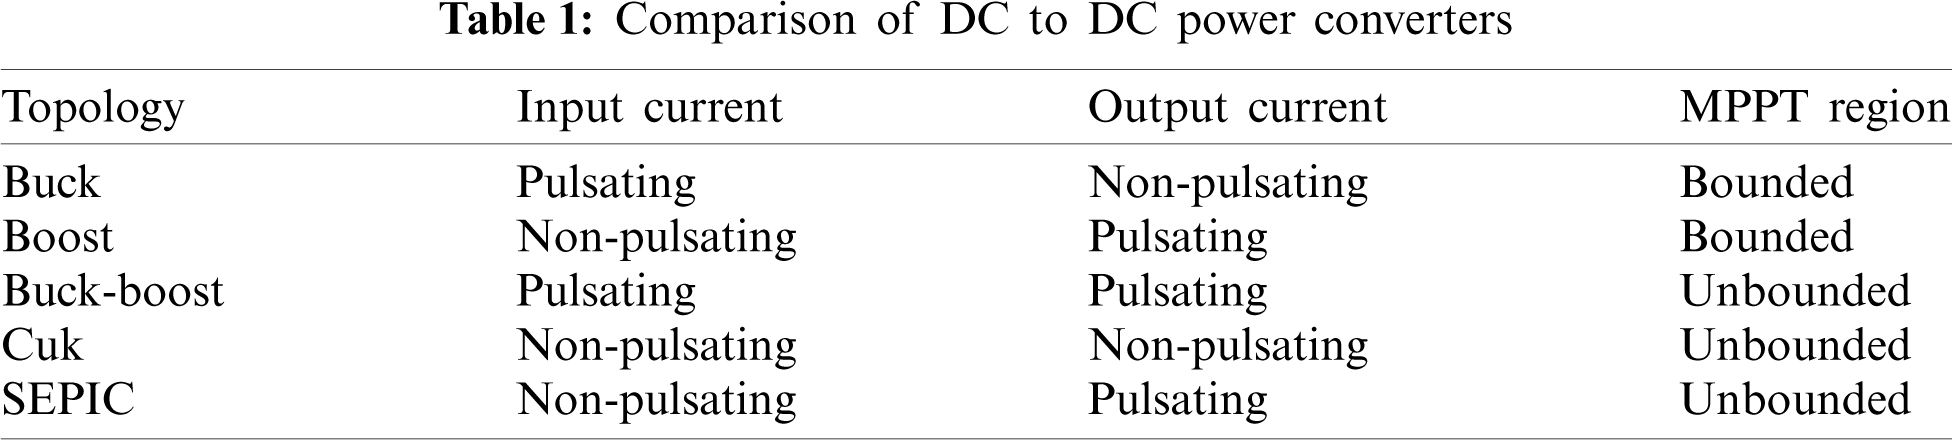
The selection of appropriate DC–DC converter plays significant role of an optimum performance of SPVWPS. Isolated DC–DC converters are chosen in general to prevent conduction losses caused by energy conversion from primary to secondary winding. Tab. 1 compares different DC to DC converters, including Buck, Boost, Buck-Boost, Cuk, and SEPIC converters [26–28] in terms of MPPT operating region, input and output currents quality. Hall sensors are needed to produce gating pulses for electronic commutation to energy-efficient synchronous motors such as BLDC or PMSM.
VSI with 120° conduction is used to energise the windings in a sequential manner. The 120° conduction mode in VSI is preferred to avoid direct short circuiting of DC source due to sufficient commutation interval in comparison with 180° conduction mode. The SPV array MPP is planned to control by INC or P&O or other suitable MPPT techniques to function at maximum power by regulating duty cycle. The system is planned to address the variation of solar irradiance and partial shading issues that affect the performance of SPVWPS with the help of Boost and Cuk converter.
Control Strategy
SPV array output power control using appropriate MPPT technique and electronic commutation circuit for energy efficient synchronous motor are the two parts of the control system. These controls methods are described below.
MPP tracking
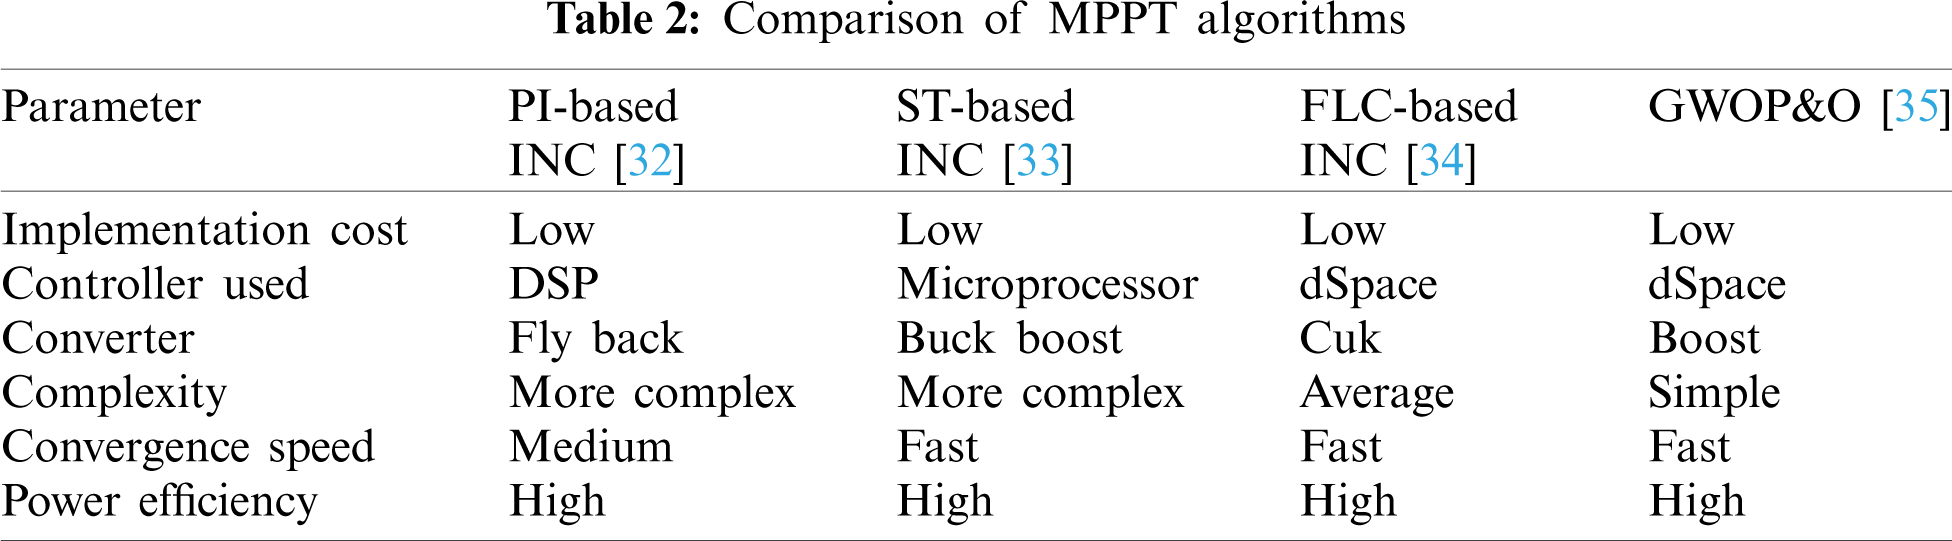
The MPP tracking algorithms such as P&O [29] INC [30] and ABC-P&O algorithm [31] or other optimization algorithms helps to attain maximum power in DC–DC converter. The P&O, INC and ABC-PO algorithm flow chart is shown in Figs. 2 and 3. The efficient DC–DC converter will help to advance the overall efficiency of the SPVWPS. The Cuk converter design procedure is explained with this article. The voltage control of the PMSM motor will be depending only on Cuk converter. Tab. 2 shows the comparison of photovoltaic power-increment (PI) -Aided INC MPPT [32] with two-phased tracking, solar tracker (ST) based MPPT [33], fuzzy logic control (FLC) based control [34] and grey wolf optimization (GWO) based P&O MPPT Algorithm [35] for a PV System.
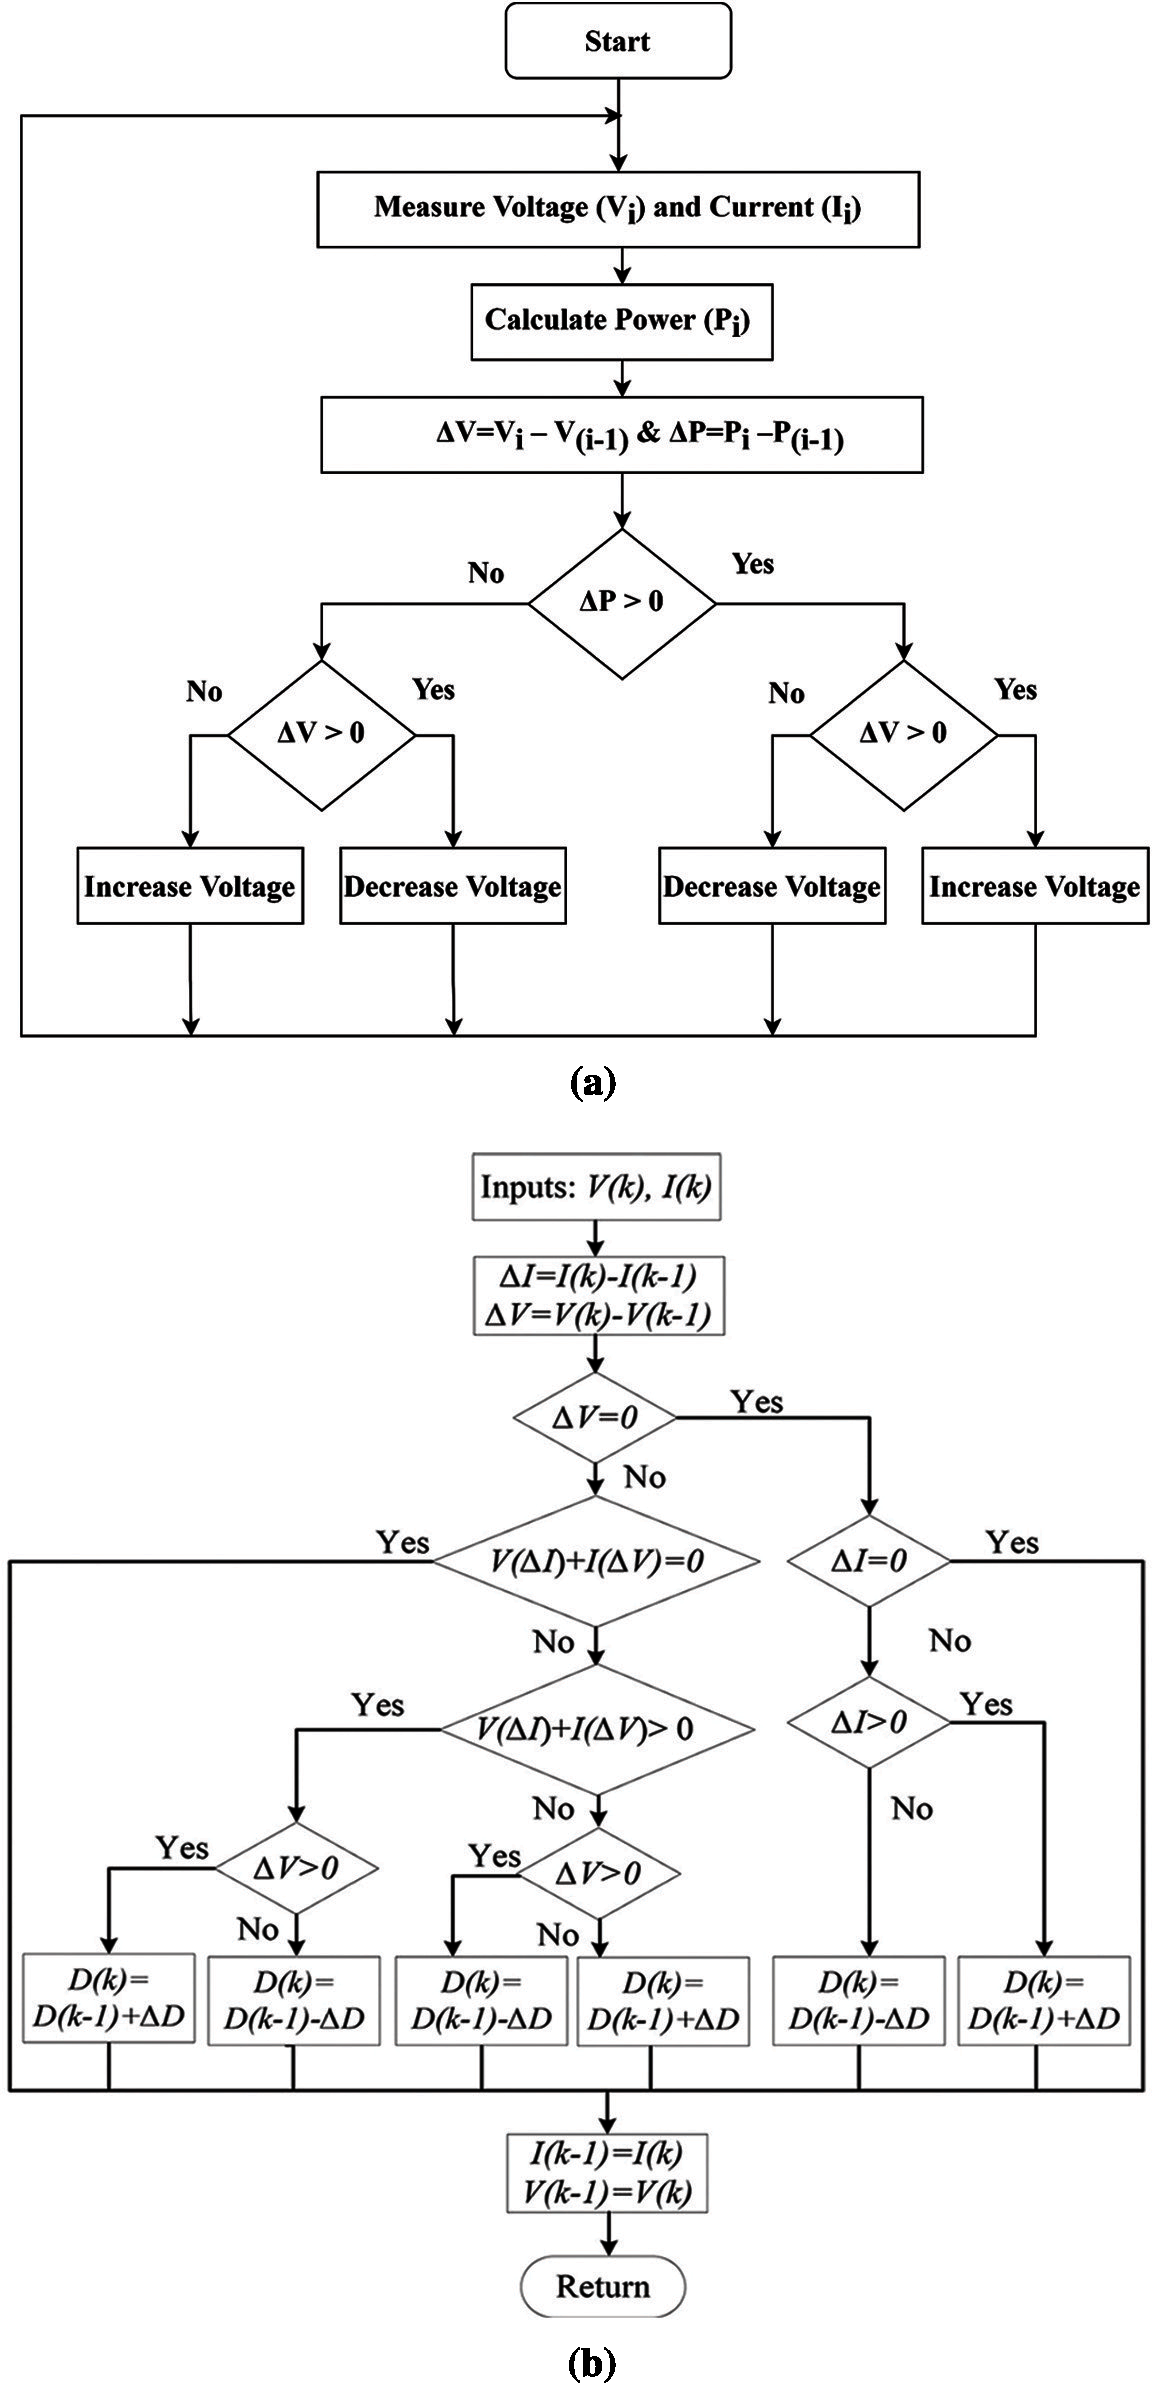
Figure 2: Flow chart of (a) P&O Algorithm (b) INC Algorithm [29,30]
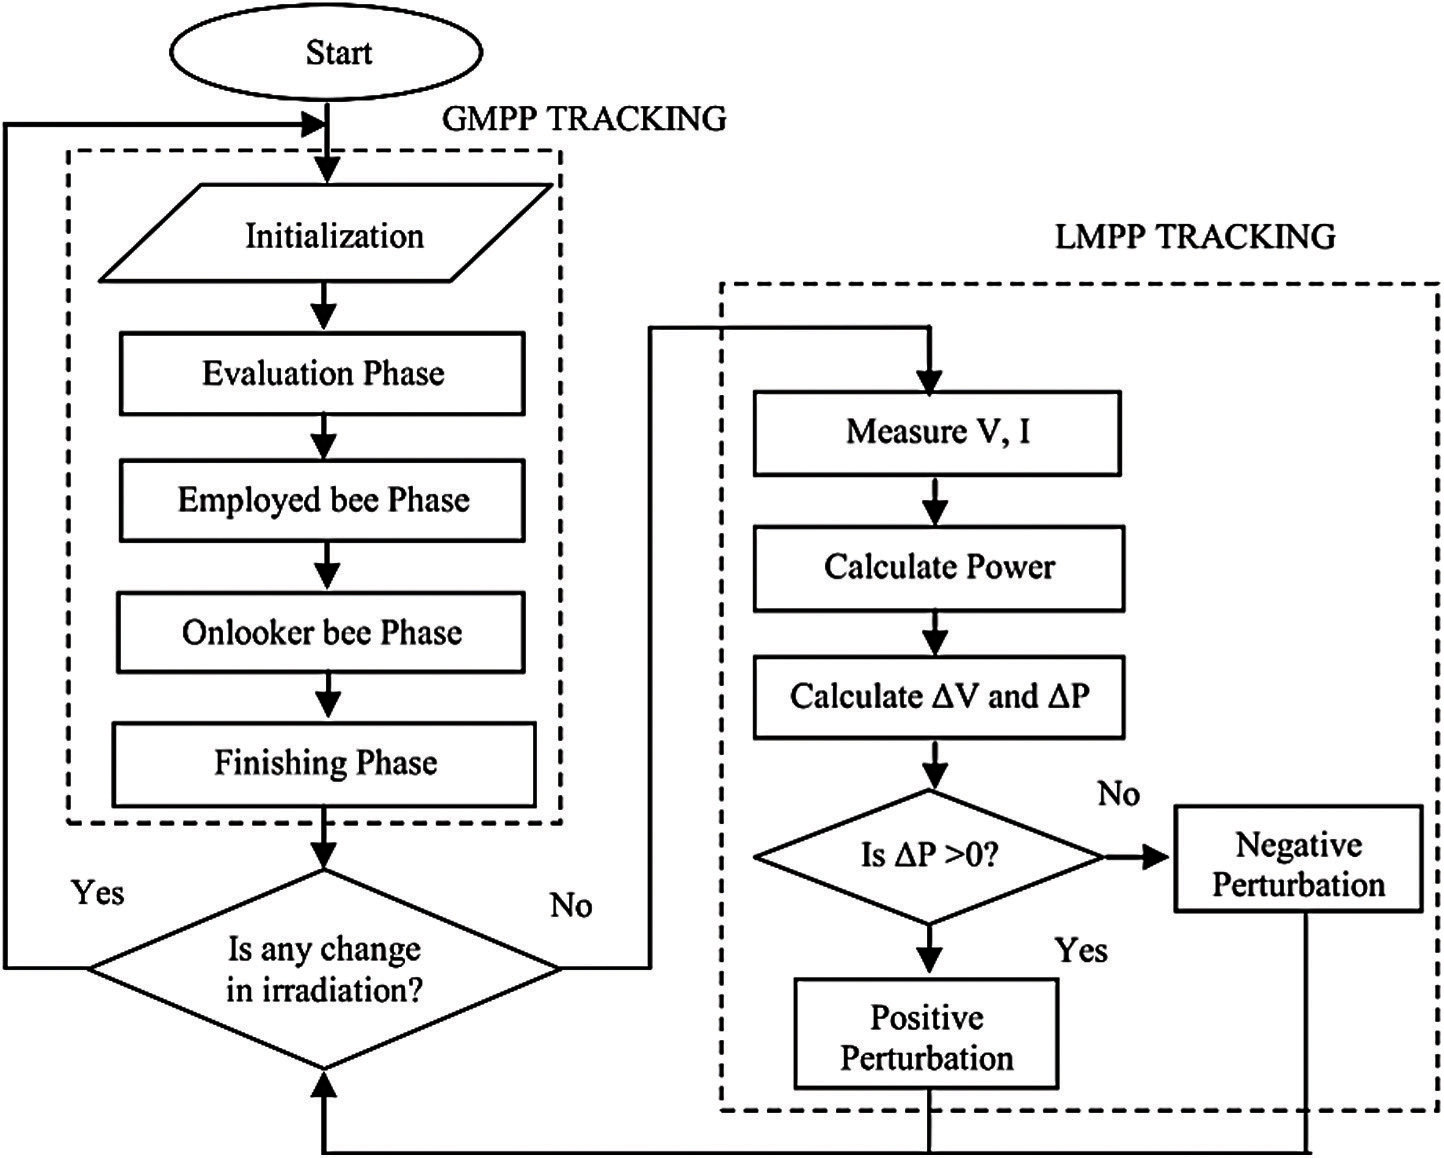
Figure 3: Flowchart of ABC-PO Algorithm [31]
Commutation in PMSM Motor
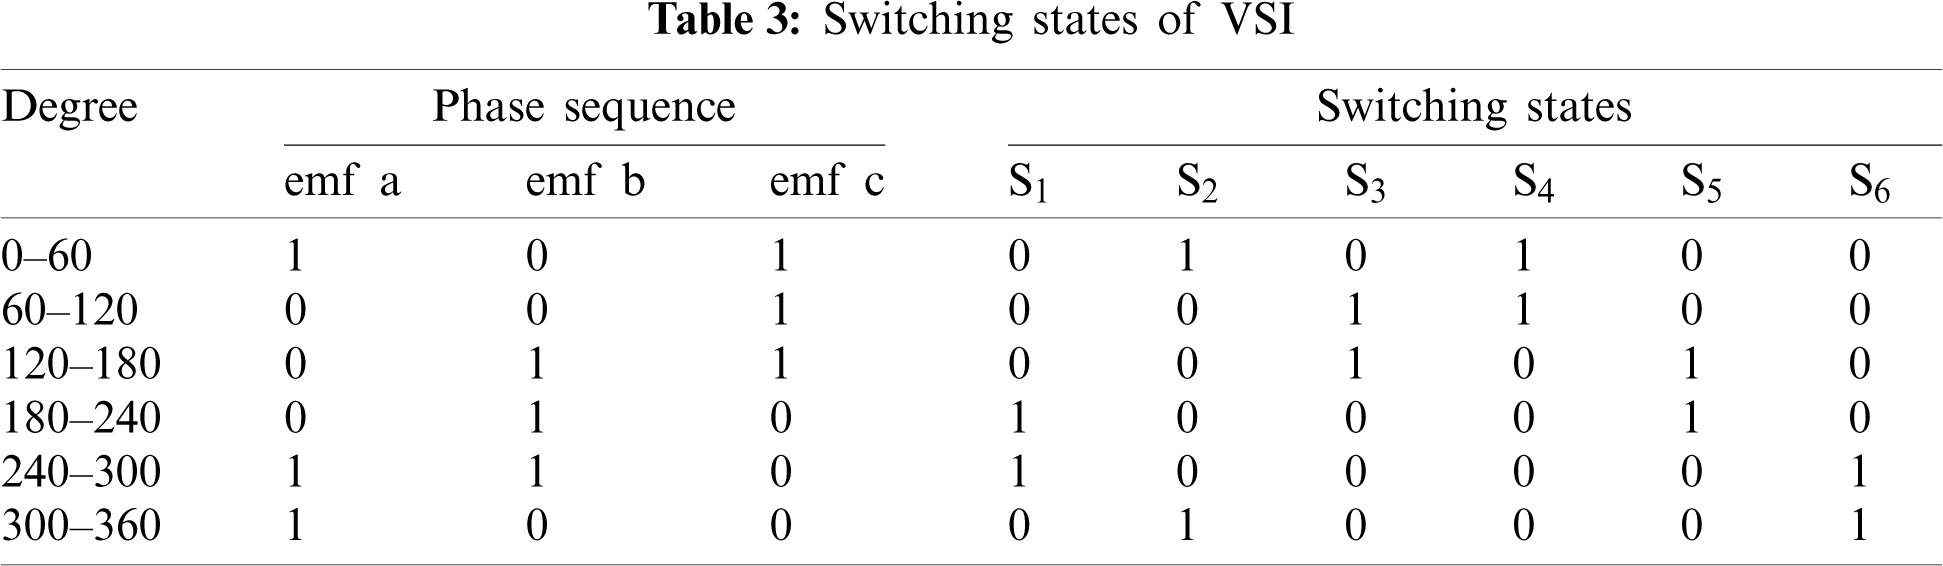
The replacement of induction motor with energy efficient synchronous motors will improve the system efficiency. The electronic commutation circuit is shown in Fig. 4 to explain the operation. The DC symmetrical current is drawn from the DC link and fed to VSI with 120° conduction. The inbuilt hall sensors in PMSM motor will generate the hall signals (h1–h3) with respect to rotor position at 60° intervals that are decoded to get the phase sequence. Tab. 3 shows the VSI switching states. At any given time, one step is low and the other two are high. PMSM has an advantage over DC motors due to the electronic commutation, which eliminates brushes and commutator segments.
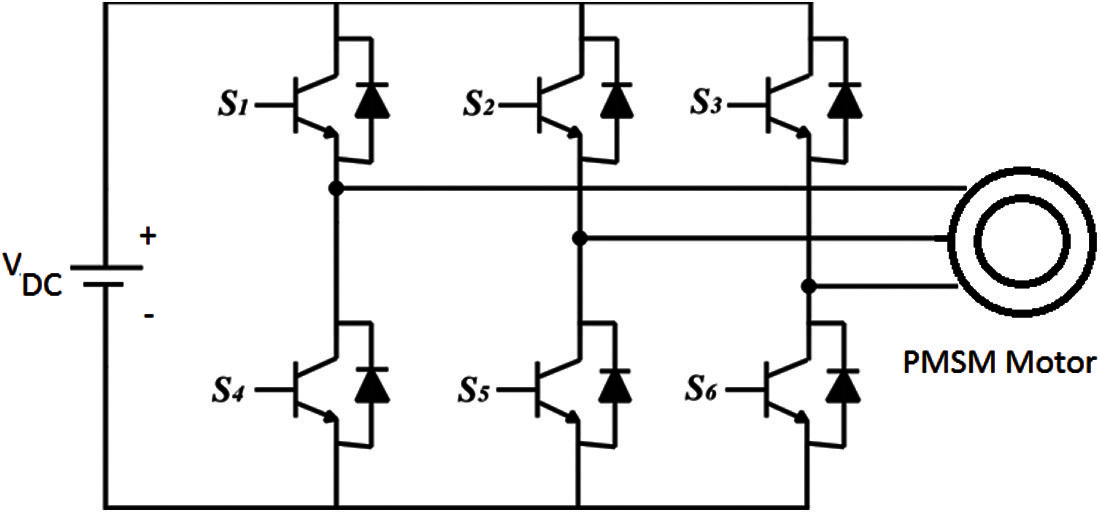
Figure 4: Three phase VSI fed PMSM
Design of Cuk Converter
The Cuk converter is shown in Fig. 5.
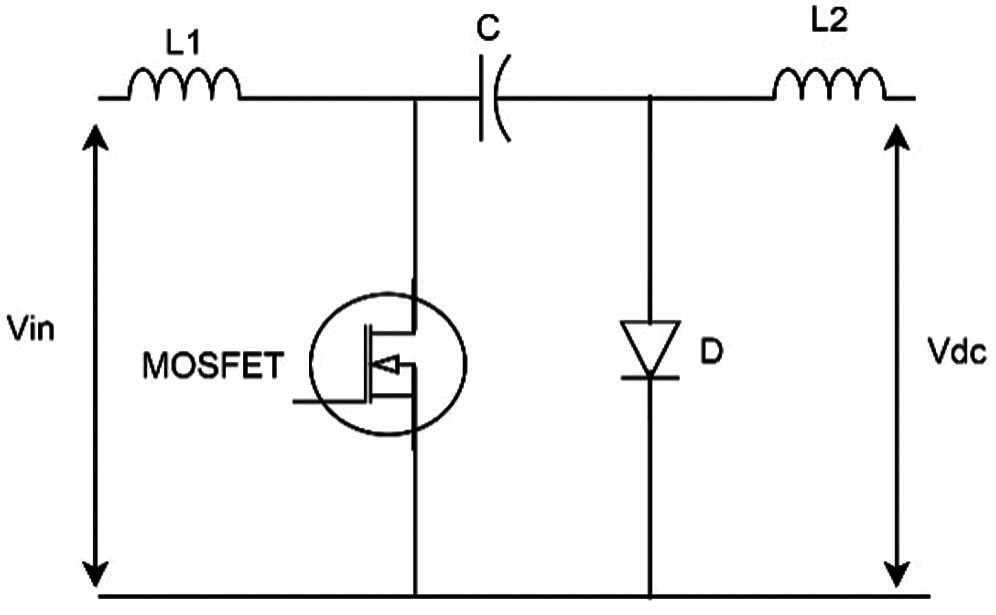
Figure 5: Cuk converter
The duty cycle (D) is estimated with the following formula:
where,
The capacitance C1, inductance L1, and L2 design parameters of the Cuk converter are written as
where,
where,
where, ΔIL2 = 8% of ripple current through L2.
Experimental Validation
The signal conditioning and control architecture for experimental validation diagram is shown in Fig. 6. The experimental validation can be done with the hardware prototype and it requires solar array simulator, DC–DC converter, VSI, dSPACE controller, PMSM Motor and DC generator. The part of hardware prototype can be developed by utilizing dSPACE 1103 controller, 1.2 HP PMSM Motor and intelligent power module (Electronic Commutation). The PV voltage and PV current can be obtained from solar array simulator. The PMSM will be loaded with a DC generator feeding a resistive load. The power of a DC generator feeding a resistive load is proportional to the square of the speed, just like a centrifugal pump (characteristics). In addition to this the prediction methodologies [36] or classification methods [37] using artificial intelligence may help to forecast the solar PV generation or to classify the power quality issues, respectively.
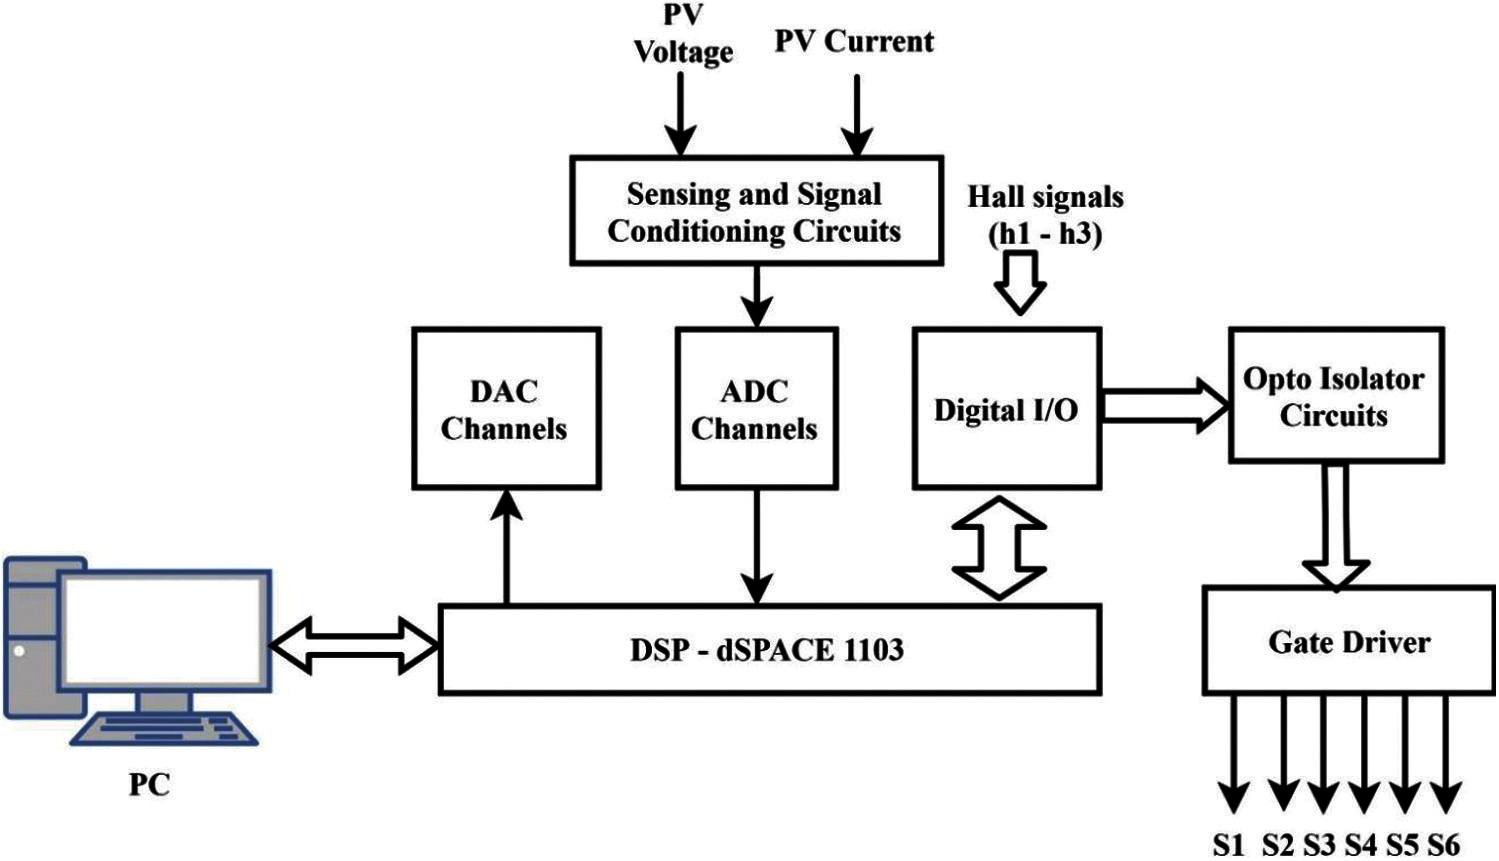
Figure 6: Signal conditioning and control architecture
The current and voltage sensors provide analogue signals and these are converted into digital signals using ADC available with dSPACE1103. To carry out the electronic commutation, the hall signals will be directly transmitted via digital I/O pins. The performance of the system can be done based on dynamic conditions. The solar PV voltage, PV current and Power of PV with its duty ratio, DC–DC converter voltage, current through energy storage elements, the stator phase currents and speed parameters for VSI conversion efficiency are considered as PV array performance parameters.
3 Economic Feasibility Analysis
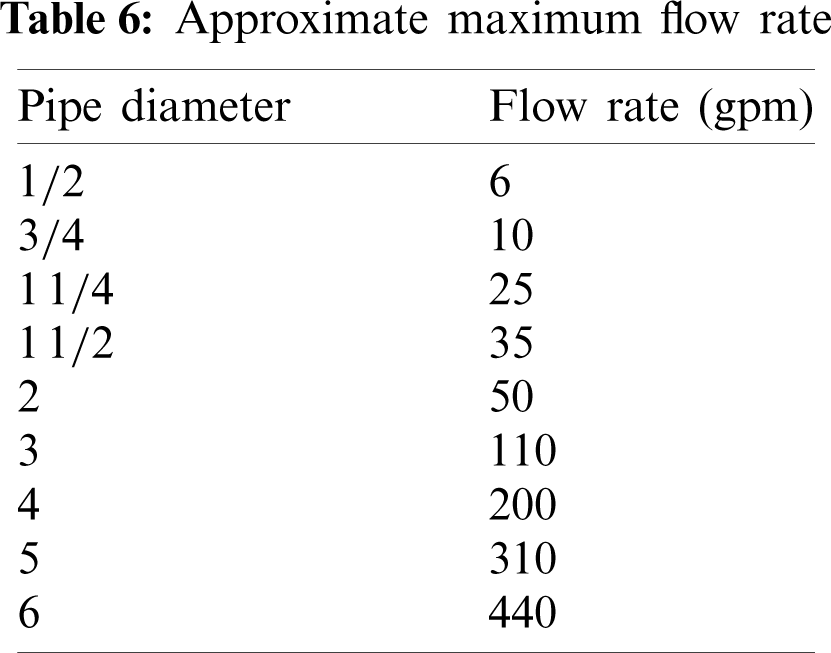
The economic feasibility analysis is done using Homer Pro software and it is useful to determine the least-cost solution and most effective risk-mitigation strategies. The selected geographical location is Rajam, Andhra Pradesh, India. The ground water level as per the report of ground water scenario in India published by Central ground water board India [38], In the state of Andhra Pradesh, during Pre-monsoon 2018, the general ground water level scenario ranges from 2–10 m bgl. As per the ground water yearbook 2019–2020, Andhra Pradesh State [39] Srikakulam district has the range 1.7–9.8 m bgl. It is decided to set the underground water level as 12.81 m with 30.7% raise in the maximum value and the storage tank height as 2 m. It is decided to install 4” size pipe that could deliver 200 gpm. One 45-degree elbow will be used in the system that has friction loss of 5 feet. The bhp requirement as per the pump design is 3.31.
3.2 Estimation of Total Dynamic Head
The cumulative load on the pumping plant is referred to as TDH and usually expressed in feet. The following Eq. (5) can be used to measure TDH: The operating pressure and elevation change are not taken into account in this estimate.
The cumulative vertical distance that a pump raises water is measured by its static head. When water flows through the rough walls of a pipe, friction occurs, resulting in a loss of pressure. Friction losses can also occur as water passes through pipe fittings or when the diameter of the pipe changes abruptly. The extracted table of [40] is shown in Tabs. 4 and 5 to assess the friction loss on 4” internal diameter pipe.
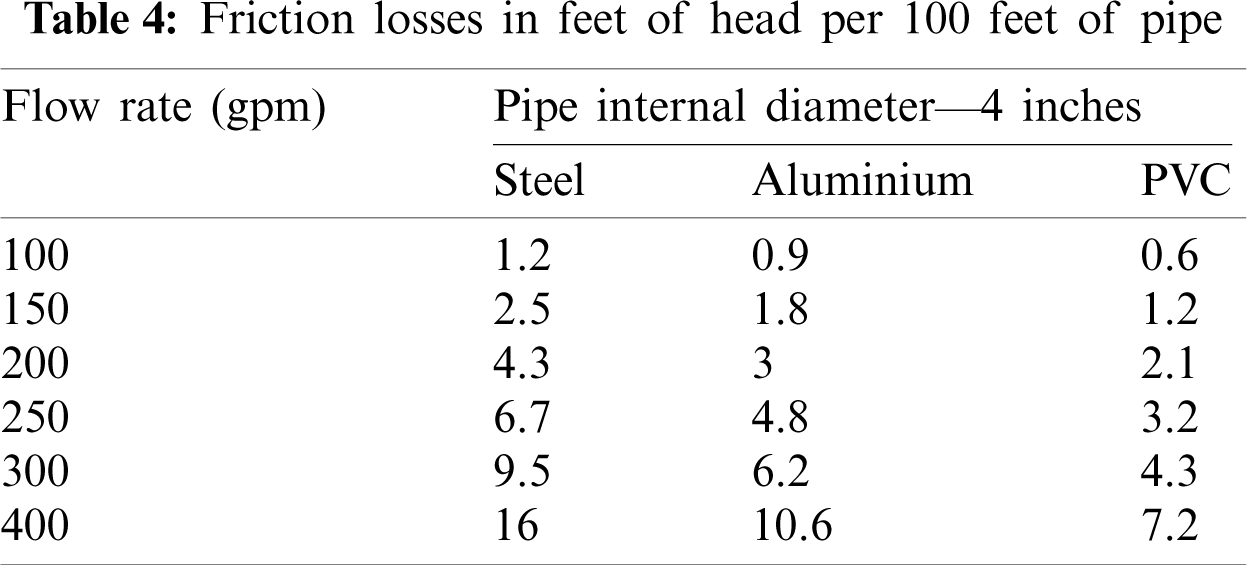
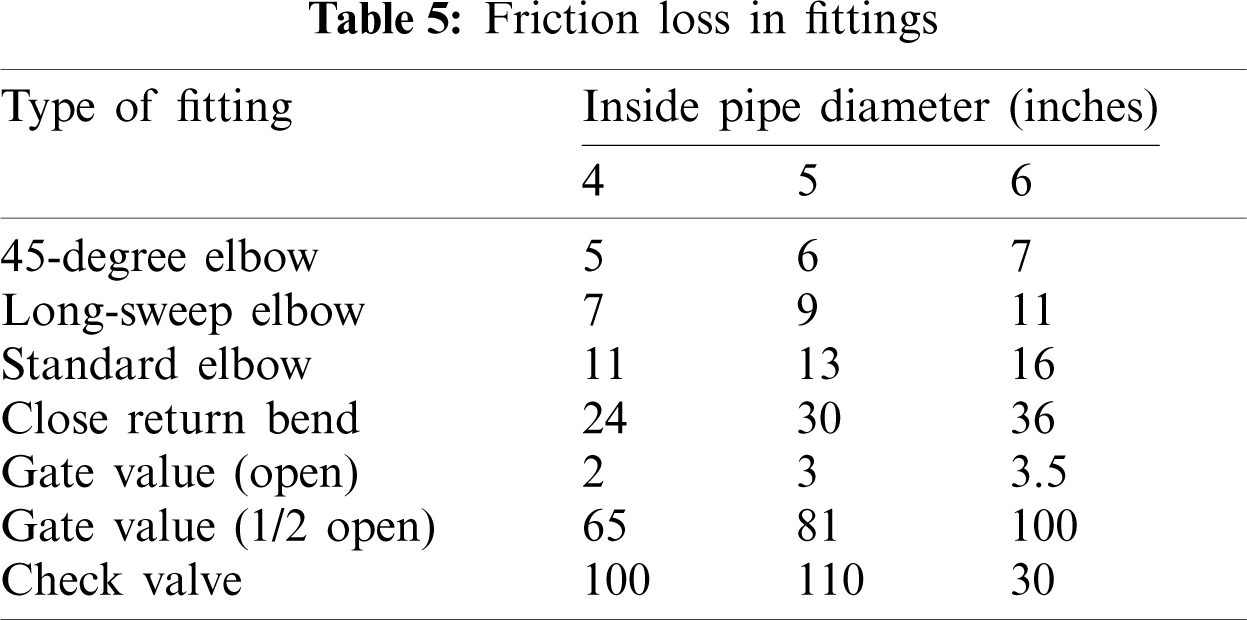
Tab. 3 shows the friction loss in feet for 4” diameter pipe based on the type of material. The PVC material has less friction loss compared to other pipe material. Tab. 4 shows the friction loss due to the fittings in the structure of water pump.
In the present system, the static head is assumed as 14.81 m or 48.58 feet (1 m = 3.28084 ft) and the friction loss is estimated for 4” pipe inner diameter with PVC material and one 45-degree elbow is used.
The TDH of the system is calculates as
TDH = static head + friction loss
= (14.81 ∗ 3.28084) + (2.1 + 5)
= 55.7 ft
Horsepower is a unit of measurement for the amount of energy used to complete a task. We need to know the following to figure out how much horsepower is used to pump water: pumping rate in gpm and TDH in feet.
Water horsepower (whp) is the theoretical power needed to pump water and is measured as follows:
Tab. 6. shows the flow rate in various pipe sizes to maintain a velocity of less than or equal to 5 feet per second. For 4” diameter pipe the maximum flow rate is 200 gpm.
Since no system or unit is completely effective, the power unit's horsepower output must be greater than that measured using Eq. (6). This horsepower, also known as brake horsepower (bhp), is measured using the following Eq. (7):
The present system design has
3.4 Economic Analysis of SPVWPS
The system is presently utilizing the electric grid and the electricity tariff is assumed as 0.067 $ or
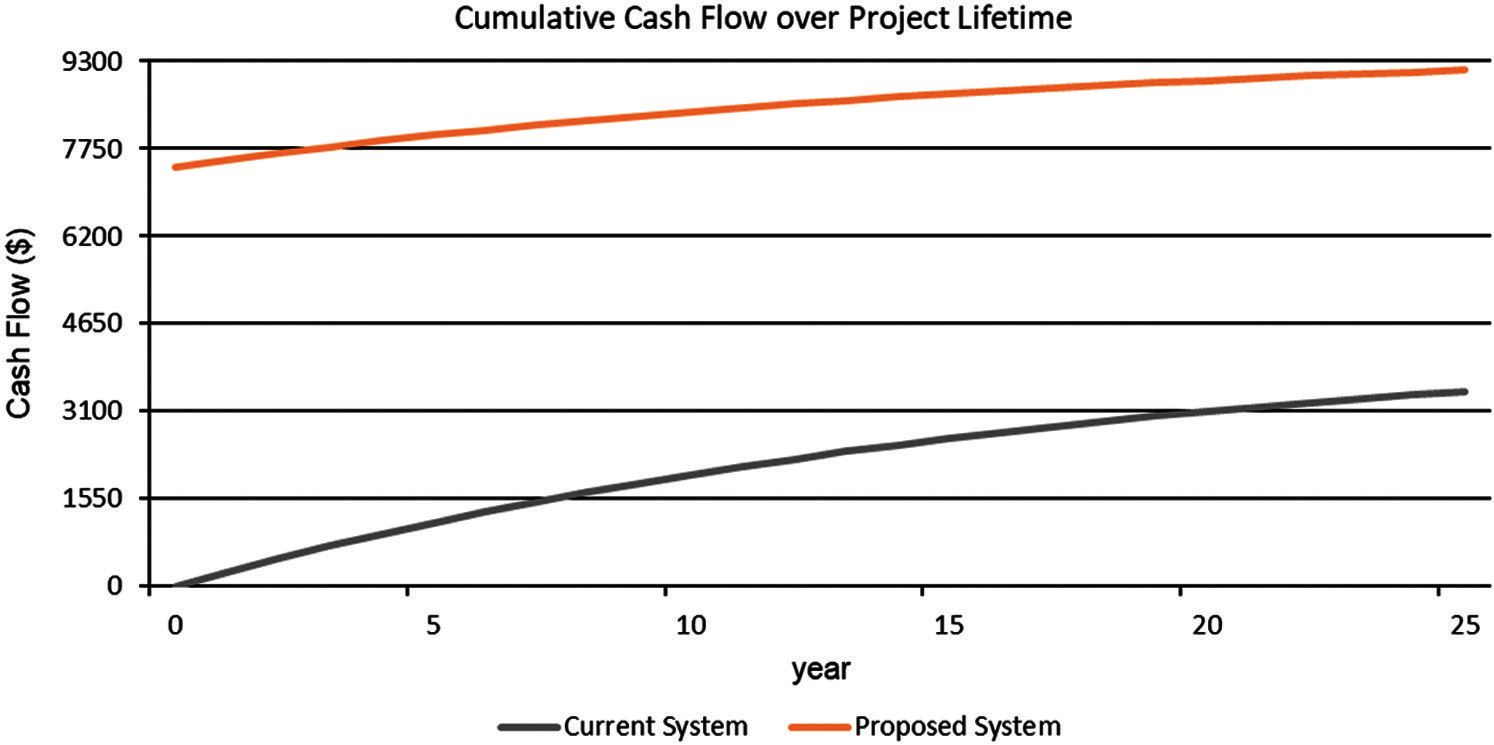
Figure 7: Cumulative cash flow over project lifetime
The Fig. 8 shows the Solar PV power output of the proposed system. The Homer Pro software has inbuilt solar irradiance data and it is used for further analysis. The proposed system is planned to operate the pump from 6 AM to 6 PM. This microgrid requires 16 kWh/day and has a peak of 2.436 kW. In the proposed system, the Fig. 9 shows generation sources serve the electrical load. The annual energy purchased from the grid is 1,656 kWh, while the annual energy sold to the grid is 1,682 kWh, as shown in Tab. 8.
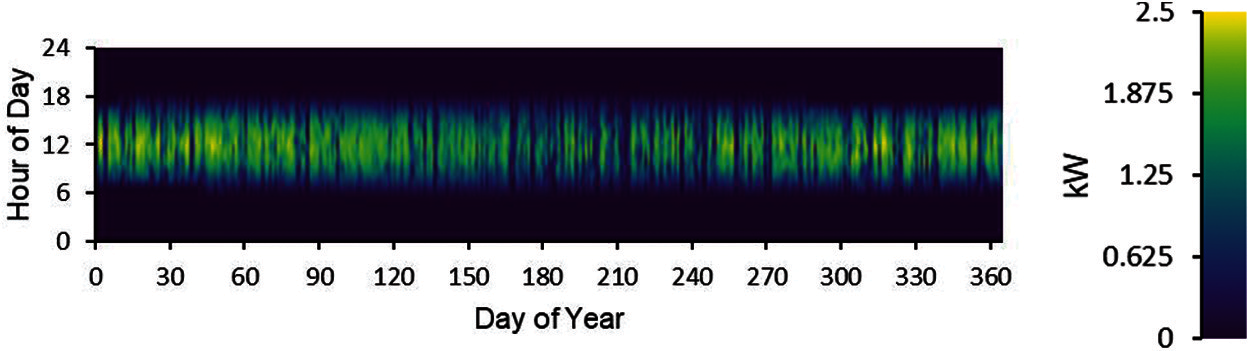
Figure 8: Solar PV power generation
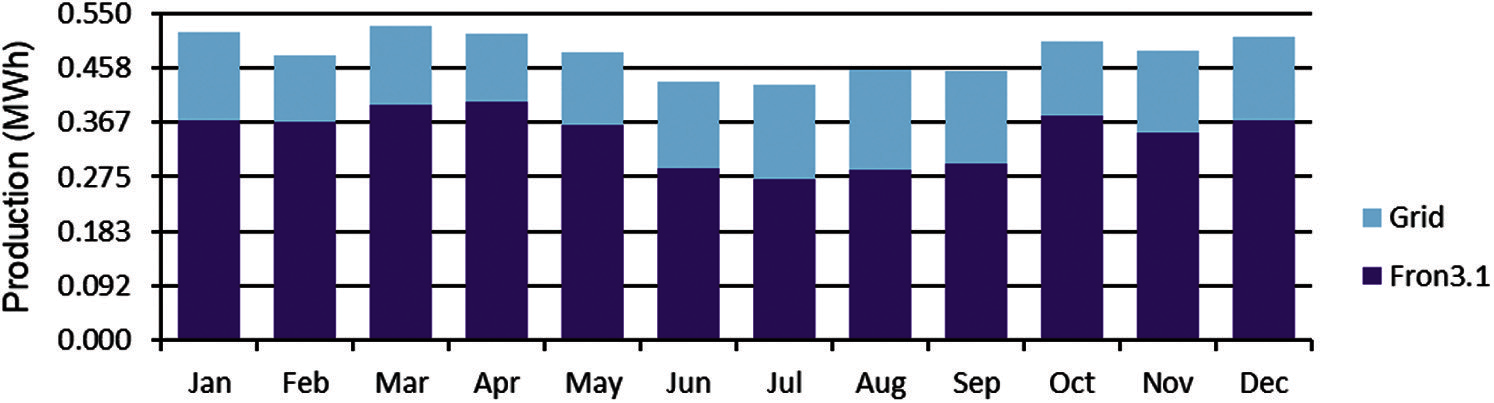
Figure 9: Electric consumption of proposed system
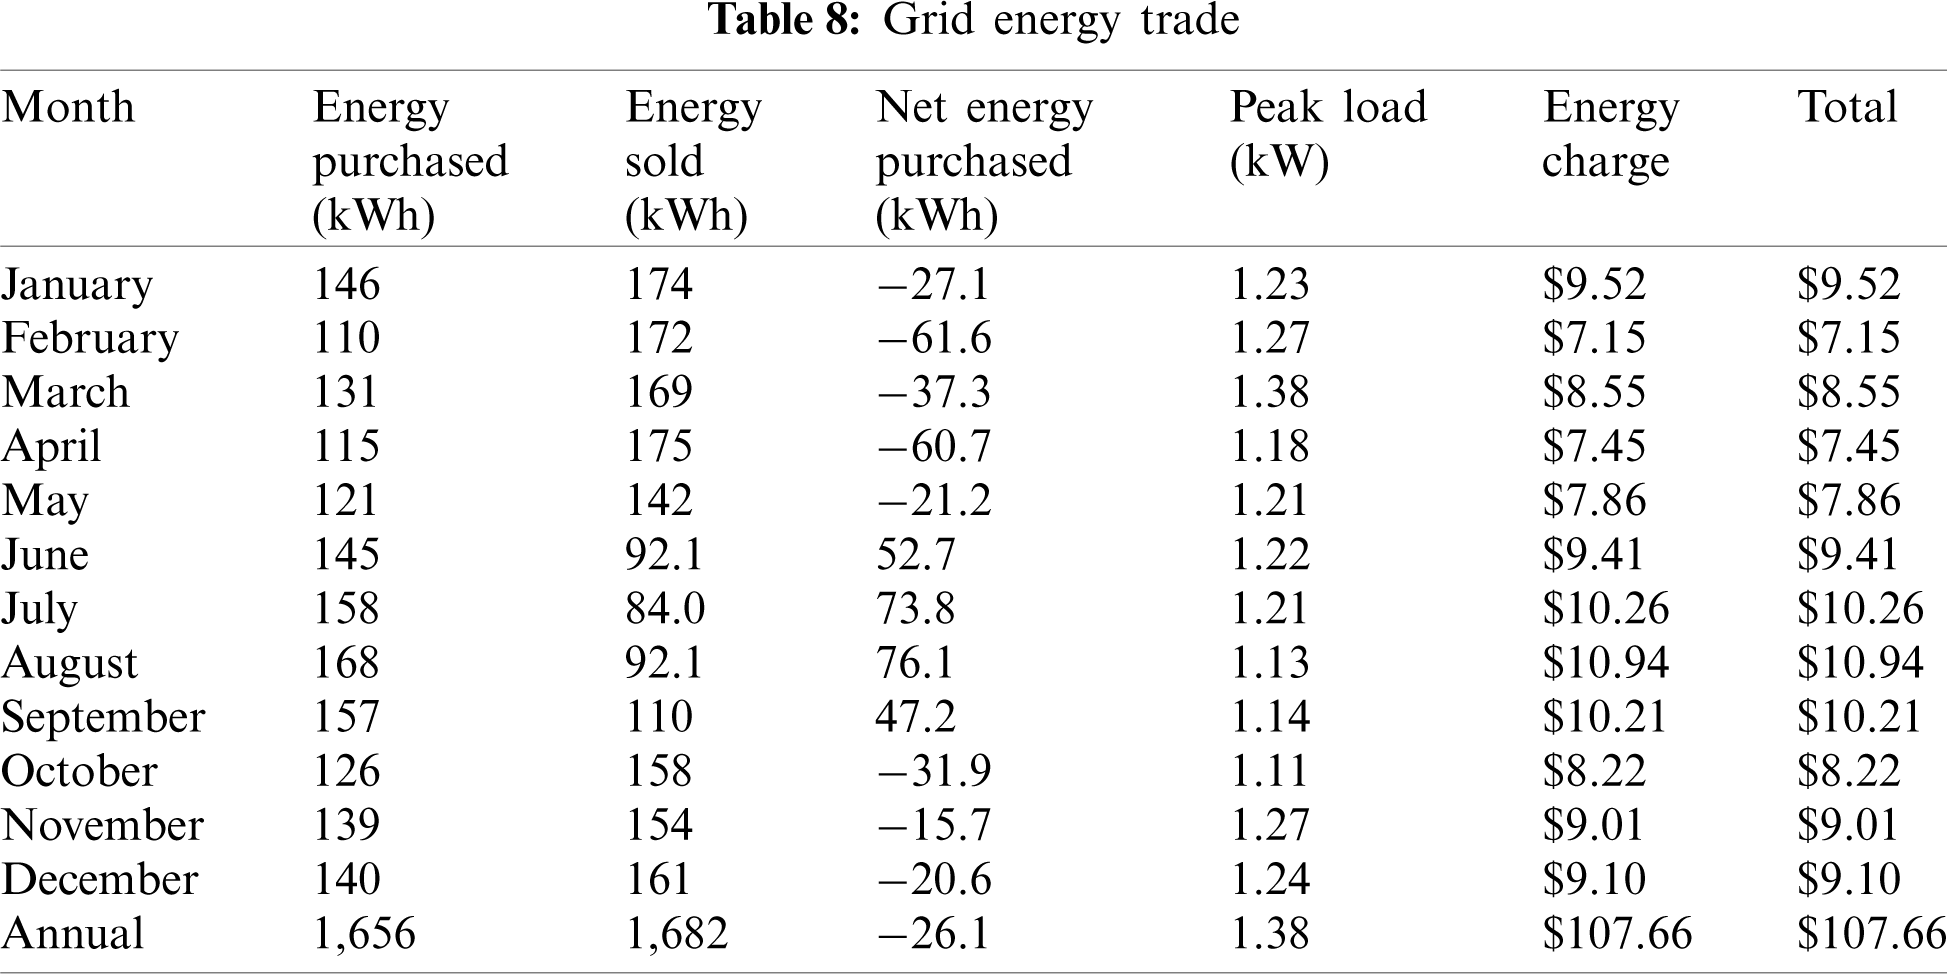
Fig. 10 shows time series chart of the load sharing of electric grid and Solar PV. Based on the observations, the capital investment requirement is $7,425 and annualized savings is $134.93. In the long-term perspective, the return on investment is −2.18% as per the present tariff plan.
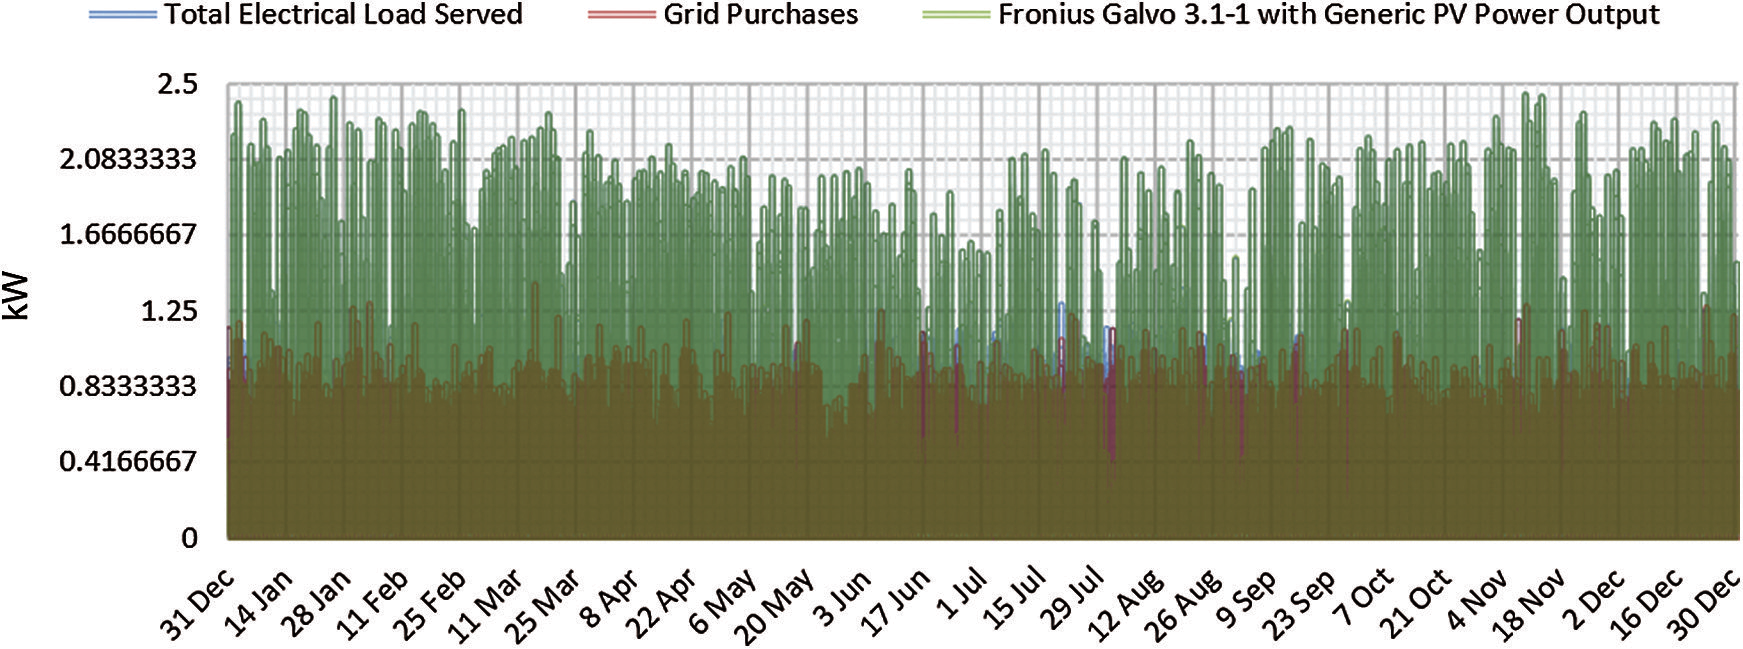
Figure 10: Total electrical load served by grid and solar PV
Based on the comprehensive study, The SPVWPS will help to create CO2 emission free environment. Technically simple, efficient and cost-effective SPVWPS will be helpful where there is no access to the national grid for electricity and there are insufficient transportation facilities to access fossil fuels. Improved MPPT algorithm will obtain multiple MPP occurring during PSC which is a major factor in SPV installed in agricultural premises. The economic feasibility analysis shows that the current system operating costs for energy are currently $267.34 per year using electric grid alone. The proposed system of 2.5 kW of PV with the existing system would reduce the operating costs to $132.41/yr and requires the capital investment requirement is $7,425. The return on investment is −2.18% for the 2 h operating time of the pump. The policy makers may plan to install the solar PV based WPS for attaining the CO2 emission free environment. Also, the fossil fuel cost may rise due to increase in energy demand. In such case the return on investment may also rise in future.
Funding Statement: The authors received no specific funding for this study.
Conflicts of Interest: The authors declare that they have no conflicts of interest to report regarding the present study.
1. Sims, R. E. H., Rogner, H. H., Gregory, K. (2003). Carbon emission and mitigation cost comparisons between fossil fuel, nuclear and renewable energy resources for electricity generation. Energy Policy, 31(13), 1315–1326. DOI 10.1016/S0301-4215(02)00192-1. [Google Scholar] [CrossRef]
2. Singla, V., Garg, V. K. (2013). Modeling of solar photovoltaic module & effect of insolation variation using MATLAB/Simulink. International Journal of Advanced Engineering Technology, 4(3), 5–9. [Google Scholar]
3. Singh, G. K. (2013). Solar power generation by PV (photovoltaic) technology: A review. Energy, 53, 1–13. DOI 10.1016/j.energy.2013.02.057. [Google Scholar] [CrossRef]
4. Kamalapur, G. D., Udaykumar, R. Y. (2011). Rural electrification in India and feasibility of photovoltaic solar home systems. International Journal of Electrical Power & Energy Systems, 33(3), 594–599. DOI 10.1016/j.ijepes.2010.12.014. [Google Scholar] [CrossRef]
5. Reisi, A. R., Moradi, M. H., Jamasb, S. (2013). Classification and comparison of maximum power point tracking techniques for photovoltaic system: A review. Renewable and Sustainable Energy Reviews, 19, 433–443. DOI 10.1016/j.rser.2012.11.052. [Google Scholar] [CrossRef]
6. Brinner, T. R., McCoy, R. H., Kopecky, T. (2014). Induction versus permanent-magnet motors for electric submersible pump field and laboratory comparisons. IEEE Transactions on Industry Applications, 50(1), 174–181. DOI 10.1109/TIA.2013.2288203. [Google Scholar] [CrossRef]
7. Maciel Ferreira Filho, J. R., Freitas Mendes, F. R., Brito Sousa, J. R., Sa Medeiros, C. M., Sousa, I. R. (2018). Photovoltaic panel based pumping system: A solution without batteries. IEEE Latin America Transactions, 16(2), 514–520. DOI 10.1109/TLA.2018.8327407. [Google Scholar] [CrossRef]
8. Karbakhsh, F., Amiri, M., Abootorabi Zarchi, H. (2017). Two-switch flyback inverter employing a current sensorless MPPT and scalar control for low cost solar powered pumps. IET Renewable Power Generation, 11(5), 669–677. DOI 10.1049/iet-rpg.2016.0631. [Google Scholar] [CrossRef]
9. Rezkallah, M., Chandra, A., Tremblay, M., Ibrahim, H. (2019). Experimental implementation of an APC with enhanced MPPT for standalone solar photovoltaic based water pumping station. IEEE Transactions on Sustainable Energy, 10(1), 181–191. DOI 10.1109/TSTE.2018.2829213. [Google Scholar] [CrossRef]
10. Mahmoud, E., Nather, H. E. (2003). Renewable energy and sustainable developments in Egypt: Photovoltaic water pumping in remote areas. Applied Energy, 74(1,2), 141–147. DOI 10.1016/S0306-2619(02)00140-X. [Google Scholar] [CrossRef]
11. Coelho, R. F., dos Santos, W. M., Martins, D. C. (2012). Influence of power converters on PV maximum power point tracking efficiency. 10th IEEE/IAS International Conference on Industry Applications, pp. 1–8. Fortaleza. [Google Scholar]
12. Zhou, X. S., Song, D. C., Ma, Y. J., Cheng, D. S. (2010). The simulation and design for MPPT of PV system based on incremental conductance method. 2010 WASE International Conference on Information Engineering, pp. 314–317. Beidaihe, Hebei. [Google Scholar]
13. Sreewirote, B., Leelajindakrairerk, M. (2016). Design and development of solar water pump. 19th International Conference on Electrical Machines and Systems (ICEMSpp. 1–5. Chiba. [Google Scholar]
14. Yousuf, N. B., Salim, K. M., Haider, R., Alam, M. R., Zia, F. B. (2012). Development of a three-phase induction motor controller for solar powered water pump. 2nd International Conference on the Developments in Renewable Energy Technology (ICDRET 2012pp. 1–5. Dhaka. [Google Scholar]
15. Priyadarshi, N., Padmanaban, S., Mihet-Popa, L., Blaabjerg, F., Azam, F. (2018). Maximum power point tracking for brushless DC motor-driven photovoltaic pumping systems using a hybrid ANFIS-FLOWER pollination optimization algorithm. Energies, 11, 1067. DOI 10.3390/en11051067. [Google Scholar] [CrossRef]
16. Zhao, B., Ren, Y., Gao, D. K., Xu, L. Z. (2019). Performance ratio prediction of photovoltaic pumping system based on grey clustering and second curvelet neural network. Energy, 171, 360–371. DOI 10.1016/j.energy.2019.01.028. [Google Scholar] [CrossRef]
17. Sharma, U., Singh, B., Kumar, S. (2017). Intelligent grid interfaced solar water pumping system. IET Renewable Power Generation, 11(5), 614–624. DOI 10.1049/iet-rpg.2016.0597. [Google Scholar] [CrossRef]
18. Kumar, R., Singh, B. (2016). BLDC Motor-driven solar PV array-fed water pumping system employing zeta converter. IEEE Transactions on Industry Applications, 52(3), 2315–2322. DOI 10.1109/TIA.2016.2522943. [Google Scholar] [CrossRef]
19. Kumar, R., Singh, B. (2017). Single stage solar PV Fed brushless DC motor driven water pump. IEEE Journal of Emerging and Selected Topics in Power Electronics, 5(3), 1377–1385. DOI 10.1109/JESTPE.2017.2699918. [Google Scholar] [CrossRef]
20. Mudlapur, A., Ramana, V. V., Damodaran, R. V., Balasubramanian, V., Mishra, S. (2019). Effect of partial shading on PV Fed induction motor water pumping systems. IEEE Transactions on Energy Conversion, 34(1), 530–539. DOI 10.1109/TEC.2018.2876132. [Google Scholar] [CrossRef]
21. Tiwari, A. K., Kalamkar, V. R. (2018). Effects of total head and solar radiation on the performance of solar water pumping system. Renewable Energy, 118, 919–927. DOI 10.1016/j.renene.2017.11.004. [Google Scholar] [CrossRef]
22. Sekhar, V. C., Kant, K., Singh, B. (2016). DSTATCOM supported induction generator for improving power quality. IET Renewable Power Generation, 10(4), 495–503. DOI 10.1049/iet-rpg.2015.0200. [Google Scholar] [CrossRef]
23. Kumar, A., Kumar, K., Kaushik, N., Sharma, S., Mishra, S. (2010). Renewable energy in India: Current status and future potentials. Renewable Sustain Energy Review, 14, 2434–2442. DOI 10.1016/j.rser.2010.04.003. [Google Scholar] [CrossRef]
24. Mittal, M. L., Sharma, C., Singh, R. (2012). Estimates of emissions from coal fired thermal power plants in India. Proceedings of International Emission Inventory Conference, pp. 1–22. [Google Scholar]
25. Lakshmi, M., Hemamalini, S. (2019). Coordinated control of MPPT and voltage regulation using single-stage high gain DC–DC converter in a grid-connected PV system. Electric Power Systems Research, 169, 65–73. DOI 10.1016/j.epsr.2018.12.011. [Google Scholar] [CrossRef]
26. Dehghanzadeh, A., Farahani, G., Vahedi, H., Al-Haddad, K. (2018). Model predictive control design for DC–DC converters applied to a photovoltaic system. International Journal of Electrical Power & Energy Systems, 103, 537–544. DOI 10.1016/j.ijepes.2018.05.004. [Google Scholar] [CrossRef]
27. Amir, A., Che, H. S., Amir, A., Khateb, A. E., Rahim, N. A. (2018). Transformerless high gain boost and buck-boost DC–DC converters based on extendable switched capacitor (SC) cell for stand-alone photovoltaic system. Solar Energy, 171, 212–222. DOI 10.1016/j.solener.2018.06.078. [Google Scholar] [CrossRef]
28. Dileep, G., Singh, S. N. (2017). Selection of non-isolated DC–DC converters for solar photovoltaic system. Renewable and Sustainable Energy Reviews, 76, 1230–1247. DOI 10.1016/j.rser.2017.03.130. [Google Scholar] [CrossRef]
29. Pilakkat, D., Kanthalakshmi, S. (2018). Drift free variable step size perturb and observe MPPT algorithm for photovoltaic systems under rapidly increasing insolation. Electronics Journal, 22, 19–26 DOI 10.7251/ELS1822019P. [Google Scholar] [CrossRef]
30. Zakzouk, N. E., Elsaharty, M. A., Abdelsalam, A. K., Helal, A. A., Williams, B. W. (2016). Improved performance low-cost incremental conductance PV MPPT technique. IET Renewable Power Generation, 10(4), 561–574. DOI 10.1049/iet-rpg.2015.0203. [Google Scholar] [CrossRef]
31. Pilakkat, D., Kanthalakshmi, S. (2019). An improved P&O algorithm integrated with artificial bee colony for photovoltaic systems under partial shading conditions. Solar Energy, 178, 37–47. DOI 10.1016/j.solener.2018.12.008. [Google Scholar] [CrossRef]
32. Hsieh, G., Hsieh, H., Tsai, C., Wang, C. (2013). Photovoltaic power-increment-aided incremental-conductance MPPT with Two-phased tracking. IEEE Transactions on Power Electronics, 28(6), 2895–2911. DOI 10.1109/TPEL.2012.2227279. [Google Scholar] [CrossRef]
33. Huynh, D. C., Dunnigan, M. W. (2016). Development and comparison of an improved incremental conductance algorithm for tracking the MPP of a solar PV panel. IEEE Transactions on Sustainable Energy, 7(4), 1421–1429. DOI 10.1109/TSTE.2016.2556678. [Google Scholar] [CrossRef]
34. Soon, T. K., Mekhilef, S. (2015). A fast-converging MPPT technique for photovoltaic system under fast-varying solar irradiation and load resistance. IEEE Transactions on Industrial Informatics, 11(1), 176–186. DOI 10.1109/TII.2014.2378231. [Google Scholar] [CrossRef]
35. Mohanty, S., Subudhi, B., Ray, P. K. (2017). A grey wolf-assisted perturb & observe MPPT algorithm for a PV system. IEEE Transactions on Energy Conversion, 32(1), 340–347. DOI 10.1109/TEC.2016.2633722. [Google Scholar] [CrossRef]
36. Karthick, K., Kavaskar, S. (2020). Estimation of the reproduction number and early prediction of the COVID-19 outbreak in India using a statistical computing approach. Epidemiology and Health (EpiH). 2020, e2020028. DOI 10.4178/epih.e2020028. [Google Scholar] [CrossRef]
37. Cristin, R., Kumar, B. S., Priya, C., Karthick, K. (2020). Deep neural network-based rider-cuckoo search algorithm for plant disease detection. Artificial Intelligence Review, 53, 4993–5018. DOI 10.1007/s10462-020-09813-w. [Google Scholar] [CrossRef]
38. Ground water level (2018). http://cgwb.gov.in/Ground-Water/AllIndiaGWReportMay2018.pdf. [Google Scholar]
39. Ground water year book (2020). http://cgwb.gov.in/Regions/SR/Reports/GW%20YEAR%20BOOK%202019-2020%20AP.pdf. [Google Scholar]
40. Guy Fipps (1914). Calculating Horsepower Requirements and Sizing Irrigation Supply Pipelines. Texas A&M Agricultural Extension Service. http://riograndewater.org/media/1064/b-6011-calculating-horsepower-requirements-and-sizing-irrigation-supply-pipelines.pdf. [Google Scholar]
 | This work is licensed under a Creative Commons Attribution 4.0 International License, which permits unrestricted use, distribution, and reproduction in any medium, provided the original work is properly cited. |