| Energy Engineering |
DOI: 10.32604/EE.2021.016678
ARTICLE
Quantifying Contribution of DER-Integrated EV Parking Lots to Reliability of Power Distribution Systems
State Key Laboratory of Alternate Electrical Power System with Renewable Energy Sources, North China Electric Power University, Beijing, 102206, China
*Corresponding Author: Bo Zeng. Email: alosecity@126.com
Received: 17 March 2021; Accepted: 07 June 2021
Abstract: In the future smart cities, parking lots (PLs) can accommodate hundreds of electric vehicles (EVs) at the same time. This trend creates an opportunity for PLs to serve as a potential flexibility resource, considering growing penetration of EVs and integration of distributed energy resources DER (such as photovoltaic and energy storages). Given this background, this paper proposes a comprehensive evaluation framework to investigate the potential role of DER-integrated PLs (DPL) with the capability of vehicle-to-grid (V2G) in improving the reliability of the distribution network. For this aim, first, an overview for the distribution system with DPLs is provided. Then, a generic model for the available generation capacity (AGC) of DPLs with consideration of EV scheduling strategy is developed. On the above basis, an iterative-based algorithm leveraging sequential Monte Carlo simulation is presented to quantify the contribution of DPLs to the reliability of the system. In order to verify the effectiveness of the proposed method, a series of numerical studies are carried out. The simulation results show that the integration of DPLs with the V2G capability could help to improve the reliability performance of distribution grid to a great extent and reduce the adverse impact incurred by EV accommodation, if utilized properly.
Keywords: Electric vehicle; PV-integrated parking lots; capacity support; vehicle-to-grid; distributed energy resource
With the rapid development of industry in modern society, the contradictions between economy, energy and ecology have become increasingly apparent. Many countries and governments have adopted incentive measures to promote the vigorous development of the electric vehicle industry [1]. In recent years, the number of EVs has increased substantially, which has had a certain unfavorable effect on the planning, construction and operation of power grids, and put forward higher requirements for the development of supporting facilities for EVs.
EVs are a dual-function resource in the distribution network [2]. On the other hand, EVs can deliver electrical energy to the distribution network under V2G mode [3,4]. EVs have a great impact on the distribution network, which can be analyzed from the four aspects of their driving mode, charging characteristics, charging time and penetration level [5,6]. The EV charging PLs are used as the link of power transmission which need to arouse wide attention from experts and scholars.
Solar energy is a kind of renewable energy, and the use of photovoltaic power generation to supply power to EVs is an important development direction in the construction of EV charging facilities [7,8]. The configuration of photovoltaic system is very suitable for EV parking lots, because the PLs have enough space to install photovoltaic power generation system. However, due to the intermittent and fluctuating characteristics of photovoltaic power generation, it is difficult to maintain the expected goals in the planning and operation of the system. Therefore, an energy storage system (ESS) can be configured on the basis of photovoltaic power generation, which can provide potential solution. This paper proposes a DPL, which configured with a photovoltaic storage system, can not only provide charging services for EV owners, but also improve the ability of local consumption of renewable energy and the reliability of the urban distribution network [9,10].
The existing research on DPLs mainly focuses on planning and operation scheduling. In [11], a real-time EV charging strategy is proposed on the basis of short-term photovoltaic power generation forecast to improve the utilization rate of photovoltaic power generation and maximize the profit of the DPL. In [12], a comparative analysis of several schemes from financial and energy indicators shows the feasibility of DPL. In [13], a new type of EV charging model to determine the optimal charging decision of plug-in EV and the optimal capacity configuration of photovoltaic and ESSs is proposed to obtain the best investment decision.
Most of these studies only maximize the operating profit to pursue the economics of the planning and dispatching of the DPL. However, these studies neglect that DPL can replace dispatchable generators to a certain extent as a potential backup power source in the power distribution system [14]. In fact, when a fault is accrued in the distribution system, DPL has almost no startup and shutdown costs, and has fast and accurate response capabilities. However, the proposed DPL is not as flexible as conventional dispatchable generators when providing energy for the distribution system, and has much more complicated operational characteristics in practice, which requires more theoretical research.
Regrettably, experts and scholars have rarely studied the impact of DPLs connected to the grid on the reliability of distribution systems, in addition to [15] studied the impact of photovoltaic power generation systems with storage units from the perspective of reliability evaluation and cost analysis. Therefore, the research in this paper has important engineering significance which provides an idea for studying the reliability impact of DPLs connected to the grid.
Compared with other studies, the contributions of this paper are as follows:
• Proposing a framework for quantifying contribution of DER-Integrated EV parking lots to reliability of power distribution systems.
• Comparing the impact of PLs with different configurations on the reliability of the distribution system, which shows the superiority of DPL connected to the grid.
• Proposing the DPL dispatch strategy under the failure of distribution system. Besides, analyzing and comparing the reliability level of the distribution system under different strategies.
The rest of this paper is summarized as follows. Section 2 proposes the theoretical framework of the interaction between the DPL and the grid. Section 3 proposes the grid structure of the distribution system. Section 4 proposes an evaluation model of the AGC of the DPL, which provides a more reliable basis for the subsequent reliability evaluation of the distribution system. Section 5 gives the specific process of the reliability evaluation of the distribution system, using the reliability indexes of the distribution system and the load point (LP) to quantify the effect of DPL on the reliability of distribution systems. Section 6 demonstrates the numerical studies subject to different operation schemes, and the results show that the deployment of DPLs can improve the reliability of the distribution system to a certain extent.
This paper studies the impact of the DPL connected to the power grid on the distribution system, and its basic structure is shown in Fig. 1. The DPL is configured with photovoltaic units, ESSs and charging piles. In the actual operation process, after photovoltaic power generation, electricity is supplied to EVs for charging. When the amount of electricity generated exceeds the charging demand of EVs, the excess electricity is stored in the ESS of the DPL. When the power generation is less than the EV charging demand, EV is powered by the distribution system and the photovoltaic unit at the same time. Under the normal condition, the power distribution system will supply power to the DPL; When the distribution system fails, the ESS of the DPL and EVs will be used as backup power sources, and by injecting electric energy into the distribution system to reduce the power shortage of the distribution system and increase the reliability of distribution system to a certain extent [16].
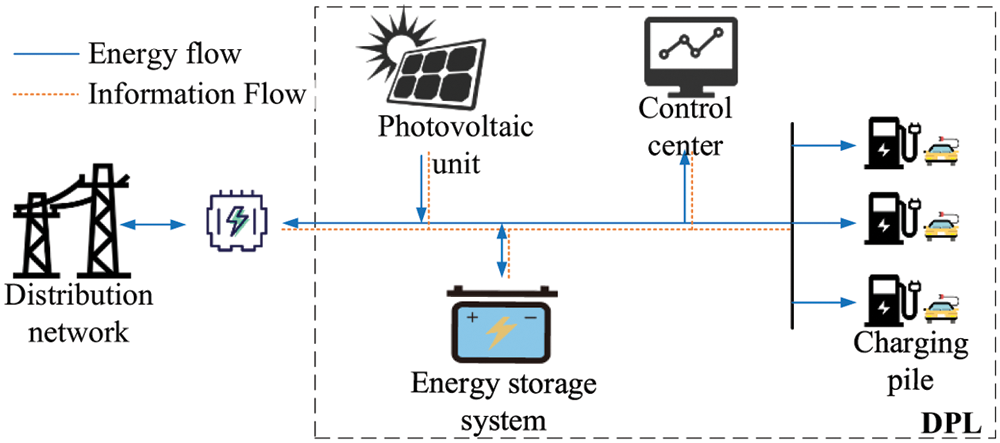
Figure 1: Basic structure of the DPL
Before modeling the DPL, this paper makes the following assumptions:
1)Assuming that all charging piles are configured with V2G devices in DPLs.
2)Due to the lack of reliable data, it is assumed that all car owners have no objection to participate in the V2G process when the distribution system fails, thereby omitting the process of demand response modeling.
3 Grid Structure of Distribution Network
This paper uses the main feeder F4 of the IEEE-RBTS Bus6 system as the power distribution system where the EV parking lot is located [17]. The system contains several circuit breakers, isolating switches, distribution transformers and 23 LPs. The connection location of the DPL is shown in Fig. 2.
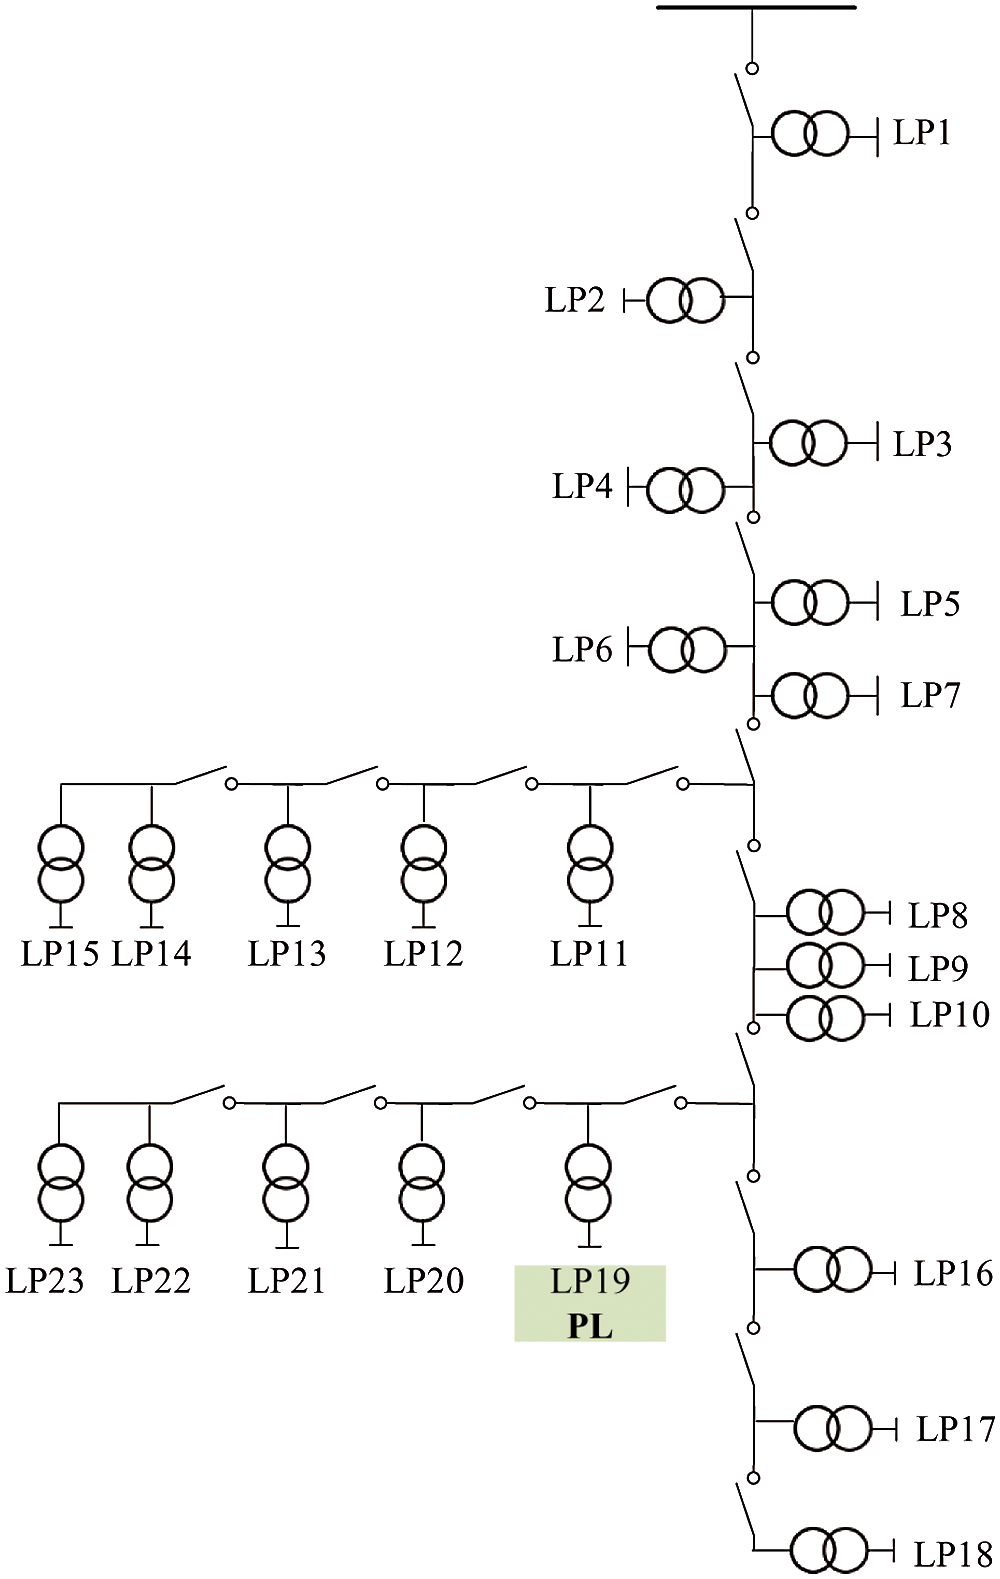
Figure 2: Distribution feeder where the DPL is supplied
The distribution system selected in this paper does not have any distributed power sources and can only obtain electric energy from the external grid through transformers. Therefore, the distribution system has only DPLs as backup power sources. The transformer power between the external grid and the distribution grid can be expressed by formula (1):
where
The same is true for LPs. If a load bus fails, the real-time load size at the LP will determine the severity of the fault and the reliability of the distribution system. A simple random sampling method can be used to sample the fault status of the load bus.
4 Assessment of Available Generation Capacity
4.1 Photovoltaic Output Modeling
The output power of photovoltaic power generation is proportional to the light intensity, which is expressed by formula (2):
where
where n denotes the historical number of days for generating typical photovoltaic output scenarios; h denotes the bandwidth of the core density estimate; t represents the time period of the day; Xt,i denotes the photovoltaic output of the i-th day in the t period in sample data set.
4.2 Fixed Energy Storage Capacity of DPL
The charging equipment prioritizes the use of photovoltaic power generation. When the photovoltaic power is excessive and the EVs cannot absorb it at that moment, the excess power is stored in the ESS. Assuming that the market electricity price implements the time-of-use electricity price with a 24-hour time period. The ESS of the DPL has the role of battery backup for the distribution system [19], so during off peak time, the ESS is charged by the distribution system, in order to ensure the power supply when the distribution system fails, expressed by formula (4):
where
The service life of an ESS is closely related to its discharge depth. In order to ensure the energy storage life, its State of Charge (SOC) must be under certain constraints, which can be expressed by formula (5):
4.3 Energy Storage Capacity of EVs
The energy storage capacity of EVs can also be regarded as the backup power supply of the distribution system. Therefore, modeling and analysis of the energy storage capacity of EVs is an important aspect of the reliability evaluation of the distribution system. EVs use the DPLs as a medium to exchange power with the grid, so statistical rules can be found from the large number of random behaviors of EV owners to predict the charging load. This paper considers the reserve capacity of EVs to the distribution system from several aspects: EV flow, SOC when the vehicle arrives at the DPL, EV arrival/departure time [10], and EV charging power.
Combined with the actual development of electric vehicles in China, electric vehicles can be divided into four types, namely, taxis, private cars, urban functional vehicles and buses. Due to different vehicle functions, its charging load has significant randomness and flexibility. Due to the severe randomness of time, this article does not consider shopping malls with frequent vehicle turnover. In this paper, several DPLs that can accommodate 500 cars at the same time in the urban area of Beijing are used as the research object, and the statistical rules are found from the large number of random behaviors of users to predict charging load [20]. EV charging is carried out in a static state, so the parking law of the charging load is closely related to user behavior.
The time data of the EV’s arrival/departure from the DPL shows that the vehicle movement between 0:00 am and 6:00 am is considered invalid or meaningless. Therefore, in this study, the working hours of DPLs are 6:00 am−12:00 pm. Several common probability density functions, such as uniform probability distribution, normal probability distribution, and Γ-type probability distribution, are tested to obtain the best probability distribution function under the EV arrival mode. Through the test, it can be known that the fitting effect of the two-parameter Weibull distribution function is the best in the sum of square error, R-squared and root mean squared error performance indexes, so formulas (6) and (7) give the two-parameter Weibull distribution function:
where α denotes the scale parameter and β denotes the shape parameter. Formula (7) gives the relationship between x and tarri, where x is the independent variable of the Weibull distribution function and t is the arrival time of the EV.
After testing, it can be concluded that when α = 0.99, β = 16.7, the best-fitting Weibull distribution function of EV arrival time can be obtained as formula (8). The relationship between the arrival time of EVs and the number of vehicles is given in Fig. 3.
In order to simplify the influencing factors of the charging behavior of EVs, this paper does not consider the travel rules in multiple scenarios such as weekdays and weekends, and believes that the daily rules of DPLs are the same. Compared with car arrival time, car departure time is more scattered throughout the day. There is a strong correlation between car departure time and car arrival time. Cars that arrive at the DPL earlier in the day usually stay for a longer time, while EVs with a later arrival time generally stay for a shorter time, which depends entirely on the behavior of owner. Therefore, this paper replaces the analysis of departure time with the general law of parking time.
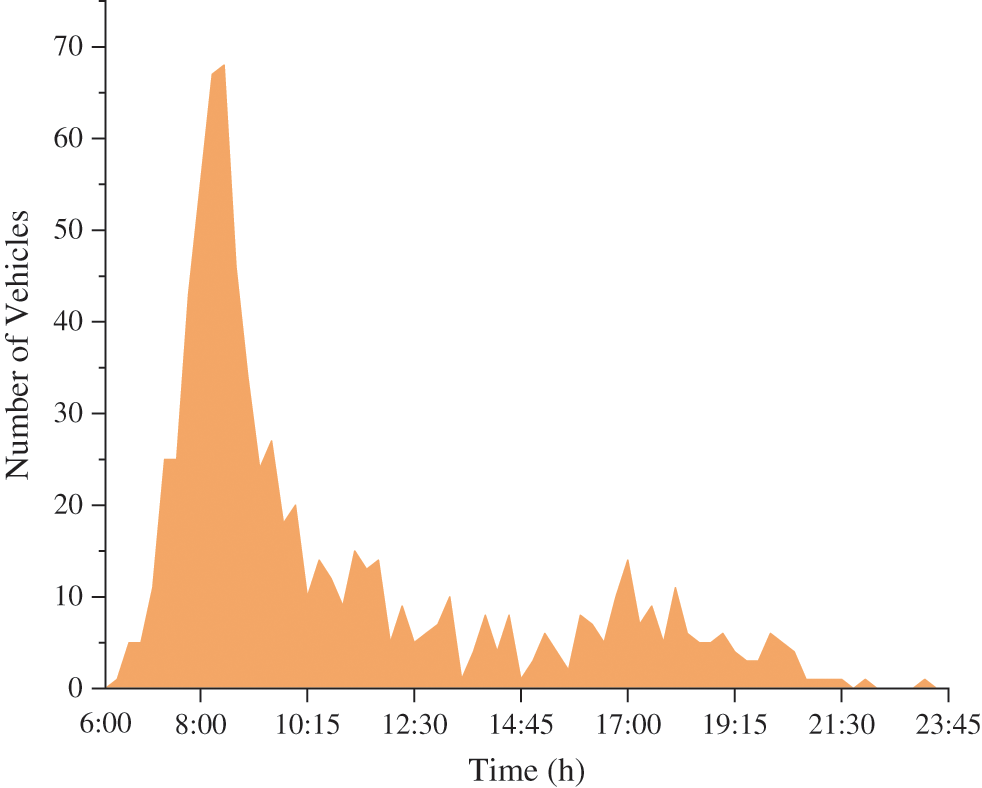
Figure 3: The arrival time of EVs in a DPL during a weekday
The kernel density estimation uses a smooth peak function to fit the sampling points, which can simulate the real parking time probability distribution curve well. At the same time, this article uses a smooth kernel. The kernel density is estimated as formula (9):
where K( · ) denotes kernel function; n denotes the sample size. In this scenario, the Gaussian Kernel Density estimation in the smoothing kernel is used, and bandwidth = 1. Therefore, the departure time of electric vehicles can be described as formulas (10) and (11):
where tdepa denotes the departure time of EVs; tarri denotes the arrival time of EVs; tdura denotes the stay time of EVs.
The remaining electric energy when the vehicle reaches the DPL is also an equally important parameter. This parameter is determined by the mileage of the car before reaching the DPL. In this study, the data in [21] is used, that is, 50 km/day is used as the daily average driving distance. The SOC of the car to the DPL can be calculated by the distance traveled, the consumption rate of the EV battery capacity, and the rated capacity of the EV energy storage battery. This paper selects an EV with a battery capacity of 35 kWh, and the battery capacity consumption value per unit distance of the EV is 0.23 kWh/km. The initial SOC when EV reaches the DPL is expressed by Eq. (12):
Finally, assuming that the rated charging power of the EV charging pile is 15 kW, the charging power of each period will be discussed in detail in the next section.
4.4 Scheduling Strategy of DPL
4.4.1 Dispatching Strategy under Normal Operation of Distribution System
The charging behavior is related to the driving purpose of the car owner. Besides, it has a strong correlation with the charging price level. Operators of the DPLs need to purchase electricity from the external grid to support the daily operation of DPLs. Considering the economics of DPLs, we take the time-of-use tariff standard for commercial electricity consumption in Beijing in Tab. 1 as an example to design a charging strategy.
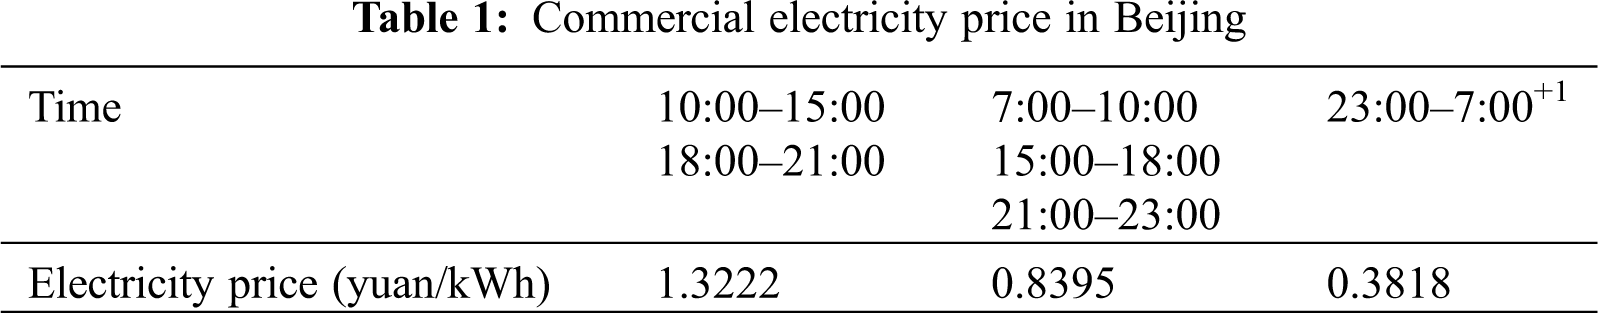
From the perspective of time-of-use electricity prices, grid electricity prices are described as peak-valley-flat prices. Therefore, we can divide the peak-valley-flat prices period of three different electricity prices and set the charging strategy accordingly. When the electricity price is low, it is charged with the rated power, and in the period of high electricity price, it is charged with a lower power to minimize the charging power, which can be described as the formula (13):
where
Nevertheless, this charging scheduling strategy has certain problems. It only guarantees the economic efficiency of the operation of the DPL, but does not guarantee that the EVs charged at the DPL can obtain sufficient power. In response to this problem, we improve the charging strategy. When the SOCt is lower than a limit, the EV is charged at the rated power regardless of the time period. This paper sets the limit to SOCt = 0.3. Therefore, the charging scheduling strategy in this paper can be described as formula (14):
The SOC during charging can be calculated by formula (15):
where Δt denotes the time interval, 15 min; ηch denotes the charging efficiency; Erated denotes the rated capacity of an EV battery.
4.4.2 Dispatching Strategy under the Failure of Distribution System
When the distribution system fails, the DPL cannot obtain power from the distribution system. To ensure the normal charging demand of the DPL when the distribution system fails, when the external distribution system fails for a long time, its dispatching strategy should be changed.
For the ESS, during the system failure, the ESS cannot obtain energy from the external grid, and only the photovoltaic unit provides energy to the DPL. For electric vehicles, the scheduling strategy of the DPL will also change when a failure occurs, which can be described as formula (16):
While the DPL meets the electricity required for its operation, the photovoltaic power generation system stores the excess electricity in the ESS. The ESS of the DPL provides electricity to the distribution system in the form of constant power. The delivered power is described as formula (17):
where
The government can use certain price incentives to allow electric vehicles to participate in the V2G process when the distribution system fails [22,23]. It is possible to encourage a part of electric vehicles (SOC ≥ 0.7) to participate in the V2G process until the battery capacity of the EV reaches the minimum limit for the owner’s mileage (assuming SOC = 0.4).
So far, the AGC can be described as:
where
5 Reliability Evaluation of Distribution System
Evaluating the impact of the connection of DPLs on the performance of the distribution system is the most important part of this article. This part of the work will quantify the contribution degree of DPLs to the reliability of the system. The algorithm steps based on an iterative-based algorithm leveraging sequential Monte Carlo method [24] are briefly described as follows:
(1) Initialization. Set the simulation period, and initialize the simulation time T = 0.
(2) Through sampling, the user behavior mode and the time series of the status of power distribution components are formed. The behavior of car owners includes EV flow, EV arrival and departure time. The state of the power distribution component is composed of the time sequence of the external power grid, the transformers and the load buses, which has two states: fault and normal operation.
(3) Calculate the total AGC and load of the distribution system. The total AGC is described as formula (18). The total load of the distribution system includes the load on each load bus and the EV charging load in the DPL.
(4) Judge whether the system is faulty. If the power consumption of the distribution system at time t is greater than the total AGC of the distribution system, the distribution system fails. At the same time, the DPL implements a new operation strategy. Taking the minimum load loss as the goal, perform optimal power flow analysis to obtain the load loss power of each bus.
(5) Calculate the system/load reliability indexes. System/load reliability indexes include system/load average interruption duration index (SAIDI/LAIDI), system/load average interruption frequency index (SAIFI/LAIDI), and system/load expected energy not supplied (SEENS/LEENS). Each of the above system reliability indexes can be calculated from the reliability indexes and load data of each LP.
(6) When the component failure state changes in Step (4), the reliability indexes of the failure are counted. And return to Step (2) to continue to update the system operation status, and repeat Steps (2) to (5) until the simulation time t > 8760 years.
(7) The final reliability index can be calculated as the average value of each simulation year.
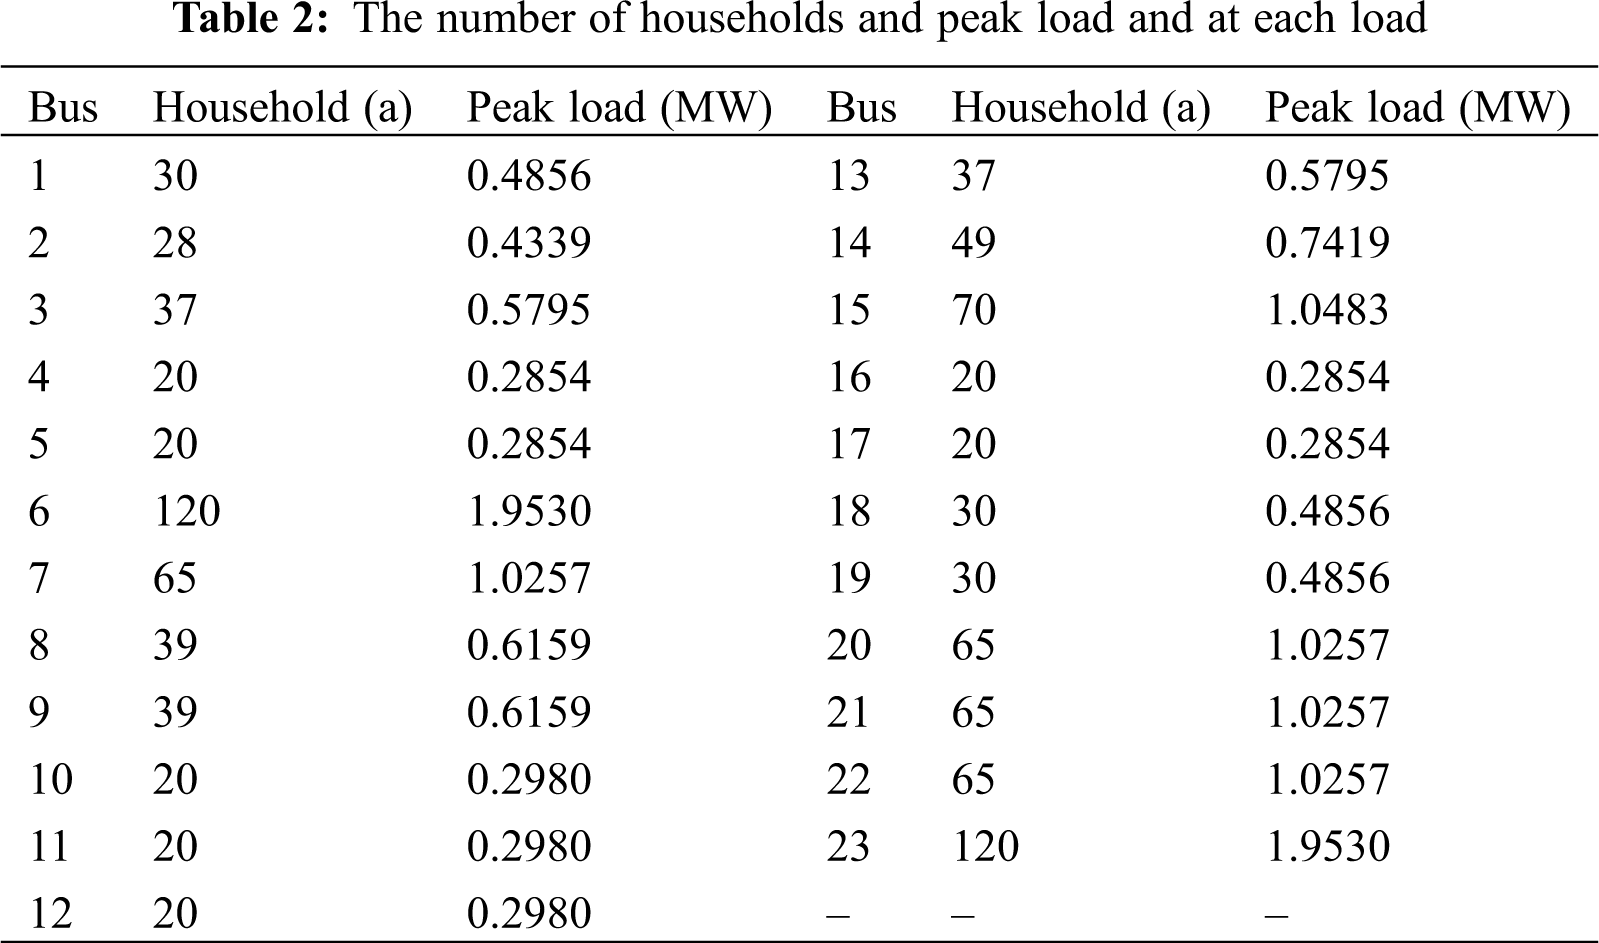
The distribution system structure is shown in Fig. 2, and the DPL location is also marked in the figure. DPL is connected to the distribution system through a 34.5/0.4 kV transformer. The distribution system is connected to the external grid through two 110/10 kV power transformers. For the convenience of calculation, assuming that the load factor of each LP is the same, the load factor in a typical day is shown in Fig. 4. The number of households and peak load at each load are shown in Tab. 2. Specially, assuming that the loads at Bus 16–23 (which are close to the location of DPL) are critical customers in the optimal power flow calculation, hence they were given priority for power restoration in emergency situations.
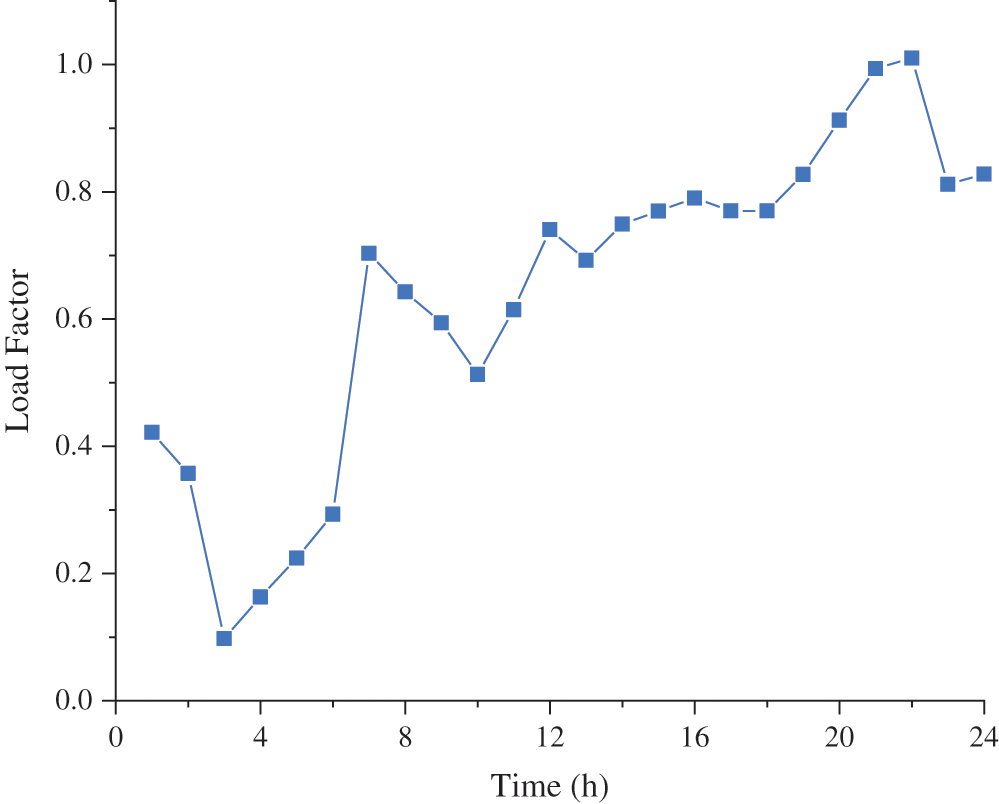
Figure 4: The load factor in a typical day
6.2 Reliability Indexes Analysis
This paper analyzes the impact of the DPL (including photovoltaic and energy storages) connected to the grid on the reliability of the distribution system from five different cases. The specific settings of each case are as follows. Among them, if V2G participates in regulation, the V2G time is set to be limited to 11:00–15:00.
Case 1: There is no DPL in the distribution system, and all electric energy is provided by the external grid.
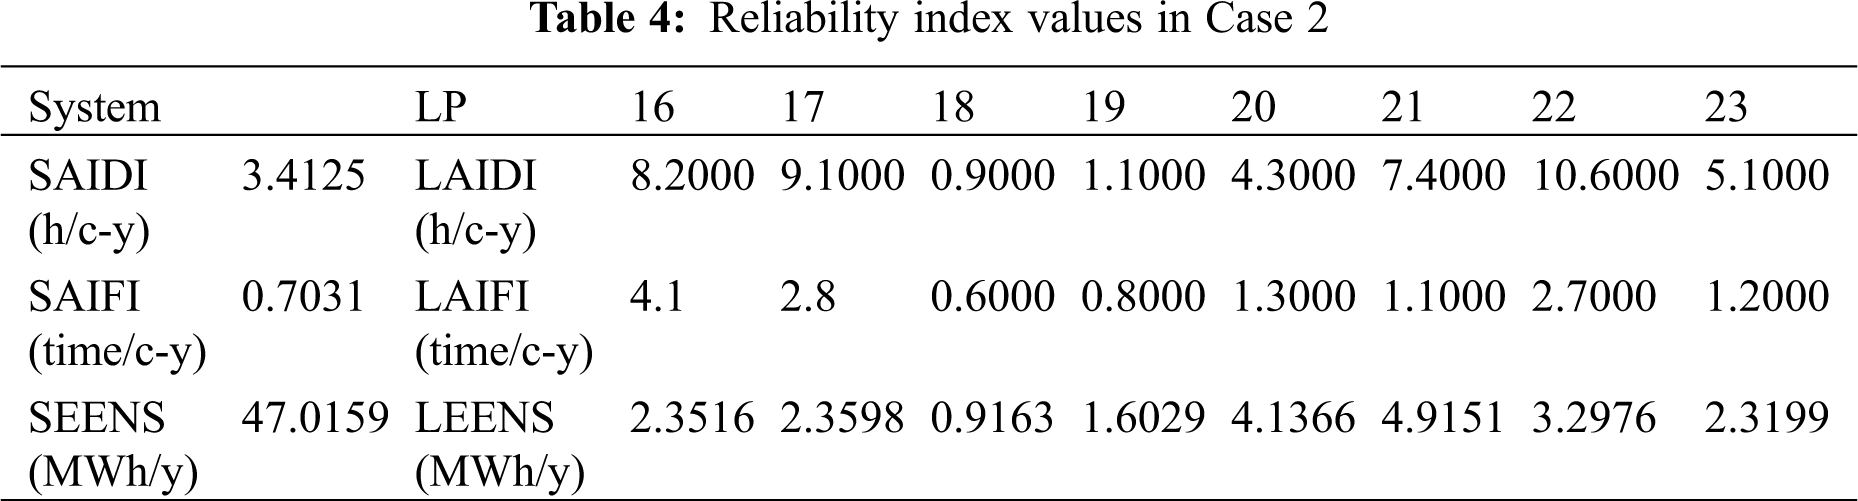
Case 2: A PL is configured in the distribution system, but there is no photovoltaic storage system and the capability of V2G, which corresponds to increasing the load level of the distribution system.
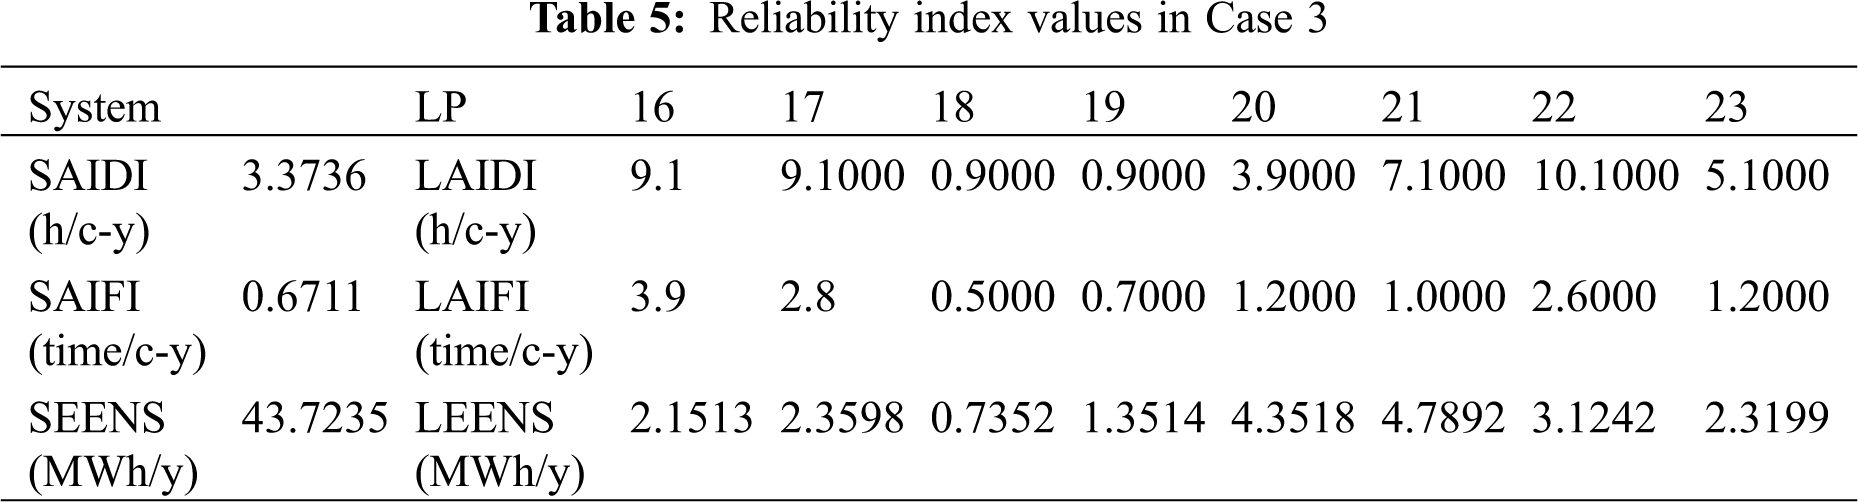
Case 3: The distribution system is configured with a PL with an ESS and has the capability of V2G. The PL can be used as a backup power source when the distribution system fails [25].
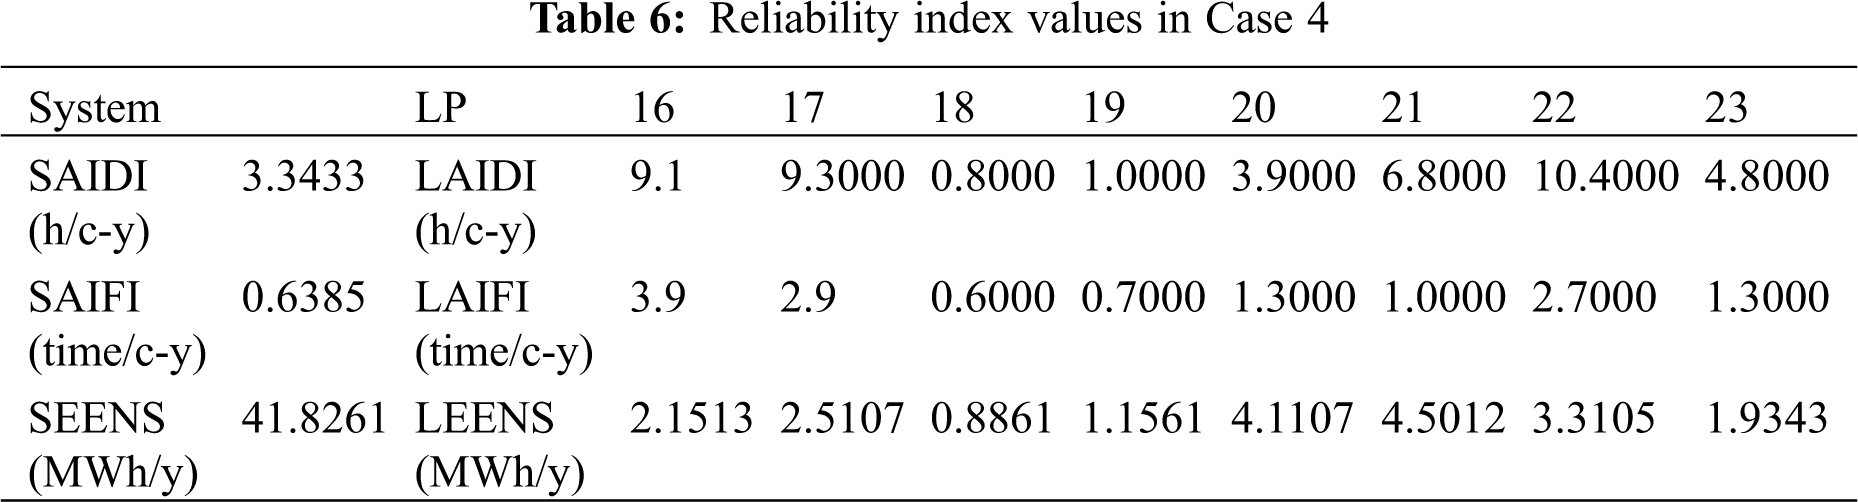
Case 4: The distribution system is configured with a DPL which does not have the capability of V2G. The DPL can be used as a backup power source when the distribution system fails [26].
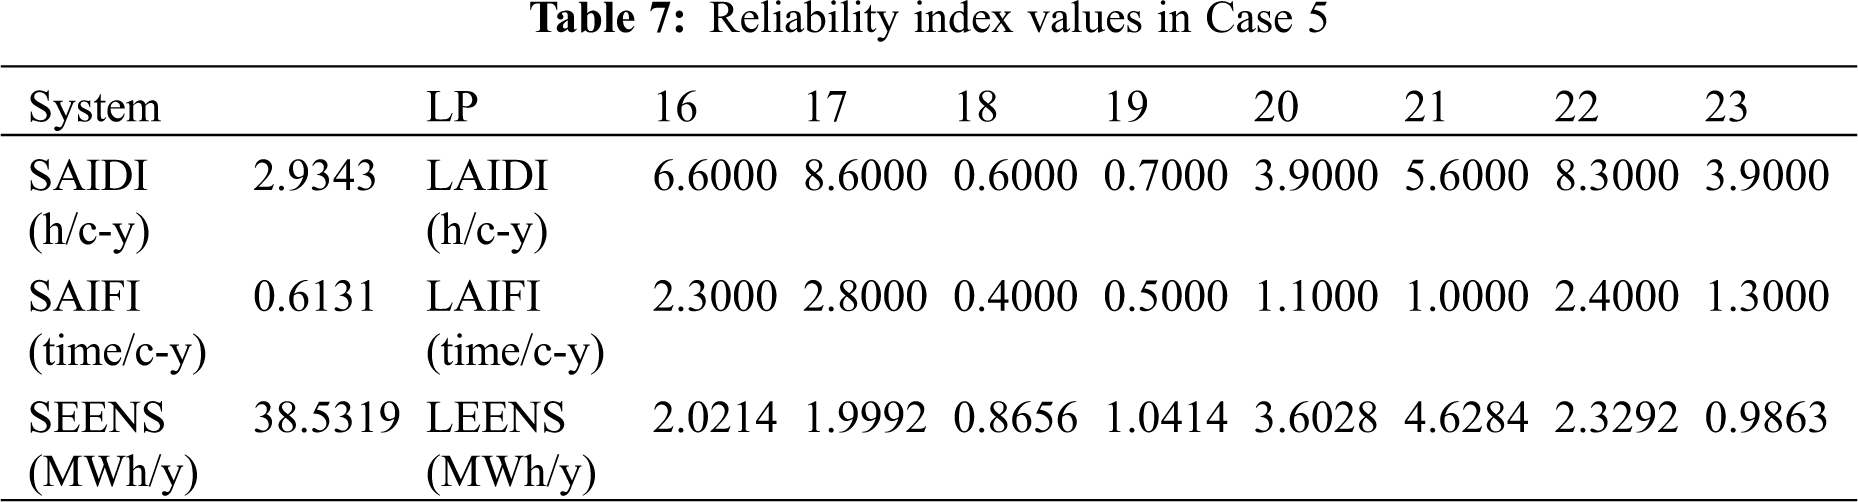
Case 5: The distribution system is configured with a DPL which has the capability of V2G. The DPL can be regarded as a backup power source.
In this paper, system reliability indexes and LP reliability indexes are used to measure the influence of PLs/DPLs on the reliability of distribution system. Some reliability index values in the 5 cases are shown in Tabs. 3–7.
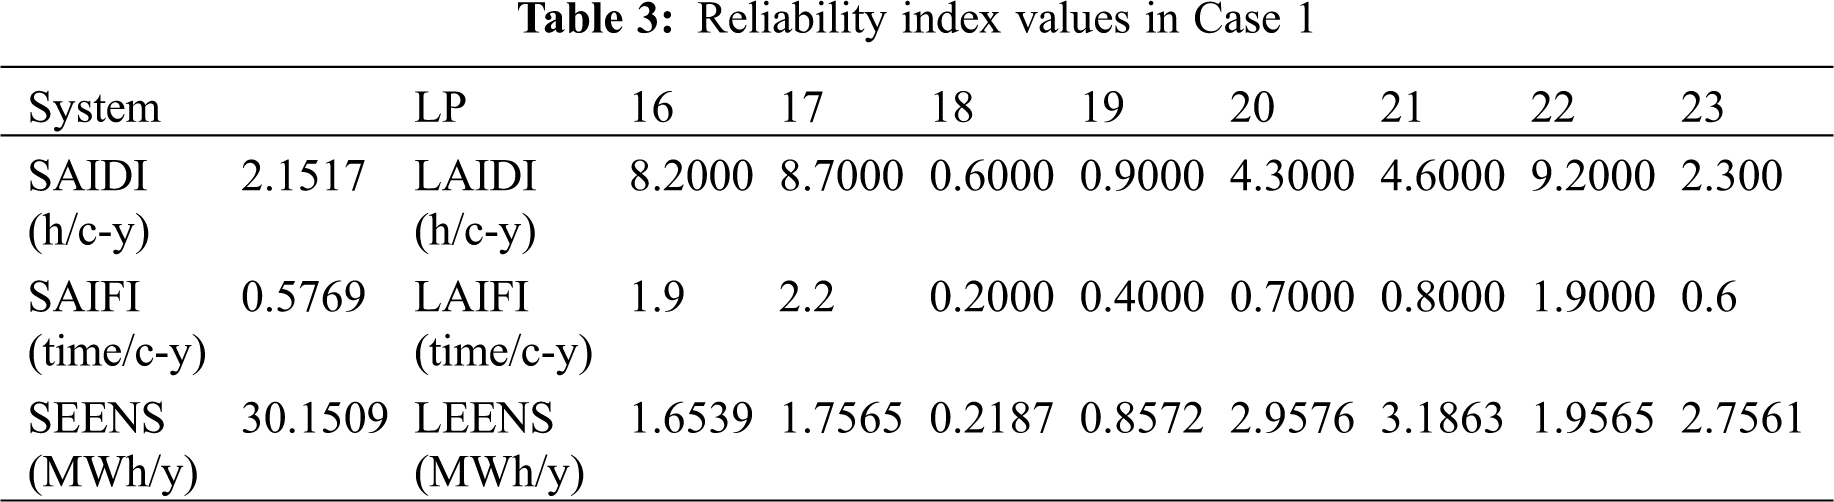
According to the simulation results from above studies, the following observations and important findings are made:
(1) When the distribution system is configured with the PL that do not have the capability of V2G and photovoltaic storage facilities, the reliability index values of the distribution system and the point of load are increased. For example, SAIDI increased from 2.1517 h/cy to 3.5736 h/cy, SAIFI increased from 0.5769 time/cy to 0.6711 time/cy, and LAIFI increased from 0.4000 time/cy to 08000 time/cy. It can be said that the configuration of EV parking lot will increase the total load of the system and reduce the reliability level of the power distribution system.
(2) When the PL with ESS which have the capability of V2G is configured in the distribution system, compared with the traditional PL, the reliability index values of the distribution system and LP 19 are reduced, and the power distribution system SAIDI, SAIFI, SEENS decreased by 0.0389 h/cy, 0.032 time/cy, 3.2924 MWh/y, respectively. This shows that this configuration can increase the reliability level of the power distribution system. Both the ESS and the capability of V2G essentially provide a backup power supply for the distribution system, which can effectively reduce the scope of power outages when the distribution system fails.
(3) When the DPL without the capability of V2G is configured in the distribution system, compared with Case 2, the reliability index values are reduced, and the SAIDI, SAIFI, and SEENS of the distribution system are reduced by 0.0692 h/cy, 0.0646 time/cy, 5.1896 MWh/y, respectively. The reliability indexes value of the LP where the DPL are located has also decreased. The reason is that the photovoltaic storage system, as a power generation-energy storage device, not only improves the on-site consumption of renewable energy, but also guarantees the power supply of some important loads when the distribution system fails.
(4) The distribution system is configured with a DPL which has the capability of V2G. At this time, compared with Case 4, the reliability indexes value of the distribution system and the LP 20 near LP 19 are reduced, the LAIFI and LEENS are reduced by 0.2000 time/cy and 0.5079 MWh/y. The DPL with V2G improves the reliability level of the power distribution system. Consequently, the adoption of V2G technology is helpful to alleviate the power shortage contradiction during peak power consumption, and improve the reliability of the distribution system to a certain extent.
(5) Among the hypothetical cases, the most reliable is not to configure PLs in the power distribution system. If PLs must be configured for urban planning and design, the deployment of DPLs with the capability of V2G can increase the distribution system reliability to a greater extent. The configuration of traditional PLs without the capability of V2G and photovoltaic storage systems has the greatest adverse impact on the reliability of the power distribution system.
6.3 Reliability Evaluation under Different Scheduling Strategies
In this subsection, we compare our research with other related works from the aspect of scheduling strategies. The three scheduling strategies of the DPL with the capability of V2G can be described in Section 4.4, in which the time of V2G mode is limited to 8:00–17:00.
Case 6: Adopt peak-to-valley price guided charging strategy during the normal operation of the distribution system and the dispatching strategy is the same as our work when the distribution system fails [27].
Case 7: The scheduling strategy is the same as our paper during normal operation of the distribution system and adopts exponential-decay V2G strategy during an outage [16].
Case 8: The scheduling strategy proposed in this paper.
The results of the above three cases are shown in Tabs. 8–10.
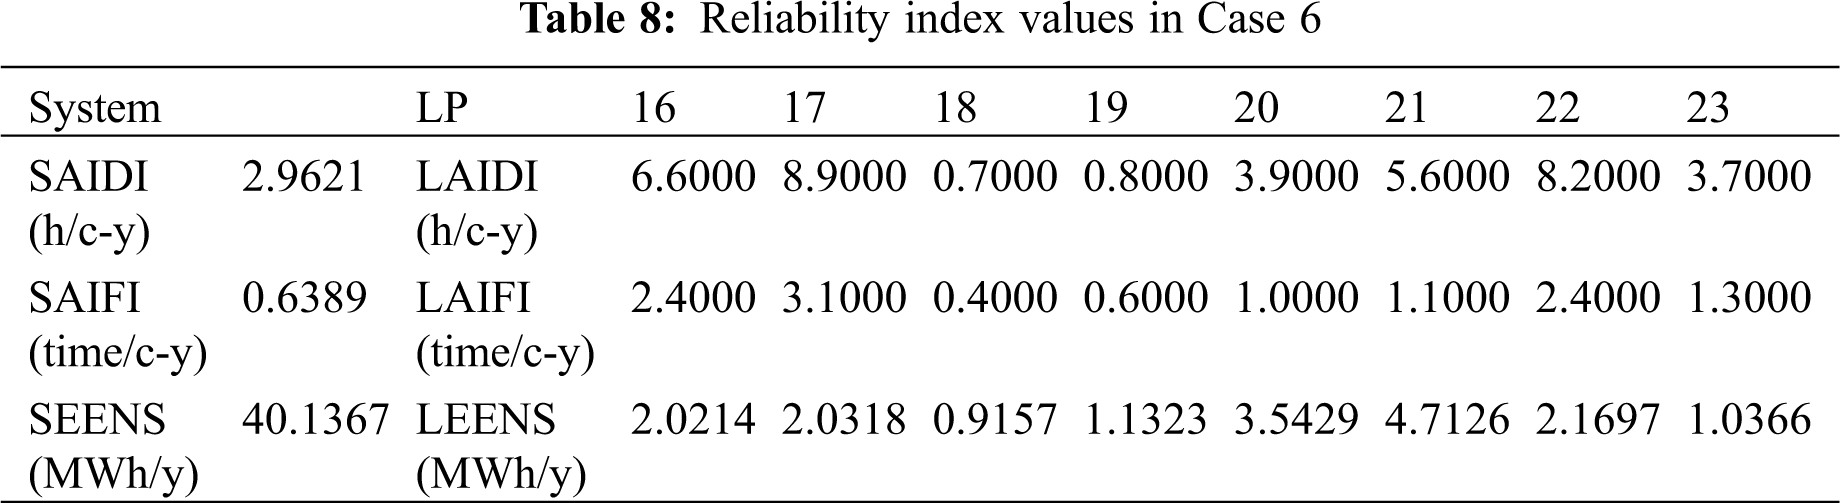
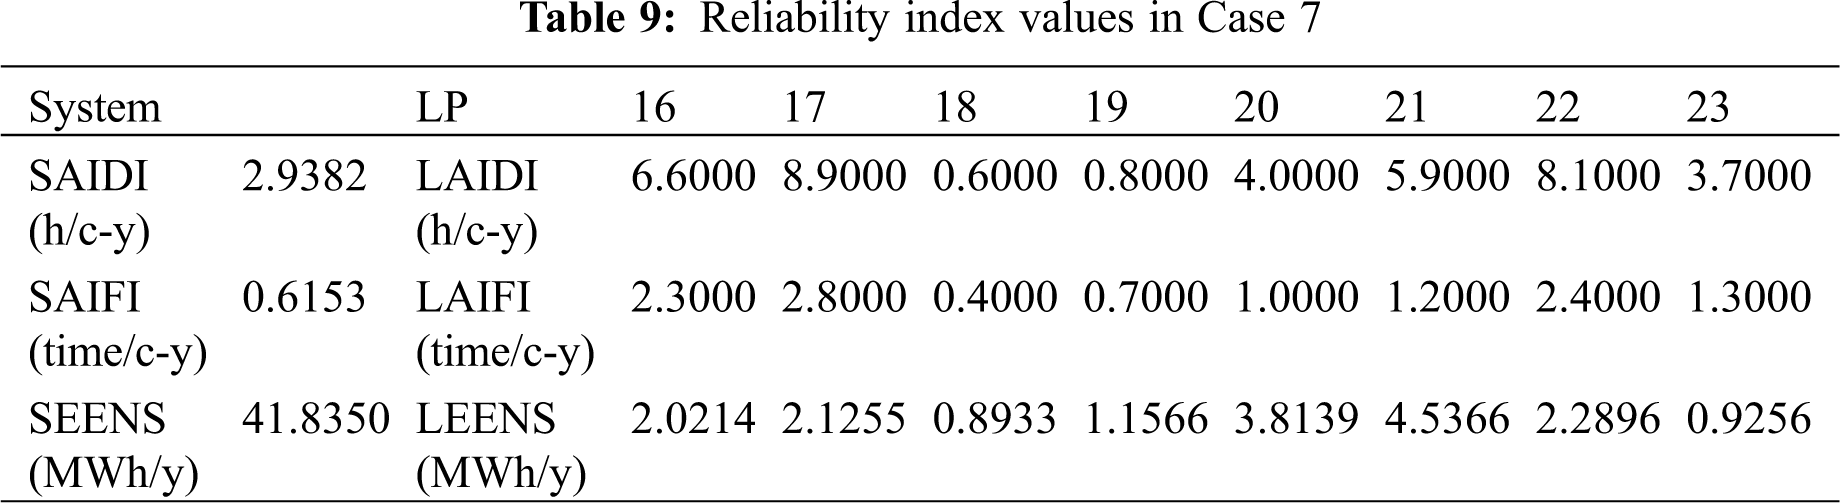
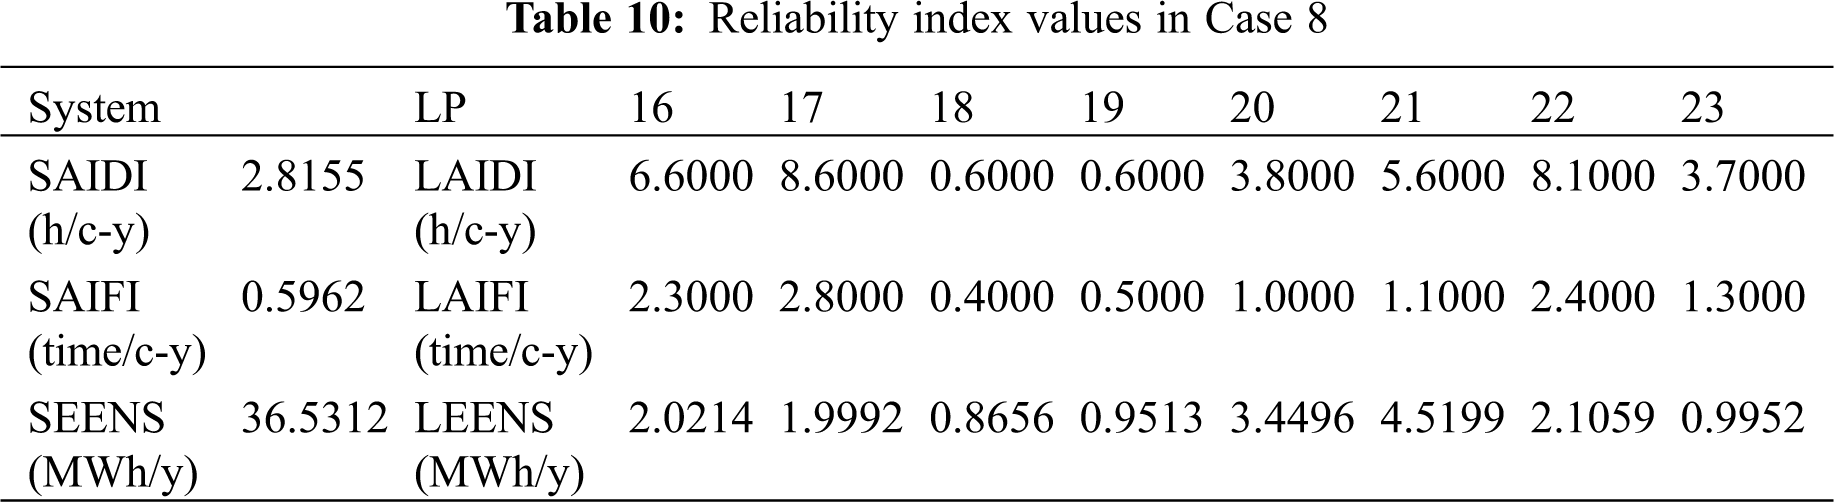
Comparing the above three cases, it can be seen that the SAIDI, SAIFI and SEENS of Case 8 are reduced by 0.1466 h/cy, 0.0427 time/cy, 3.6055MWh/y and 0.1277 h/cy, 0.0191 time/cy, 5.3038 MWh/y compared with Case 6 and Case 7. Peak-to-valley price guided charging strategy can only guarantee the economic efficiency of the operation of the DPL, but does not guarantee that the DPL can provide sufficient V2G power when suffering an outage. Moreover, since V2G power decays rapidly with time, exponential-decay V2G strategy is only suitable for short-term failures. For long-term failures, DPL cannot provide enough V2G power support. This shows that our proposed strategy can reduce the power load level of the distribution system and improve the reliability of the distribution system compared with existing works.
DPLs are public facilities built for urban planning and construction, so their economic benefits are ignored in this article. The main content of this paper is the potential effects of DPLs to the reliability of distribution system. This paper uses the main feeder F4 of the IEEE-RBTS Bus6 system as the grid structure of the power distribution system, and uses real-time data from DPLs in Beijing to develop an AGC evaluation method to describe the backup power capacity of the power distribution system. And put forward the EV dispatching strategy in the DPL, which can reduce the power consumption of the DPL when the power distribution system fails. On this basis, the algorithm flow of distribution system reliability evaluation based on an iterative-based algorithm leveraging sequential Monte Carlo method is proposed. The results of the calculation example analysis show that:
(1) The configuration of traditional PLs without the capability of V2G and photovoltaic storage systems will increase the load level of the distribution system, and the configuration of DPLs with the capability of V2G can play a role as a backup power source to a certain extent, which can help the grid under emergency conditions. Reverse power supply can improve the reliability of the power distribution system and help reduce power shortages.
(2) When the power distribution system fails, proper adjustment of the scheduling strategy of EVs is conducive to improve the reliability of the power distribution system, which can reduce the electrical load and ensure the normal power supply of important electrical loads.
As an important link to improve the level of urban intelligence, the DPLs will play an important role in improving the local energy consumption of renewable energy and improving the reliability of the power distribution system. In the next step of the study, it is hoped that the reliability and economy of the power grid will be coordinated to optimize, so as to provide more reference for the planning and construction of the distribution network.
Funding Statement: This work is financially supported by the National Social Science Fund of China (No. 19ZDA081) and Fundamental Research Funds for the Central Universities (No. 2020MS067).
Conflicts of Interest: The authors declare that they have no conflicts of interest to report regarding the present study.
1. Li, Z., Khajepour, A., Song, J. (2019). A comprehensive review of the key technologies for pure electric vehicles. Energy, 182, 824–839. DOI 10.1016/j.energy.2019.06.077. [Google Scholar] [CrossRef]
2. Yi, T., Zhang, C., Lin, T., Liu, J. (2020). Research on the spatial-temporal distribution of electric vehicle charging load demand: A case study in China. Journal of Cleaner Production, 242, 118457. DOI 10.1016/j.jclepro.2019.118457. [Google Scholar] [CrossRef]
3. Zeng, B., Zhu, Z., Xu, H., Dong, H. (2020). Optimal public parking lot allocation and management for efficient PEV accommodation in distribution systems. IEEE Transactions on Industry Applications, 56(5), 5984–5994. DOI 10.1109/TIA.2020.2986980. [Google Scholar] [CrossRef]
4. Bibak, B., Tekiner-Moğulkoç, H. (2021). A comprehensive analysis of vehicle to grid (V2G) systems and scholarly literature on the application of such systems. Renewable Energy Focus, 36, 1–20. DOI 10.1016/j.ref.2020.10.001. [Google Scholar] [CrossRef]
5. Green, R. C., Wang, L., Alam, M. (2011). The impact of plug-in hybrid electric vehicles on distribution networks: A review and outlook. Renewable & Sustainable Energy Reviews, 15(1), 544–553. DOI 10.1016/j.rser.2010.08.015. [Google Scholar] [CrossRef]
6. Liu, Z., Wang, D., Jia, H., Djilali, N., Zhang, W. (2015). Aggregation and bidirectional charging power control of plug-in hybrid electric vehicles: Generation system adequacy analysis. IEEE Transactions on Sustainable Energy, 6(2), 325–335. DOI 10.1109/TSTE.2014.2372044. [Google Scholar] [CrossRef]
7. Hernández, J. C., Ruiz-Rodriguez, F. J., Jurado, F. (2017). Modelling and assessment of the combined technical impact of electric vehicles and photovoltaic generation in radial distribution systems. Energy, 141, 316–332. DOI 10.1016/j.energy.2017.09.025. [Google Scholar] [CrossRef]
8. Xiang, Y., Wang, Y., Su, Y., Sun, W., Liu, J. (2020). Reliability correlated optimal planning of distribution network with distributed generation. Electric Power Systems, 186, 106391. DOI 10.1016/j.epsr.2020.106391. [Google Scholar] [CrossRef]
9. Sun, L., Fahim, F. (2019). Reliability enhancement of distribution networks using ESSs ancillary services: A probabilistic MILP methodology. Electric Power Systems Research, 175, 105889. DOI 10.1016/j.epsr.2019.105889. [Google Scholar] [CrossRef]
10. Guner, S., Ozdemir, A. (2017). Stochastic energy storage capacity model of EV parking lots. IET Generation, Transmission & Distribution, 11(7), 1754–1761. DOI 10.1049/iet-gtd.2016.1406. [Google Scholar] [CrossRef]
11. Jiang, W., Zhen, Y. (2019). A real-time EV charging scheduling for parking lots with PV system and energy store system. IEEE Access, 7, 86184–86193. DOI 10.1109/Access.6287639. [Google Scholar] [CrossRef]
12. Figueiredo, R., Nunes, P., Brito, M. C. (2017). The feasibility of solar parking lots for electric vehicles. Energy, 140, 1182–1197. DOI 10.1016/j.energy.2017.09.024. [Google Scholar] [CrossRef]
13. Awad, A. S. A., Shaaban, M. F., EL-Fouly, T. H. M., El-Saadany, E. F., Salama, M. M. A. (2017). Optimal resource allocation and charging prices for benefit maximization in smart PEV-parking lots. IEEE Transactions on Sustainable Energy, 8(3), 906–915. DOI 10.1109/TSTE.2016.2617679. [Google Scholar] [CrossRef]
14. Farzin, H., Fotuhi-Firuzad, M., Moeini-Aghtaie, M. (2017). Reliability studies of modern distribution systems integrated with renewable generation and parking lots. IEEE Trans. Sustainable Energy, 8(1), 431–440. DOI 10.1109/TSTE.2016.2598365. [Google Scholar] [CrossRef]
15. Hussein, I. M., Al-Awami, A. T. (2017). Reliability assessment of sustainable photovoltaic-electric vehicles system. 2017 9th IEEE-GCC Conference and Exhibition (GCCCEpp. 1–6.Manama, Bahrain. [Google Scholar]
16. Galiveeti, H. R., Goswami, A. K., Choudhury, N. D. (2018). Impact of plug-in electric vehicles and distributed generation on reliability of distribution systems. Engineering Science and Technology, An International Journal, 21(1), 50–59. DOI 10.1016/j.jestch.2018.01.005. [Google Scholar] [CrossRef]
17. Billinton, R., Jonnavithula, S. (1996). A test system for teaching overall power system reliability assessment. IEEE Transactions on Power Systems, 11(4), 1670–1676. DOI 10.1109/59.544626. [Google Scholar] [CrossRef]
18. Liu, G., Kang, K., Yu, H., Lv, Z., Li, T. et al. (2020). Scheduling strategy of PV-storage-integrated EV charging stations considering photovoltaic output and user demand uncertainty. Journal of Physics: Conference Series, 1578, no. 1, 012215. Osaka, Japan: IOP Publishing. DOI 10.1088/1742-6596/1578/1/012215. [Google Scholar] [CrossRef]
19. Li, D., Zouma, A., Liao, J.-T., Yang, H.-T. (2020). An energy management strategy with renewable energy and energy storage system for a large electric vehicle charging station. ETransportation, 6, 100076. DOI 10.1016/j.etran.2020.100076. [Google Scholar] [CrossRef]
20. Beijing Municipal Commission of Transport (2017). http://jtw.beijing.gov.cn/xxgk/xwfbh/201912/t20191209_1007701.html. [Google Scholar]
21. Yagcitekin, B., Uzunoglu, M., Karakas, A., Vurgun, M. (2013). Assessment of a car park with electric vehicles. 4th International Conference on Power Engineering, Energy and Electrical Drives. pp. 961–964Istanbul, Turkey. [Google Scholar]
22. Habib, S., Kamran, M., Rashid, U. (2015). Impact analysis of vehicle-to-grid technology and charging strategies of electric vehicles on distribution networks–A review. Journal of Power Sources, 277, 205–214. DOI 10.1016/j.jpowsour.2014.12.020. [Google Scholar] [CrossRef]
23. Jiao, Z., Ran, L., Zhang, Y., Ren, Y. (2021). Robust vehicle-to-grid power dispatching operations amid sociotechnical complexities. Applied Energy, 281, 115912. DOI 10.1016/j.apenergy.2020.115912. [Google Scholar] [CrossRef]
24. Zhang, T., Chen, X., Yu, Z., Zhu, X., Shi, D. (2018). A monte carlo simulation approach to evaluate service capacities of EV charging and battery swapping stations. IEEE Transactions on Industrial Informatics, 14(9), 3914–3923. DOI 10.1109/TII.2018.2796498. [Google Scholar] [CrossRef]
25. Zeng, B., Sun, B., Wei, X., Gong, D., Zhao, D. et al. (2020). Capacity value estimation of plug-in electric vehicle parking-lots in urban power systems: A physical-social coupling perspective. Applied Energy, 265, 114809. DOI 10.1016/j.apenergy.2020.114809. [Google Scholar] [CrossRef]
26. Liu, N., Chen, Q., Lu, X., Liu, J., Zhang, J. (2015). A charging strategy for PV-based battery switch stations considering service availability and self-consumption of PV energy. IEEE Transactions on Industrial Electronics, 62(8), 4878–4889. DOI 10.1109/TIE.2015.2404316. [Google Scholar] [CrossRef]
27. Zheng, Y., Dong, Z. Y., Xu, Y., Meng, K., Zhao, J. H. et al. (2014). Electric vehicle battery charging/Swap stations in distribution systems: Comparison study and optimal planning. IEEE Transactions on Power Systems, 29(1), 221–229. DOI 10.1109/TPWRS.2013.2278852. [Google Scholar] [CrossRef]
 | This work is licensed under a Creative Commons Attribution 4.0 International License, which permits unrestricted use, distribution, and reproduction in any medium, provided the original work is properly cited. |