| Energy Engineering |
DOI: 10.32604/EE.2022.015397
ARTICLE
Using Grey Target Theory for Power Quality Evaluation Based on Power Quality Monitoring Data
State Grid Qingdao Power Supply Company, Qingdao, 266000, China
*Corresponding Author: Qiang Yu. Email: runman53@foxmail.com
Received: 16 December 2020; Accepted: 04 March 2021
Abstract: Smart grid puts forward higher requirements for power quality. Power quality evaluation can provide a decision-making basis for quality improvement. Based on power quality monitoring data, a grey target method is proposed for power quality evaluation. The grey target is composed of power quality evaluation standard and power quality monitoring data to be evaluated. Combining with the characteristics of each power quality evaluation index, the target center of the whole grey target system is found. Then, the power quality monitoring data to be evaluated and the power quality standard mode are compared and analyzed to construct the power quality grey correlation difference information space. Finally, the target center coefficient and target degree of power quality are calculated to realize the comprehensive evaluation of power quality, and the evaluation grade of power quality monitoring data to be evaluated is obtained. Compared with the evaluation results of the existing literature, the effectiveness of the proposed method is verified, which shows that grey target theory is reasonable in the comprehensive evaluation of power quality.
Keywords: Smart grid; power quality evaluation; grey target theory; monitoring data
With the development of economy and the gradual maturity of power electronic technology, the load of power system presents the trend of diversification and complexity, and the electromagnetic environment of power system is facing severe test. A large number of nonlinear, impulsive and unbalanced loads are connected to the power grid, which seriously reduces the power quality of the power grid. It is an important feature of smart grid to provide high-quality power for economic development [1,2]. Tang et al. [3] constructed the index of power quality under the framework of smart grid, which expands the idea of comprehensive evaluation of power quality under the condition of smart grid. Omar et al. [4] presented a novel contribution of a low complexity control scheme for voltage control of a dynamic voltage restorer (DVR). The scheme proposed utilizes an error-driven proportional–integral–derivative (PID) controller to guarantee better power quality performance in terms of voltage enhancement and stabilization of the buses, energy efficient utilization, and harmonic distortion reduction in a distribution network. Aleem et al. [5] presented a novel approach to optimal planning of a resonance-free C-type harmonic filter to minimize the harmonic overloading level of frequency-dependent components in a non-sinusoidal distribution system.
Traditional power quality indicators include voltage deviation, frequency deviation, power supply reliability, etc. With the continuous expansion of the power system, the power load port is becoming more and more complex. Power quality problems such as voltage sag and short-time interruption, voltage fluctuation and flicker, interharmonics, instantaneous overvoltage and other power quality problems have attracted more and more attention. On the one hand, it can provide direct reference for power generation and transmission to improve power quality; on the other hand, it can provide decision support for power consumers to choose power suppliers or power types. It is no exaggeration to say that the improvement of power quality analysis, control, evaluation and management is not only an effective way to improve the power market, but also the inherent requirement of building a strong smart grid.
People pay more and more attention to the problem of power quality [6–9]. Power departments in many countries have formulated reasonable power quality standards according to their own characteristics, and have made detailed provisions on various indicators of power quality. By installing the power quality detection device in the appropriate position, the evaluation grade of each sub index of power quality can be obtained after sorting and analyzing. If the power quality indicators of a power grid are qualified, then the power quality comprehensive evaluation results of the power grid are also qualified. However, in the actual production, the indicators of power quality often do not belong to the same level, but belong to many different levels. Therefore, the evaluation of a certain measure standard of a certain power grid alone cannot fully and accurately reflect the power quality of the power grid. Only by integrating the various indicators of computer quality and evaluating the power quality by some mathematical means, can the power quality be comprehensively and accurately evaluated.
The remainder of this paper is organized as follows: Section 2 reviews some previous studies relevant to power quality evaluation. Section 3 gives the details of the proposed method. In Section 4, a case study to test the effectiveness of the proposed method is presented. Final conclusions are summarized in Section 5.
At present, a series of power quality standards [10] have been formulated at home and abroad, but there is no clear specification for comprehensive evaluation. In the comprehensive evaluation of power quality, fuzzy evaluation [11] is a commonly used method, but using this method, we need to determine the index weight in advance, and the selection of membership function is easily affected by human subjective factors. Therefore, Yin et al. [12] applied the cloud reasoning model to the comprehensive evaluation of power quality, which can determine the index membership without membership function, and overcomes the inherent defects of membership function. In addition, according to data envelopment analysis (DEA), Chai et al. [13] solved the problem that fuzzy evaluation needs to determine the weight of indicators in advance, but the principle of selecting the nearest will cover up the difference between the two relative efficiency values, which may cause serious judgment error.
The above methods only use a certain time section data for evaluation, which cannot accurately reflect the actual changing power quality level. Therefore, according to the double incentive control line and competition mechanism, Ouyang et al. [14,15] proposed a dynamic evaluation model to reflect the change trend of the evaluation object in the evaluation time, but ignored the impact of the actual data distribution on the comprehensive evaluation.
Other representative studies are as follows. Power quality evaluation data are heterogeneous and fluctuating, and there are large subjective factors in the evaluation process. To solve this problem, Chen et al. [16] proposed a power quality evaluation method based on incentive punishment factor and the ordered weighted aggregation (OWA) operators. To get a more reasonable combination weights, the improved expert scoring method is combined with critic method to calculate the combinatorial weight. Yu et al. [17] established a comprehensive evaluation method based on combination weighting method and TOPSIS to sort the evaluation points. Yang et al. [18] summarized the key characteristic parameters of harmonic, voltage sag and three-phase unbalance and obtained the unified expression of node voltage matrix, and then included the equipment sensitivity in the evaluation index to make the evaluation result more user oriented. Dong et al. [19] used improved analytic hierarchy process (IAHP) and improved entropy weight method (IEWM) to determine the subjective weights and objective weights of each indicator respectively and calculated the comprehensive weight of each power quality indicator on this basis with the principle of maximization deviation, which could conquer the incomprehensiveness, bias and other disadvantages of traditional power quality evaluation method. Elbasuony et al. [20] proposed a unified index for power quality assessment in different distributed generation systems using AHP. Considering that the evaluation indexes of power quality of wind farm are uncertain, Wang et al. [21] applied set pair analysis theory in the comprehensive evaluation on power quality of wind farm.
Generally, it can be concluded that most of the existing methods do not consider the change process and distribution of long-term power quality monitoring data, which is difficult to reflect the overall situation of power quality in a long time scale, and cannot reflect the accumulation effect of power quality problems. In this paper, a grey target method is proposed for power quality evaluation based on power quality monitoring data. The details of the proposed method are given in sequence as shown below. This paper can obtain the comprehensive evaluation results of long time scale, and reflect the overall situation and trend information of power quality long-term monitoring data.
The overall framework of the proposed grey target method for power quality evaluation is shown in Fig. 1. Power quality evaluation standard and power quality monitoring data to be evaluated are adopted to compose the grey target. The target center of the whole grey target system is determined based on the characteristics of each power quality evaluation index. The power quality grey correlation difference information space is constructed by comparing and analyzing the power quality monitoring data to be evaluated and the power quality standard mode. At last, by calculating the target center coefficient and target degree of power quality, the comprehensive evaluation of power quality is realized and the evaluation grade of power quality monitoring data to be evaluated is obtained.
In general, the concept of power quality is the same as that of high-quality power supply. However, due to the different perspectives of people, so far, there is still no accurate definition of the technical meaning of power quality. From the practical point of view, the power quality is analyzed in detail, which is divided into the following four items. (1) Voltage quality. It refers to the deviation between the actual voltage value of the power grid and the rated voltage value, to measure whether the power supplied by the power sector to power users is qualified or not. It includes: voltage deviation, three-phase voltage unbalance, frequency deviation, voltage fluctuation and flicker, voltage sag and short-time interruption, instantaneous change of voltage value, under voltage and over voltage, voltage harmonic and inter harmonic, voltage notch, etc. (2) Current quality. It is a concept closely related to voltage quality. In order to efficiently transmit and utilize electric energy, it is necessary to ensure that the current is a sinusoidal waveform at a single frequency, and the current waveform and voltage waveform have the same phase value. It includes: current phase value leading or lagging, current harmonics, interharmonics (fractional harmonics), subharmonics (fractional harmonics with frequency lower than fundamental frequency). (3) Power supply quality. It can be subdivided into technical component and non-technical component. Technical components refer to power supply reliability and power supply voltage quality. The non-technical component refers to the service quality of the power sector, which is a relatively new concept and is also a very important indicator under the conditions of power market. With the further development of smart grid, the power supply department can improve the service quality with the help of advanced intelligent equipment. However, it is more important for the managers and executors to change the corresponding concepts and work ideas, so as to truly improve the awareness of high-quality service. (4) Power quality. It is proposed from the perspective of power users, including current quality, payment records, stealing behavior, etc.

Figure 1: Overall framework of the proposed grey target method
At present, there is no clear definition of power quality. With the development of economy and the progress of technology, it will contain more abundant contents and cover more fields. On the basis of summarizing and analyzing the existing researches, this paper puts forward the evaluation index system of power quality which is composed of nine indexes as (A1–A9): voltage deviation, voltage sag, three phase unbalance, voltage fluctuation, voltage flicker, voltage harmonics, frequency deviation, power supply reliability and service nature of power supply.
The grey target theory is the grey evaluation theory put forward by Deng et al. [22–25], which has no specific requirements for analyzing things. It is supposed wi represents the ith standard mode sequence in power quality evaluation system and w(k) represents the kth evaluation index parameter pattern sequence of power quality. Standard mode wi is built as:
Here, i = 1, 2,…, m. n is the number of evaluation indexes considered in the comprehensive evaluation of power quality, and m is the number of power quality evaluation grades.
Evaluation index parameter pattern w(k) is built as:
For the benefit type evaluation index, the greater the expected value, the better, with the characteristics of maximum polarity. For the cost type evaluation index, the smaller the expected value, the better, with the characteristics of minimum polarity. According to the polarity characteristics of each index in the power quality comprehensive evaluation index system, the optimal mode sequence w0 is obtained as follows:
For the benefit type evaluation index,
For the cost type evaluation index,
The target point of power quality comprehensive evaluation is established by the optimal mode sequence
It is supposed that
where j = 1, 2,…, p and p is number of power quality samples to be evaluated. Let yj(k) =
Let
Here,
where ζ = 0.5, j = 1, 2,…, p and k = 1, 2,…, n.
Then the target degree of yj is obtained as:
where φk is the weight value of each evaluation index of power quality and
If target degree
The power quality measured data of 5 observation points in a certain place [26] are shown as follows. The proposed weighted grey target theory is used to evaluate the power quality.
(1) Observation point 1. A1: 3.21%, A2: 0.8, A3: 0.83%, A4: 1.33%, A5: 0.473%, A6: 1.72%, A7: 0.092 Hz, A8: 0.83, A9: 0.83.
(2) Observation point 2. A1: 6.68%, A2: 0.16, A3: 1.36%, A4: 1.53%, A5: 0.847%, A6: 4.28%, A7: 0.156 Hz, A8: 0.76, A9: 0.71.
(3) Observation point 3. A1: 4.35%, A2: 0.52, A3: 1.35%, A4: 1.95%, A5: 0.634%, A6: 2.67%, A7: 0.118 Hz, A8: 0.8, A9: 0.86.
(4) Observation point 4. A1: 5.33%, A2: 0.59, A3: 1.74%, A4: 1.37%, A5: 0.826%, A6: 3.36%, A7: 0.179 Hz, A8: 0.74, A9: 0.68.
(5) Observation point 5. A1: 4.22%, A2: 0.49, A3: 1.83%, A4: 1.58%, A5: 0.828%, A6: 4.57%, A7: 0.189 Hz, A8: 0.76, A9: 0.78.
The above nine power quality indexes are used as evaluation factors. Considering the effectiveness of the evaluation results and the complexity of the calculation process, the power quality is divided into five grades. The grade standard of power quality is shown in Table 1. The relevant data in Table 1 are for 380 V distribution system.

Using the method of calculating weight [27], the weight of power quality index is calculated as: φ1 = 0.1659, φ2 = 0.0271, φ3 = 0.1669, φ4 = 0.1646, φ5 = 0.0835, φ6 = 0.1376, φ7 = 0.0244, φ8 = 0.0725 and φ9 = 0.1575.
According to Table 1, the optimal mode sequence is obtained as: w0 = {1.2, 0.9, 0.5, 0.5, 0.2, 1.0, 0.05, 0.95, 0.90}. By Eq. (5) the gray target transformation of w0 is carried out as: T(w0) = y0 = {1, 1, 1, 1, 1, 1, 1, 1, 1}.
Then based on the power quality measured data of 5 observation points above, the power quality monitoring data sequence to be evaluated of observation point 1 is
By Eq. (5), the gray target transformation of

After gray target transformation, it is obtained that
By Eq. (7), the difference information is obtained as shown in Table 3.

By Eqs. (8) and (9),
Then by Eq. (6), the target center coefficient of y1(k) and y0(k) is obtained as shown in Table 4.

The target degree of y1 is obtained by substituting the target center coefficient shown in Table 4 into Eq. (10). That is:
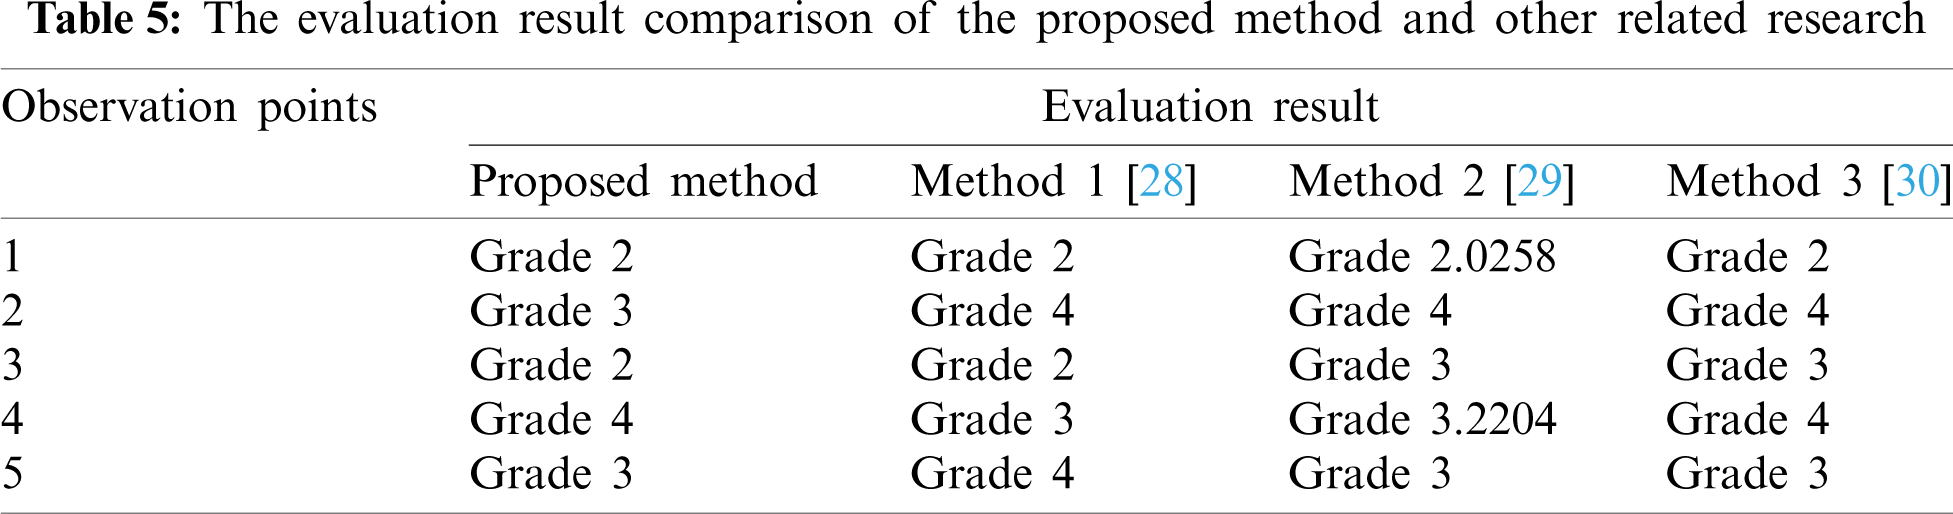
According to the results in Table 5, the evaluation result of the five observation points obtained in this paper are basically consistent with the evaluation results of the existing research [28–30]. Combined with the power quality index values of each observation point in this paper, the result obtained in this paper is reliable.
In this paper, the grey target model is composed of power quality evaluation standard and power quality monitoring data to be evaluated. Combined with the characteristics of each power quality evaluation index, the target center of the whole gray target system is found, and then the power quality monitoring data to be evaluated and the power quality standard mode are compared and analyzed, and the power quality grey correlation difference information space is constructed. Finally, the target center coefficient and target degree of power quality are calculated. The comprehensive evaluation of power quality is realized, and the evaluation grade of power quality monitoring data to be evaluated is obtained.
The power quality of five observation points in a certain place is evaluated by using the weighted grey target theory, and the results are compared with the evaluation results of the existing literature, which further verifies the effectiveness of the model, and shows that the weighted grey target theory is reasonable for the comprehensive evaluation of power quality. By the proposed method based on grey target theory the comprehensive evaluation results of long time scale can be obtained and the overall situation and trend information of power quality long-term monitoring data can be reflected.
Funding Statement: The authors received no specific funding for this study.
Conflicts of Interest: The authors declare that they have no conflicts of interest to report regarding the present study.
1. Hafiz, H., Nadeem, J., Sohail, I., Qadeer, H., Khursheed, A. et al. (2018). An efficient demand side management system with a new optimized home energy management controller in smart grid. Energies, 11(1), 190. DOI 10.3390/en11010190. [Google Scholar] [CrossRef]
2. Mengelkamp, E., Notheisen, B., Beer, C., Dauer, D., Weinhardt, C. (2018). A blockchain-based smart grid: Towards sustainable local energy markets. Computer Science-Research and Development, 33(1–2), 207–214. DOI 10.1007/s00450-017-0360-9. [Google Scholar] [CrossRef]
3. Tang, H., Gao, J. W. (2010). A multi-objective input-output optimization pricing model for differential price. Journal of Yangzhou University (Natural Science Edition), 13(4), 46–50. DOI 10.19411/j.1007-824x.2010.04.012. [Google Scholar] [CrossRef]
4. Omar, I., Abdel Aleem, H. E., El-Zahab, E. A., Algablawy, M., Ali, M. (2019). An improved approach for robust control of dynamic voltage restorer and power quality enhancement using grasshopper optimization algorithm. ISA Transactions, 95, 110–129. DOI 10.1016/j.isatra.2019.05.001. [Google Scholar] [CrossRef]
5. Aleem, A., Zobaa, F., Balci, E., Ismael, M. (2019). Harmonic overloading minimization of frequency-dependent components in harmonics polluted distribution systems using harris hawks optimization algorithm. IEEE Access, 9, 100824–100837. DOI 10.1109/ACCESS.2019.2930831. [Google Scholar] [CrossRef]
6. Luo, Q., Zhang, X., Luo, C., Li, J., Chao, Q. (2019). Quality evaluation and optimum scheme of electric energy metering instruments based on Big data technology. Journal of Xinjiang University (Natural Science Edition), 36(3), 354–360. DOI 10.13568/j.cnki.651094.2019.03.014. [Google Scholar] [CrossRef]
7. Gandoman, F. H., Ahmadi, A., Sharaf, A. M., Siano, P., Agelidis, V. G. (2018). Review of facts technologies and applications for power quality in smart grids with renewable energy systems. Renewable and Sustainable Energy Reviews, 82, 502–514. DOI 10.1016/j.rser.2017.09.062. [Google Scholar] [CrossRef]
8. Ribeiro, M. V., Romano, J. M. T., Duque, C. A. (2004). An improved method for signal processing and compression in power quality evaluation. IEEE Transactions on Power Delivery, 19(2), 464–471. DOI 10.1109/TPWRD.2003.822497. [Google Scholar] [CrossRef]
9. Morsi, W. G., El-Hawary, M. E. (2011). Power quality evaluation in smart grids considering modern distortion in electric power systems. Electric Power Systems Research, 81(5), 1117–1123. DOI 10.1016/j.epsr.2010.12.013. [Google Scholar] [CrossRef]
10. Liu, Y., Feng, D., Lin, C., Zhang, Y. (2020). Current status and development trend of power quality comprehensive assessment. Power System Protection and Control, 48(4), 167–176. DOI 10.19783/j.cnki.pspc.190514. [Google Scholar] [CrossRef]
11. Yang, J., Ouyang, S., Shi, Y., Huang, R., Liu, Z. (2014). Combined membership function and its application on fuzzy evaluation of power quality. Advanced Technology of Electrical Engineering and Energy, 33(2), 63–69. DOI 10.3969/j.issn.1003-3076.2014.02.012. [Google Scholar] [CrossRef]
12. Yin, Y., Wu, R., Chang, B. (2018). Knowledge cloud evaluation service model and method for power quality of complex power grid. Electric Power Automation Equipment, 38(5), 241–247. DOI 10.16081/j.issn.1006-6047.2018.05.034. [Google Scholar] [CrossRef]
13. Chai, P., Sun, Y., Shen, K., Dong, J. (2016). Research on synthetic evaluation method of power quality based on data envelopment analysis. Electrical Measurement & Instrumentation, 53(4), 124–128. DOI 10.3969/j.issn.1001-1390.2016.04.022. [Google Scholar] [CrossRef]
14. Ouyang, S., Shi, Y., Liu, Y. (2012). Dynamic comprehensive evalua tion of power quality for regional grid based on double inspiriting control lines. Power System Technology, 36(12), 205–210. DOI 10.13335/j.1000-3673.pst.2012.12.008. [Google Scholar] [CrossRef]
15. Ouyang, S., Yang, J., Shi, Y. (2015). Dynamic evaluation method of power quality based on the competitive mechanism. Proceedings of the CSU-EPSA, 27(2), 1–7. DOI 10.3969/j.issn.1003-8930.2015.02.001. [Google Scholar] [CrossRef]
16. Chen, J., Pan, G., Ouyang, J., Zhang, L. (2020). A power quality evaluation method for distribution system with renewable energy. International Journal of Electronics, 107(5), 792–807. DOI 10.1080/00207217.2019.1680745. [Google Scholar] [CrossRef]
17. Yu, Y., Cai, C., Ma, C. (2019). Power quality evaluation based on combinatorial weighting method TOPSIS. IEEE PES Asia-Pacific Power and Energy Engineering Conference, Macao, China. DOI 10.1109/APPEEC45492.2019.8994731. [Google Scholar] [CrossRef]
18. Yang, F., Wu, Y., Shen, Y., Zhong, P., Wang, Y. et al. (2019). Power quality evaluation method for multi-power quality problem in distribution network. IEEE Sustainable Power and Energy Conference: Grid Modernization for Energy Revolution, pp. 2879–2884. Beijing, China. DOI 10.1109/iSPEC48194.2019.8975062. [Google Scholar] [CrossRef]
19. Dong, Y., Liu, Y., Yin, Z. (2018). A comprehensive combinatorial weighting method for power quality evaluation based on maximization deviation. 2nd IEEE Conference on Energy Internet and Energy System Integration, Beijing, China. DOI 10.1109/EI2.2018.8582053. [Google Scholar] [CrossRef]
20. Elbasuony, S., Abdel, A., Shady, H. E., Ibrahim, M., Sharaf, M. (2018). A unified index for power quality evaluation in distributed generation systems. Energy, 149, 607–622. DOI 10.1016/j.energy.2018.02.088. [Google Scholar] [CrossRef]
21. Wang, H., Jin, H., Liu, J., Wei, Q., Cai, N. (2016). Power quality evaluation with set pair analysis model based on entropy weight. ICIC Express Letters, 10(1), 83–88. DOI 10.1754/ICICEL.2016.1.83. [Google Scholar] [CrossRef]
22. Deng, J. (2000). Positional target in grey target theory. The Journal of Grey System, 12(1), 1–8. DOI 10.2235/jgreysystem.2000.deng.1.1. [Google Scholar] [CrossRef]
23. Deng, J. (2000). Definitions on grey target. The Journal of Grey System, 12(1), 34–41. DOI 10.2235/jgreysystem.2000.deng.1.34. [Google Scholar] [CrossRef]
24. Chen, S., Li, Z., Xu, Q. (2006). Grey target theory based equipment condition monitoring and wear mode recognition. Wear, 260(4–5), 438–449. DOI 10.1016/j.wear.2005.02.085. [Google Scholar] [CrossRef]
25. Liu, S., Yang, Y., Xie, N., Forrest, J. (2016). New progress of grey system theory in the new millennium. Grey Systems Theory & Application, 6(1), 2–31. DOI 10.1108/GS-09-2015-0054. [Google Scholar] [CrossRef]
26. Huang, J., Zhou, L., Li, Q. H., Zhang, F., Liu, H. Y. (2007). Evaluation of power quality based on the method of matter-element. Journal of Chongqing University (Natural Science Edition), 30(6), 25–29, 55. DOI 10.3969/j.issn.1000-582X.2007.06.007. [Google Scholar] [CrossRef]
27. Li, L., Mao, C., Lei, B., Gao, Y., Liu, Y. et al. (2020). Decision-making of product-service system solution selection based on integrated weight and technique for order preference by similarity to an ideal solution. IET Collaborative Intelligent Manufacturing, 2(3), 102–108. DOI 10.1049/iet-cim.2020.0003. [Google Scholar] [CrossRef]
28. Tang, H. Z., Peng, J. C. (2003). Research on synthetic and quantificated appraisal index of power quality based on fuzzy theory. Power System Technology, 27(12), 85–88. DOI 10.3321/j.issn:1000-3673.2003.12.019. [Google Scholar] [CrossRef]
29. Zhou, L., Liu, Q. H., Zhang, F. (2007). Application of genetic projection pursuit interpolation model on power quality synthetic evaluation. Power System Technology, 31(7), 32–35. DOI 10.3321/j.issn:1000-3673.2007.07.007. [Google Scholar] [CrossRef]
30. Zhao, X., Zhao, C. Y., Jia, X. F., Li, G. Y. (2005). Fuzzy synthetic evaluation of power quality based on changeable weight. Power System Technology, 29(6), 11–16. DOI 10.3321/j.issn:1000-3673.2005.06.003. [Google Scholar] [CrossRef]
 | This work is licensed under a Creative Commons Attribution 4.0 International License, which permits unrestricted use, distribution, and reproduction in any medium, provided the original work is properly cited. |