| Energy Engineering |
DOI: 10.32604/EE.2022.015700
ARTICLE
Evaluation of Green Development Level of Electric Energy in Distribution Network Based on Multilevel Fuzzy Comprehensive Evaluation
1School of Economics and Management, North China Electric Power University, Beijing, 102206, China
2School of Economics and Management, Yan’an University, Yan’an, 71600, China
3State Grid Economic and Technological Research Institute Co., Ltd., Beijing, 102209, China
4School of Electrical and Electronic Engineering, North China Electric Power University, Beijing, 102206, China
*Corresponding Author: Jing Wang. Email: wwjjn@ncepu.edu.cn
Received: 07 January 2021; Accepted: 27 April 2021
Abstract: At present, there are few studies on the comprehensive evaluation of green power grid development in China, and all aspects of green power grid need to be evaluated. Therefore, this paper studies the green development level of power distribution network. This paper proposes a multi-level fuzzy comprehensive evaluation method, which first needs to classify the influencing factors. Therefore, this paper constructs an indicator system for the evaluation of green development of power distribution network from three dimensions. In order to avoid the influence of subjective factors, this paper adopts the model combining analytic hierarchy process and entropy weight method to give weight to indexes. Finally, five typical regions are selected for empirical analysis. The results show that the model established in this paper can reflect the green development level of power distribution network in each region and put forward relevant improvement suggestions for each region.
Keywords: Incremental distribution network; fuzzy comprehensive evaluation; entropy weight method-analytic hierarchy process; green development
As China's economic strength continues to grow, all walks of life have higher and higher demands for electricity and power supply. In recent years, countries around the world have paid more and more attention to sustainable economic development. In order to cope with climate change, energy shortage and other problems, countries have begun to actively develop green economy, mainly with the goal of protecting the environment, and further harmonizing the balance between economic and environmental development. According to the annual Development Report of The Power Industry in China 2020 released by the China Electricity Council, the installed capacity of full-caliber power generation across the country reached 2010.06 million kilowatts, an increase of 5.8% over the previous year. Among them, 358.04 million kilowatts of hydropower, an increase of 1.5% over the previous year (30.29 million kilowatts of pumped storage, an increase of 1.0% over the previous year); Grid-connected wind power was 209.15 million kw, up 13.5% over the previous year. The grid-connected solar power generated 204.18 million kilowatts, up 17.1% over the previous year. China's emissions of soot, sulfur dioxide and nitrogen oxide from electric power were about 180,000 tons, 890,000 tons and 930,000 tons, respectively, down about 12.2%, 9.7% and 3.1% from the previous year [1].
It can be seen that China's power grid development mode is changing, and actively realizing the green development of power grid can promote the realization of China's green economic development. At the same time, the gradual implementation of new technologies, such as new energy vehicles and new home appliances, require more consideration of green development factors in the planning and construction of distribution networks. However, so far, there has not been a judging system for the green development level of electric power in the distribution network, and the research mainly focuses on the comprehensive evaluation of distribution network and the evaluation of power green development. Based on this, it is urgent to study the evaluation of the green development level of electric energy in the distribution network, which is helpful to guide the reliability, security and stability of power supply in the regional distribution network.
At present, many scholars have conducted researches on the evaluation of distribution network, focusing on the aspects of power supply quality, power supply reliability and economy. Chen et al. [2] established the price index system from the three aspects of topological structure, economy and reliability, constructed the hybrid multi-attribute evaluation model to evaluate and optimize the distribution network structure, and obtained the optimal network structure suitable for construction under the differentiated demands of different regions. Wang et al. [3] proposed a hierarchical analysis method based on extension cloud to evaluate the economic operation of the distribution network, and proposed an optimization and transformation plan for the distribution network. Xiong et al. [4] made a comprehensive evaluation of distribution networks in 108 counties by using principal component analysis, and concluded the main problems existing in the development of distribution networks. Guang et al. [5] extracted six indexes to evaluate the reliability of distribution network, and found that the sensitivity and proportion of consumers have significant influences on the evaluation results. Chen et al. [6] evaluated the reliability of distribution network and reflected the reliability of distribution network by constructing index system to evaluate the importance of load. Bai et al. [7] constructed indicators from the aspects of economy, quality, safety and environmental protection, and selected different objective functions to comprehensively evaluate the operation mode of distribution network. Sun et al. [8] evaluated the urban distribution network and built an evaluation index system from four aspects, namely reliability, economy, low-carbon and intelligence. Ge et al. [9] established evaluation indexes and evaluation system for quantitative evaluation of distribution network from the aspects of safety and reliability. Luo [10] classified the indicators from the perspectives of technology, economy and green development, and constructed the green power grid evaluation system to evaluate the performance of urban power grid. Xiao et al. [11] set up evaluation index system from the aspects of transmission network and distribution network respectively, and then evaluated the development level of power network through specific indicators. Liu et al. [12] evaluated the development level of power grid through multi-level fuzzy comprehensive evaluation method, and constructed a multi-level power grid evaluation index system from five dimensions of safety, economy, intelligence, coordination and greenness. Yuan et al. [13] conducted a comprehensive evaluation of distribution networks and studied the power supply quality, power grid structure and investment benefits by using analytic hierarchy process.
The research on the effectiveness of green development of power grids mainly focuses on green development evaluation and green development realization path. Hua et al. [14] proposed to achieve green development of the power industry through emission reduction and consumption reduction, to reduce losses in power production and transmission, and to increase the proportion of green energy in the energy structure. Mao et al. [15] evaluated the greening level of power grid engineering from the aspects of technology, economy and green development, and put forward relevant suggestions and measures. Liao et al. [16] studied the green management of electric energy in power grid and established a green evaluation system from the three aspects of power grid, power supply and source network coordination. Zou et al. [17] evaluated the green development of Hainan Power Grid and constructed a multi-factor comprehensive evaluation index to reflect the green development of Hainan Power. Gu et al. [18] studied and established a green development evaluation system and method suitable for power grid, and then classified the indexes that affect the green development process of power grid. Shan et al. [19] analyzed the power market trading mechanism from the perspective of renewable energy generation to promote the development of green power market. Huang et al. [20] evaluated the development of green cities and constructed an index system from three dimensions of environmental quality, green life and green production, including 29 indicators. Qusay et al. [21] evaluated and optimized the grid-connected photovoltaic power generation system in clean energy power generation. Wu et al. [22] proposed a green assessment method from the perspective of economy and resource utilization to evaluate the green development of power grid. Cheng et al. [23] used fuzzy analytic hierarchy process to evaluate urban green electric power, and concluded that the share of renewable energy had a great impact on urban green electric power.
Regarding the evaluation methods of the green development level of the distribution network, some methods such as gray correlation method and fuzzy evaluation method are mainly used. Solomie et al. [24] established a joint optimization model of AHP and maintenance strategy for evaluation. Sanchez-Lozano et al. [25] used grey correlation degree and improved entropy weight method to evaluate the dispatching of distribution network. Faran et al. [26] established a fuzzy evaluation model to evaluate 13 categories of indexes related to power grid energy conservation and emission reduction. Li et al. [27] used the equilibrium-principal component analysis method to realize the quantitative analysis of the planning method through the relative distance model involving standardization. Li et al. [28] provided a three-stage decision making framework based on multi-standard decision making method (MCDM) for evaluation and decision making. Wu et al. [29] determined the development level by the comprehensive score of adaptive neurofuzzy reasoning system (ANFIS) based on principal component analysis. Liu et al. [30] adopted an improved ISM model to select influencing factors, and adopted fuzzy order relation analysis method (G1 method) to make up for the shortcomings of traditional methods. Wu et al. [31] used TiFN-Fuzzy DEMATEL to determine and evaluate weights, and used mixed evaluation method to avoid the uncertainty of decision making. However, all the above evaluation methods of power grid development level have some limitations and depend too much on the judgment of experts. On this basis, the multilevel fuzzy comprehensive evaluation method is introduced. Liu et al. [32] used a combination of quantitative and qualitative analysis, combined the analytic hierarchy process (AHP) and particle swarm optimization (PSO), and used the multi-level fuzzy comprehensive evaluation (FCE) method for evaluation. Xiang et al. [33] used AHP-inverse entropy weight method to give weights and evaluated the distribution network through fuzzy comprehensive evaluation. Chen et al. [34] evaluated transmission network planning based on combinatorial fuzzy comprehensive evaluation. Dehdashti [35] puts forward a new concept of “energy bank” in view of the development status of green power. This concept mainly refers to the collection and storage of energy, which can promote the energy trade between a large number of renewable resources required by electricity and improve the level of green development of power. Mohammadreza et al. [36] mainly studies the energy use efficiency of the supply side of the power system and the penetration rate of green resources. At the same time, the concept of green virtual resources (GVRS) is proposed and the economic efficiency maximization model of micro-grid energy management is constructed for research. Qusay [37] promoted the green development of electricity by studying a renewable energy system, and studied the photovoltaic solar power generation system used in a typical family in Iraq. The results showed that the cost of grid-connected photovoltaic power generation was lower. Muhammad [38] studies intelligent power distribution system. In distributed power generation, a variety of green energy is used to promote the generation of clean energy and improve the green development level of power from the source. In addition, the optimization and coordination management of electric energy are introduced. Schultis et al. [39] makes a comprehensive evaluation of different reactive power control strategies in low-voltage networks with high share of power consumption. The results show that in the transmission and distribution links, the use of power generating inverter to eliminate the violation of feeder voltage will cause disadvantages such as excessive load of distribution transformer and excessive loss of power network.
To sum up, many scholars have obtained some research results centering on the evaluation of distribution network, but failed to accurately evaluate the green development level of electric energy, mainly for three reasons, namely:
1. The construction of the evaluation index system is based on the reliability and economy dimension, rarely involving the green development dimension, and rarely evaluating the green development level of electric energy in the distribution network.
2. The construction of the evaluation index system lacks systematization and completeness, and the comprehensive evaluation method also needs to be further optimized. The factor analysis of the green development level is not comprehensive, the evaluation index system of the green development level of electric energy of distribution network is not perfect, and the empirical case study of the green development level of distribution network is not enough.
3. Existing research mainly focuses on economics, technology, environment, etc., and lacks research on the level of green development at different stages of power generation, transmission and distribution, and power sales. Different stages have different influences on the green development of power distribution network, and the current research rarely constructs the index system from these stages, and the final evaluation result is limited to a certain aspect of the green development of power distribution network.
Based on this, the research innovation points of this paper are mainly reflected in three aspects, specifically described as follows:
1. Based on the concept of green development of electric energy and the principles of specificity, realizability and relevance, the main impact indicators related to green development of electric energy are extracted from the three links of power generation side, transmission and distribution side and electricity sale side of the distribution network system. The construction of green development index system of power distribution network is helpful to evaluate the green development level of power distribution network more completely and systematically.
2. A complete evaluation model for the green development level of power distribution network was constructed, and a multi-level fuzzy comprehensive evaluation method was selected on the basis of fuzzy comprehensive evaluation theory to improve the accuracy of evaluation results. In the process of index processing, the method of combining subjective and objective is adopted, and the entropy weight method and the analytic hierarchy method are used to avoid the subjectivity of the processing results.
3. In order to verify the effectiveness of the proposed evaluation method for the development level of green electric energy in distribution networks, the paper selects distribution networks in five typical regions for example analysis. According to the data obtained from the survey, the green development level of power grid in different stages in five regions is evaluated and compared longitudinally. Then, the green development level of distribution networks in different regions at the same stage is compared horizontally, and the data comparison curve is drawn to more clearly reflect the green development level of power of distribution networks in different regions.
The main content and structure of this paper are as follows. Section 2 combines the characteristics of each stage of the distribution network, constructs an evaluation index system for the green development level of the power distribution network from the three-stage dimensions of the power generation side, the power transmission and distribution side and the power sales side, and provides a detailed explanation of the indicators. The third part describes the method of index weighting, which combines subjective and objective methods to avoid the influence of personal preference on the evaluation results. The fourth part introduces the basic theory of multilevel fuzzy comprehensive evaluation as well as the model construction and calculation process. In the fifth part, 5 typical regions are selected to comprehensively evaluate the green development of electric energy of distribution network, and suggestions are provided for improving the green development level of distribution network. The sixth part summarizes the research results of this paper to provide reference for the follow-up research.
2 Design of Evaluation Index System for Green Development Level of Power Distribution Network
2.1 Selection of Initial Evaluation Index
There are many factors affecting the green development level of electric energy in the distribution network. This paper selects indicators to evaluate the green development level of electric energy from three aspects of the power generation side, transmission and distribution side and electricity sales side of the distribution network system. The specific indicators are explained as follows.
The green environmental protection on the power side refers to the improvement of the power supply. The green development level on the power side can be reflected from three aspects: power access capacity, emission reduction effect and consumption reduction effect. At the generation side, the green level can be improved by adjusting the installed power capacity, increasing the proportion of new energy installed and optimizing the ratio of power structure. In this stage, seven three-level indicators are determined from three aspects: power access capacity, emission reduction effect and consumption reduction effect.
(1) Power access capability
Power access capacity refers to the power supply structure that is connected to the generation side of the distribution network. China has traditionally been based on coal-fired thermal power units, but now it has access to clean energy such as wind and solar energy. By improving the power supply structure, the power supply structure has been transformed from the traditional single thermal power to diversified energy structures such as wind power, photovoltaic power and hydropower. Increasing the installed capacity of clean energy and the proportion of power generation, optimizing the power supply structure ratio, and promoting the development of new energy power generation technologies are conducive to improving the level of green development on the power generation side of the distribution network. The calculation formula for the proportion of electricity generated by clean energy is as follows.
In the formula,
(2) Emission reduction effectiveness
Emission reduction effectiveness refers to the emission reduction of carbon dioxide and sulfur dioxide per unit of electricity generated by power plants. The lower the carbon dioxide and sulfur dioxide emissions of power plants, the higher the emission reduction, which means that the higher the carbon emission reduction on the power generation side, the higher the green development of power. At present, the power generation side of China has eliminated the power plants with low efficiency and high pollution, and established the power plants with high efficiency and low pollution. With the increase in the installed capacity of power sources and the addition of clean energy such as wind power and solar energy, the emission reduction effect of the power generation side has been significantly improved, and the green level of the power grid has also increased. The calculation formula of carbon dioxide emission per unit electric quantity of power plant is as follows.
where,
(3) Consumption reduction effect
The consumption reduction effect refers to the average power consumption rate of the power plant and the average standard coal consumption of the generator set. The average power consumption rate of power plants is defined as the ratio of power consumption to power generation per unit time. This index can reflect the energy use efficiency of power plants. The lower the average power consumption rate, the higher the energy use efficiency of power plants and the higher the degree of green development. The average standard coal consumption of generator sets mainly reflects the technological progress of the power generation side. The lower the average standard coal consumption, the higher the green development degree. The formula for calculating the average power consumption rate of a power plant is as follows.
The average utility rate of power plant is denoted by
In the formula,
2.1.2 Transmission and Distribution Side Indicators
Transmission and distribution side is mainly to reduce the loss and improve the clean energy grid to achieve green development. The electricity from power plants is supplied to users through transmission and distribution. In this process, there will be a lot of losses. Therefore, the quality of power lines should be improved, while meeting the requirements for various clean energy to be connected to the power grid, so as to promote the online utilization of green energy. In this stage, six three-level indexes are selected from two aspects of energy structure and line loss management.
(1) Energy structure
Energy structure refers to the utilization of clean energy on the transmission and distribution side. The green development level of the transmission and distribution side is evaluated by studying clean energy online power, clean energy transmission power and energy consumption per unit of GDP. The proportion of clean energy online electricity refers to the proportion of clean energy online electricity in all online electricity, which reflects the dispatching scale of clean energy online electricity in the power grid dispatching center. The higher the proportion is, the more pollution-free clean energy is used in the transmission and distribution side, and the higher the green development level is. The proportion of electricity transmitted by clean energy reflects the power quality of clean energy. The price comparison of clean energy is complicated in dispatching and management, which is likely to cause the problem of abandoning wind and light. Therefore, the higher the proportion of electricity transmitted by clean energy means the higher the power quality and the higher the level of green development. The calculation formula for the proportion of clean energy online electricity is as follows.
In the formula,
(2) Line loss management
Line loss management refers to the loss of electric energy in each link in the transmission and distribution process due to various reasons, mainly including wire heating, electrical equipment damage, etc., these losses are also the main reasons leading to the loss of electric energy. Transmission line loss rate and distribution line loss rate are mainly reflected in the technological development level of transmission and distribution side for reducing network loss. The lower the transmission and distribution loss of the power grid, the more advanced the loss reduction technology in UHV and DC transmission, and the higher the green development level of the power grid. The comprehensive energy saving power quantity is embodied in the principle of energy saving and economy in the transmission and distribution process, which can reduce energy consumption and pollutant discharge to the maximum extent. The higher the comprehensive energy saving power quantity is, the better the green development level will be. The calculation formula of transmission and distribution line loss rate is as follows.
The loss rate of transmission and distribution line is represented by
In the formula,
2.1.3 Electricity Sales Side Index
The management of the sales side is aimed at different users, and policies are adopted to encourage users to reduce the power consumption during peak hours. In order to reduce the power loss and increase the load rate, the power consumption in the low valley should be increased and the power consumption mode should be optimized. At the same time, it can reduce the power consumption pressure and power supply cost in peak period, so as to save resources and promote the green development level of power grid.
(1) Green consumption by large industrial users
For large industrial users, the promotion of green development on the electricity sales side is mainly achieved by reducing pollutant emissions and improving energy utilization efficiency. Industrial pollution is one of the main sources of environmental pollution. The main pollutants include industrial wastewater, nitrogen oxides, general industrial solid wastes and soot, etc. Therefore, the sewage treatment rate, the production of industrial solid wastes and the comprehensive emission reduction are selected to evaluate the green consumption level of large industrial users.
(2) Green consumption of general industrial and commercial users
For the general industrial and commercial users, the promotion of the green development of the electricity selling side is mainly reflected in the way of using electricity. With the popularization of the concept of smart electricity, the application of smart electricity and intelligent electrical equipment has played a role in peak shaving and energy saving. Selecting the controllable load ratio of smart electricity to reflect the intelligent regulation and management of multi-energy collaborative energy supply optimization is conducive to improving the utilization efficiency of clean energy. The comprehensive energy consumption per unit product refers to the ratio of the comprehensive energy consumption per unit of energy used to produce a certain product or provide a certain service to the output of the product in the same period during the evaluation period. The comprehensive energy consumption per unit product can directly reflect the energy saving and emission reduction effect of general industrial and commercial users.
(3) Green consumption of resident users
For residential users, it is mainly to guide residents' electricity consumption habits by guiding users to change their electricity consumption patterns and adjust residents' peak and valley electricity prices to reduce electricity consumption. Electric vehicles can save energy and reduce emissions in transportation by "substituting electricity for oil", which is conducive to reducing environmental pollution and increasing clean energy consumption from the consumption side. The higher the clean power consumption rate of electric vehicles, the higher the green development level of electricity selling side. The implementation of clean energy substitution can optimize the energy structure, control the total coal consumption and reduce air pollution. Therefore, the electric heating substitution rate is selected to reflect the green consumption of household electricity. The promotion of smart home is the embodiment of smart power consumption in residents' life, and the smart home load rate reflects the ratio of smart home power consumption to civilian power consumption. The higher the ratio, the higher the controllable load factor of residents’ lives, the stronger the ability of demand-side management to regulate, and the stronger the ability of residents to participate in demand-side response and consume clean energy.
2.2 Construct the Evaluation Index System
On the power generation side, the optimization of energy structure, energy conservation, emission reduction and loss reduction are mainly considered. In terms of power transmission and distribution side, green supply is mainly considered, and indicators are established from the aspects of main network and distribution network in the park. On the electricity selling side, green consumption analysis is mainly carried out from different users' perspectives. In this paper, three indicators of the generation side, transmission and distribution side and electricity sales side are taken as the second-level evaluation factors, and 21 third-level evaluation indicators are set to comprehensively evaluate the green development level of distribution network. The stratification results of the evaluation index for the green development level of electric energy in the specific distribution network are shown in Fig. 1.
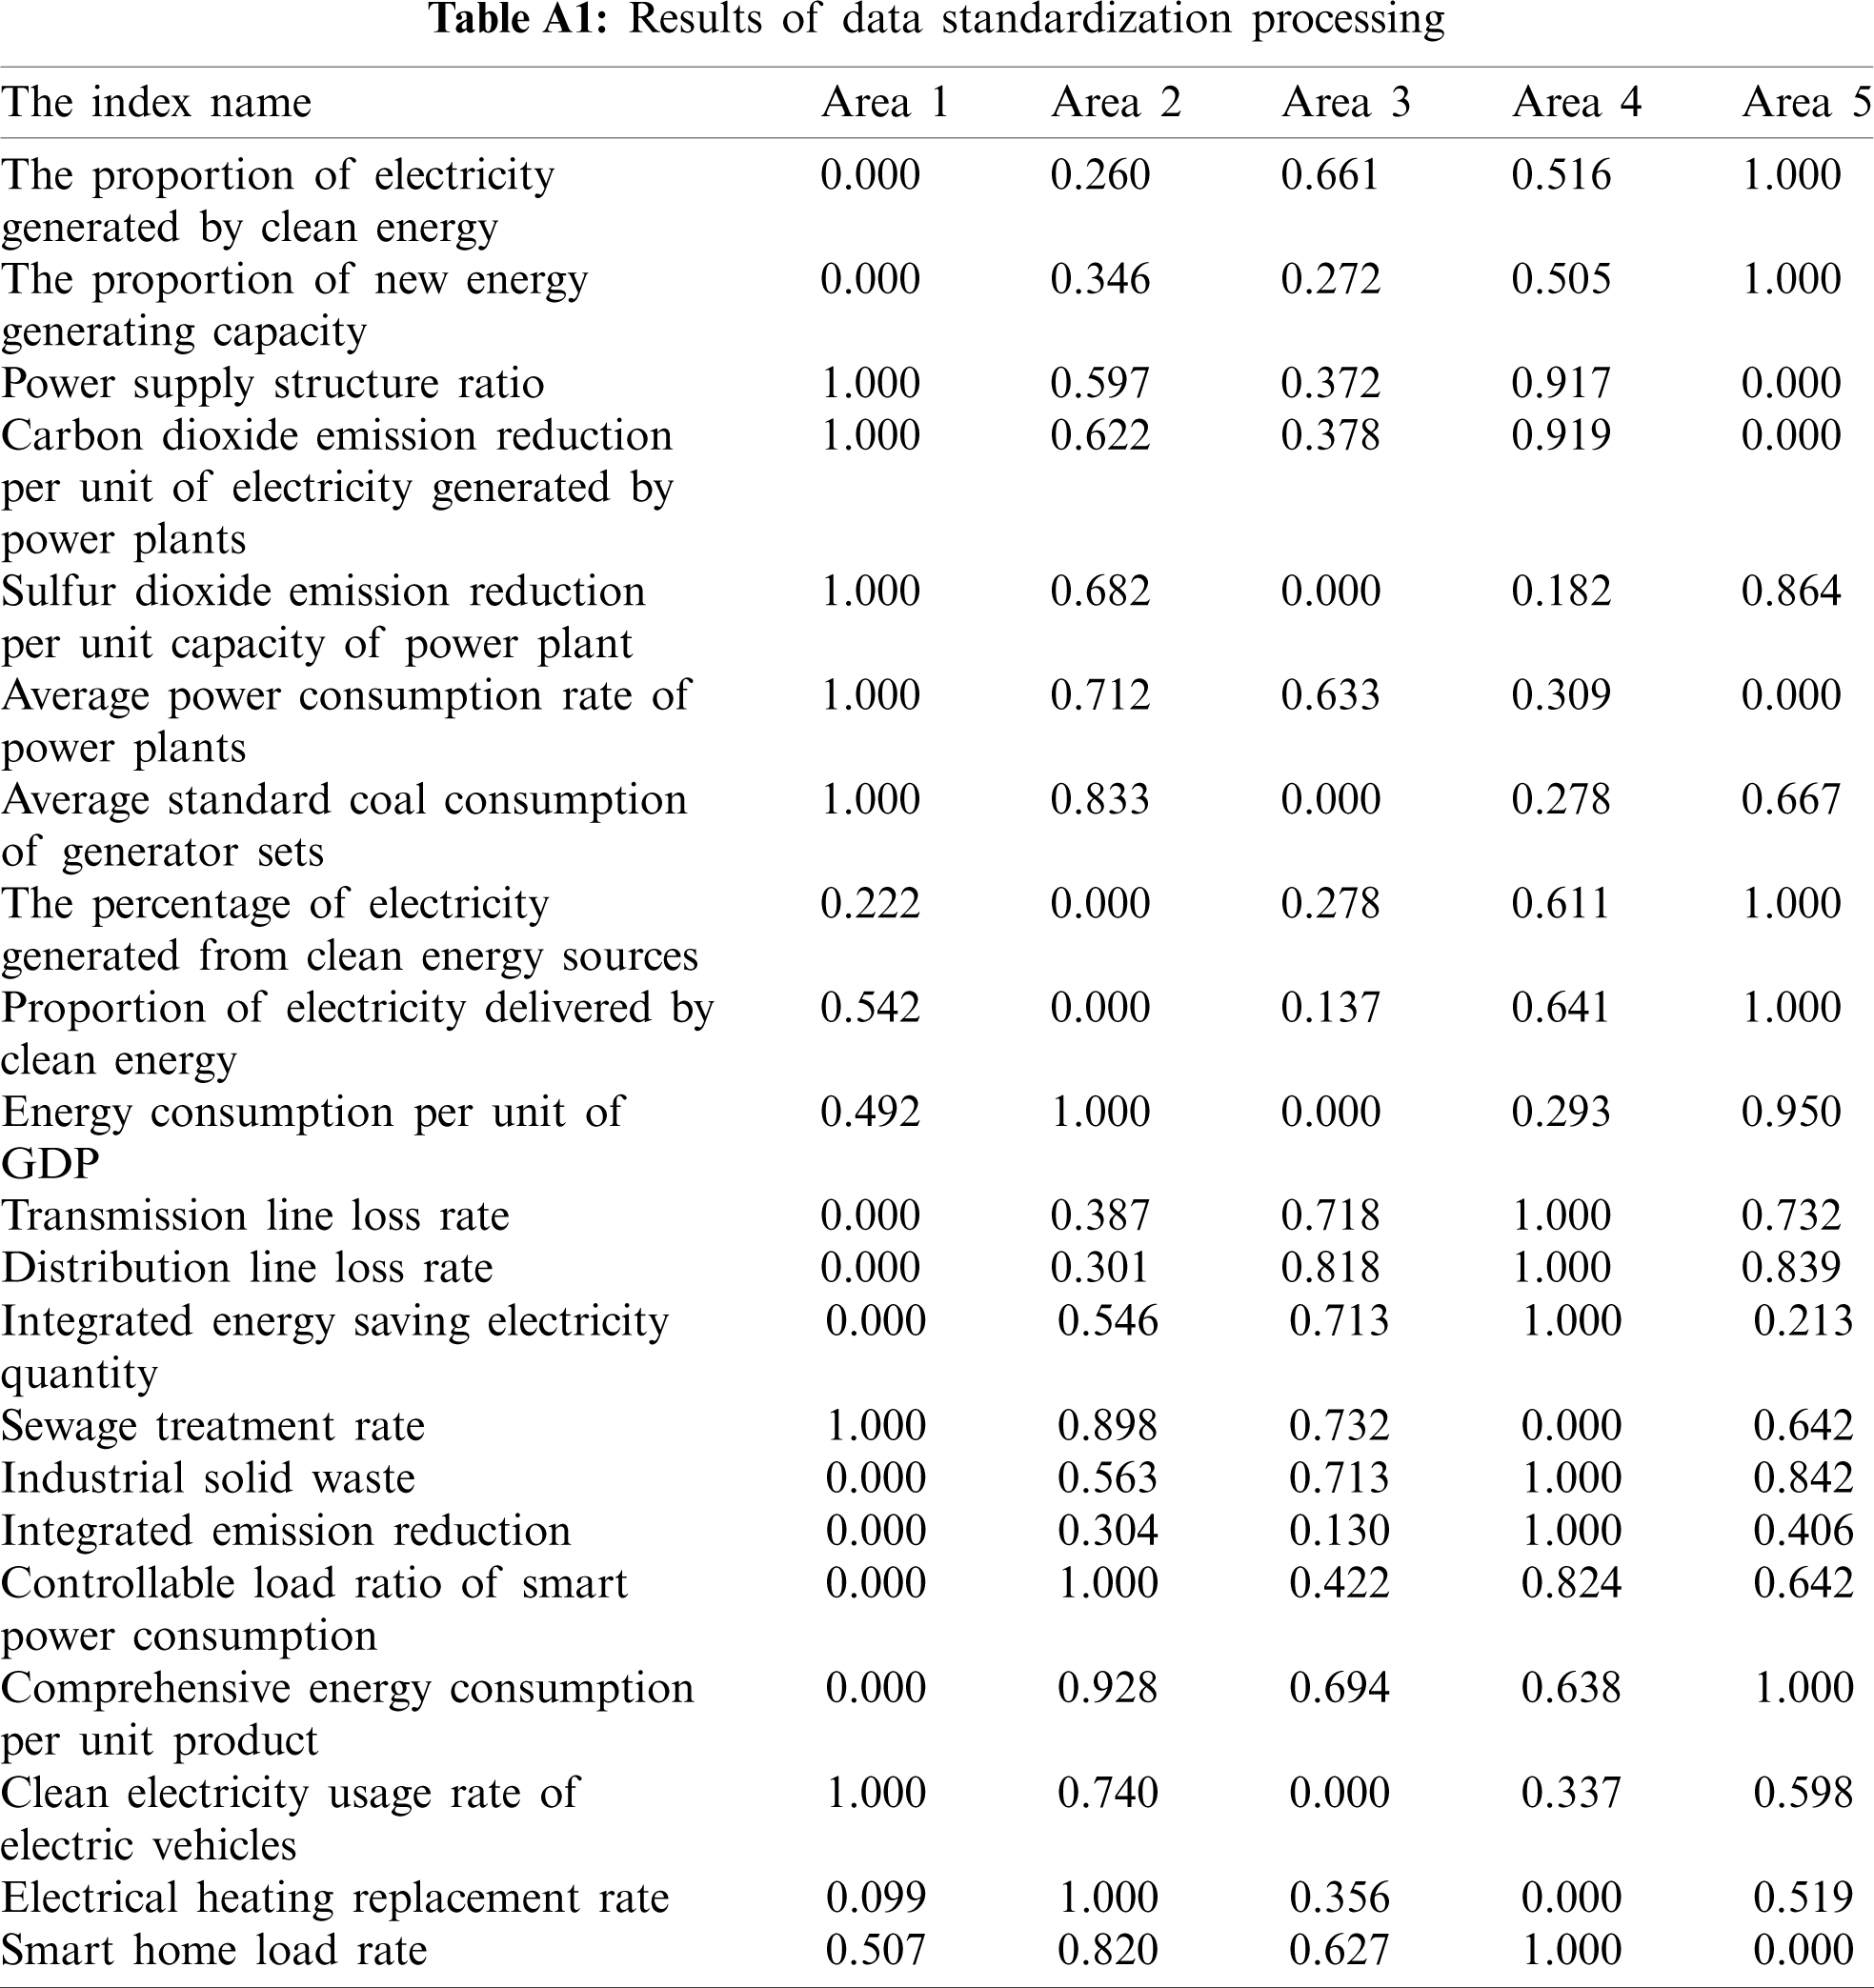
2.3 Standardized Treatment of Indicators
In the evaluation of the green level of electric energy in the distribution network, the indexes selected at each stage are complex and diverse, and there is the problem of non-uniform goals, so it is necessary to standardize the indexes. Among the influencing factors of the green development level of electric power in the distribution network, the proportion of clean energy power generation, the proportion of clean energy on-grid power, and the clean power consumption rate of electric vehicles need to be as large as possible. The value of indicators such as unit carbon dioxide emissions of power plants, comprehensive energy consumption per unit product, and transmission line loss rate needs to be as small as possible. The average power consumption rate of power plants and controllable load ratio of smart power use are intermediate indicators, so the indicators need to be standardized.
(1) Positive indicators
For positive indicators, first determine a lower limit
(2) Reverse indicators
For reverse indicators, first determine an upper limit
(3) Intermediate indicators
For intermediate indicators, the indicators need to be close to a critical value. First, upper limit
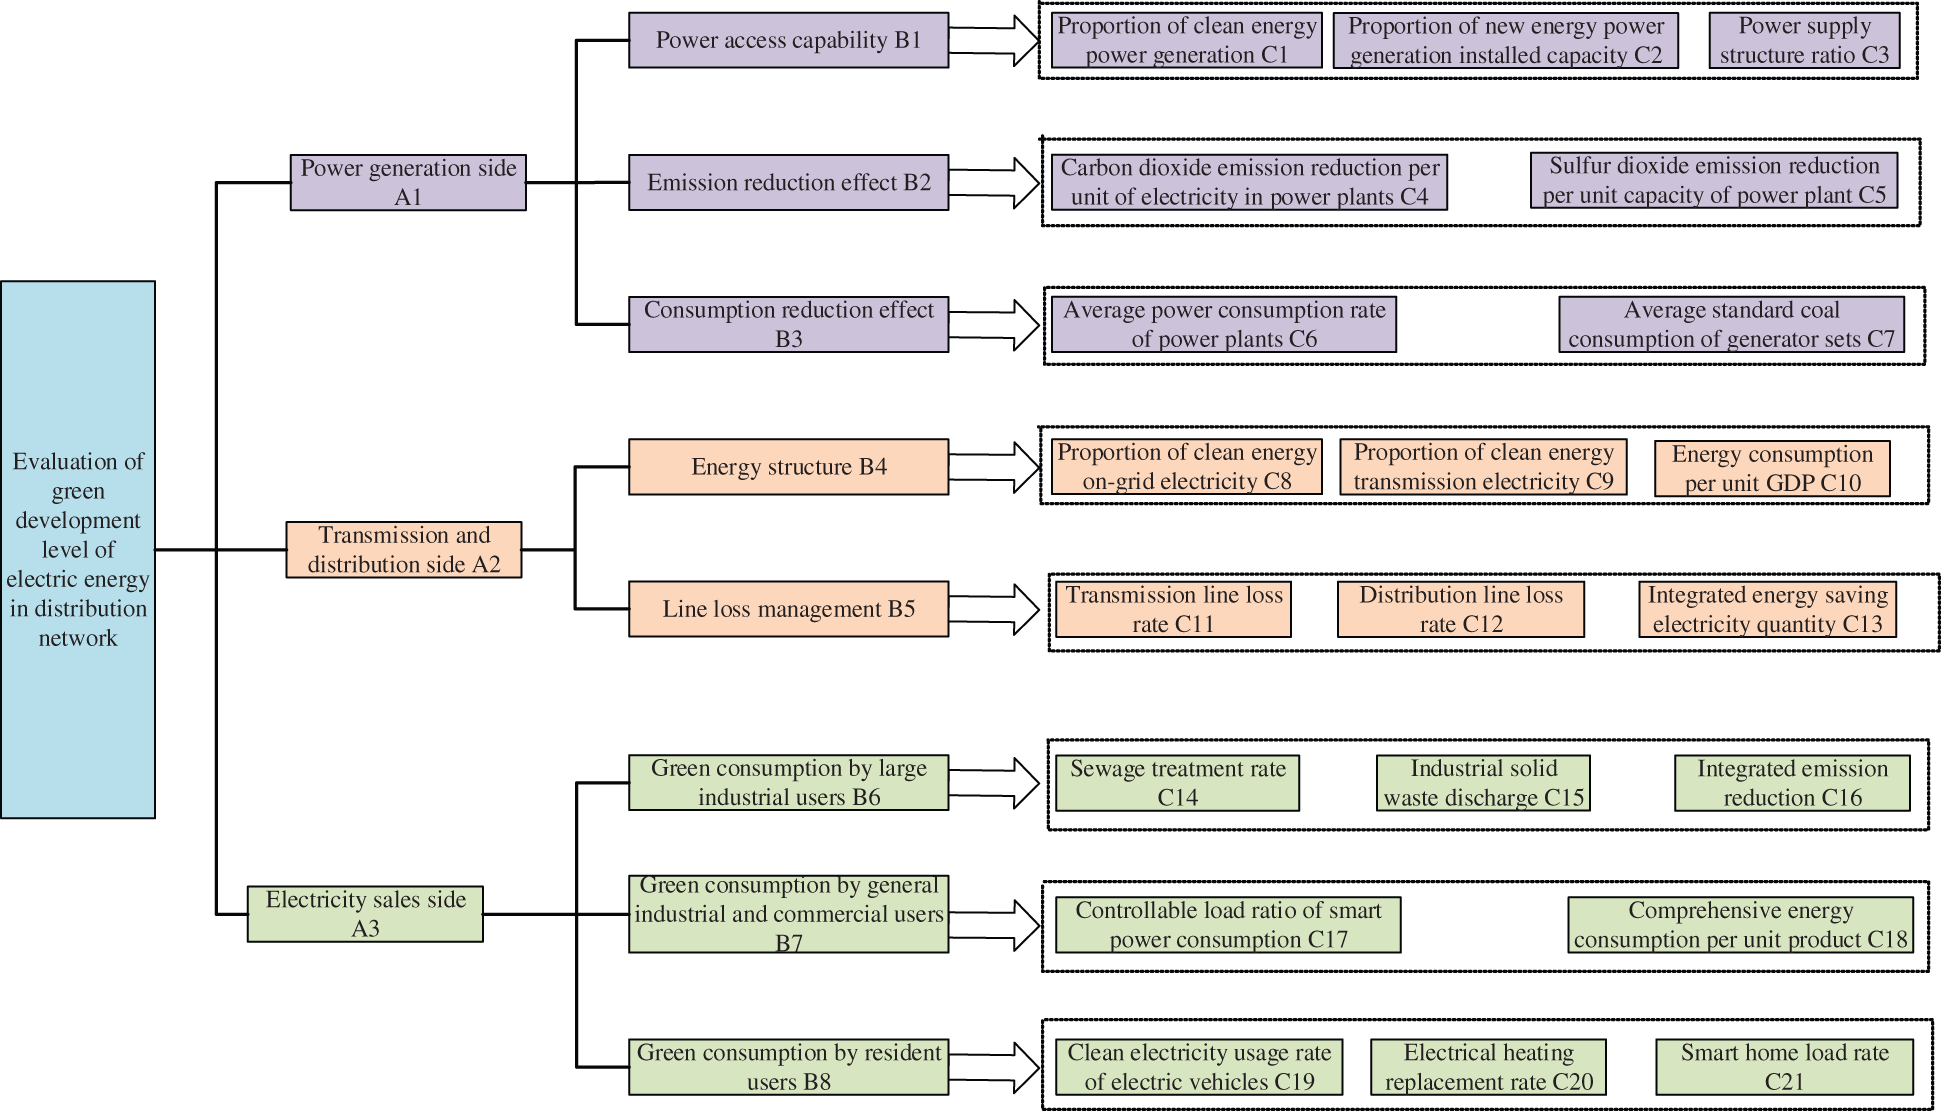
Figure 1: Evaluation index system of green development level of electric energy in distribution network
3 Entropy Weight—Analytic Hierarchy Process Weighting
Since the weight of evaluation index affects the evaluation result of green development level of distribution network, this paper proposes the combined weight method of analytic hierarchy process and entropy weight method. The advantages of subjective weight and objective weight are effectively taken into account, and the subjective and objective grouping method avoids the influence of personal preference on the evaluation results and compensates for the problem of low data quality.
AHP is a powerful tool for analyzing the complex large system with multiple objectives, multiple factors and multiple criteria. At present, it has been widely used in project risk assessment, enterprise management assessment and other aspects. The specific weighting steps are as follows:
(1) Establish the index hierarchy
The index hierarchy designed in this paper is the target layer, the criterion layer, the state layer and the bottom layer, namely: the target layer is the evaluation index system of the green development level of electric energy in the distribution network, and the criterion layer is the generation side, transmission and distribution side and electricity sales side, the secondary indicators are power access capacity, emission reduction effect, consumption reduction effect, energy structure, line loss management, green consumption of large industrial users, general industrial and commercial users, and residential users, the third-level indicator is the proportion of electricity generated by clean energy, the proportion of new energy generation capacity, power supply structure ratio, carbon dioxide emission reduction per unit capacity of power plant, sulfur dioxide emission reduction per unit electric quantity of power plant, average power consumption rate of power plants, average standard coal consumption of generator set, clean energy grid, clean energy to deliver electricity, energy consumption per unit of GDP, transmission line loss rate, distribution line loss rate, comprehensive energy saving electricity quantity, sewage treatment rate, industrial solid waste production, comprehensive emission reduction, controllable load ratio of smart power consumption, comprehensive energy consumption per unit product, clean electricity consumption rate of electric vehicles, electric heating lift replacement rate, and smart home load rate.
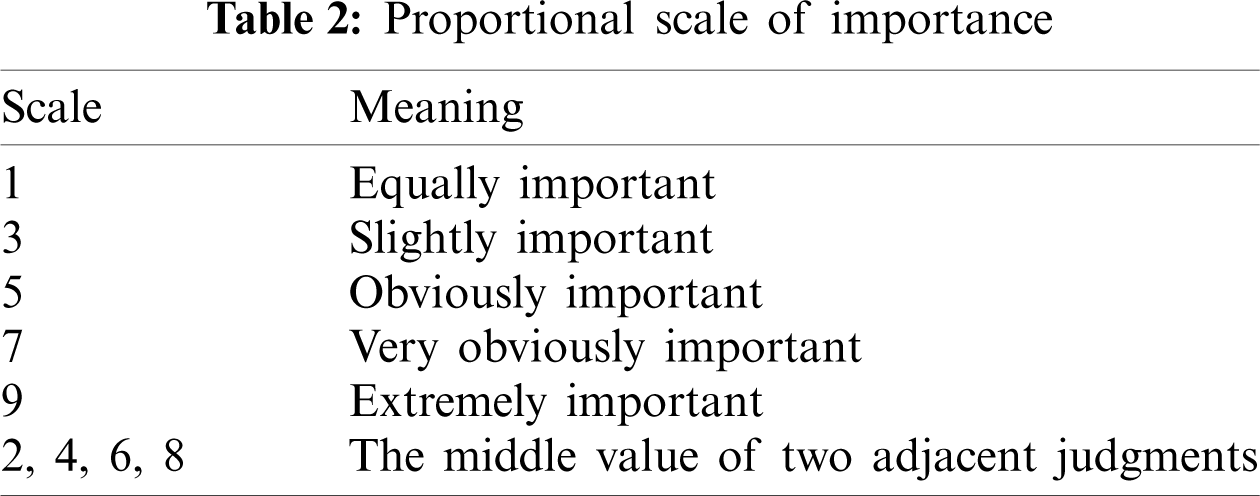
(2) Construct judgment matrix
The judgment matrix is further constructed for pairwise comparison of elements at the same level or in the same group. Assume that the upper element is
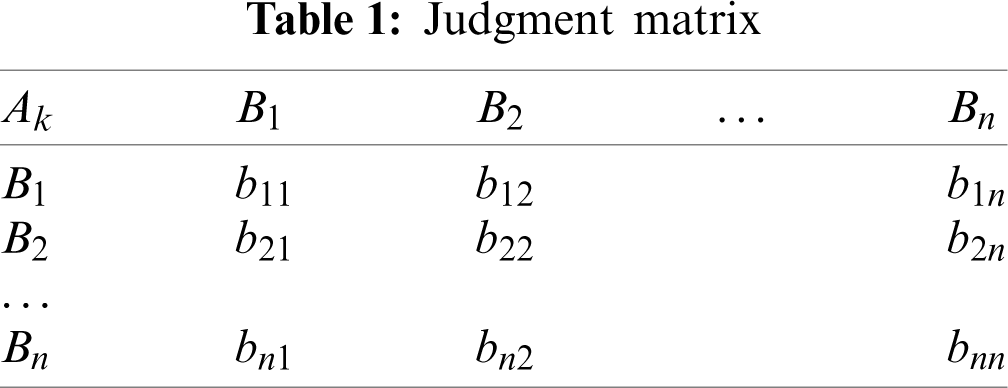
The matrix satisfies three conditions: (1)
(3) Determine index weight
After the judgment matrix is further constructed, the index weight shall be determined. The determination method of the index weight is as follows:
• Each column of the judgment matrix is normalized, namely:
• Add the matrix processed in the first step according to the row, namely:
• The matrix processed in the second step is normalized, namely:
• Finally, find the maximum eigenvalue of the matrix, namely:
(4) Consistency check
To further judge the consistency effect of the matrix, when the consistency deviation degree is too large, it will affect the credibility of the weight, so consistency test is needed.
• Consistency index C.I. calculation is obtained. Its calculation formula is as follows:
C.I. represents the degree of consistency. The smaller the judgment matrix is, the more satisfactory the consistency is. The larger the judgment matrix is, the worse the consistency is C.I. = 0, which is completely consistent.
• Calculate the mean random consistency index R.I.
The value of R.I. is based on the order of the judgment matrix.
• Calculate consistency ratio C.R.
If the random consistency ratio
(5) Calculate the relative weighted weight of each layer index
The relative weight of each layer is calculated to get the weight of the evaluation index of green development level of each layer relative to the target layer.
3.2 Entropy Weight Method Weight
Entropy weight method is a subjective weighting method, which mainly reflects the relationship between indexes and evaluation system through information entropy. The magnitude of information entropy is related to the degree of index change. The smaller the degree of index change, the smaller the information entropy and the smaller the weight, indicating that the information provided by this index is smaller.
(1) The proportion
where:
(2) The information entropy of the i index is calculated, as shown in Eq. (13):
where:
Finally, the entropy weight
3.3 Entropy Weight Method—AHP Comprehensive Weight
The combined weighting method of AHP and entropy weighting method combines the subjective flexibility of AHP and the objectivity of entropy weighting method, reduces the possible errors of single weighting method, and makes the weighting result more reasonable. The steps of the subjective and objective combination weighting method based on AHP and entropy weighting method are as follows.
Assuming that the subjective weight of the i index is
where:
The subjective weight
In order to obtain the optimal weight
where:
In order to minimize the consistent level of subjective and objective weighted attribute values, the linear weighting method was used to establish the optimization model.
Lagrange multiplication is used to solve the binary optimization model of weight coefficient
4 Construction of Multi-Level Fuzzy Comprehensive Evaluation Model for Green Development Level of Power Distribution Network
The evaluation index of green development of electric energy in distribution network involves both qualitative index and quantitative index. In order to quantify the qualitative index, the fuzzy comprehensive evaluation method is adopted for evaluation. The functions and advantages of multi-level fuzzy comprehensive evaluation model in distribution network green evaluation are as follows. When the multi-level fuzzy comprehensive evaluation evaluates the evaluation object, it firstly classifies the influencing factors and constructs the index system from different dimensions, which can make the evaluation more comprehensive. At the same time, in the process of evaluation, the first-level comprehensive evaluation is carried out first, and then the second-level comprehensive evaluation results are carried out, so that the evaluation results are more accurate. In the multi-level fuzzy comprehensive evaluation of the green development level of power distribution network, the influencing factors are firstly classified and the index system is constructed from three dimensions. The establishment of the two-level fuzzy comprehensive evaluation model is conducive to accurate evaluation from three different aspects, so as to obtain the green development level of electric energy of distribution networks in each region.
Since the evaluation index system has three levels of evaluation index, the first level index and the third level index are respectively used for the two-level comprehensive evaluation. The specific steps are as follows.
4.1 First-Level Comprehensive Evaluation Model
(1) Establish factor set, evaluation set and weight set
Based on the established evaluation index system of green development of power grid,
Then, the evaluation set is established. The evaluation set is constructed according to the evaluation grade
Finally, the weight set is established. According to the analytic hierarchy process modified by entropy weight method, the weight of class i index
(2) Construct fuzzy evaluation matrix of single factor evaluation
The required data of F-matrix needs to be in the interval of [0,1], so the data should be de-dimensioned and normalized. It has been processed when the data is weighted, and the F-matrix can be obtained as follows:
(3) One level comprehensive evaluation
For multilevel fuzzy comprehensive evaluation, according to the index weight set
4.2 Secondary Comprehensive Evaluation Model
The F-matrix of the second level comprehensive evaluation can be obtained from the above S-level F comprehensive evaluation matrix, as shown below:
After the first level comprehensive evaluation, the result is taken as a factor for the second level comprehensive evaluation. According to the weight set B of the Class i index and the fuzzy evaluation matrix of the two-level comprehensive evaluation, the two-level comprehensive evaluation matrix C can be obtained, as shown in Eq. (22).
4.3 Comprehensive Evaluation Result Analysis
Finally, it is necessary to normalize the evaluation results so as to better analyze the evaluation results.
The final evaluation result is
4.4 The Concrete Calculation Steps of Comprehensive Evaluation
Based on the above calculation steps, from the perspective of sustainable development, Fig. 2 shows the specific process of evaluating the green development level of electric energy in the distribution network.
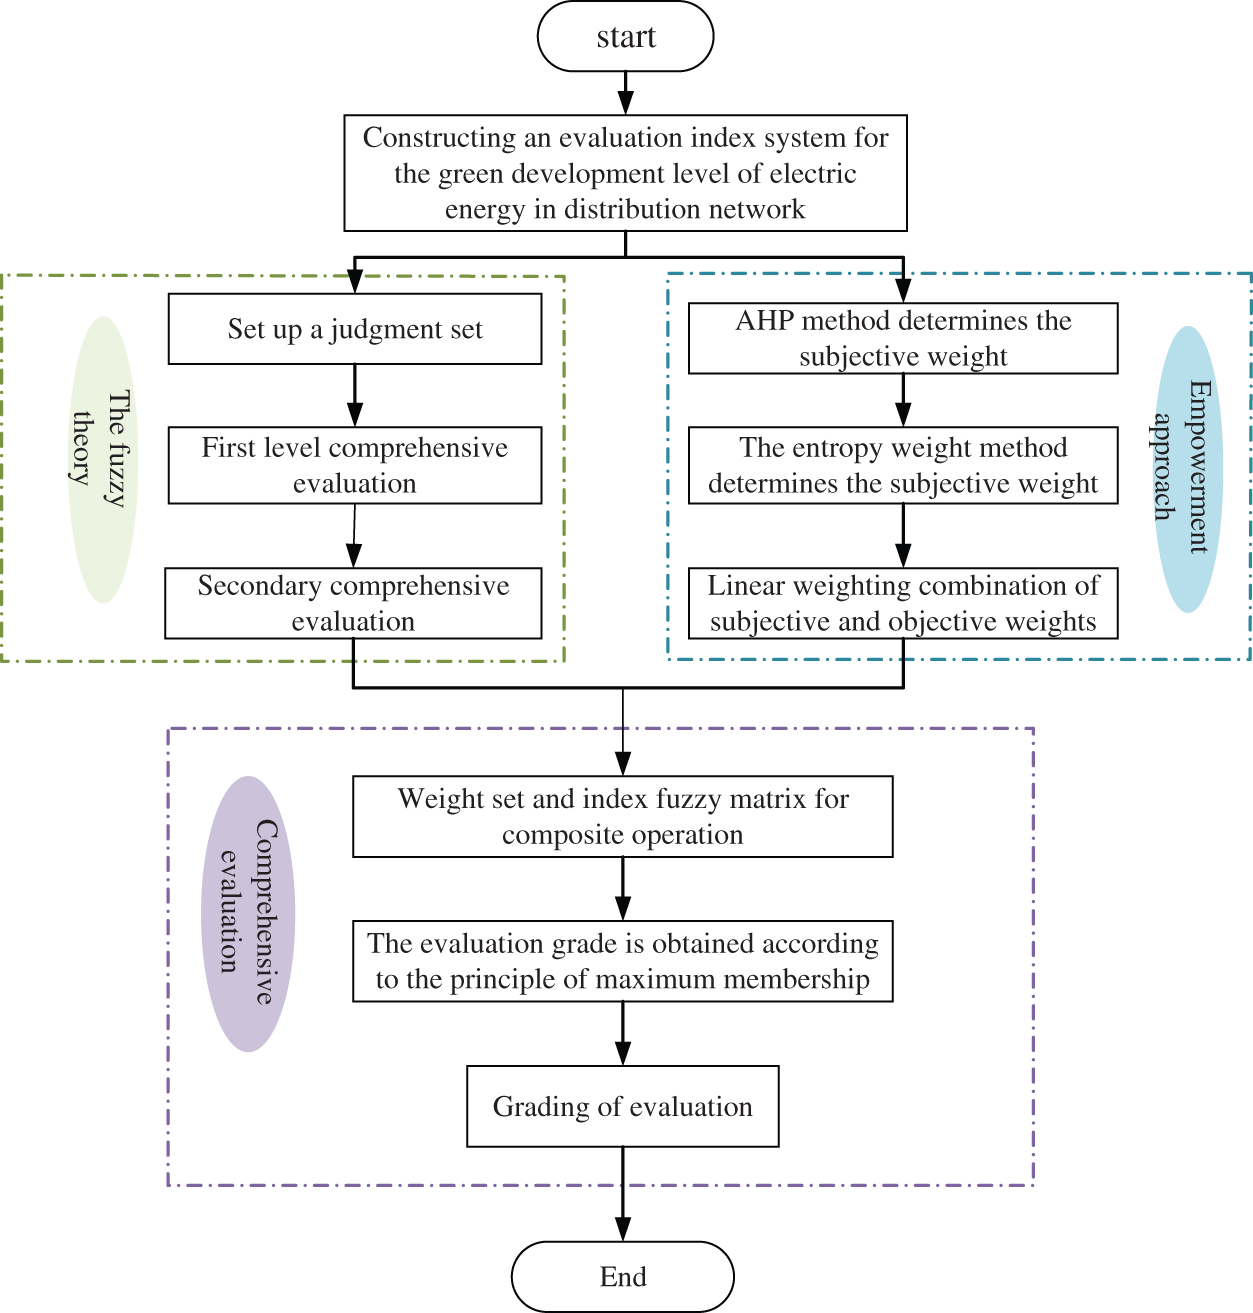
Figure 2: Evaluation steps of power green development level of distribution network
In order to verify the validity of the model, this paper selects the green power level data of distribution network in 5 regions for empirical research. The main design idea of the case is to first select 5 typical areas, collect relevant data through the combination of field survey and data access, and then conduct standardized processing on the data. After standardized treatment, the evaluation indexes were given weight according to the combination of entropy weight method and analytic hierarchy process. Then, according to the steps of multi-level fuzzy comprehensive evaluation, the factor set, evaluation set and fuzzy evaluation matrix are established. Finally, the first and second level comprehensive evaluation are carried out to get the results.
In the evaluation index system constructed, the indexes of each layer are numbered. The indexes number of the criterion layer are A, B, C, D, E, F, G, H, I, and the corresponding indexes number of the criterion layer are
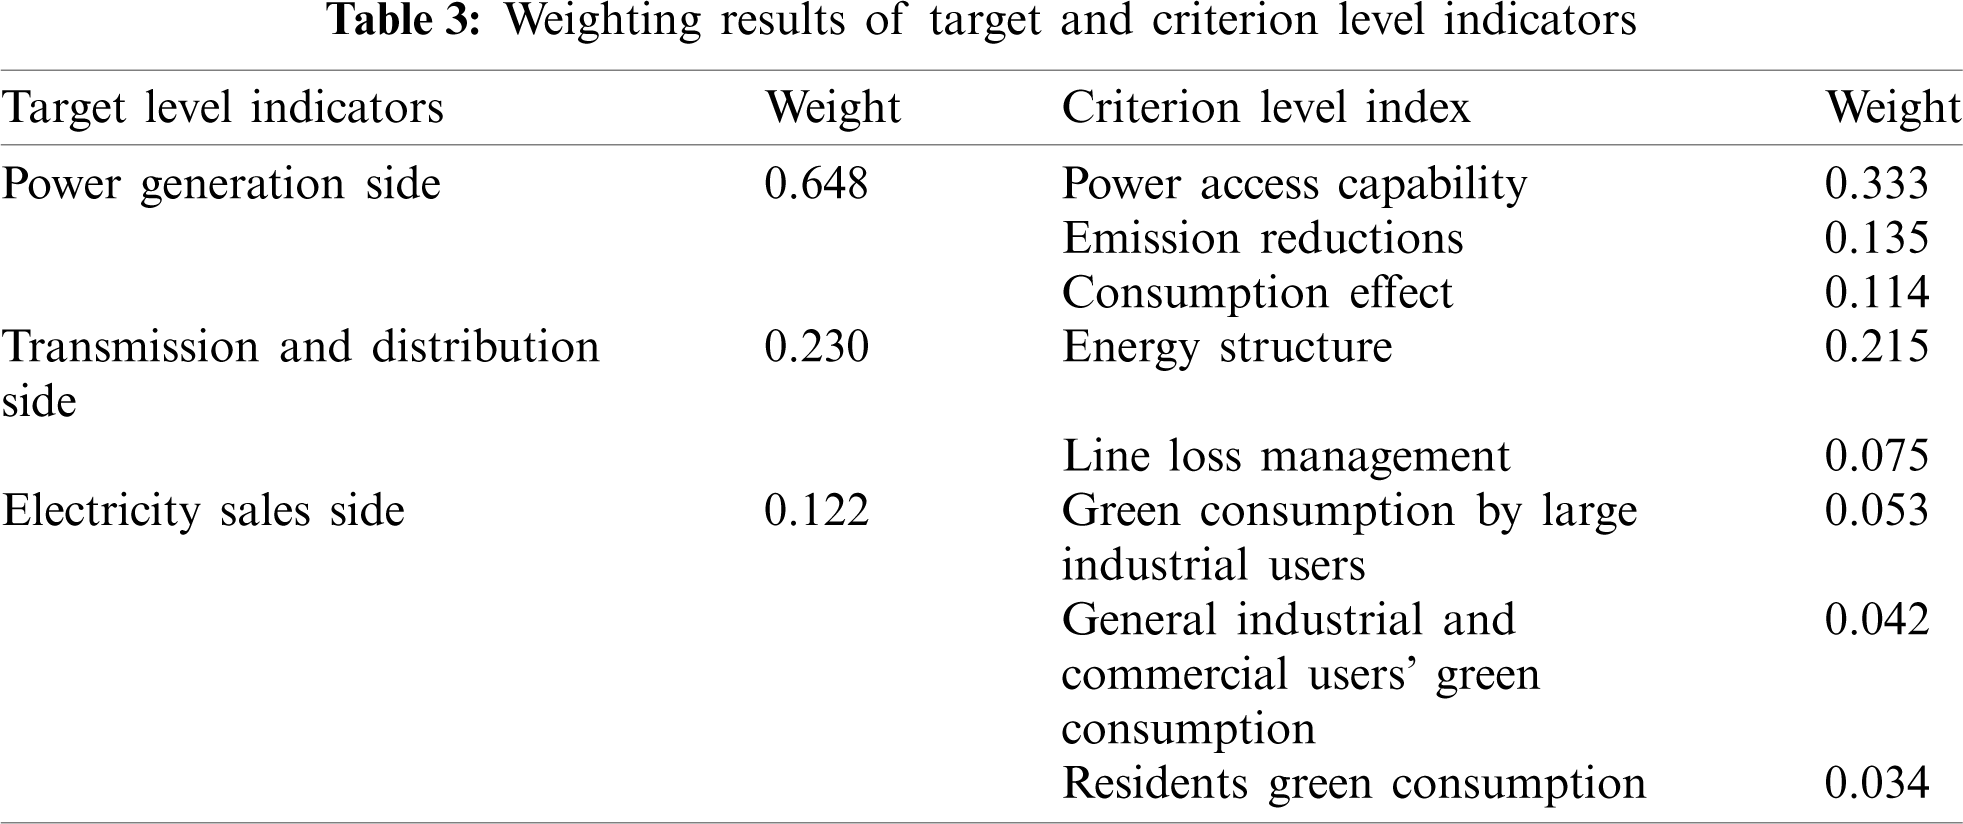
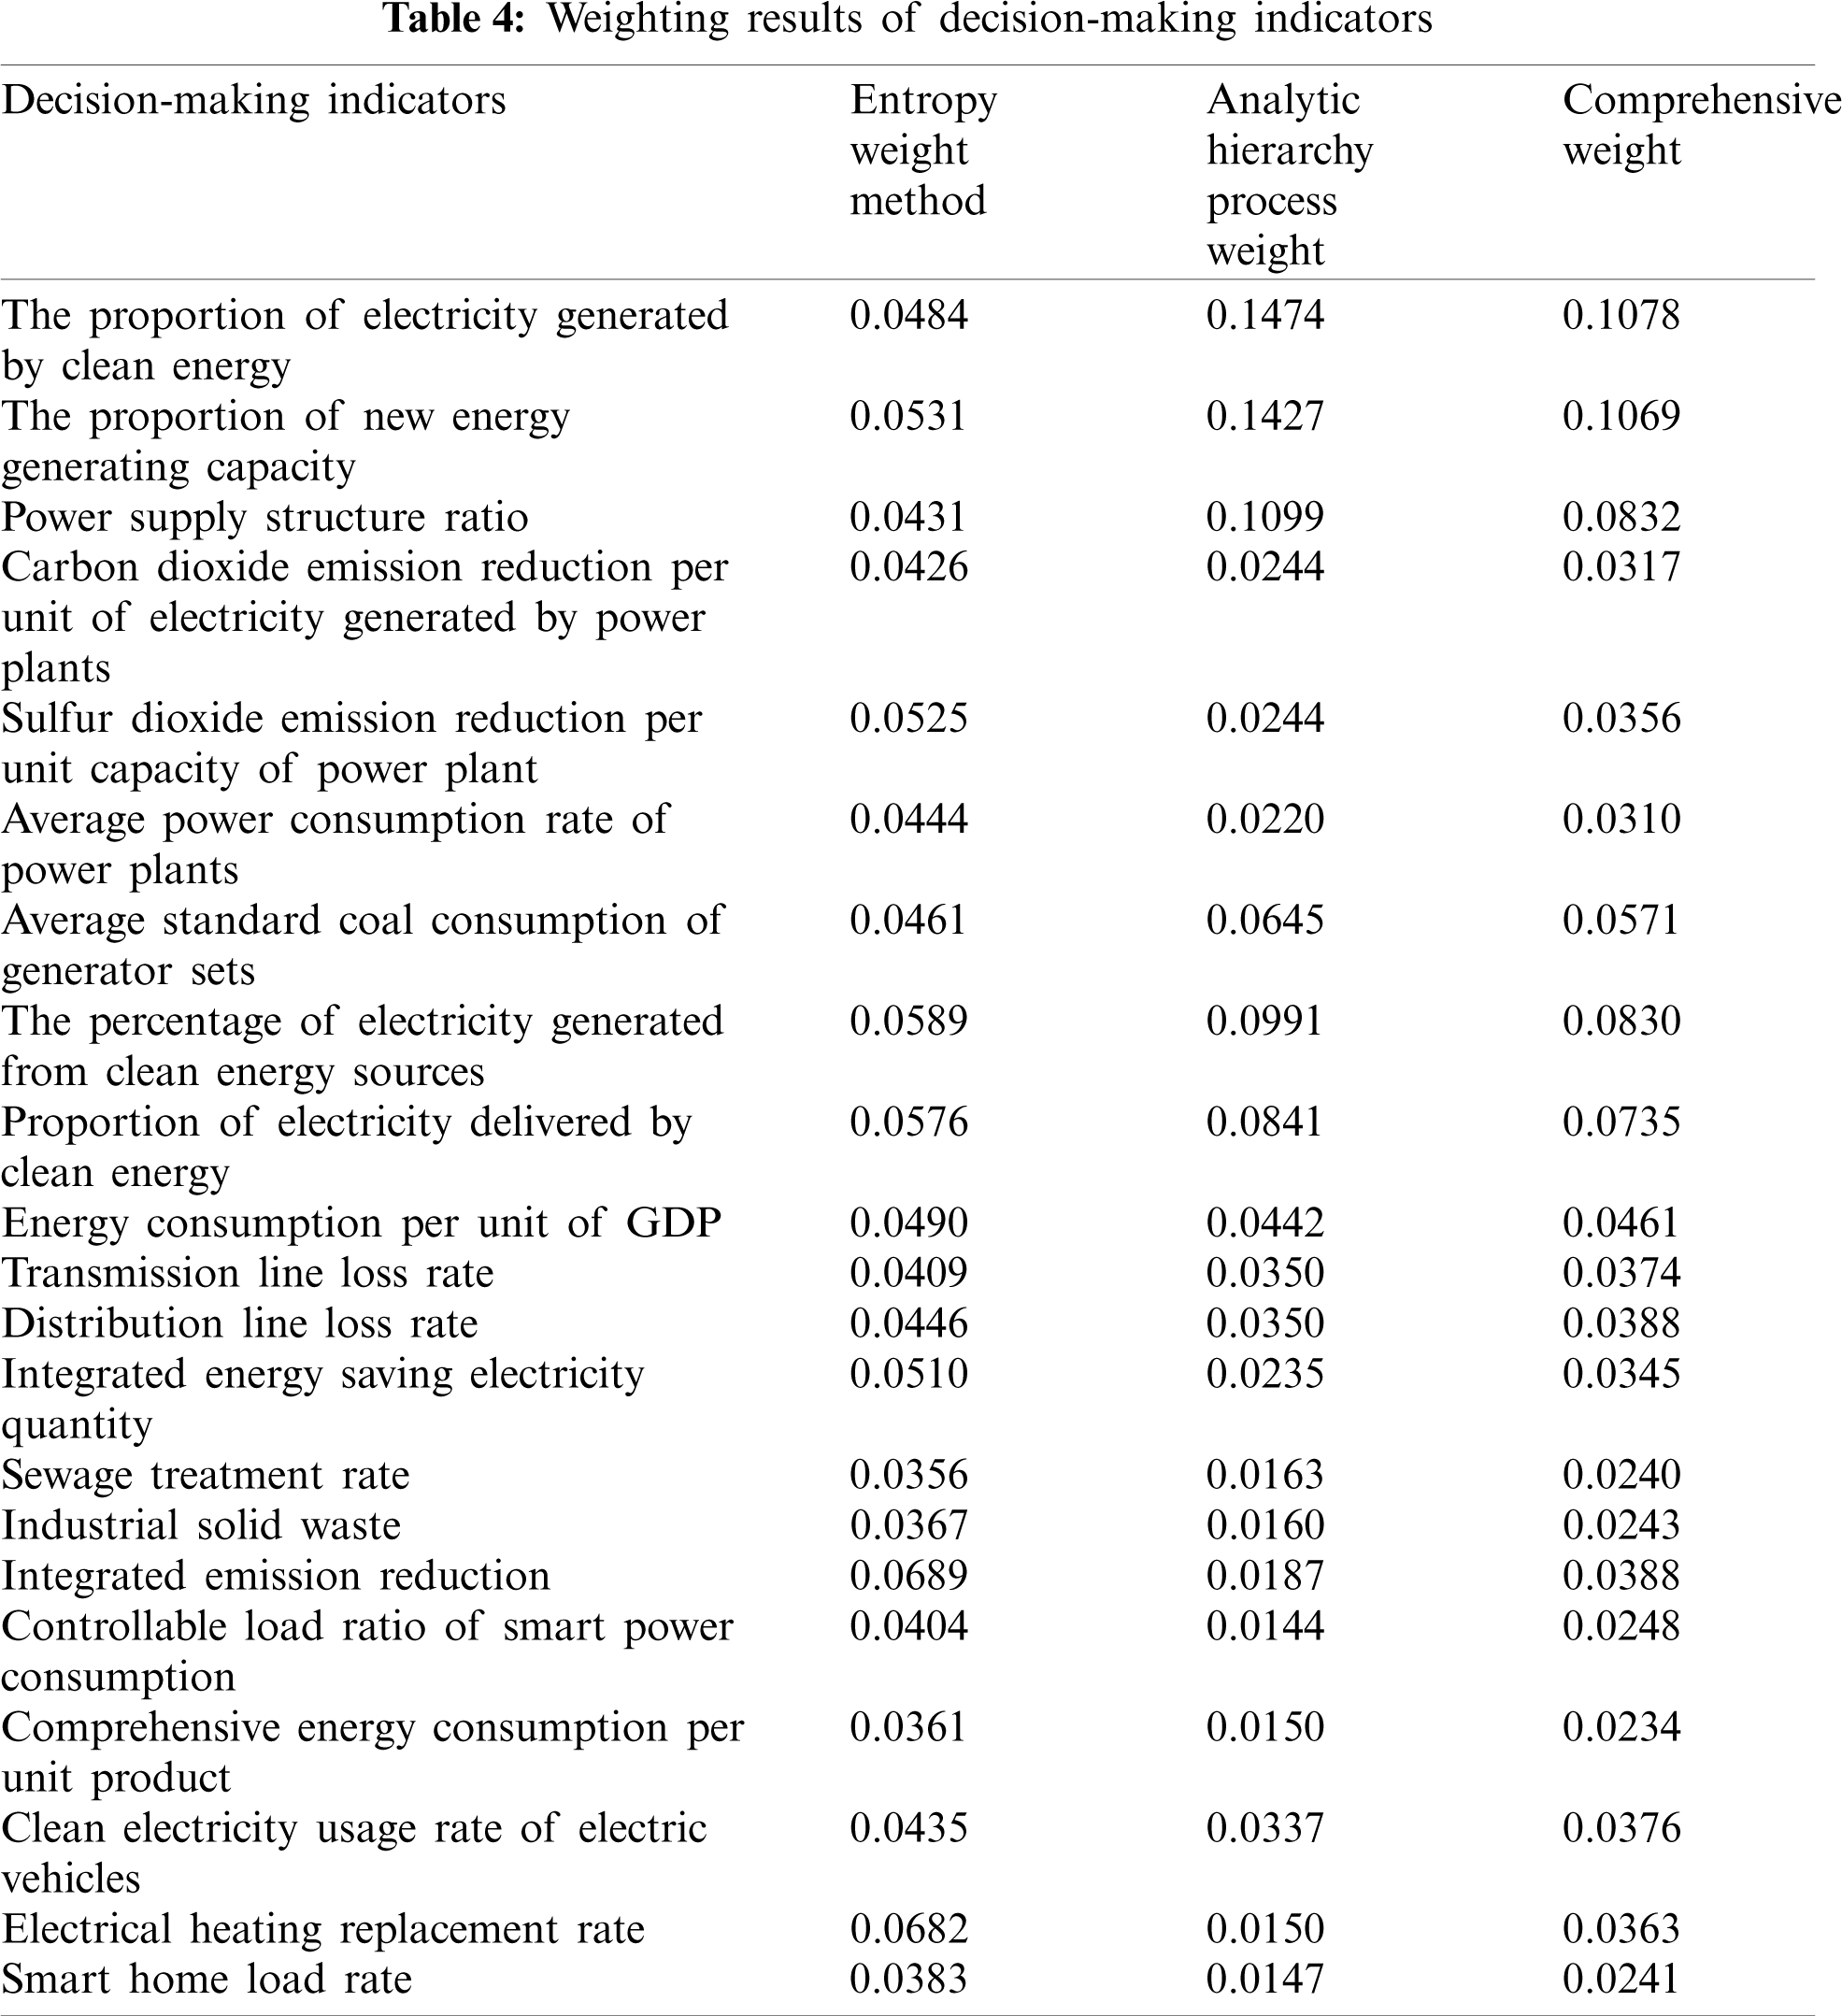
After standardizing the evaluation index of power grid development level, it is weighted according to entropy weight method and analytic hierarchy process. The weighting results of specific indexes are shown in Tables 3 and 4.
5.2 Index Comprehensive Evaluation Result and Analysis
(1) Establish factor set, evaluation set and index set
Take the selected Region 1 as an example, and its three first-level indicators constitute the factor set
The evaluation set is established, and the evaluation set of green development level of electric energy in distribution network is
The weight set is established. It can be seen from Table 4 that the weight set of first-level indicators is B = (0.648, 0.230, 0.122).The weight set of the three-level index is B1 = (0.1078, 0.1069, 0.0832, 0.0317, 0.0356, 0.0310, 0.0571), B2 = (0.0830, 0.0735, 0.0461, 0.0374, 0.0388, 0.0345), B3 = (0.0240, 0.0243, 0.0388, 0.0248, 0.0234, 0.0376, 0.0363, 0.0241).
(2) Single factor evaluation F-matrix
27 experts in the power system were selected to evaluate and score the above 21 indicators. After fuzzy processing, the evaluation fuzzy matrix of single-factor
(3) First level comprehensive evaluation
According to the index weight sets
(4) Secondary comprehensive evaluation
According to the results of the first-level comprehensive evaluation, F-matrix of the second-level comprehensive evaluation can be obtained as shown in Eq. (31) below:
Then, according to the weight set B of the second-level comprehensive evaluation, F comprehensive evaluation model
Suppose the evaluation set
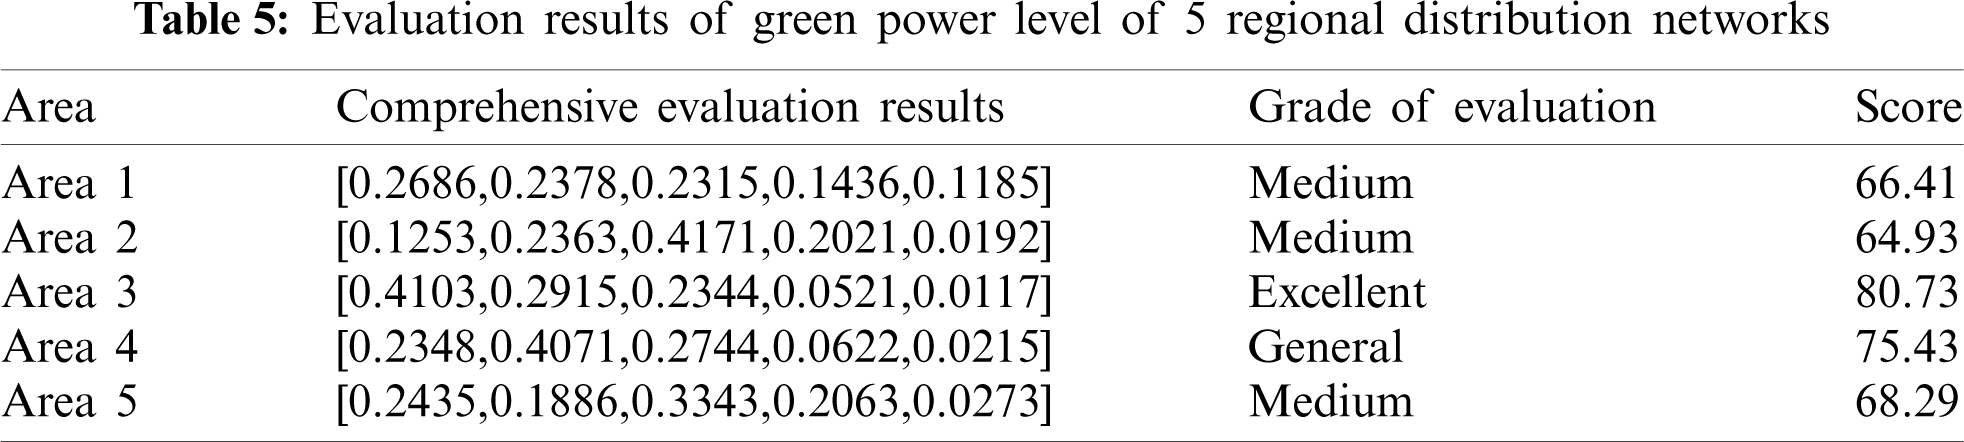
As can be seen from the evaluation result table, the evaluation result of Region 3 is the best, rated as “excellent” Region 4 is the general level, and Regions 1, 2 and 5 are all medium level. Due to various reasons, the green development level of distribution network in each region is uneven. In order to better compare the advantages and disadvantages of each region in specific links, the levels of each stage are also converted into the number of components, which can be more intuitively reflected, as shown in Table 6 and Fig. 3 below.
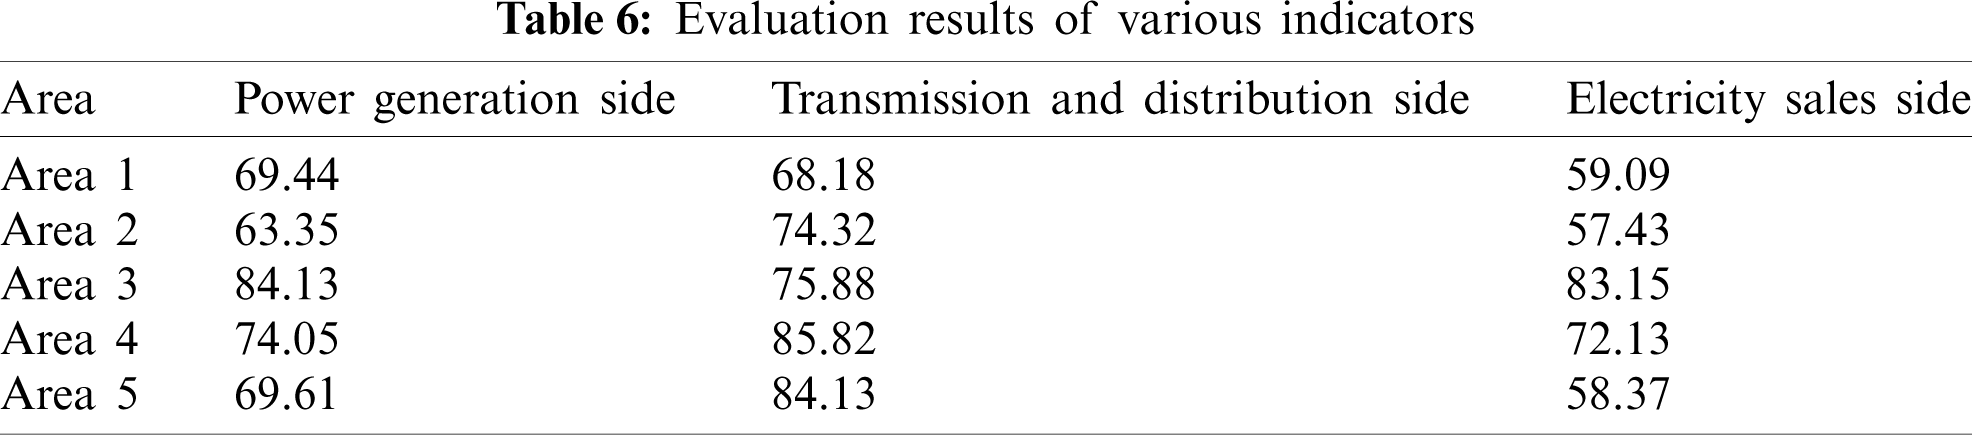
Table 6 shows the number of grade conversion components of each region in a specific link, which can more directly see the difference between the advantages and disadvantages of each region in each stage. As can be seen from Table 6, Zone 1 has a low score in all stages, especially in the stage of electricity sale. Region 2 has a higher score in the transmission and distribution stage, but a lower score in the generation and sale stage. The overall level of green development in Region 3 is relatively high, while the stage of power transmission and distribution is slightly lower. The green development of regional 4 power distribution network is at a medium level. Area 5 has a low score in the electricity sale stage and should be improved. Related changes have been marked in yellow in the article.
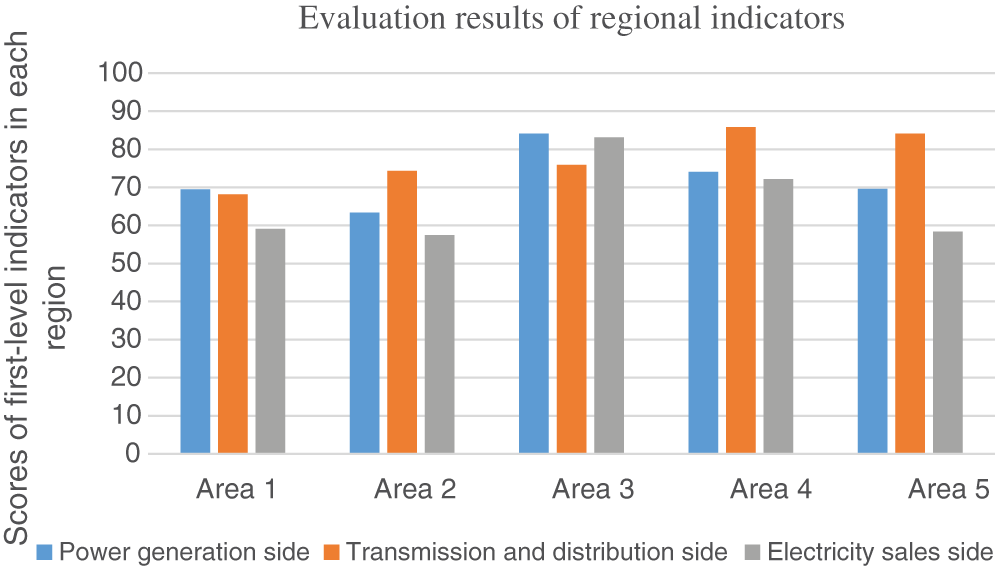
Figure 3: Evaluation results of various indicators
(5) Analysis of evaluation results
The evaluation results obtained by the multilevel fuzzy comprehensive evaluation method can be analyzed in detail by combining with the corresponding charts:
(1) Overall level
From the overall level, the green development level of electric energy in distribution networks in different regions is uneven. Five typical regions were selected as the evaluation objects in this paper, and the evaluation results showed that the green development level of electric energy in Region 3 distribution network was the highest, the overall evaluation level was excellent, and it was better than other regions in many aspects, and the overall score was also high. The development level of green electric energy in Regions 1, 2 and 5 distribution networks is the same, the grade is medium, and the score does not differ much, so it needs to be improved as a whole. On the basis of ensuring safety and reliability, these regions need to improve and enhance the power supply composition at the source side, power construction, power grid operation and terminal power consumption, adopt energy-saving and environmental protection measures and reduce energy consumption to improve energy utilization rate and realize green development.
(2) Sub-index level
From the perspective of first-level indicators, the power generation side has the largest weight, indicating that improving installed capacity of clean energy and power generation capacity on the source side is crucial to promoting the green development level of distribution network. From the power generation side, the score of Region 3 is the highest and that of Region 2 is the lowest among the five regions, which is consistent with the overall evaluation result. Therefore, in order to improve the overall level of development, attention should be paid to the power generation side, optimize the power supply structure, improve the clean technology of electric energy production, and reduce the emission of carbon dioxide. From the perspective of power transmission and distribution side, the score of Region 5 is the highest, Region 4 is equivalent to Region 5, and the other three regions are relatively low. These areas should pay attention to the promotion in the transmission and distribution side, in the construction of power transmission and transformation projects to reduce pollution, improve the clean energy access rate, optimize the distribution of power grid, improve the quality of the line to reduce line loss, promote the full use of green energy. From the point of view of the electricity sales side, the score of Region 3 is the highest, while the scores of Regions 1, 2 and 5 are relatively low. These areas should make improvements for different users, pay attention to optimize the way of electricity use and guide smart electricity use, so as to save energy and protect the environment.
(3) Related suggestions
According to the result of the comprehensive evaluation, for Zone 1, the score in the electricity sale stage is low, so different measures should be taken for the power users. Policies can be adopted to guide the users to use electricity, improve the efficiency of electricity consumption, improve the way of electricity consumption for users, and reduce the cost of power supply. For Zone 2, which also has a low score in the electricity sales stage, measures should be taken for industrial users to mainly reduce energy consumption, and green lighting projects should be implemented. Meanwhile, cooperation should be carried out with energy saving service companies to improve electricity efficiency. For residential users, smart power consumption should be encouraged, power consumption habits should be improved, and load curves should be smoothed to reduce power supply costs. For Area 3, the score is low in the stage of transmission and distribution, so attention should be paid to lifting on the transmission and distribution side. During the construction of power transmission and transformation projects, we should reduce pollution, improve the access rate of clean energy, optimize the grid layout, improve the quality of lines and reduce line losses, so as to promote the full utilization of green energy. For Region 4 and Region 5, the scores in the generation stage and the electricity sale stage are both low. Firstly, the power structure at the source side should be improved. Secondly, measures should be taken for different users to improve the power consumption mode, reduce energy consumption and improve electricity efficiency.
5.3 Comparative Analysis of Different Methods
In order to further verify the flexibility and practicability of the multilevel fuzzy analytic hierarchy process (MFAHP), the author uses the basic fuzzy analytic hierarchy process (FAHP) to evaluate the power green development level of the distribution network in five regions according to the same information set. The comprehensive evaluation results are shown in Table 7.
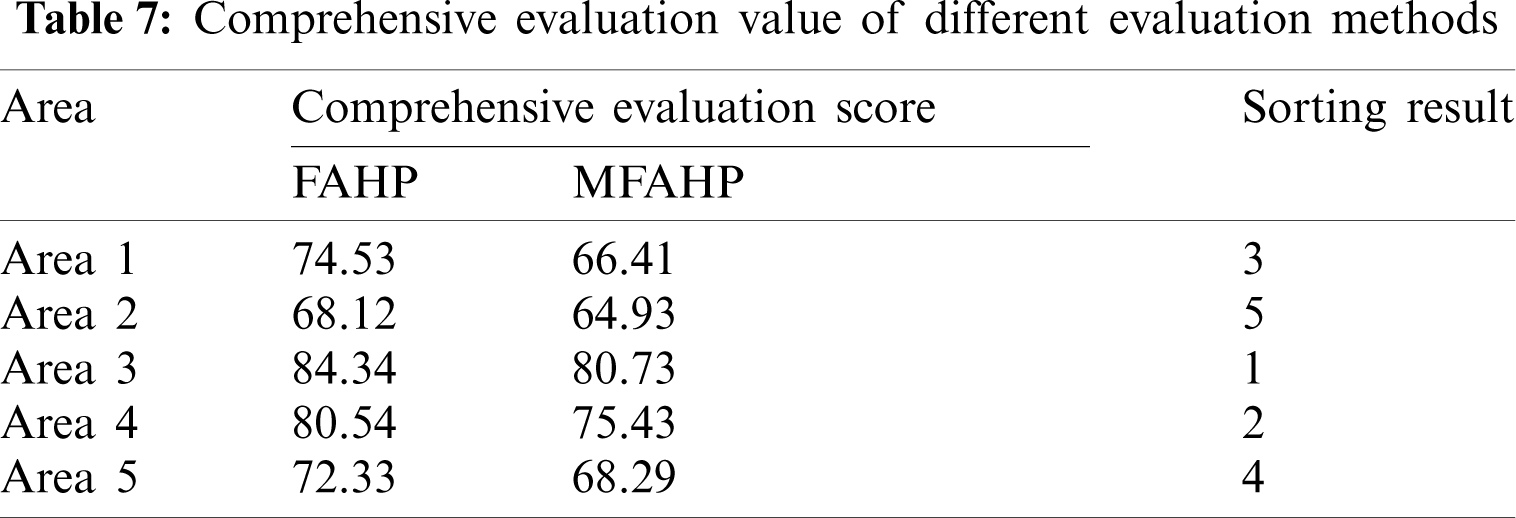
Table 7 shows the comprehensive evaluation results of the green development level of power distribution networks in five regions under the two methods. Overall, the evaluation results were similar. However, the evaluation results obtained by the basic fuzzy analytic hierarchy process score relatively high, and the evaluation results of the basic fuzzy analytic hierarchy process obviously do not show the weak links in the green development of power distribution networks in each region. In addition, because FAHP only uses the analytic hierarchy process to assign weights, the weight values are directly given by experience. This does not take into account the uncertainty of the judgment of peer experts. Therefore, the actual change of some index values is easily inconsistent with the expert experience, leading to the flood of key information. The evaluation results can be concluded as follows:
(1) Under the two evaluation methods, the evaluation score of Region 3 is the highest, indicating that the green development level of the distribution network in Region 3 is relatively high on the whole.
(2) In terms of the evaluation of Region 5 and Region 1, the two methods have different results, which may lead to inconsistencies in the results due to subjective problems in the basic fuzzy analytic hierarchy process.
In recent years, with the continuous development of green power grid, China has paid more and more attention to the green development of electric energy in power distribution network. This paper mainly carries out evaluation and empirical research on the current green development level of electric energy in power distribution network, and draws the following conclusions through analysis:
(1) This paper summarizes the basic theory of green power grid, analyzes the current situation of the green development of electric energy in distribution network in China, and summarizes the current research status of the green development and comprehensive evaluation method theory of power grid at home and abroad. On this basis, the research framework of this paper is constructed and relevant innovation points are proposed.
(2) A complete set of index evaluation system is constructed from the generation side, transmission and distribution side and electricity sales side, and 21 evaluation indexes of green development are determined. Based on multi-level fuzzy comprehensive evaluation and analytic hierarchy process, the evaluation model of green development of electric energy in distribution network is proposed to comprehensively evaluate the green development level of electric energy in each stage of distribution network.
(3) Combined with the index system and evaluation model established in this paper, and based on the relevant data collected, the distribution networks in 5 regions were selected for empirical analysis to compare the differences between green development in each region. The results show that the green development level of electric energy in the distribution network of Region 3 is the highest, and the rating evaluation is excellent. The shortcomings and future development direction of other regions are found out, and the feasibility of the multi-stage fuzzy evaluation model is further verified. The evaluation results are helpful to comprehensively improve the green development level of electric energy in distribution networks and promote resource conservation and environmental protection.
Funding Statement: Project Supported by the 2018 Key Projects of Philosophy and Social Sciences Research, Ministry of Education, China (Grant No. 18JZD032). Topic: Research on Policies and Mechanisms of Building a Clean, Low-Carbon, Safe and Efficient Energy System.
Conflicts of Interest: The authors declare that they have no conflicts of interest to report regarding the present study.
1. China Electricity Council (2020). China electric power industry annual development report. 2020. [Google Scholar]
2. Chen, S. J., Xiang, Y., Liu, J. Y., Shen, X. D. (2020). Hybrid multi-attribute evaluation and optimization model for distribution network grid structure considering load uncertainty and differential demand. Electrical Automation Equipment, 40(11), 24–36. [Google Scholar]
3. Wang, L. Y., Liu, H. Z. (2020). Evaluation index and model construction method of distribution network economic operation based on extension cloud. Power Equipment Management, 10, 29–32+71. [Google Scholar]
4. Xiong, N., Zhu, W. G., Zhong, S. Y., Shu, J., Li, W. W. et al. (2020). A comprehensive evaluation method for regional distribution networks based on nonlinear mapping and nuclear principal component analysis. Modern Electric Power, 37(5), 463–469. [Google Scholar]
5. Guang, H. S., Zhang, T. (2020). Reliability evaluation method of distribution network based on consumers' sensitivity classification. Journal of Physics: Conference Series, 1486, 27–39. [Google Scholar]
6. Chen, B., Li, X. H., Liu, H. W., Ge, L. J. (2019). Hybrid subjective and objective evaluation method of the equipment for first class distribution network. Energy Procedia, 158, 3452–3457. [Google Scholar]
7. Bai, H. Y., Pan, K. Y., Wang, S., Zhou, M. Y. (2019). Research on distribution network evaluation index and weights based on Lagrangian function. Electrical Measurement and Instrumentation, 56(8), 1–8. [Google Scholar]
8. Sun, Q., Li, X. D., Liu, X., Lv, F., Lv, J. et al. (2019). Research on evaluation method of first-class city distribution network. Materials Science and Engineering, 677, 85–102. [Google Scholar]
9. Ge, S. H., Li, L. S., Jiang, R. Z., Zhang, S. D. (2020). Construction and application of operation state evaluation index system of distribution network based on hierarchical dynamic grey relational analysis. Science, Technology and Engineering, 20(23), 9393–9399. [Google Scholar]
10. Luo, Z. N. (2020). Research and evaluation of urban distribution network grid planning. Nan Chang: Nanchang University. [Google Scholar]
11. Xiao, J., Li, H., Wang, B., Song, C. H. (2020). Integrated matching evaluation method for distributed power supply access to urban distribution network. Power System Automation, 44(15), 44–51. [Google Scholar]
12. Liu, W. X., Yu, L. L., Zhang, L. H., Yuan, P., Wang, Y. et al. (2020). Assessment of power grid development level based on AHP and multilevel fuzzy comprehensive evaluation. Intelligent Power, 48(5), 80–85. [Google Scholar]
13. Yuan, A., He, P., Wang, K. D., Bai, X. Q., Guan, Y. L. (2019). Research on comprehensive evaluation system of distribution network based on analytic hierarchy process. Electric Appliance and Energy Efficiency Management Technology, 24, 75–78. [Google Scholar]
14. Hua, W., Xu, H. Q., Cheng, L., Cao, W. Q., Huang, Y. K. et al. (2019). Innovative design and development of green power transmission and transformation projects. Energy Conservation, 38(6), 30–31. [Google Scholar]
15. Mao, Y. Q., Liu, Y. (2018). Analysis on the importance of energy efficiency evaluation of distribution network equipment in the context of green development. Quality and Certification, 10, 52–53. [Google Scholar]
16. Liao, W., Zeng, W. D., Yang, H., Shu, Z., Lin, Y. Y. (2019). Research on the construction strategy of environmentally friendly and efficient distribution network based on regional model. Electric Age, 2, 72–74. [Google Scholar]
17. Zou, R. Y. (2019). Research on grid vulnerability prediction based on large-scale consumption of renewable energy. Beijing: North China Electric Power University. [Google Scholar]
18. Gu, A. (2020). Emission reduction effects of the green energy investment projects of China in belt and road initiative countries. Ecosystem Health and Sustainability, 6(1), 553–572. [Google Scholar]
19. Shan, M. H., Tang, H. H. (2020). Essential cause and design thinking of green electricity market. Automation of Electric Power Systems, 44(16), 12–20. [Google Scholar]
20. Huang, Y. F., Zhang, X. T., Cui, S. H., Huang, W., Xu, S. et al. (2020). Green city construction of evaluation index system and weight. Acta Scientiae Circumstantiae, 40(12), 4603–4612. [Google Scholar]
21. Qusay, H. (2021). Evaluation and optimization of off-grid and on-grid photovoltaic power system for typical household electrification. Renewable Energy, 164, 375–390. [Google Scholar]
22. Wu, K. C., Zhao, D. (2020). Research on environmental protection management system of power grid enterprises for green development. Value Engineering, 39(20), 12–13. [Google Scholar]
23. Cheng, C., Zhou, Y. H., Yue, K. W., Yang, J., He, Z. Y. et al. (2012). Environmental evaluation index system of urban green power strategy. China Electric Power, 45(3), 76–80. [Google Scholar]
24. Solomie, G., Avinandan, T., Sena, A. (2019). Investment climate indicators for waste reuse enterprises in developing countries: Application of analytical hierarchy process and goal programming model. Conservation and Recycling, 144, 223–232. DOI 10.1016/j.resconrec.2019.01.049. [Google Scholar] [CrossRef]
25. Sánchez-Lozano, J. M., García-Cascales, M. S., Lamata, M. T. (2016). GIS-based onshore wind farm site selection using fuzzy multi-criteria decision making methods. Evaluating the case of Southeastern Spain. Applied Energy, 171(5), 86–102. DOI 10.1016/j.apenergy.2016.03.030. [Google Scholar] [CrossRef]
26. Ahmed, F., Kilic, K. (2019). Fuzzy analytic hierarchy process: A performance analysis of various algorithms. Fuzzy Sets and Systems, 362(1), 110–128. DOI 10.1016/j.fss.2018.08.009. [Google Scholar] [CrossRef]
27. Li, W., Liang, W., Zhang, L. B. (2015). Performance assessment system of health, safety and environment based on experts' weights and fuzzy comprehensive evaluation. Journal of Loss Prevention in the Process Industries, 35(22), 95–103. DOI 10.1016/j.jlp.2015.04.007. [Google Scholar] [CrossRef]
28. Li, Z. Q., Han, X. S., Yang, M., Ma, Y. R. (2020). Multi-stage power source and grid coordination planning method considering grid uniformity. Global Energy Interconnection, 3(4), 303–312. [Google Scholar]
29. Wu, H., Niu, D. X., Liu, W. D., Sun, K. (2017). Power grid development level evaluation based on adaptive neural-fuzzy inference system. Procedia Engineering, 174(11), 850–857. DOI 10.1016/j.proeng.2017.01.232. [Google Scholar] [CrossRef]
30. Liu, J. C., Li, Y. H., Lu, Y. Y., Fu, X. X., Yan, S. L. (2020). Research on the influence factors of ubiquitous power Internet of Things for promoting consumption of wind power based on fuzzy G1-ISM in China. International Journal of Electrical Power & Energy Systems, 121(6), 106–124. DOI 10.1016/j.ijepes.2020.106124. [Google Scholar] [CrossRef]
31. Wu, Y. N., Wu, C. H., Zhou, J. L., He, F. Y. (2020). An investment decision framework for photovoltaic power coupling hydrogen storage project based on a mixed evaluation method under intuitionistic fuzzy environment. Journal of Energy Storage, 30(19), 101–118. DOI 10.1016/j.est.2020.101601. [Google Scholar] [CrossRef]
32. Liu, W., Hui, L. X., Lu, Y. T., Tang, J. S. (2020). Developing an evaluation method for SCADA-controlled urban gas infrastructure hierarchical design using multi-level fuzzy comprehensive evaluation. International Journal of Critical Infrastructure Protection, 30, 100–113. [Google Scholar]
33. Xiang, S. Y., Cai, Z. X., Liu, P., Li, L. X. (2019). Fuzzy comprehensive evaluation of low carbon operation of distribution network based on AHP-inverse entropy weight method. Chinese Journal of Power Science and Technology, 34(4), 69–76. [Google Scholar]
34. Chen, W. H., Wu, J., Qiu, Y. T., Zhao, P., Ye, R. J. et al. (2019). Combined fuzzy comprehensive evaluation method and its application in transmission network planning. Zhejiang Electric Power, 39(5), 100–106. [Google Scholar]
35. Dehdashti, E. (2019). The energy bank-roadmap for the 21st century green power grid. Electricity Journal, 32(4), 14–20. DOI 10.1016/j.tej.2019.02.004. [Google Scholar] [CrossRef]
36. Mohammadreza, B., Masoud, R., Mojgan, M. P. (2020). A techno-economic assessment of energy efficiency in energy management of a micro grid considering green-virtual resources. Sustainable Cities and Society, 61(4), 102169. DOI 10.1016/j.scs.2020.102169. [Google Scholar] [CrossRef]
37. Qusay, H. (2021). Evaluation and optimization of off-grid and on-grid photovoltaic power system for typical household electrification. Renewable Energy, 164, 375–390. [Google Scholar]
38. Muhammad, W. K.(2019). Optimal energy management and control aspects of distributed microgrid using multi-agent systems. Sustainable Cities and Society, 44(1), 855–870. DOI 10.1016/j.scs.2018.11.009. [Google Scholar] [CrossRef]
39. Schultis, D. L., Schirmer, A. C. (2019). Overall performance evaluation of reactive power control strategies in low voltage grids with high prosumer share. Electric Power Systems, 168, 336–349. DOI 10.1016/j.epsr.2018.12.015. [Google Scholar] [CrossRef]
 | This work is licensed under a Creative Commons Attribution 4.0 International License, which permits unrestricted use, distribution, and reproduction in any medium, provided the original work is properly cited. |