| Energy Engineering |
DOI: 10.32604/EE.2022.016141
ARTICLE
Development of Transient Electric Field Radiation Simulation Device during Gas Insulation Switch Operation
1Electric Power Research Institute, State Grid Shaanxi Electric Power Company, Xi'an, 710100, China
2School of Electronics and Information, Xi'an Polytechnic University, Xi'an, 710048, China
3Yulin Power Supply Company, State Grid Shaanxi Electric Power Company, Yulin, 719000, China
4Shaanxi Pilot Power Technology Co., Ltd., Xi'an, 710000, China
**Corresponding Author: Hao Yang. Email: yanghao@xpu.edu.cn
Received: 10 February 2021; Accepted: 10 May 2021
Abstract: In gas insulation switch (GIS) substation, secondary devices such as line monitoring devices are placed in the switching field, and these electronic devices are vulnerable to transient electromagnetic interference caused by switching operation. In order to facilitate the measurement and research of electromagnetic disturbance data under different working conditions, a simulation test device is developed in this paper, which can be used to simulate electromagnetic disturbance of GIS substation sensor and secondary device port under switch operation. A four-channel parallel gas switch was designed, and the main characteristic parameters of electromagnetic disturbance generated by the simulation device were measured by using high-frequency pulse power supply as the excitation source. The comparison between the measured waveform and the measured disturbance characteristic parameters of GIS substation shows that it is in good agreement with the measured waveform characteristics, conforms to the basic characteristics of damped oscillation wave, and can be used in the secondary equipment port disturbance voltage coupling characteristics, protection measures evaluation and assessment method research.
Keywords: GIS; transient electric field radiation; time-frequency characteristic; TEM horn antenna
Gas insulated metal-enclosed switchgear has high reliability, strong security, little affected by the external environment factor and maintenance convenient maintenance, compact structure, cover an area of an area small, short installation period, flexible configuration, and the advantages of strong scalability, especially suitable for field congested areas of big cities and substation, underground transformer substation, as well as the rugged mountains of hydropower station [1]. The basin insulator is a key component of GIS, which is composed of metal insert, epoxy insulation and metal flange ring. It has the functions of electrical insulation, isolation gas chamber and supporting conductor, etc. [2,3]. Its electrical, mechanical and thermal conductivity properties are directly related to the safe operation of GIS.
GIS substation switch (including isolating switch and circuit breaker), contact gap occurs breakdown discharge breakdown or heavy, produce the abrupt change of travelling wave to spread, wave impedance changes happening in catadioptric, form the very fast transient over-voltage and fast transient current, not only pose a threat to equipment insulation, also by conduction, radiation and other coupling method in transient electromagnetic disturbance secondary device ports [4,5]. Transient disturbance has the characteristics of short rise time of waveform, large steepness of wave-front, wide frequency range and continuous multiple pulses, etc., which is easy to cause interference to relay protection, control, monitoring and measurement signals of GIS substation [6–8].
At present, the online monitoring test project of the online monitoring device of substation equipment includes the immunity test of damped oscillation magnetic field and countermeasures, which mainly simulates the influence of the disturbance of damped oscillation magnetic field in medium voltage and high voltage substation on the monitoring device.
Electromagnetic interference (EMI) and electromagnetic compatibility (EMC) problems in power systems have been paid more and more attention [9]. Transient electromagnetic field generated during switching operation is one of the important sources of electromagnetic interference in substations [10]. The characteristics of the transient electric field generated by the switching operation of the substation can be understood by field measurement, including the characteristics of the transient field in time domain and frequency domain [11,12]. It is particularly important for the device to be able to simulate the transient radiation electric field in the field, so it is urgent to try to produce a miniaturized device that can simulate the transient radiation electric field in the switching process of GIS.
2 Development of GIS Switching Operation Transient Radiation Field Environment Simulation Device
2.1 Electric Field Waveform Parameters and Overall Design of the Device
2.1.1 Electric Field Parameters
Research institutions and scholars at home and abroad have measured and studied the electromagnetic disturbance of GIS switch operation in 500, 220 and 110 kV smart substations, and obtained a large number of disturbance waveforms. The amplitude and spectrum statistics are shown in Table 1.
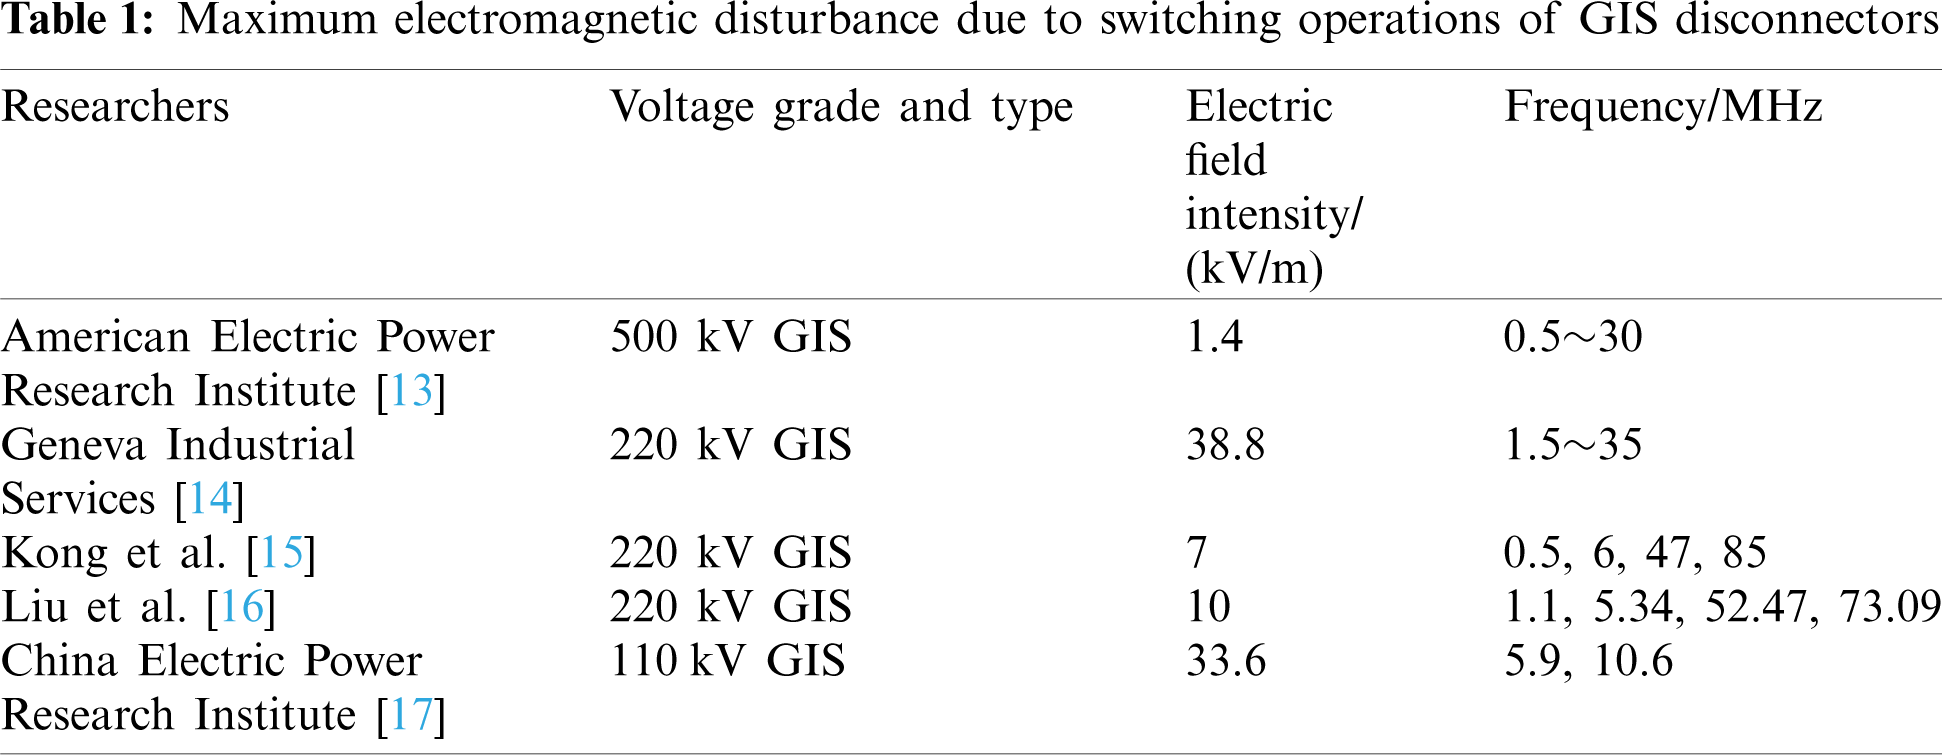
On-site measured voltage levels are 500, 220 and 110 kV from high to low, and measured electric field amplitude ranges from 1.4 kV/m to 38.8 kV/m. The main frequencies are all below 100 MHz, and the low frequency components include 0.5, 1.1 and 6 MHz.
2.1.2 Strong Transient Electric Field Generator
The strong electric field generator consists of three parts: high voltage DC source, high voltage gas switch and radiating antenna. The basic working principle of the simulation device is as follows: firstly, the capacitor C is charged by a high-voltage DC source; When the stored energy of C reaches a certain threshold and the voltage at both ends reaches a certain level U0, the control trigger electrode makes the high voltage switch break down, and the branch of the high voltage DC source and the protection resistor RS is short-circuited, therefor C and the load resistor R form a series circuit. Because of the existence of R, the oscillating current decreases continuously until it reaches zero. The electromagnetic wave is radiated outward by an antenna in parallel with the load resistor. The circuit diagram is shown in Fig. 1.
2.2 Three Electrode High Voltage Gas Switch Design
The main structure of the single channel switch consists of two ball head discharge electrodes, namely high voltage electrode and ground electrode. The radius of the ball head electrode is 15 mm, the gap distance of the ball head electrode is adjustable from 10–30 mm, and the maximum voltage withstand is greater than 20 kV. In addition, there is a trigger electrode structure in the ground electrode, as shown in Fig. 2.

Figure 1: Circuit diagram of strong electric field generator

Figure 2: Single-channel switch and trigger electrode structure diagram
The trigger electrode is a trigger needle with a diameter of 4 mm. The PTFE insulation is used between the trigger electrode and the ground electrode. The discharge gap between the trigger electrode and the ground electrode is oriented to the high voltage electrode. The trigger electrode is connected with the trigger power supply. When the trigger pulse is applied to the trigger electrode, a discharge occurs between the trigger electrode and the ground electrode, thus triggering the conduction of the whole switch gap. In order to avoid the cross-talk between each trigger channel, the channel is isolated, and the trigger power supply is isolated.
Considering the long recovery time of single-channel gas switch, a four-channel parallel gas switch is designed in this paper to simulate the possibility of electromagnetic pulse cluster in actual working conditions. By controlling the four channels to conduct in turn, the emergence of multiple electric field pulses can be realized and the pulse interval value can be controlled. The four-channel switch structure designed in this project is shown in Fig. 3, which is composed of four independent and identical single-channel switches. The structure diagram of a single channel is depicted in Fig. 2.

Figure 3: Four-channel switch structure diagram
2.3 Isolated Trigger Power Supply Design
Based on the working characteristics of semiconductor switch, a Re-frequency pulse power supply is designed. Its output voltage amplitude is 15 kV, the nanosecond pulse power supply can run continuously and stably at 1 kHz, and the maximum repetition frequency of gap operation is 30 kHz.
The pulse power supply usually consists of three parts: primary charging unit, resonant charging unit and pulse amplification unit [18]. The primary charging unit is charged by the DC power supply to the primary energy storage capacitor. The resonant charging unit determines the input energy and system repetition frequency of the pulse power supply, and the pulse amplification unit determines the pulse voltage boost, energy transfer efficiency and output characteristics.
The schematic diagram of the pulse power supply system is shown in Fig. 4. The primary charging power supply Udc resonantly charges the primary energy storage capacitor C1 through the primary winding of switch K1, diode VD1, inductor L1 and pulse booster transformer PT, and the charging current excite the magnetic core of the pulse transformer at the same time. After the charging is completed, the main switch K2 is closed, C1 is discharged, and the low voltage pulse is generated in the primary side of the pulse transformer, and the voltage is boosted through the transformer, and the high voltage pulse output is generated on the load resistor R.

Figure 4: Schematic diagram of isolated trigger power supply
2.4 Combination of Transverse and Longitudinal Waves
2.4.1 The Pulse Power Supply Drives the Control System
When the pulse power is working, it is required that the loop switches K1 and K2 must cooperate with each other to turn on and off accurately and reliably in a fixed timing sequence. The driving timing of the measurement switches K1 and K2 and the load output waveform of the pulse power supply are shown in Fig. 5. For example, T = 100 μs at 10 kHz. T2 > T1, T3 < 100 μs, ensure enough dead time of switches K1 and K2.

Figure 5: Drive timing and load waveform
The realization of drive control of pulse power supply is an important research content. The flow chart of the drive control system is shown in Fig. 6. The signal source of the system uses AT89C52 as the core device, and the trigger signal generated by it is shaped by the frequency limiting circuit. The frequency limiting circuit ensures the reliable operation of the circuit at the same time. After shaping, the signal is amplified by monostable circuit to produce two time-sharing signals with amplitude +15 V. Time-sharing signals are sent to the isolation drive circuit of two pulse transformers to generate the driving voltage of +15 V with the same timing sequence to control the switching on and off of solid-state switches K1 and K2, so that the pulse power supply outputs high-voltage pulses with repeated frequency. System signal source output pulse frequency is 1∼30 kHz, can set the continuous working time or output a fixed number of trigger signals.

Figure 6: Flow chart of drive control system
The output of the designed trigger power can be controlled by the input AC voltage. The typical output waveform of the trigger power is shown in Fig. 7.

Figure 7: Trigger power supply voltage output waveform
2.5 Design of TEM Horn Radiating Antenna
TEM horn antennas connect coaxial transmission lines to the feed through a Barron structure (balanced unbalanced transmission line). In the Barron structure, the conductor in the coaxial line protrudes a certain distance upward and is connected with the upper conductor plate. The antenna formed by the upper and lower plates is equivalent to a section of double transmission lines, guiding transmission of TEM waves.
Due to the variation of impedance caused by the antenna structure, the reflection generated by each part of the horn antenna always exists [19]. In order to reduce the reflection and to achieve the antenna impedance by coaxial 50 Ω transition to trumpet wave impedance Ω end diameter in free space, the antenna horn surface is designed as a curved variable impedance form.
The offset problem is solved by employing the point-feed Barron. The feed is fed vertically into the Barron from below, and the signal in the coaxial transmission line is directly imported into the bipolar plate transmission line. After passing through the Barron, the feed signal is radiated into free space through the curved horn. The curved shape of the horn has a great influence on the radiation performance of the antenna. The characteristic impedance of the horn is related to the horn diameter. Controlling the diameter to make the impedance smooth transition can effectively reduce the reflection and improve the radiation efficiency. In order to guide the energy gathered at the end of the antenna at low frequency and enhance the orientation of the antenna, a kind of end-loading structure with sharp corner shape and curling edge is designed, which is added to the end of the horn antenna. The actual picture and design drawing of the horn antenna are shown in Fig. 8.

Figure 8: The actual picture and design drawing of the horn antenna. (a) Antenna picture (b) Antenna front view (c) Antenna left view (d) Antenna right view
3.1 Radiation Electric Field Testing System
The radiation electric field measurement system selects the SFE1G space free electric field/magnetic field measurement system manufactured by Switzerland Montena®, which can be used to detect space free high-frequency pulse electromagnetic field. The electric field tester is shown in the Fig. 9. The test system mainly consists of a spatial electric field D-DOT sensor and a balance-imbalance converter (Barron).

Figure 9: Radiation electric field tester
Spatial free field sensors are used to measure electric fields away from metal surfaces. The recommended distance from any metal surface or object is greater than 20 cm. For shorter distances, multiple reflections may occur between the sensor and the metal object, resulting in interference with the waveform. Barron is usually used in conjunction with a free-field sensor to eliminate asymmetrical signals between the two sensing elements [20]. The measuring system converts the electric field into voltage signal, and obtains the electric field signal waveform by taking the derivative of the voltage signal. The overall measurement circuit of the space electric field is shown in Fig. 10.

Figure 10: Overall measurement circuit diagram of space electric field
The front view, left view and top view of the SFE1G space free electric field/magnetic field measurement system made by Switzerland Montena® to detect the free high-frequency pulse electromagnetic field in space are shown in Fig. 11.

Figure 11: Space free high-frequency pulsed electromagnetic field on-site inspection diagram (a) The main view (b) The left view (c) The top view
3.2 Radiation Electric Field Waveform
3.2.1 Electric Field Time Domain Waveform
As shown in Fig. 12, (a), (b) and (c) are the output waveforms of two-channel, three-channel and four-channel contact respectively, and the trigger clearance is 4 ms. The device can realize the adjustment of the number of trigger channels and the trigger gap, and simulate one to four electric field pulses, which can better match the field test environment and simulate the process of GIS arc extinguishing and reignition.
3.2.2 Emission Device Electric Field Component
By expanding the pulse waveform as shown in Fig. 13, it can be seen that the radiant electric field is divided into horizontal and vertical directions, and the longer the distance from the antenna is, the higher the proportion of the horizontal electric field is. The radiation electric field pulse presents the basic form of bipolar oscillation attenuation and the amplitude of the disturbance voltage of a single pulse decreases gradually with time from the maximum value at the initial moment. At the initial stage of the electric field, the high frequency components have large amplitude, high oscillation frequency and fast attenuation, while at the later stage of the pulse, there is an oscillation tail with very low frequency.

Figure 12: Channel adjustable output waveform (a) Two-channel trigger output waveform (b) Three-channel trigger output waveform (c) Four-channel trigger output waveform

Figure 13: Pulse detail waveform
3.2.3 The Relationship Between Electric Field Strength, Distance and Breakdown Voltage
The measured electric field time-domain waveforms at different distances and breakdown voltages of GIS isolator switches during operation are shown in Fig. 14. It can be obtained that the electric field waveforms are roughly the same except that the peak field intensity is different, and the radiation electric field presents the basic form of oscillation and attenuation.
Statistics of electric field intensity at different distances and breakdown voltages are shown in Fig. 15. Under the same breakdown voltage, the electric field intensity decreases with the increasing distance. The higher the breakdown voltage at the same distance, the greater the electric field intensity. It can be seen from the parameters in the figure that the maximum electric field amplitude generated by this device varies from 4.8 kV/m to 27 kV/m, which is similar to the field measurement results shown in Table 1. Different electric field amplitudes can be obtained by adjusting the distance during the simulation of real electromagnetic measurement.

Figure 14: Time domain waveform of electric field (a) Voltage level 10 kV distance 40 cm (b) Voltage level 12 kV distance 40 cm (c) Voltage level 10 kV distance 60 cm (d) Voltage level 12 kV distance 60 cm

Figure 15: The influence of distance and breakdown voltage on electric field strength
3.2.4 Electric Field Frequency Domain Waveform
As shown in Fig. 16, the main components of electric field pulse frequency measured are 0.3 MHz, 0.9 MHz and 5.5 MHz, which are close to the measured characteristic parameters in Table 1. The attenuation of the high-frequency component is faster than that of the low-frequency component, and the attenuation of the high-frequency component of the pulse is faster and the duration is shorter. Low frequency components decay slowly and last for a long time. IEC61000-4-12-2017 recommended that the center frequency of the transient voltage simulation waveform of substation switch operation is 1 MHz, so it is more meaningful to study the frequency below 1 MHz in the following study. The resonant frequency of the switch oscillation circuit can be changed by adjusting the capacitor, so as to adjust the center frequency of the switch operated transient radiation field simulation device within a certain range and make it cover a higher frequency.

Figure 16: Frequency domain waveform of electric field
A device to simulate the operation environment of GIS switch transient radiation field was developed, and the disturbance voltage tests of secondary devices such as line monitoring devices caused by simulated switch operation were carried out. The typical electromagnetic disturbance data of GIS equipment isolating switch operation on the sensor and intelligent component ports were obtained. The main conclusions are as follows:
A four-channel parallel gas switch and high frequency pulse power supply is designed. The four-channel parallel gas switch can realize the occurrence of multiple electric field pulses and control the pulse interval value by controlling the four channels to conduct in turn. The channel number is adjustable and the pulse interval time is adjustable. A kind of antenna is designed and manufactured by combining with Barron structure. The maximum electric field amplitude generated by the multi-channel gas switch driving the antenna is 4.8 kV/m to 27 kV/m, and the radiation electric field pulse showed the basic form of oscillation and attenuation. The main frequencies of 0.3 MHz, 0.9 MHz and 5.5 MHz were close to the characteristic parameters of the measured disturbance voltage. The center frequency of the transient radiation field simulator operated by the switch can be adjusted.
Funding Statement: Science and Technology Project of State Grid Corporation of China (Project No. 5226SX18000F); Science and Technology Project of State Grid Shaanxi Electric Power Company (Project No. 5226KY18002M).
Conflicts of Interest: The authors declare that they have no conflicts of interest to report regarding the present study.
1. Kamthe, D., Bhasme, N. R. (2018). Comparative analysis between air insulated and gas insulated substation—Review. Journal of Electrical Engineering & Technology, 9(4), 24–32. DOI 10.1109/CATCON.2013.6737500. [Google Scholar] [CrossRef]
2. Liang, Y., Zhou, L., Chen, Y., Yang, B., Wang, H. et al. (2019). Study on the correlation between internal and external transient phenomena caused by disconnector operation in GIS. IEEE 3rd Conference on Energy Internet and Energy System Integration, pp. 231–236. Changsha, China. [Google Scholar]
3. Wu, H., Jiao, C., Cui, X., Liu, X., Ji, J. (2017). Transient electromagnetic disturbance induced on the ports of intelligent component of electronic instrument transformer due to switching operations in 500 kV GIS substations. IEEE Access, 5, 5104–5112. DOI 10.1109/ACCESS.2017.2695490. [Google Scholar] [CrossRef]
4. Rao, X., Guo, J., Gao, Z., Wu, X., Zhao, Z. (2018). Study on 330 kV GIS transient enclosure voltage caused by disconnecting switch operation. 2018 IEEE International Conference on High Voltage Engineering and Application (ICHVEAthens, Greece, 1–4. [Google Scholar]
5. Zhou, K., Hu, Y., Li, H., Xue, F. (2016). Time frequency characteristic analysis and simulation of VFTO waveform generated by disconnector switch in GIS. International Conference on Condition Monitoring and Diagnosis, pp. 194–197. Xi'an, China. [Google Scholar]
6. Rahmani, S., Razi-Kazemi, A. A. (2015). Investigation of very fast transient over voltages in gas insulated substations. 2nd International Conference on Knowledge-Based Engineering and Innovation, pp. 428–435. Tehran. [Google Scholar]
7. Yang, X. (2019). Study on the spatial radiation EMI characteristics of GIS caused by disconnector operation. 5th International Conference on Electric Power Equipment–Switching Technology, pp. 748–753. Kitakyushu, Japan. [Google Scholar]
8. Darwish, A., Refaat, S. S., Toliyat, H. A., Abu-Rub, H. (2019). On the electromagnetic wave behavior due to partial discharge in gas insulated switchgears: State-of-art review. IEEE Access, 7, 75822–75836. DOI 10.1109/ACCESS.2019.2921089. [Google Scholar] [CrossRef]
9. Xue, H., Ametani, A., Mahseredjian, J. (2019). Very fast transients in a 500 kV Gas-insulated substation. IEEE Transactions on Power Delivery, 34(2), 627–637. DOI 10.1109/TPWRD.2018.2874331. [Google Scholar] [CrossRef]
10. Cheng, L., Zhu, Y., Wang, C. S., Han, W. B., Ren, T. et al. (2018). Study on rise of transient ground potential caused by switching and closing operation in 330 kV GIS substation. China International Conference on Electricity Distribution, pp. 1611–1614. Tianjin. [Google Scholar]
11. Hao, J. (2018). Measurement and characteristic analysis of transient radiated switching E-field of GIS. 2nd IEEE Advanced Information Management, Communicates, Electronic and Automation Control Conference, pp. 157–162. Xi'an. DOI 10.1109/IMCEC.2018.8469409. [Google Scholar] [CrossRef]
12. Xi, W., Fan, Z., Shi, P., Shi, M., Almenweer, R. A. (2017). Study on the transient characteristics of 1100 kV VFTO. 4th International Conference on Electric Power Equipment–Switching Technology, pp. 66–75. Xi'an. [Google Scholar]
13. Russell, B. D. (1983). Measurement and characterization of substation electromagnetic transients. Final reports. USA. [Google Scholar]
14. Chevalley, F., Sauvain, H. (1988). Protection of microprocessor based distributed control units in gas insulated substations against electromagnetic interferences. Paris, CIGRE. [Google Scholar]
15. Kong, X., Guo, F., Liang, T., Chen, Y., Liu, H. et al. (2016). Measurement and waveform characteristic analysis of VFTO radiation electric field generated by closing no-load transformer in 220 kV GIS. Proceedings of the CSEE, 36(18), 5087–5093+5134 (in Chinese). DOI 10.13334/j.0258-8013.pcsee.151878. [Google Scholar] [CrossRef]
16. Liu, X., Cui, X., Wu, H., Lei, L., Zhao, B. et al. (2015). Simulation experimental study on disturbance voltage of sensor and intelligent component port in GIS device switching operation. Smart Grid, 3(1), 67–73 (in Chinese). DOI 10.14171/j.2095-5944.sg.2015.01.012. [Google Scholar] [CrossRef]
17. Hang, J., He, J., Zhao, J. (2014). Characteristics analysis of switching transient disturbance to secondary equipment port of 1000 kV substation. Proceedings of International Conference on Power and Energy, Shanghai. [Google Scholar]
18. Rao, J., Zhang, W., Li, Z., Jiang, S. (2018). Nanosecond pulse generator with series avalanche transistors. High Power Laser and Particle Beams, 30(9), 77–83 (in Chinese). DOI 10.11884/HPLPB201830.180103. [Google Scholar] [CrossRef]
19. Andre, H., Emeraldi, P., Hazmi, A., Waldi, E. P., Khayam, U. (2017). Long bowtie antenna for partial discharge sensor in gas-insulated substation. International Conference on High Voltage Engineering and Power Systems, pp. 175–178. Bali. DOI 10.1109/ICHVEPS.2017.8225937. [Google Scholar] [CrossRef]
20. Li, S., Zhao, C. (2017). Measurement of radiated electric field caused by VFTO of UHV GIS circuit breaker. 7th IEEE International Symposium on Microwave, Antenna, Propagation, and EMC Technologies, pp. 386–389. Taiyuan, IEEE. [Google Scholar]
 | This work is licensed under a Creative Commons Attribution 4.0 International License, which permits unrestricted use, distribution, and reproduction in any medium, provided the original work is properly cited. |