| Energy Engineering |
DOI: 10.32604/EE.2022.016899
ARTICLE
Research on Flashover Voltage Prediction of Catenary Insulator Based on CaSO4 Pollution with Different Mass Fraction
1College of Automation & Electrical Engineering, Lanzhou Jiaotong University, Lanzhou, 730070, China
2Rail Transit Electrical Automation Engineering Laboratory of Gansu Province, Lanzhou Jiaotong University, Lanzhou, 730070, China
*Corresponding Author: Junjun Wang. Email: wjj2473844386@126.com
Received: 07 April 2021; Accepted: 28 June 2021
Abstract: Pollution flashover accidents occur frequently in railway OCS in saline-alkali areas. To accurately predict the pollution flashover voltage of insulators, a pollution flashover warning should be made in advance. According to the operating environment of insulators along the Qinghai-Tibet railway, the pollution flashover experiments were designed for the cantilever composite insulator FQBG-25/12. Through the experiments, the flashover voltage under the influence of soluble contaminant density (SCD) of different pollution components, non-soluble deposit density (NSDD), temperature (T), and atmospheric pressure (P) was obtained. On this basis, the GA-BP neural network prediction model was established. P, SCD, NSDD, CaSO4 mass fraction (w(CaSO4)), and T were taken as input parameters, 50% flashover voltage (U50%) of the insulator was taken as output parameters. The results showed that the prediction deviation was less than 10%, which meets the basic engineering requirements. The results could not only provide early warning for the anti-pollution flashover work of the railway power supply department, but also be used as an auxiliary contrast to verify the accuracy of the results of the experiments, and provide a theoretical basis for the classification of pollution levels in different regions.
Keywords: Overhead contact system; w(CaSO4); insulator; pollution flashover test; genetic algorithm-back propagation (GA-BP) neural network; flashover voltage prediction
At present, there are many types of research on AC flashover characteristics of contaminated insulators at home and abroad. For example, Guo et al. [1] examined the influence of salt spray on the flashover characteristics of insulators, and the relationship between salt density and additional salt density and insulator flashover voltage was given. Yuan et al. [2] considered the effects of salt density and non-soluble deposit density on the flashover characteristics of insulators. With the popularization of the electrified railway, power transportation in the plateau region is further faced with many problems [3,4]. In northwest China, there are slight precipitation and more sand and dusty weather. Frequent sandstorms will cause contamination of a large area of line insulators, which will lead to the decline of the electrical performance of insulators and lead to accidents [5]. According to the investigation of the working environment of the Overhead Catenary System (OCS) along the Qinghai-Tibet Railway, the Qinghai-Tibet Railway passes through Qarhan Salt Lake, Chaka Salt Lake, Mahai Salt Lake, Kunteyi Salt Lake, and Keke Salt Lake in Qinghai Province, and Ebi Lake, Xiao Salt Lake and Aiding Lake in Xinjiang Province. The soil near the salt lake is seriously salinized. The soil generally contains cations such as Na+, Mg+, and Ca2+. The anions include Cl–, SO42−, etc. Zhang et al. [6] discovered the mass fraction of CaSO4 accounted for 20%–80%, while the mass fraction of soluble salt NaCl only accounted for 10%–40%, and other pollution components accounted for 10%–40% in the compound composed of these ions. Also, CaSO4 is slightly soluble in water and would reach ionization equilibrium in an aqueous solution, as shown in Eq. (1) [7]
Ionization produced strong electrolyte soluble in water, making the solution conductivity, assuming that all the pollution components are NaCl, the full dissolution of the electrolyte will produce strong electrical conductivity. but in fact, the dirty ingredients are not only soluble salt NaCl, but also slightly soluble salt CaSO4, this leads to insulator pollution flashover voltage without considering slightly soluble salt and considering slightly soluble salt of different results. As can be seen from Sihua et al. [8], if the existence of micro-dissolved salt is not considered, the flashover voltage of insulators obtained is usually lower than that when its existence is considered. Therefore, the influence of CaSO4 content on the flashover voltage of OCS insulators in the saline-alkali areas needs to be considered to obtain a more accurate flashover voltage. Flashover voltage prediction of OCS insulators based on the consideration of different pollution components can not only provide early warning for the safe operation of OCS but also reduce the workload of cleaning insulators in railway departments and save a lot of costs.
At present, there are many methods to predict the flashover voltage of insulators. Some scholars predict the critical flashover value by extracting the feature in the process of insulator discharge. For example, Mousalreza Faramarzi Palangar and Mohammad Mirzaie established a mathematical model to analyze the third harmonic and fifth harmonic ratio of the leakage current in the process of insulator discharge and took it as the key factor to predict the critical flashover value. A device for monitoring the harmonic changes of leakage current is also researched by [9–14]. This method can accurately predict the flashover voltage and has strong practicability. Some scholars use some specific algorithms to predict the insulator working condition under the influence of a single factor or multiple factors in processing the data results of flashover voltage. Common prediction methods mainly include support vector machine [15], least square method [16], and BP neural network prediction [17]. These methods can be used to predict the insulator flashover voltage under the influence of multiple factors, with a low cost, simple operation, and wide application range, which can achieve high benefits in exchange for a low cost. BP neural network has the advantages of self-learning and self-adaptation and has become a common method used by many scholars at present. However, this method is easy to fall into local optimal, so choosing an optimization algorithm to optimize BP neural network can avoid this situation and better achieve the purpose of prediction.
This paper aims at the pollution flashover phenomenon of the composite insulator of OCS in the saline-alkali area, AC flashover test was carried out on the polluted catenary insulator FQBG-25/12 in a complex environment, get the AC flashover characteristic of insulator. The effects of SCD, NSDD, ambient temperature and atmospheric pressure with the mass fraction of CaSO4 on the flashover voltage are analyzed, and thus build contamination insulator flashover voltage of GA-BP neural network prediction model, according to the results of model prediction is obtained by simulation. The prediction results can show different pollution flashover characteristics according to different pollution components of insulator surfaces in different regions, which provide theoretical support for different pollution levels in different regions.
2 Insulator Pollution Flashover Tests
AC test power supply is generated by 200 kV/1200 kVA AC without halo pollution test transformer. The test conforms to the national standard IEC-60507 (2013) [18] for insulator pollution and voltage test. The catenary composite insulator FQBG-25/12 was selected as the test product. The insulator structure diagram of the test product is presented in Fig. 1 (unit: mm). The test parameters are given in Table 1. The test was carried out in the artificial pollution laboratory, which was 2900 mm high, 4800 mm long and 4000 mm wide. The power supply is connected to the insulator under test through the wall bushing after the voltage regulator is boosted by the transformer. The contamination, dampness, applied voltage, and flashover tests of the insulator are all completed in the weather chamber. The artificial climate chamber and wiring diagram of the test are shown in Fig. 2. Adjust the voltage at both ends of the voltage regulator, boost the voltage level required by the test through the transformer, and introduce the line into the artificial climate chamber through the wall bushing. The test voltage is paralleled at both ends of the test object through the voltage divider and measured using an oscilloscope. The climate chamber is fitted with fog generator and associated air pressure and temperature detection equipment. The outside of the climate chamber is provided with corresponding protection circuit and data acquisition devices. In the table, h is structure height, H is dry arc distance, L is creepage distance, D is shed diameter, d is stem diameter and S is the surface area of the insulator.
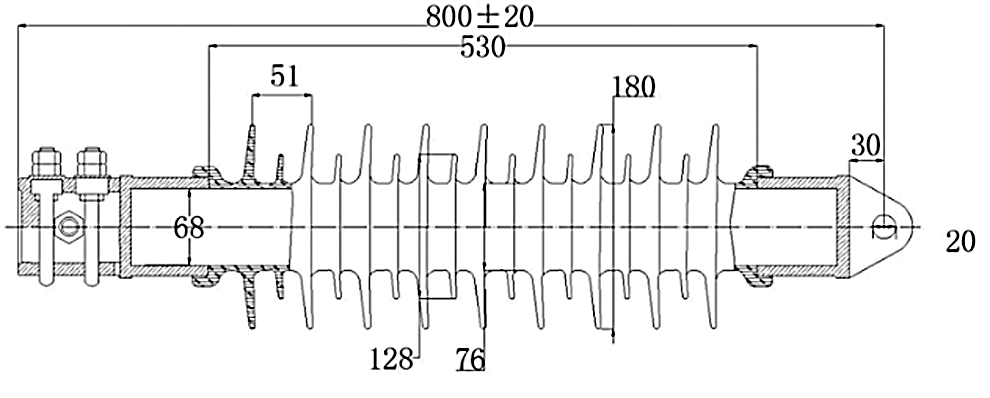
Figure 1: Structure diagram of FQBG-25/12 insulator
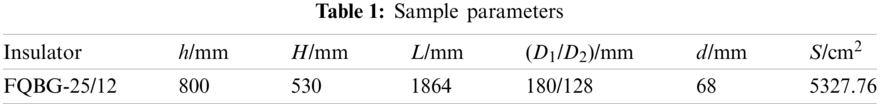

Figure 2: Schematic diagram of test (a) Artificial fog chamber, (b) Wiring diagram of the test
1. Prepare 5 groups of insulator samples, clean the insulators with deionized water before the test, and dry them in a cool place for use.
2. Configuration soluble salt solution choice CaSO4 and NaCl according to w (CaSO4) = 0, 20%, 50%, 80%, the proportion of mixed configuration, ρ(SCD) denotes the density of soluble salt deposits; when the insoluble solution was prepared, diatomite and kaolin were mixed at the ratio of 10:1, ρ(NSDD) was used to denote the non-soluble deposit density. According to the SCD and NSDD required for contamination, the weight of soluble and insoluble substances required for a test sample can be calculated by using the surface area of the insulator. After weighing with 1/1000 balance, mix them together, add the appropriate amount of dextrin and conductivity less than 10 μS/cm water, mix well, and set aside. Prepare 5 copies of this liquid for application.
3. Insulators that have been pretreated are fouled by the solid layer method. Before fouling, dry absorbent cotton should be used to lightly wipe the surface of the insulator, and then a thin layer of diatomite should be coated on the surface to weaken or temporarily lose hydrophobicity without damaging the fouling on the surface of the insulator. Apply the prepared fouling liquid layer by layer evenly on the surface of an insulator test sample until each prepared waste liquid is completely applied on each test sample, and then place it in a cool place to dry for 12 h.
4. Connect the air-dried insulators and the climate chamber according to the test schematic diagram, spray immediately after applying the voltage, and maintain the voltage constant. The composite insulator can be fully wetting within 7~15 min when the boiler steam pressure is maintained at 5 MPa. If the insulator surface pollution is completely wet and liquid drops do not drip along the edge of the umbrella skirt, it is considered that the filth is successfully damp, which has met the test requirements.
5. The test object is suspended in the artificial climate room, and the indoor air pressure is modified by pumping out the indoor air to meet the requirements of the test. In the process of air extraction, the speed of air extraction should not cause condensation on the insulator surface. Temperature control equipment is used to adjust the temperature in the test room. Temperature measurement is carried out in the climate room. When the temperature required by the test is reached and does not change within 5 min, the temperature is kept for the test.
6. According to Zhang et al. [19], the method of constant voltage rise and fall can more truly reflect the operating state of insulators on-site, and it is carried out by IEC-60507 Test Procedure B when a voltage is applied. Different test environments were selected to conduct 3~4 pollution flashover tests on each group of insulators, ensuring that the number of effective tests should not be less than 10 times. The calculation formula of 50% flashover voltage and voltage standard deviation obtained by using the constant voltage rise and fall method is shown in Eq. (2).
where, N is the effective number of tests; U50% is 50% test flashover voltage; ni is the ith test, and Ufi is the flashover voltage of the ith test; σ is the standard deviation of the test.
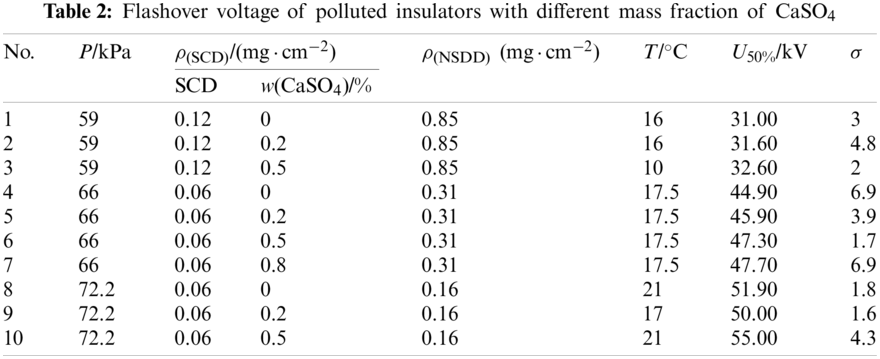
7. According to Eq. (2), the test results are screened and all data with voltage standard deviation greater than 10% are discarded. Some test results are presented in Table 2. The test results were calibrated for atmosphere and temperature according to the g parameter method of [20] IEC 60060-1(2010). In the table, P is atmospheric pressure, T is temperature, and σ is experimental deviation.
3 Influence of CaSO4 Content on Flashover Voltage of the Insulator
Through the test, the flashover voltage results of insulators heavily contaminated by CaSO4 mixed salt density with different mass fractions were obtained. By analyzing the test results, the relationship between the soluble salt CaSO4 and various influencing factors and the influence degree of the content of CaSO4 on the flashover voltage of insulators could be obtained.
3.1 Relationship between CaSO4 Content and SCD and NSDD
The operating environment of OCS insulators is complex, so a single influencing factor cannot reflect the operating condition of insulators on site. Based on Jiang et al. [21], composite insulator pollution flashover voltage and the surface of the insulator SCD and NSDD are closely linked, both can affect the flashover voltage of insulator independently. Jiang et al. [21] also gave the calculation formula of insulator flashover voltage under the independent influence of SCD and NSDD, as shown in Eqs. (3) and (4), Eq. (5) was the empirical formula for the flashover voltage of an insulator under the combined action of SCD and NSDD.
where, Uf is flashover voltage. A, B and L are constants determined by insulator structure and material, a and c are insulator SCD influence characteristic index, b and d are insulator NSDD influence characteristic index.
The relationship between the mass fraction of CaSO4 and these two can be obtained through the test data, as shown in Figs. 3 and 4.
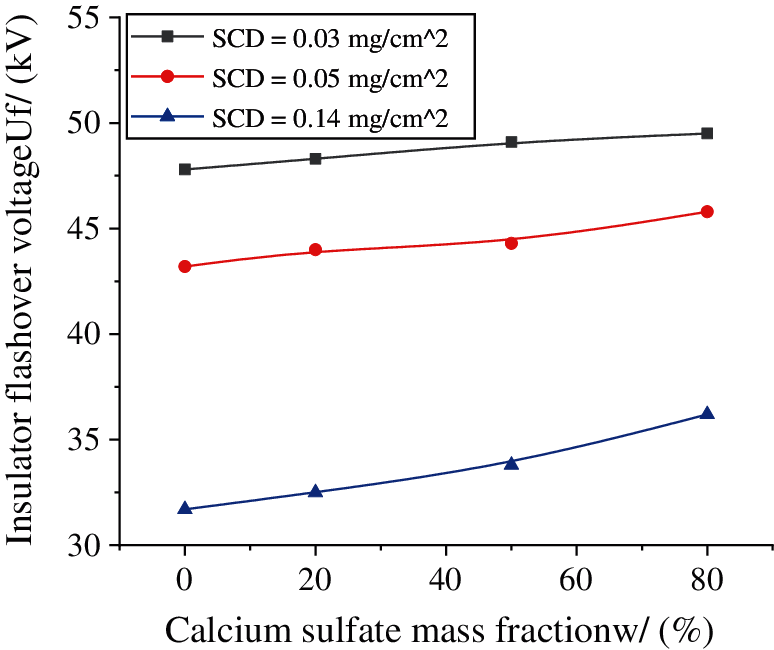
Figure 3: Influence curve of CaSO4 mass fraction on flashover voltage of insulators under different salt densities
Fig. 3 displays the relationship between insulator flashover voltage and the content of CaSO4 insoluble salt when the SCD is 0.03, 0.05, and 0.14 mg/cm2. It can be observed in the figure that the flashover voltage of the insulator generally increases with the increase of the CaSO4 mass fraction. With the increase of SCD, the upward trend of the curve increases, and the higher the content of SCD, the lower the insulator flashover voltage will be.
This is mainly because the higher the SCD content is, the more soluble salt covers the insulator surface area. When the soluble salt dissolves in water, it ionizes and produces an electrolyte solution. The electrolyte solution increases the surface conductivity of the insulator, increases the surface leakage current of the insulator, and reduces the flashover voltage of the insulator.
Fig. 4 indicates the relationship between insulator flashover voltage and CaSO4 mass fraction when the surface NSDD of the insulator is 0.16, 0.31, and 0.85 mg/cm2. It is noted that with the increase of CaSO4 mass fraction, the insulator flashover voltage also shows a trend of gradual increase. When the surface NSDD of the insulator increases, the flashover voltage of the insulator gradually decreases under the same CaSO4 mass fraction, and the change curve of the flashover voltage of the insulator gradually flattens with the increase of the mass fraction of CaSO4 when the NSDD is larger. The reasons for this change are insoluble sediment of the insulator surface covered in the main role for the adsorption of water, the more moisture contained in the surface when the insulator surface solubility of soluble salt, the greater the amount of dissolved, the more the electrolyte solution is, the more increase the conductivity of the salt solution, which reduces the insulator flashover voltage. However, with the increase of the NSDD, the water absorption amount of pollution on the surface of the insulator reaches saturation. In this case, even if the NSDD is further increased, the surface of the insulator will no longer absorb water, and the soluble salt solution will not continue to increase with the increase of the NSDD. As a result, with the increase of the mass fraction of CaSO4, the variation range of the flashover voltage of the insulator will decrease.
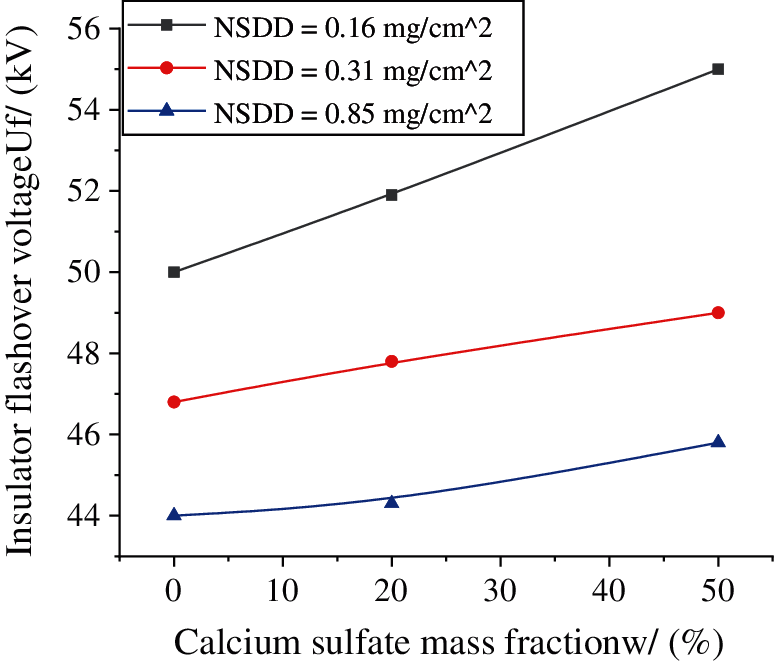
Figure 4: Influence curve of CaSO4 mass fraction on flashover voltage of the insulator under different NSDD
3.2 Relationship between CaSO4 Content and Temperature and Atmospheric Pressure
Guan et al. [22] discovered that the flashover voltage of an insulator would decrease with the rise of altitude (the decrease of atmospheric pressure). Yuan [23] explained that the flashover voltage of an insulator would also be different at different temperatures. According to existing experience, the temperature would decrease by 0.2°C~0.3°C for every 1 m increase in altitude. Guan et al. [22] gave the relationship between atmospheric pressure and insulator flashover voltage, as shown in Eq. (6), from which it can be seen that the flashover voltage has an exponential relationship with the atmospheric pressure. Yuan [23] provided the relationship between insulator flashover voltage and temperature, as shown in Eq. (7). Temperature can change the conductivity of the pollution layer during partial discharge on the surface of the insulator. The increase in temperature enhances the conductivity of the pollution layer and reduces the flashover voltage of the insulator.
where, n is the characteristic index of the influence of atmospheric pressure on the insulator flashover voltage, P0 is the standard atmospheric pressure, Uf(P) is the flashover voltage when the atmospheric pressure is P, Uf (P0) is the flashover voltage under the standard atmospheric pressure.
where, t is the ambient temperature,
According to the test results, the relation curves of insulator flashover voltage and mass fraction of CaSO4 at different temperatures and atmospheric pressure are shown in Figs. 5 and 6. Fig. 5 shows the relationship curve between the insulator flashover voltage and the mass fraction of CaSO4 under the influence of different temperatures, as can be seen from the figure of insulator flashover voltage with the increase of mass fraction CaSO4 is on the rise, and when the temperature rises under the same CaSO4 mass fraction insulator flashover voltage is reduced, when the mass fraction of CaSO4 is 0, the flashover voltage difference of the insulator is the largest, the principal causes of this change is related with CaSO4 solubility in the aqueous solution, as shown in Fig. 7 for CaSO4 solubility in the aqueous solution curve. It can be seen from the figure that the solubility of CaSO4 reaches the maximum when the temperature is about 40°C. Therefore, the solubility of CaSO4 in the solution at 34°C is higher than that at 11°C and 20°C, and the degree of electrolyte ionization is higher, generating more conductive ions. Therefore, the insulator flashover voltage at this temperature is the lowest.
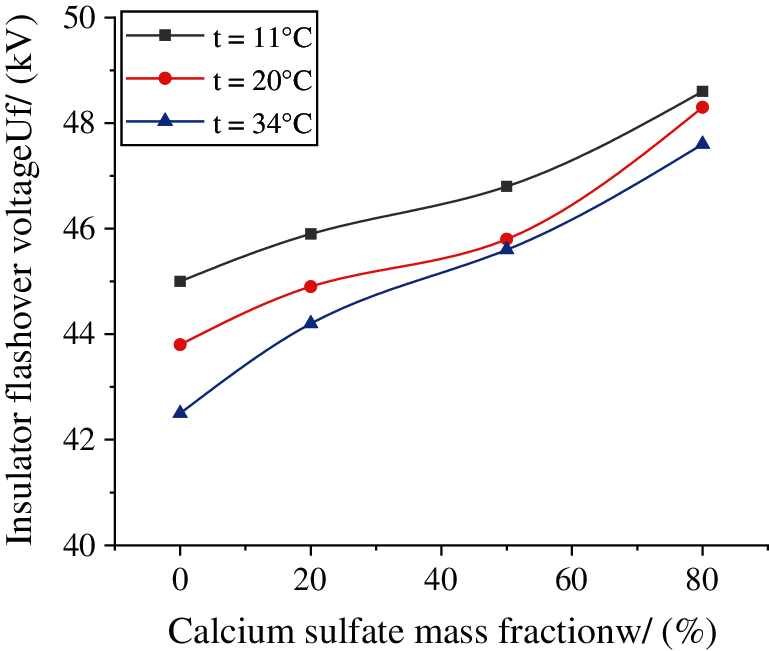
Figure 5: Influence curve of CaSO4 mass fraction on insulator flashover voltage at different temperatures
When the mass fraction of CaSO4 increases from small to large, the flashover voltage gradually narrates and the curve gradually steepens. Studies have found that the main reason for this change is that when CaSO4 is dissolved in a small amount of NaCl solution. Yan et al. [25] considered there would be a “synergistic solubility” effect with the increase of NaCl content. NaCl solution will promote the dissolution of CaSO4, and the ion concentration in the solution is more than that in the aqueous solution, so the flashover voltage of the insulator decreases greatly. When the content of NaCl increases and the content of CaSO4 reduces, CaSO4 forms ion pairs in the high-salt solution, and the electrostatic interaction between ions is strengthened, which reduces the solubility of CaSO4. The increased rate of the concentration of conducting ions in the solution decreases, leading to the decrease of the flashover voltage of the insulator.
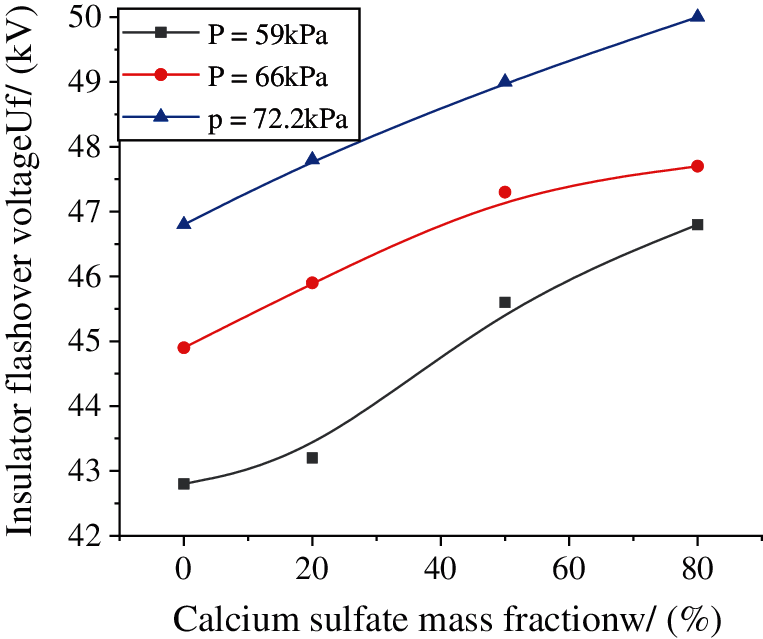
Figure 6: Influence curve of CaSO4 mass fraction on flashover voltage of the insulator under different atmospheric pressure
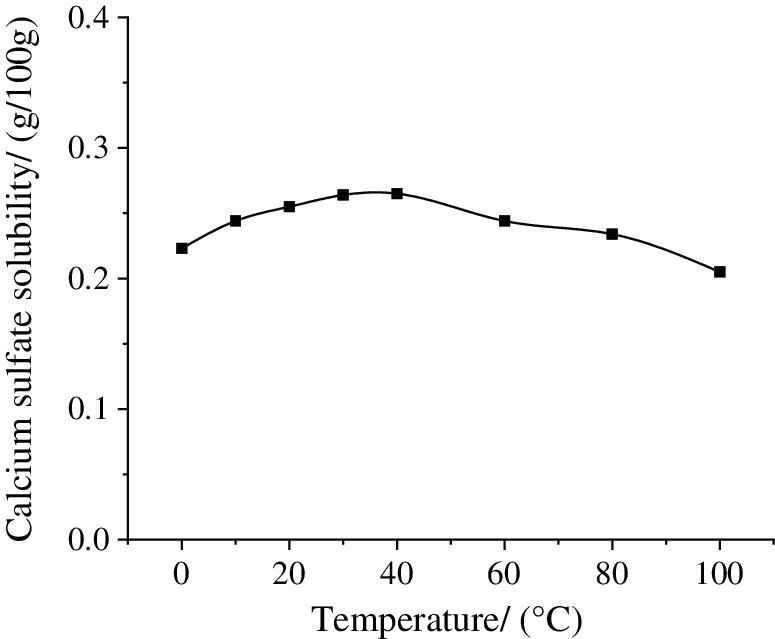
Figure 7: Solubility curve of CaSO4 in aqueous solution
Fig. 6 for insulator flashover voltage and the mass fraction of CaSO4 relation curve under different atmospheric pressure. It can be seen from the figure that the flashover voltage of insulators contaminated by the same mass fraction of CaSO4 decreases with the decrease of air pressure, the pressure on the solubility of CaSO4 impact is not remarkable, Therefore, when the mass fraction of CaSO4 increases under different atmospheric pressures, the insulator flashover voltage increases to a similar extent.
Through the insulator flashover voltage under the influence of different factors change with CaSO4 mass fraction curve were analyzed, it is found that there is a certain relationship between CaSO4 and other factors, and the flashover voltage of insulator depends not only on the content of soluble salt NaCl on the surface of the insulator, the non-soluble deposit, the temperature, and the atmospheric pressure, but also CaSO4 slightly soluble salt content on the surface of the insulator has certain relations, this paper analysis determines the catenary pollution flashover voltage prediction model is the basic structure of the insulator pollution flashover.
4 Prediction Model Establishment
To predict the pollution flashover voltage of the catenary insulator in saline-alkali area, a prediction model of GA-BP (Genetic Algorithm-Back Propagation) neural network optimized by Genetic Algorithm was established. A Neural network has the advantages of self-learning and self-adaptation, and can independently process many data samples [26]. According to Zhang et al. [27] survival rule of the biological population, a genetic algorithm can help the neural network avoid falling into local optimal value in the process of searching for the optimal, to ensure the validity of data. Combined with the relevant contents in Section 3, the structure diagram of the BP neural network is constructed, as shown in Fig. 8. The prediction flow chart of the GA-BP neural network is given in Fig. 9.
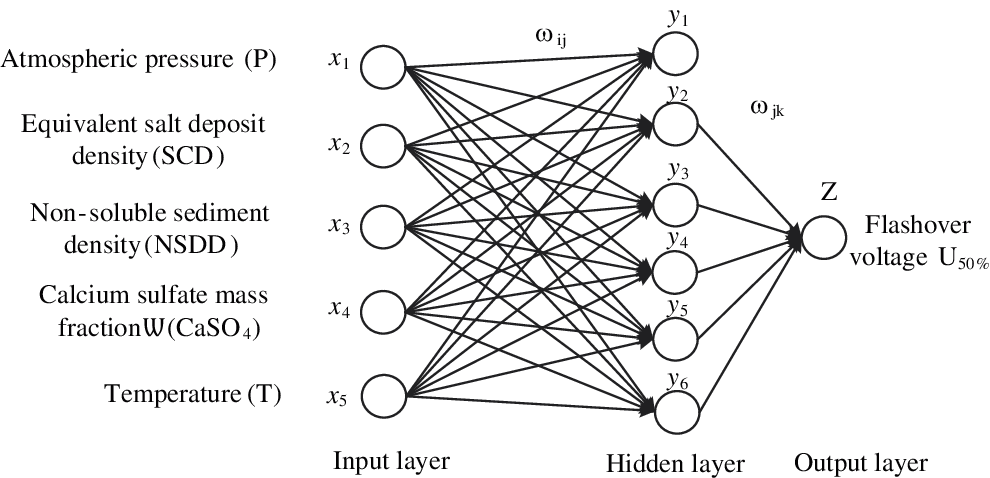
Figure 8: Structure of BP neural network
BP neural network includes an input layer, a hidden layer, and an output layer. In this paper, atmospheric pressure, SCD, NSDD, calcium sulfate mass fraction, and temperature are taken as input parameters, the number of hidden layers is set as 6, and the insulator 50% flashover voltage is taken as output parameters. ωij is the connection weight between the input layer and the hidden layer, and ωjk is the connection weight between the output layer and the hidden layer. After the input parameters, the forward feedback error is passed to constantly change the connection weight to meet the ultimate training accuracy requirements.
As shown in Fig. 9, GA-BP neural network algorithm steps are as follows:
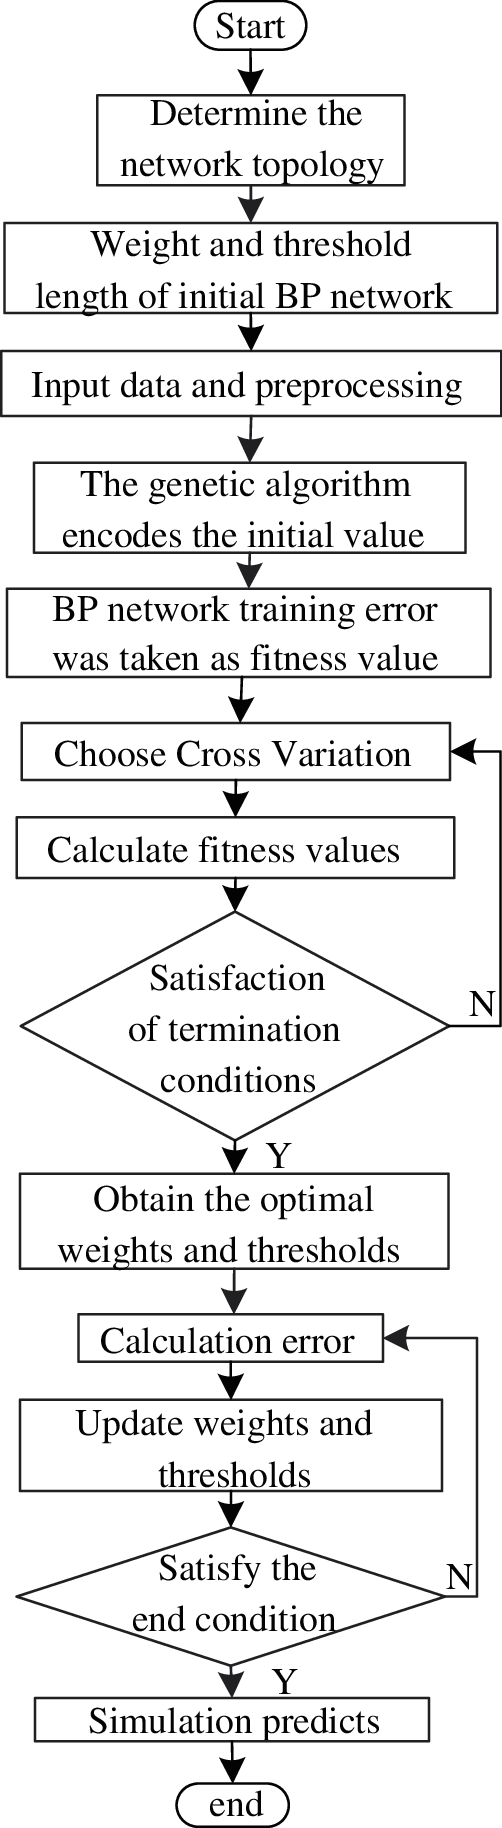
Figure 9: GA-BP neural network prediction flow chart
1. Determine the network topology
2. Initialize the weights and thresholds of the BP neural network and “normalize” the data.
The processing process is presented in Eq. (8).
where, xmin is the smallest number in the data sequence; xmax is the maximum number in the data sequence.
3. Initial value coding.
Using the method of real number coding, the optimal encoding of real string data is realized.
4. Fitness function.
The calculation formula of fitness value F is presented in Eq. (9).
In the formula,
5. Selection, crossover, and mutation operations.
The probability of population individual i being selected, Pi, is presented in Eq. (10).
where, Fi is the fitness value of individual i; k is the coefficient; N is the number of individuals in the population.
The intersecting method was used to change the internal gene composition of the encoded individuals. The new individual was obtained by mutating the jth gene aij of the ith individual.
6. Calculate fitness.
The fitness value is recalculated for the mutated real string, and the optimal individual is selected in each iteration to judge whether the condition is satisfied or not. If yes, the optimal weight and threshold value are obtained. If not, go to “Select” and start again.
7. Update weights and thresholds.
The established prediction model was imported into MATLAB simulation software, the input parameters for atmospheric pressure (P), soluble contaminant density (SCD), non-soluble deposit density (NSDD), calcium sulfate mass fraction w (CaSO4), and temperature (T) five factors, set the hidden layer is 6, 50% insulator flashover voltage for the output parameters.
A total of 52 groups of data from the test results were taken as the simulation input data, and 42 groups of data were randomly selected as the training samples, while the remaining 10 groups of data were used as the prediction control group. Simulation results for fitness curves, predicted results output
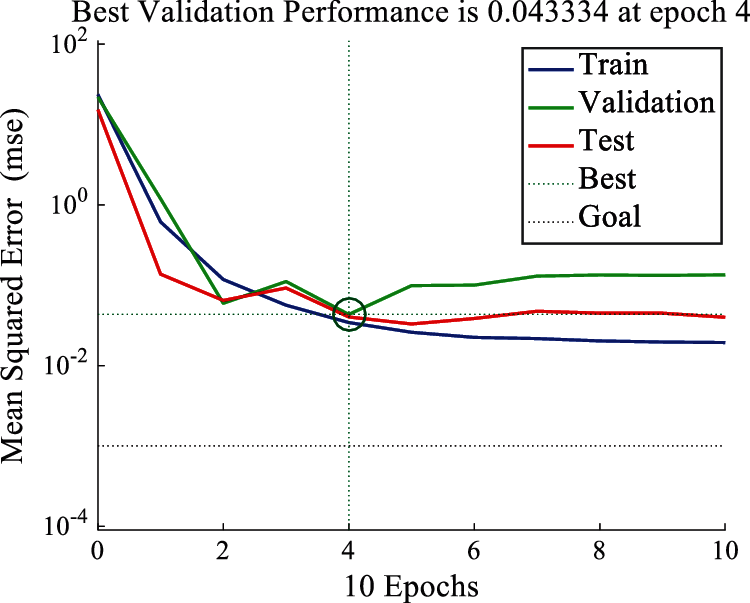
Figure 10: GA-BP neural network training results

Figure 11: Fitness curve of GA-BP neural network
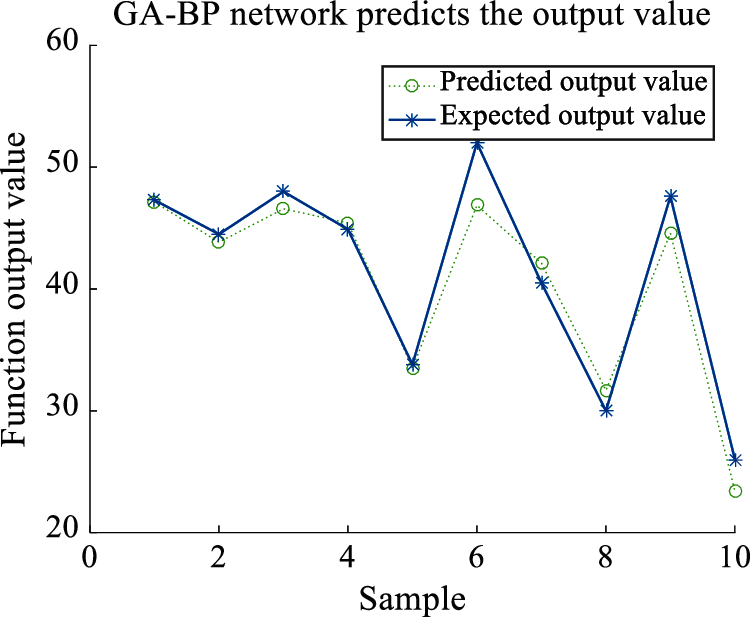
Figure 12: Prediction output of GA-BP network
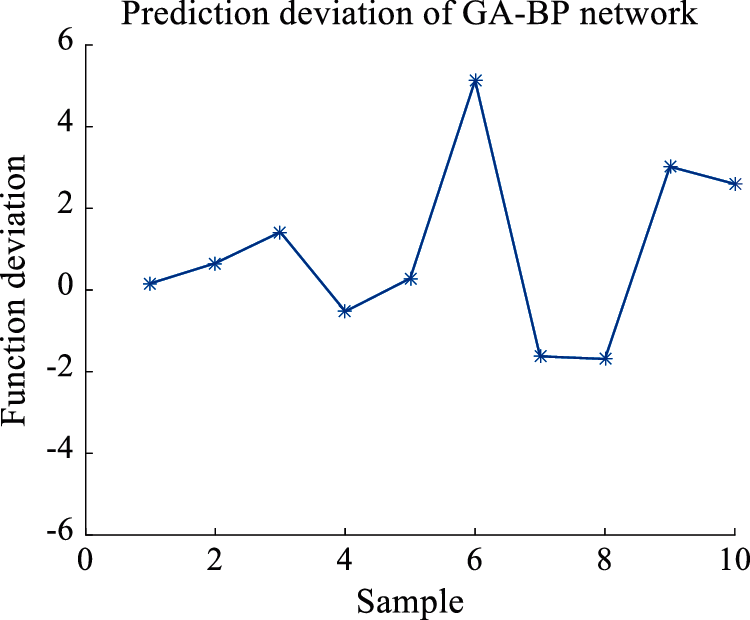
Figure 13: Prediction deviation of GA-BP neural network
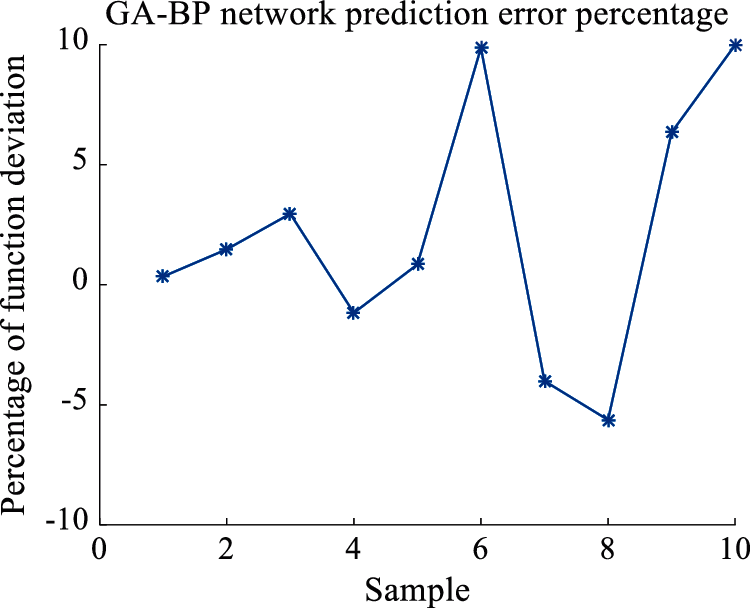
Figure 14: Prediction deviation percentage of GA-BP neural network
In Fig. 10, MSE is the prediction accuracy, and EPOCHS is the number of network training steps. It can be observed from the figure that the training, verification, and testing functions of the neural network reached the optimal accuracy of 0.043334 when the neural network was trained to the fourth step.
As can be observed from Fig. 11, the optimal fitness appeared in the ninth generation after BP neural network was optimized by a genetic algorithm. With the increase of evolutionary algebra, the fitness of the population also increased continuously, which was in line with the basic law of the genetic algorithm. According to the fitness curve, the average fitness was 22.03.
Fig. 12 shows the degree of agreement between the predicted results and the expected results. As can be seen from the figure, the difference between the predicted results and the expected results is small, and the predicted results can well match the expected values. The variation trend of the two is basically the same, indicating that the established prediction model is reliable.
Fig. 13 shows the deviation between the predicted result and the expected result. It can be seen from the figure that the deviation between the two remains between the interval (–2,6), most of the data is concentrated between (–2,2), and only a few values deviate from this interval. Fig. 14 shows the percentage deviation of the forecast results. As can be observed from the figure, the percentage deviation of the function remains within the interval of (–10,10). The first 5 points are all distributed near 0, and the next 5 points deviate from the center of 0, but all the results are less than ±10%.
The simulation results in Figs. 12–14 are listed in Table 3 to facilitate the analysis and prediction of the consequences. In Table 3,
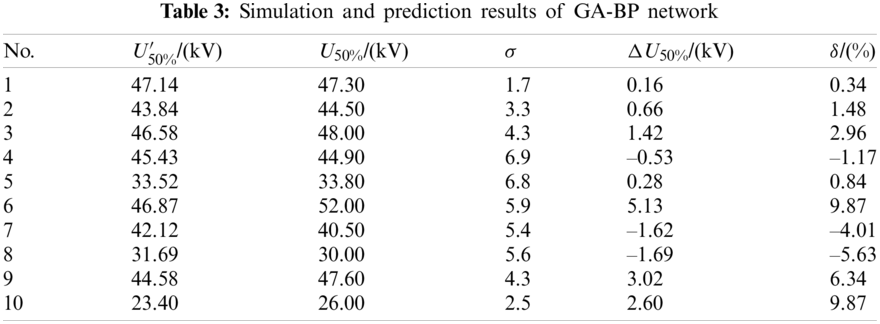
The data in the table are presented in the form of a scatter graph, as shown in Fig. 15. Fig. 15 shows the distribution of two kinds of numerical samples, the deviation, and the percentage of deviation, of the prediction results of the GA-BP network. It can be seen from the figure that the distribution of the prediction deviation results is relatively concentrated, most of which are distributed near the 0 coordinate axes, and a few of which are dispersed, but none of which exceeds ±6 kV. In terms of the percentage of prediction deviation, the data are dispersed to a large extent. The former part of the data is more centralized and distributed near the coordinate axis, while the latter part of the data is distributed in a more dispersed location, which is far away from the coordinate axis and tends to be close to 10%, but not more than ±10%. As can be seen from the figure, there is a vast difference between the numerical distribution of deviation percentage and the distribution of predicted deviation value, but the overall trend is similar.
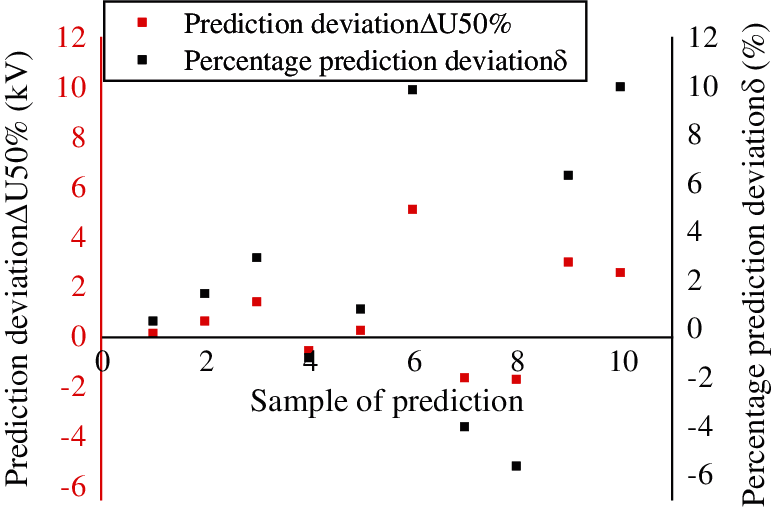
Figure 15: Analysis of prediction results of insulator flashover voltage
According to the existing prediction results and result from analysis, the GA-BP neural network prediction model established in this paper for predicting the pollution flashover voltage of OCS catenary composite insulators, the deviation percentage of all the prediction results obtained is no more than 10%, which can meet the basic engineering requirements.
by the natural environment along the railway in northwest saline region research, determined the environmental factors affecting the operation of the railway catenary insulator. The pollution flashover voltage of the insulator under the influence of SCD, NSDD, temperature, and atmospheric pressure was obtained by experiments, for modeling prediction of insulator flashover voltage provides data supported.
1. The analysis of the variation curve of insulator flashover voltage with CaSO4 mass fraction under the influence of diverse factors shows that the greater the salt density is, the lower the flashover voltage of the insulator will be. With the increase of CaSO4 mass fraction, the flashover voltage of the insulator increases slightly under the same salt density; increasing the surface NSDD within a certain range will increase the surface water absorption, and the increase of solvent will promote the dissolution of more CaSO4, which will reduce the flashover voltage of the insulator; the solubility of CaSO4 in water does not change significantly with temperature, but peaks at about 40°C, which also affects the flashover voltage of the insulator to a certain extent. The change of atmospheric pressure has little influence on the solubility of CaSO4, but it will affect the flashover voltage of the insulator.
2. The flashover voltage prediction model of the OCS catenary composite insulator was established according to the test results. Through simulation, it was found that the deviation between the predicted results and the test results was less than 10%, and the predicted results could meet the basic engineering requirements.
Funding Statement: Supported by the National Natural Science Foundation of China (51767014), and the Scientific and Technological Research and Development Program of the China Railway (2017J010-C/2017).
Conflicts of Interest: The authors declare that they have no conflicts of interest to report regarding the present study.
1. Guo, Y., Jiang, X., Meng, Z., Li, Y., Gao, B. (2017). AC pollution flashover characteristics of polluted insulators under salt spray conditions. Acta Electrotechnics, 32(13), 248–254+270. DOI 10.19595/j.cnki.10006753.tces.151720. [Google Scholar] [CrossRef]
2. Yuan, J., Jiang, X., Shu, L., Zhang, Z., Zhang, Y. (2007). Effect of salt/ash density on AC artificial pollution flashover characteristics of different types of insulators. Chinese Journal of Electrical Engineering, 6, 96–100. DOI 10.13334/j.0258-8013.pcsee.2007.06.020. [Google Scholar] [CrossRef]
3. Guan, Z., Wang, L. (2003). High voltage transmission in high altitude areas of Western China. China: China Society of Surveying and Mapping. [Google Scholar]
4. Shi, W., Guan, Z., Wang, L., Zhou, J. (2005). Study on special environmental conditions along 110 kV transmission line of Qinghai-Tibet Railway. High Voltage Technology, 1, 5–6+11. DOI 10.13336/j.1003-6520.hve.2005.01.002. [Google Scholar] [CrossRef]
5. Wang, H. (2018). Study on dynamic pollution accumulation and prediction of catenary insulator in salt alkali dust area (Ph.D. Thesis). Lanzhou Jiaotong University, Lanzhou. [Google Scholar]
6. Zhang, Z., Zhang, D., Yuan, C., Jiang, X., Liu, X. (2014). Influence of pollution composition on AC flashover characteristics of XP-160 insulator string. High Voltage Technology, 40(7), 1970–1976. DOI 10.13336/j.1003-6520.hve.2014.07.007. [Google Scholar] [CrossRef]
7. Li, H., Liu, G., Li, L. (2011). Analysis of natural pollution components on insulator surface and its research prospect. Acta Electrical Engineering Sinica, 31(16), 128–137. DOI 10.13334/j.0258-8013.pcsee.2011.16.017. [Google Scholar] [CrossRef]
8. Wang, S. H., Liu, Y., Wu, Y. L., Fu, Y. L. (2020). Correction of flashover voltage of catenary insulators based on analysis of soluble salt compositions in saline-alkali region. IEEJ Transactions on Electrical and Electronic Engineering, 15(7), 1011–1019. DOI 10.1002/tee.23145. [Google Scholar] [CrossRef]
9. Mousalreza, F. P., Mohammad, M. (2015). Designation of an Indicator for flashover prediction of porcelain and glass insulators based on experimental tests. Journal of Operation and Automation in Power Engineering, 3(2), 147–157. [Google Scholar]
10. Nabila, D., Abderrahmane, B. (2015). Time–frequency analyses of leakage current waveforms of high voltage insulators in uniform and non-uniform polluted conditions. IET Science, Measurement & Technology, 9(8), 945–954. DOI 10.1049/iet-smt.2015.0116. [Google Scholar] [CrossRef]
11. Mousalreza, F. P., Mohammad, M. (2016). Mathematical modeling of critical parameters on the polluted ceramic insulators under AC voltage: Based on experimental tests. Arabian Journal for Science and Engineering, 41(9), 3501–3510. DOI 10.1007/s13369-016-2098-2. [Google Scholar] [CrossRef]
12. Mousalreza, F. P., Mohammad, M. (2016). Detection of critical conditions in ceramic insulators based on harmonic analysis of leakage current. Electric Power Components and Systems, 44(16), 1854–1864. DOI 10.1080/15325008.2016.1183723. [Google Scholar] [CrossRef]
13. Mousalreza, F. P., Mohammad, M. (2020). Improved flashover mathematical model of polluted insulators: A dynamic analysis of the electric arc parameters. Electric Power Systems Research, 179, 106083–106083. DOI 10.1016/j.epsr.2019.106083. [Google Scholar] [CrossRef]
14. Faramarzipalangar, M., Mohseni, S., Mirzaie, M., Mahmoudi, A. (2021). Designing an automatic detector device to diagnose insulator state on overhead distribution lines. IEEE Transactions on Industrial Informatics, 99, 1–1. DOI 10.1109/TII.2021.3073685. [Google Scholar] [CrossRef]
15. Ding, L., Hao, H., Lv, Y., Wang, Q., Zhao, R. (2014). Prediction of insulators flashover voltage based on support vector machine regression. Electric Porcelain Arrester, 1, 23–25. DOI 10.16188/j.isa.1003-8337.2014.01.010. [Google Scholar] [CrossRef]
16. Wang, S., Ye, Z., Chen, J., Mei, B., Luo, S. (2010). Prediction method of insulators pollution flashover voltage using robust regression algorithm. Grid Technology, 34(12), 131–135. DOI 10.13335/j.1000-3673.pst.2010.12.020. [Google Scholar] [CrossRef]
17. Li, W., Zhang, D. C. H., Zhou, L., Zhu, Z. (2020). Prediction and analysis of critical flashover voltage of silicone rubber composite insulators based on BP neural network. Automation Technology and Application, 39(2), 90–93. DOI CNKI:SUN:ZDHJ.0.2020-02-023. [Google Scholar]
18. Bureau of International Electrotechnical Commission Standards (2013). Artificial pollution tests on high voltage insulators to be used on AC systems. IS 60507. [Google Scholar]
19. Zhang, C., Zhang, F., Li, R., Ma, Y., Wang, L. et al. (2013). Comparison of pressurization methods for artificial pollution test of insulators. High Voltage Technology, 39(1), 44–53. DOI 10.3969/j.issn.1003-6520.2013.01.007. [Google Scholar] [CrossRef]
20. Bureau of International Electrotechnical Commission Standards (2010). High voltage test technique part1, General definitions and test requirements. IS 60060 (Part 1). [Google Scholar]
21. Jiang, X., Chen, A., Zhang, Z., Hu, J., Sun, C. (2006). Effect of salt density and ash density on flashover voltage of 110 kV composite insulator. Chinese Journal of Electrical Engineering, 9, 150–154. DOI journal articles/5ae405eec095d718f84168bb. [Google Scholar]
22. Guan, Z., Li, J., Zhou, J., Wang, L. (2012). Influence of high altitude on insulator pollution flashover characteristics. High Voltage Technology, 38(10), 2481–2491. DOI CNKI:SUN:GDYJ.0.2012-10-002. [Google Scholar]
23. Yuan, J. (2008). Study on AC pollution flashover characteristics and discharge process of transmission line insulators (Ph.D. Thesis). Chongqing University, Chongqing. [Google Scholar]
24. Mizuno, Y., Kusada, H., Naito, K. (1997). Effect of climatic conditions on contamination flashover voltage of insulators. IEEE Transactions on Dielectrics and Electrical Insulation, 4(3), 286–289. DOI 10.1109/94.598284. [Google Scholar] [CrossRef]
25. Yan, Y., Zhang, X. (2014). Experimental study on solubility and solubility product of calcium sulfate in brine. Salt and Chemical Engineering, 43(11), 27–30. DOI 10.3969/j.issn.1006-8945.2014.10.003. [Google Scholar] [CrossRef]
26. Wang, S., Cao, L., Jing, H. (2018). Study on prediction method of pollution flashover voltage of catenary composite insulator. Journal of Railway Science and Engineering, 15(8), 2083–2091. DOI 10.19713/j.cnki.43-1423 /u.2018.08.023. [Google Scholar] [CrossRef]
27. Zhang, Y., Wu, Y., Dong, H. (2015). Estimation of insulators leakage current based on genetic algorithm. High Voltage Technology, 41(8), 2757–2763. DOI 10.13336/j.1003-6520.hve.2015.08.029. [Google Scholar] [CrossRef]
 | This work is licensed under a Creative Commons Attribution 4.0 International License, which permits unrestricted use, distribution, and reproduction in any medium, provided the original work is properly cited. |