| Energy Engineering |
DOI: 10.32604/EE.2022.017363
ARTICLE
Evaluation of Energy Efficiency Performance of Heated Windows
1Energy and Mineral Engineering, Pennsylvania State University, State College, PA 16801, USA
2Industrial and Management Systems Engineering, West Virginia University, Morgantown, WV 26505, USA
3Oak Ridge National Laboratory, Oak Ridge, TN 37831, USA
*Corresponding Author: Bhaskaran Gopalakrishnan. Email: Bhaskaran.Gopalakrishnan@mail.wvu.edu
Received: 31 May 2021; Accepted: 18 September 2021
Abstract: Fenestration systems are widely used across the world. There is expansive research on window configurations, frames, and glazing technology, but not enough research has been published on reducing window heat loss through heat application to a pane. The presented study attempted to evaluate the performance of heated windows by developing an experimental setup to test a window at various temperatures by varying the power input to the window. Heated double pane window was installed in an insulated box. A temperature gradient was developed across the window by cooling one side of the window using gel-based ice packs. The other face of the window was heated by enabling power at different wattages through the window. The temperature of the inside and outside panes, current and voltage input, and temperature of the room and box were recorded. The data was used to calculate the apparent effective resistance of the window when not being heated vs. when being heated. The study concluded that, when window temperature was maintained close to the room temperature, the heated double pane window is effective in reducing heat loss by as much as 50% as compared to a non-heated double pane window. When temperature of the window was much higher than the room temperature, the heat loss through the window increased beyond that of a non-heated window. The issues encountered during the current stages of experiments are noted, and recommendations are provided for future studies.
Keywords: Heated windows; perimeter heating; window efficiency; building energy models; floor heating
The total annual energy consumption in the United States of America (USA) has remained more or less constant at around 100 quadrillion BTUs (29.3 Trillion kWh) since the year 2000, varying between 94 quadrillion Btu (27.5 Trillion kWh) to 101 quadrillion Btu (29.6 Trillion kWh) [1]. Out of the total energy consumption, 37% of the energy is consumed by residential and the commercial buildings [2]. Of this, 42% of the energy is utilized for space heating [3]. The United States Department of Energy (DOE) estimates that the windows can account for 10–25 percent of the energy losses through homes [4], which equates to an annual loss of $35 Billion every year [5].
The primary reason for the high degree of heat loss/gain through windows is due to their high thermal conductivity in comparison to the walls. Infiltration through the gaps within the windows is also a significant contributor to heat loss/gain through windows. Windows which are constructed out of metals such as aluminum, can also lose or gain heat unless the metal surfaces are insulated.
At present, half of all the energy used for space heating in the US residential sector comes from Natural Gas. The usage patterns vary vastly based on the region in the US. Electricity, however, dominates in the south of the US. The efficiencies and the CO2 emissions vary based on the type of system used. The average CO2 emissions by US has been over 5.33 million Kilo-Tons in 2014. Concerns over global climate change due to greenhouse gas emissions, especially CO2, have led to stringent emission norms nationwide. As a result of the Clean Power Act, the utility prices have risen due to the need to upgrade the electric power utilities, rising from 10.40 cents per kWh in 2006 to 12.67 cents per kWh in 2015 for the residential sector [6]. This has necessitated the need to explore various measures by building owners to reduce their utility costs, while investing in upgrades that have a reasonably short payback.
Residential and commercial heating fuel prices have vastly varied over the past 15 years. While natural gas prices have shown a downward trend since the inception of horizontal drilling and fracking in the Marcellus and Utica Shale [7], electricity prices have gone up steadily. This is primarily due to the increased investment in the transmission and distribution infrastructure [8]. Increased electricity prices and varying natural gas prices make a strong case for further study into reducing the building energy consumption, especially space heating which accounts for almost 40% of the total energy consumption by the residential sector.
Fenestration systems are commonly used, worldwide. These systems are a “weak” link in terms of building energy consumption during the various seasons during the year. During the winter seasons in the various regions of the world, the windows in the building are a significant source of heat loss as their insulation potential due to glass and metal construction is low. Although energy modeling simulation efforts in buildings address this aspect in terms of determination of energy losses through the building envelope, there is indeed a research gap that focuses on incorporating better designs to the windows such that their insulation potential can be increased, hence reducing the heat losses during winter. Low emissivity coatings on the window glass, double pane design trapping air as an insulating material, and completely sealing the edges to prevent any air infiltration have been developed; however, the heated window design is a novel and innovative concept that leads to the reduction in window-based heat losses and addresses the inherent research gap in this context. The results from the research discussed in this paper are bound to advance the energy efficiency of building systems and reduce the overall carbon footprint on a global scale.
While there is expansive research on various aspects of fenestration, window configurations based on region [9–13]; window frames [14]; or improved glazing technologies [15,16], not much has been done to address the fundamental issue of heat loss through convection from a window. While Aerogel technology may vastly help in this respect, it is far too expensive for commercial application. The general approach of the industry and the academicians towards the idea of heated windows has not been very positive, from an energy efficiency perspective. It is generally believed that the heated windows are simply displacing the heat that would otherwise be provided by the central heating system. Another belief is that a heated window, because of the vicinity of the heating system to the cold ambient conditions, can lead to a greater heat loss. However, there are a limited number of studies performed on heated window technology from an energy efficiency standpoint [17,18], that show promise in the technology, contradicting popular beliefs. Energy savings may be possible by utilizing low temperature heating surfaces since they allow higher amount of heat to be radiated in the zone occupied by people, allowing the user to lower air temperature by up to 1.5°C (2.7°F) highlighting an added advantage to heated windows [19]. Both [19,20] suggested energy savings based on the position of heating source along the perimeter of the room. The idea of perimeter heating is popular in Europe, with some houses having all the walls heated. It is believed that this approach would improve the energy efficiency of the building envelope.
The objectives of this research are as follows:
• Develop an experimental model to test the effectiveness of a heated window in reducing heat loss over a standard double-pane window.
• Determine whether heated double-pane windows are more energy-efficient than standard double pane windows.
• Determine the conditions under which the heated double-pane windows would be more energy-efficient than a standard double pane window.
• Perform tests on a building that has heated windows and compare results with that of the test set up to verify the results.
Building energy modelling (BEM) is a powerful tool that has been used for the past few decades in deciding the effectiveness of a building energy design for saving energy. BEM complexity has increased over the years to model complex building behavior. There is a difference between what the models predict and how the system/design functions in actuality [21–23]. One of the major factors that affect the energy use is the high variation in the energy use assumed for a user, vs. actual behavior [24–26]. Therefore, to get a better understanding of how a system functions in realistic conditions, an experimental setup is essential. The current study takes a “Grey Box” approach towards identifying the energy efficiency performance of heated windows.
2.2 Fenestration and Energy Efficient Window Technologies
Heating, Ventilation, and Air-Conditioning (HVAC) systems can consume as high as 50% of the total energy in a building, depending on the end use. Windows can account for as high as 20% of the HVAC energy, which can increase, depending on the area covered by them on the building façade. Various studies have been performed on the effectiveness of different types of windows, their orientation, size, as well as the inclusion of shading, which could influence the energy efficiency performance. Studies have also been performed about the effect of manual control on windows, which can also affect the building efficiency.
Double pane windows with low emissivity coating and clear glass gave the best energy savings over the whole year, and the best performance during winters [27,28]. On the other hand, smart glazing units with absorptive, reflective, and low emissivity coating performed best in the hotter climate. Ulavi et al. presented a unique concept for a hybrid solar window that uses a wavelength selective film to split the incident radiation into spectral bands for daylighting and heating. A Monte Carlo ray tracing model was used to analyze the annual thermal and daylighting performance of the hybrid window [29]. Tints and reflective coatings were found to be preferable for warmer climates where the solar heat gain was high, while clear coatings were preferable in cooler climates, where the solar heat gain is low.
2.3 Floor and Perimeter Heating
Floor heating, a system that uses embedded pipes in the floor to heat a building, has been used for a long period of time. However, with the advent of panel units in the last century, they were not adopted as much. Lately, however, it is again being implemented. According to [30], floor heating increases thermal comfort. Alternatively, Ren et al. [31,32] have said that the energy efficiency for heating also increases due to the utilization of a low-temperature heating medium (water). Lower water temperature means increase in efficiency of the boiler, thus resulting in proportional energy savings.
Most of the studies focused on using purely numerical methods in controlled conditions. Studies focused on heated windows have not considered a real-world scenario to observe window behavior. Also, energy modeling software were not utilized to study the behavior of heated windows. The effect of perimeter heating to improve the thermal comfort in the room has been discussed in [19]. The research described in this paper is reported in [33].
The main objective of this research is to evaluate the performance of the heated windows by developing an experimental setup to test the window at various temperatures by varying the power input to the window. The flow diagram shown in Fig. 1 explains how the experiment was conducted.
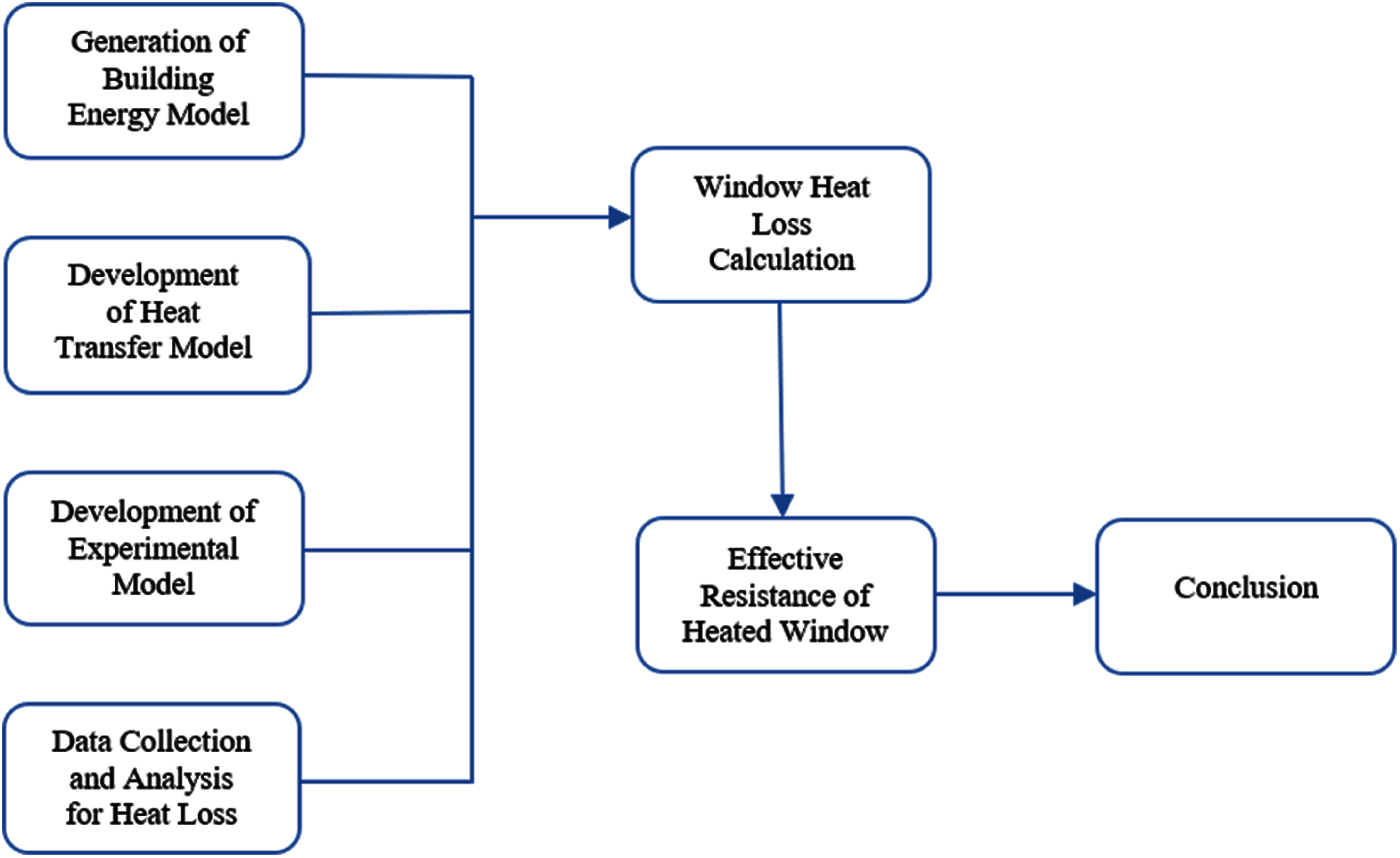
Figure 1: Flow diagram
3.1.1 Phase 1: Generation of Building Energy Model
Previous research and development done with respect to heated glass windows were analyzed, and the Department of Energy’s Quick Energy Simulation Tool (eQUEST®) was studied and utilized. eQUEST® is a useful tool in obtaining the overall performance parameters of a building, but not suitable for considering the performance of specific elements of the building under different conditions, such as windows, doors, or the walls.
3.1.2 Phase 2: Development of Heat Transfer Model for Testing the Heated Window Characteristics
A heat transfer model which could simulate the characteristics of the window was developed. The model considered inputs such as the temperature of the window panes on the exposed sides, power input to the window, conduction and convective heat transfer coefficients, room and ambient (outside) temperature, glass thickness, and area of the glass. The heat flow through the window was projected using equations for conduction and convection. The results were considered acceptable if the total heat output from both sides of the window based on the calculated temperatures were equivalent. Since the heat transfer model would not affect the outcome of this study, it was decided not to pursue it further, due to the time constraint it posed. A screenshot of the heat transfer model can be seen in Fig. 2.
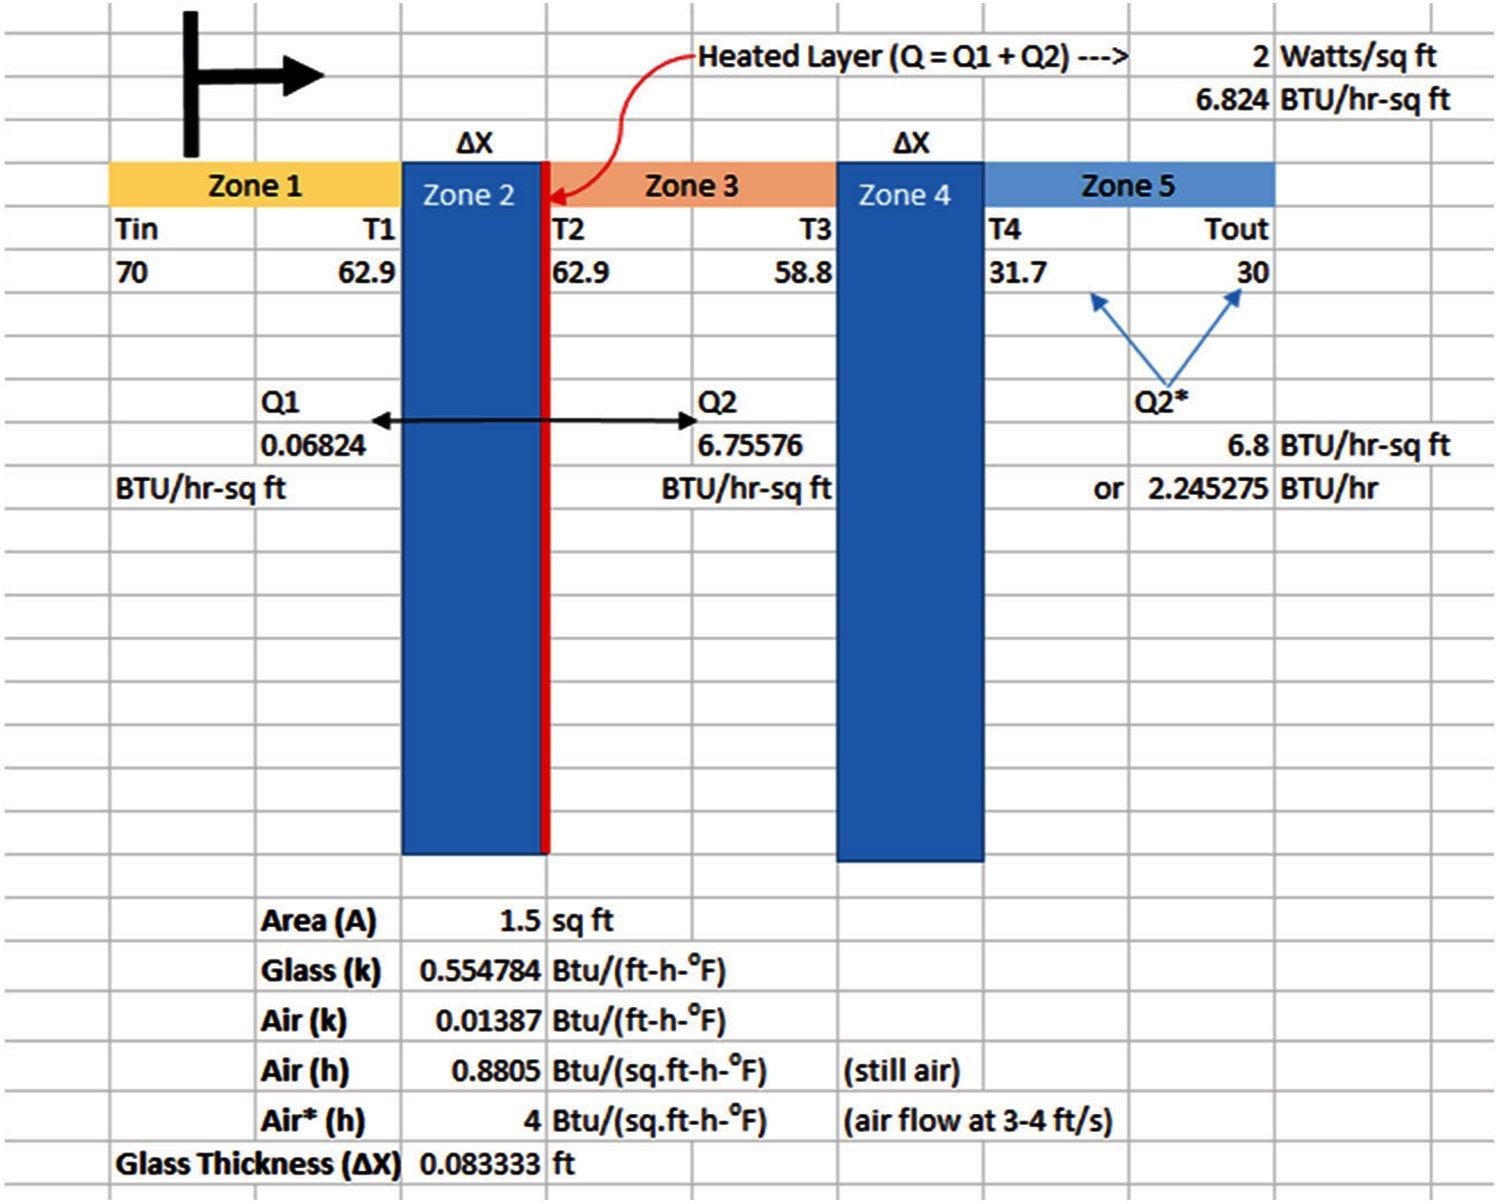
Figure 2: Screenshot of heat transfer model
3.1.3 Phase 3: Development of Experimental Model and Testing of the Heated Window Characteristics
An enclosed space for isolated cooling was constructed, with a heated window installed on one of the walls. The model was tested under various conditions and it was determined where to install the thermocouple-based temperature sensors, to record the temperature changes in the window when it was heated and/or cooled. Appropriate cooling apparatus was determined and sized appropriately using iterative procedures.
3.1.4 Phase 4: Data Collection and Analysis for Heat Loss through the Experimental Setup, with, and without Heating the Glass Window
A testing methodology was devised, and appropriate temperature and power input data was collected, based on some preliminary experiments on the system. The windows were never heated more than 90°F (32°C or 305 K) since buildings are seldom heated to this level. This data was analyzed and processed to determine the performance characteristics of the heated window.
3.1.5 Phase 5: Data Collection from a Building with Heated Glass Windows during Winter
The performance of a building with heated windows was attempted to be determined by installing temperature and current data loggers at a small manufacturing facility with heated windows, over the winter season, over a period of two and a half months, with the windows turned on, and turned off. However, due to lack of current/temperature controls on the windows, and the highly drafty nature of the building due to its age, the data was found to be inconclusive, and the endeavor had to be abandoned. Fig. 3 shows a schematic of the building where the temperature data was collected.
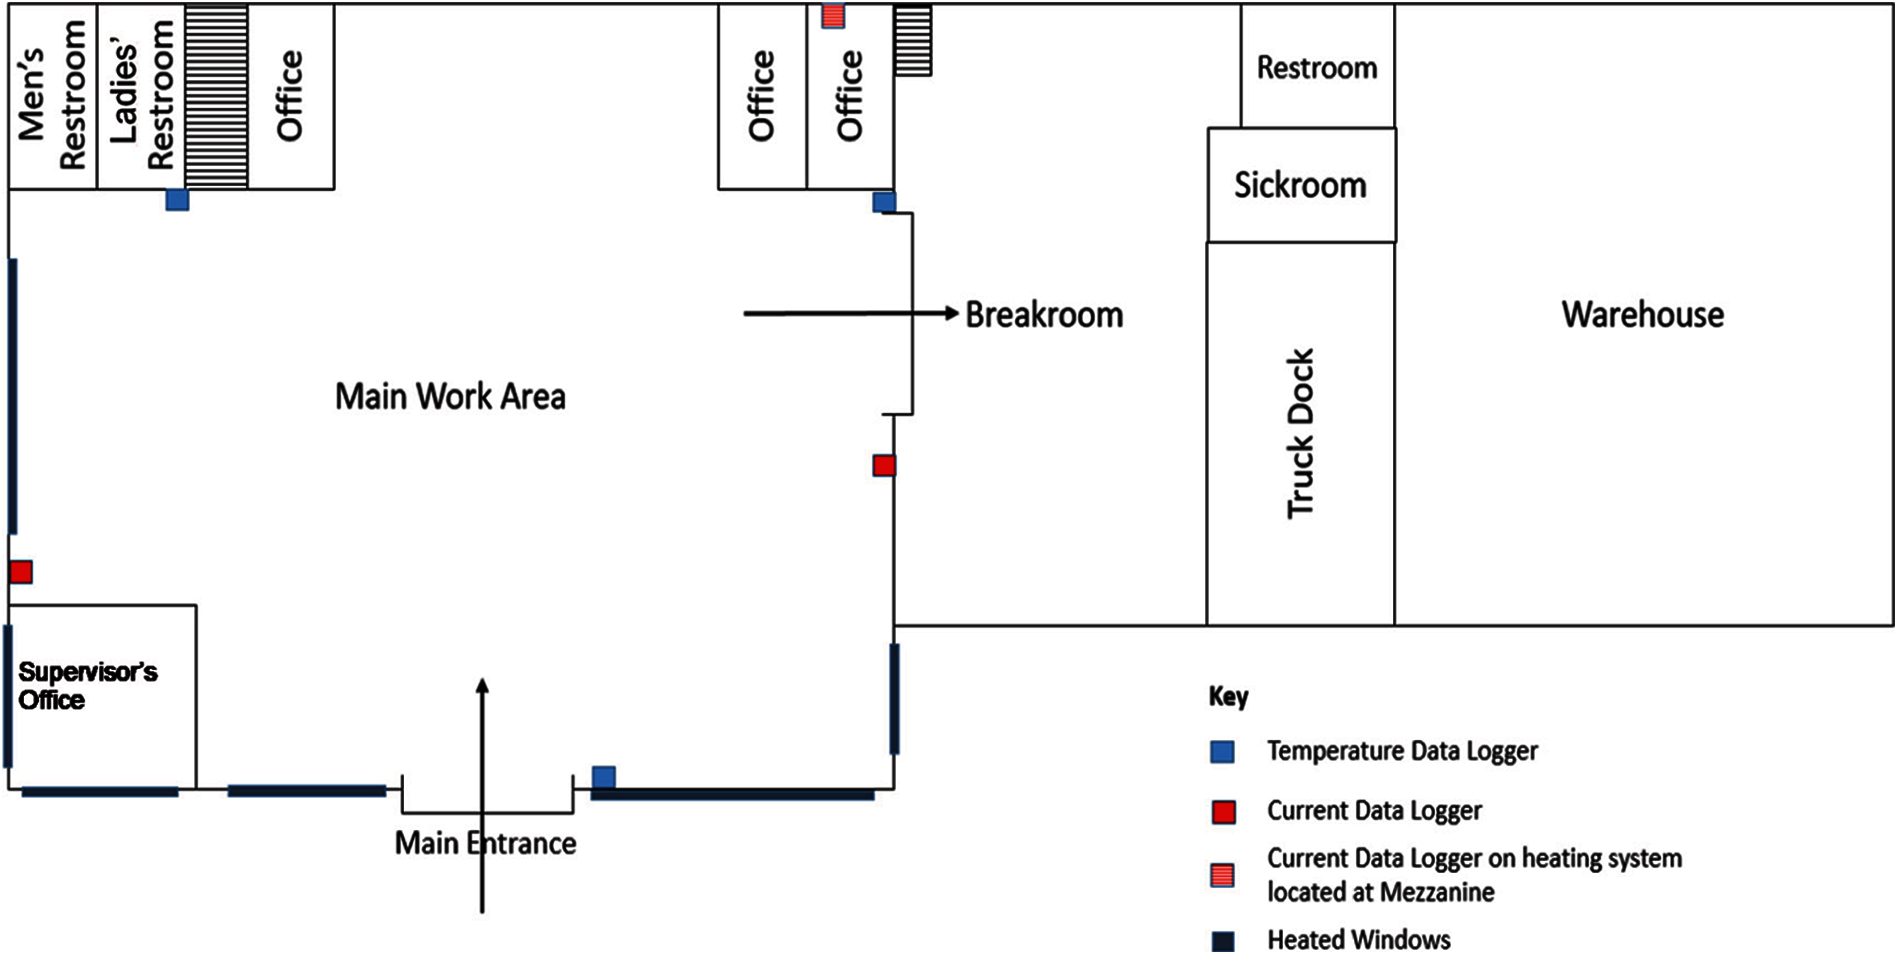
Figure 3: Building schematic where temperature data was collected
3.2 Description of Experimental Setup
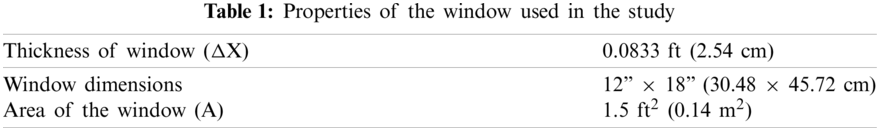
The experimental setup is shown in Fig. 4. A cubic box of 8 ft3 (0.23 m3) was constructed using R-5 insulation foam boards. A standard double pane window with the heated side facing outwards was installed on one of the sides of the box. The window has dimensions 12” × 18” (30.48 × 45.72 cm) and was 1 inch (2.54 cm) thick. Other window properties are detailed in Table 1. The box also has a resealable opening on the top for access to the inside of the box. This access was used to place gel-based icepacks for cooling the box, apart from installing a small fan inside the box to facilitate cooling of the face of the window inside the box. The gel-based ice packs were preferred due to their ease of use compared to ice, which may leak once melted. Also, the ice packs lasted through the length of the experiment and were easier to transfer. The inside of the box represents the ambient weather condition during the wintertime while the outside of the box, placed within a conditioned room, represents the inside of the room. Therefore, the heated side of the window is facing outside (towards the room), rather than inside (towards the ice packs). A fan, running at a constant speed was placed inside the box to blow over the ice packs, towards the window, to accelerate the process of cooling the box, and create forced convection within the box, mimicking the conditions outside during winter. To measure the temperature of the air within the box as well as the velocity profile across the window, an ALNOR® Model 8585 anemometer was used.
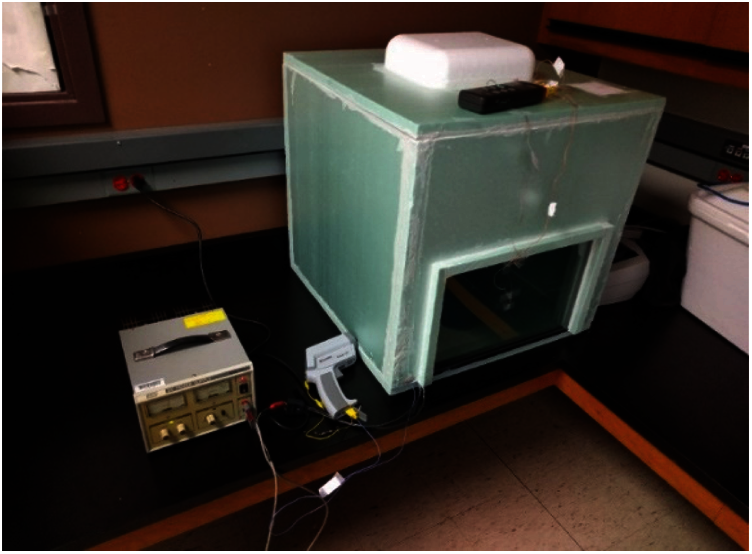
Figure 4: Experimental setup
To measure the temperature of the window panes, as well as the temperature inside the box, K-type thermocouples were installed. One thermocouple was installed on the outside face of the window, and two on the inside. A thermocouple was installed on the face of the inside of the box, to provide the temperature of the box. The temperature of the thermocouples attached on the windowpanes is detected using the Omega® Datalogger Thermometer, while the temperature of the box is detected with the Raytek® Rangefinder MX2 thermal gun.
Power input to the window is provided using EMCO® DC power supply with output current and voltage controls. Either the current, or the voltage from the DC power supply can be controlled at a time; however, both cannot be controlled simultaneously at the same time. So, only current was controlled for the experiment, in steps of 0.1 A.
3.3 Data Collection Methodology
Window performance data was collected with the window heated, and gel-based ice packs that were frozen overnight, placed inside the box. Data was also collected when the window was not heated, and the frozen gel packs were placed inside the box for comparing the results of the heated window vs. a non-heated window. A current of 0.1 to 0.8 A was applied as an input. The voltage could not be simultaneously controlled using the available equipment, so that it could vary with the current input. It was found during initial testing that the window temperature was around 90°F (32°C or 305 K) when a current of 0.8 A (at 10 V) was applied.
Frozen ice packs were placed inside the box and the circulation fan was turned on. The window was initially heated for 20 min, to ensure that the temperature of the window and the box reached a steady-state condition. Thereafter, the window was heated for eight minutes every time the power input was increased. The icepacks in conjunction with the fan provided a sufficient temperature gradient across the window. The velocity of air was measured and noted at nine locations at two inches away from the window using the anemometer by inserting the probe through one of the three holes and extending across the face of the window. Temperature of the windows as well as the inside surface of the box was recorded at intervals of eight minutes, before raising the window temperature.
4 Results, Discussion, Conclusion, and Future Work
For the experimental setup, as shown in Fig. 5, the temperature of the window in Zone 5, which represents the inside of the box and is cooled to low temperatures using frozen gel-based ice packs, and a circulation fan, was collected at two points, at the center of the window and two inches from it. Temperature of the side of the window facing Zone 1 was measured at only one location, at the center of the window. Zone 1 represents the room and is maintained by the West Virginia University’s central air conditioning system between 70°F (21°C or 294 K) and 80°F (27°C or 300 K). Zone 3 is the airgap between the window panes. Zones 2 and 4 are window panes. During the experiment, the temperature of the heated layer, T2, and the inside face of the non-heated pane, T3, could not be measured since they were sealed off. Only the temperatures of the room, Troom; face of glass facing room T1, the face of glass facing the box T4 and temperature inside the box Tbox could be measured. Q1 represents the heat flowing from heated pane towards the room and Q2 represents the heat flowing outwards. Q2* is the eventual heat loss to the atmosphere. The total amount of energy supplied to heat the window, Q, equals Q1 + Q2. In a double-pane window, Zones 1, 3, and 5, have convectional heat transfer as the dominant mode of heat transfer with negligible heat transfer through conduction. Zones 1 and 2 have conduction as the dominant mode of heat transfer. Radiation is insignificant due to the low temperatures and therefore ignored.
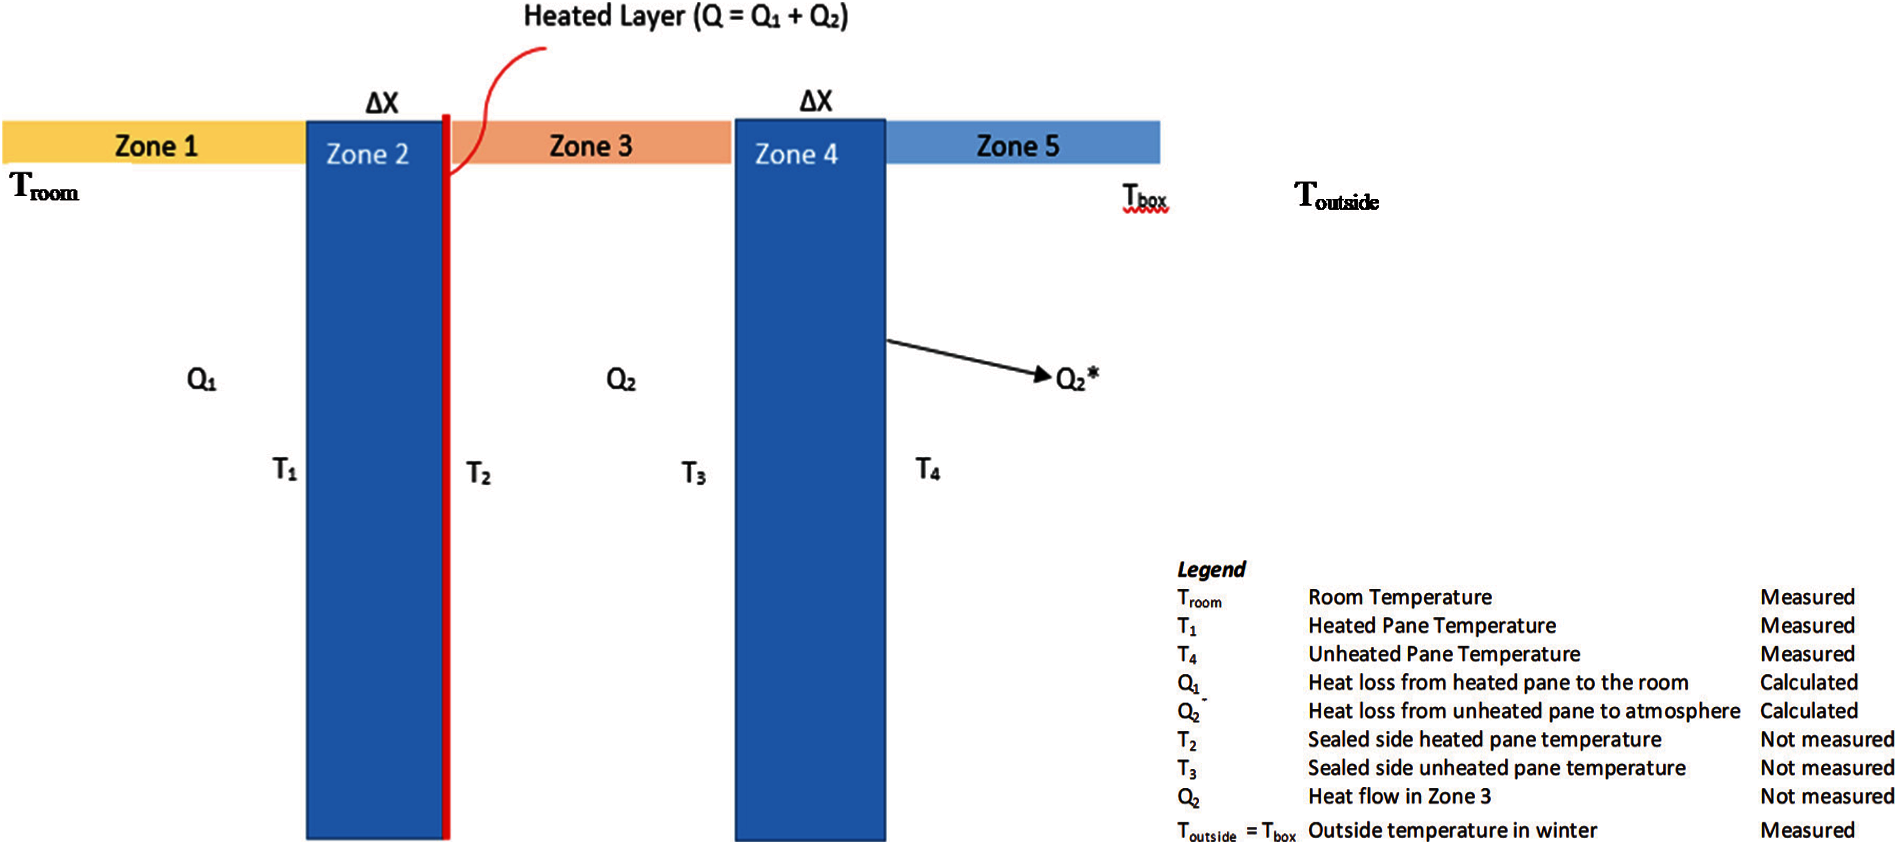
Figure 5: Schematic diagram of the experimental setup
4.1 Window Heat Loss Calculation
The convective heat loss from the window may be calculated using the following equation:
or,
In the formula above, the heat transfer coefficient is dependent upon the velocity of the air around the window. Higher the velocity, higher the heat transfer coefficient. The temperature of the heated window is not raised above 90°F (32°C or 305 K), to keep it in line with the temperatures at which rooms are typically maintained. However, for a few tests, the window temperature was taken close to 115°F (46°C or 319 K) to explore the effects of window temperature on heat loss. It was assumed that all the power input to the window was converted into heat with no losses. Basic dimensions and window properties were known and discussed above in experimental setup section. The velocities measured at nine locations across the window is shown in Table 2. The average of these velocities was used throughout the study. Properties of air used for the calculation of heat loss through the window are shown in Table 3. The heat loss through the unheated double pane window, is shown in Table 4. The heat loss through the window when it is heated, is shown in Table 5.
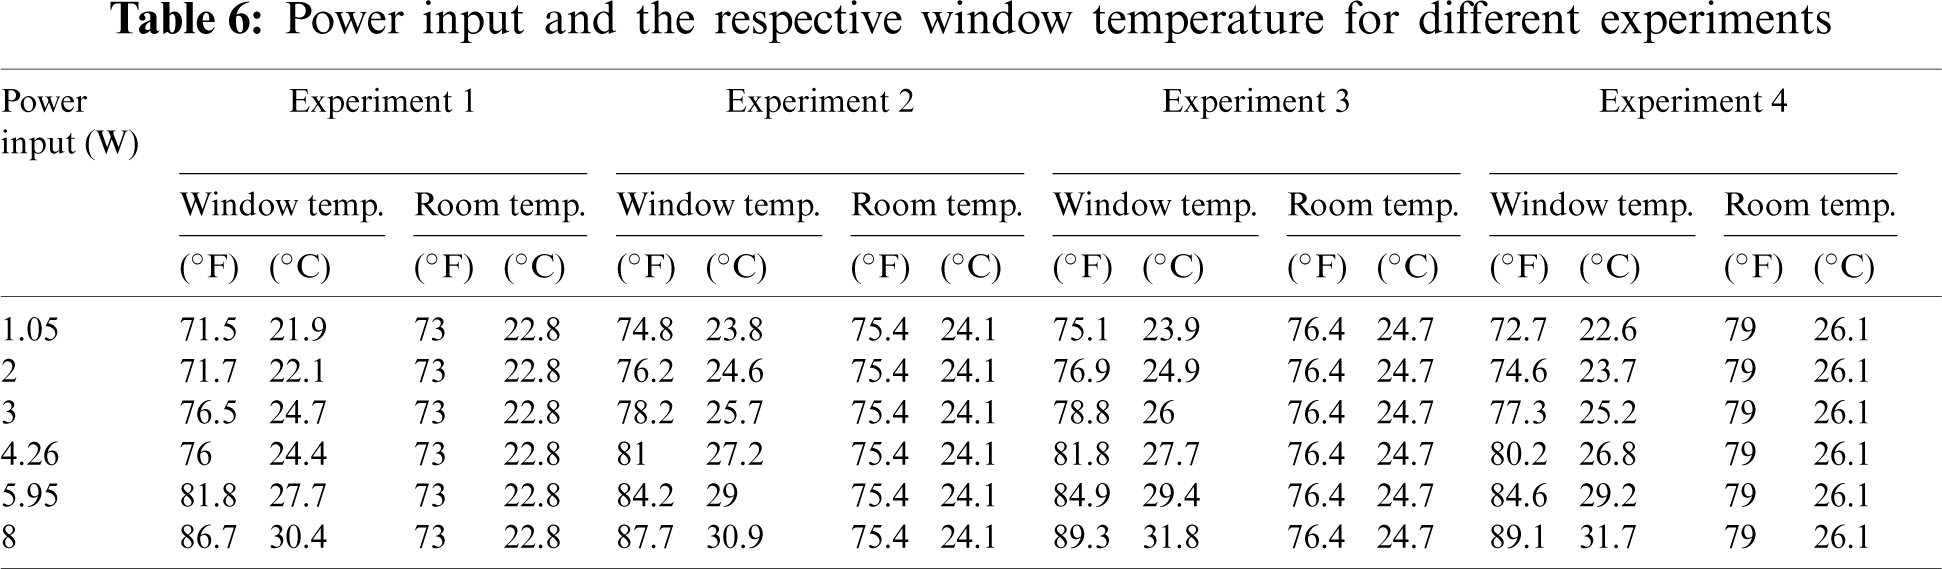
Given the high variability in the data across various tests, over a range of temperatures, the percentage error in the outputs was plotted against the power input. This is shown in Fig. 6. The error was the lowest, whenever the heated side was at about the room temperature. Based on this observation, it is safe to say that the maintaining the heated windowpane facing the room, close to room temperature will minimize the error in the data, and the heat output to the cold box at this temperature is reliable. The heated pane temperature, as well as the room temperature for each of the cases is shown in Table 6. In Table 6, the window temperatures closest to the room temperature have been highlighted. The variation of the data increases as we move away from a window temperature close to the room temperature, except in the case of Experiment 4. The higher error in Experiment 4 may be due to mistakes brought about by increasing room temperature. With better equipment to measure the temperature at multiple points across the face of the window, as well as a better measure of the overall velocity across the window, these errors may be reduced.
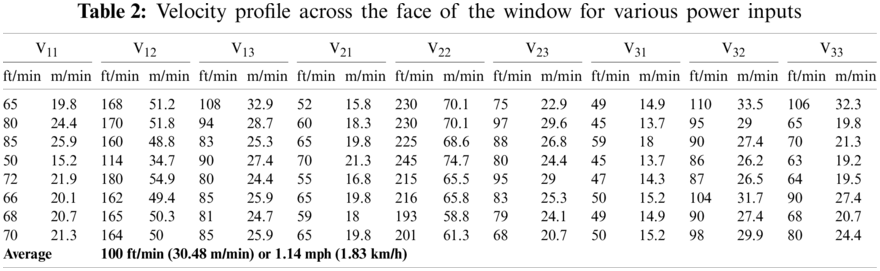
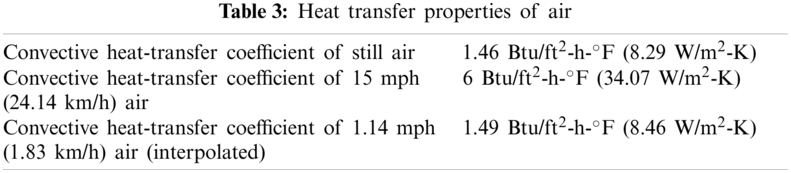
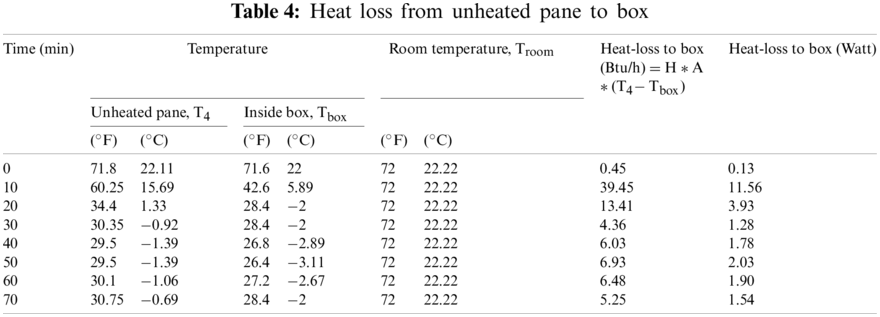
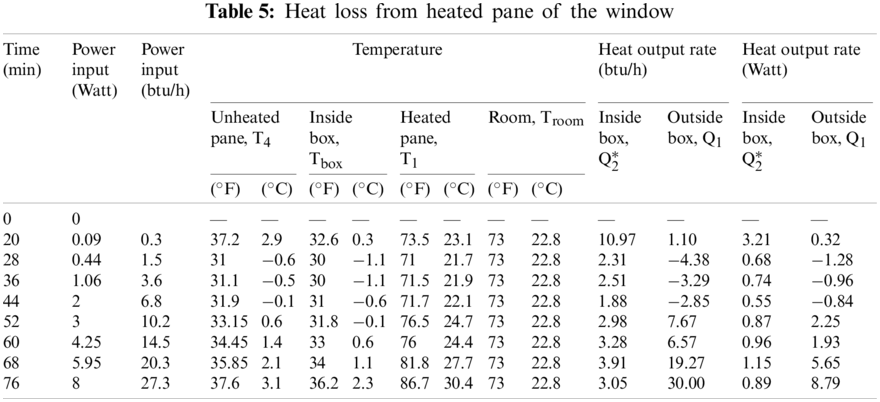
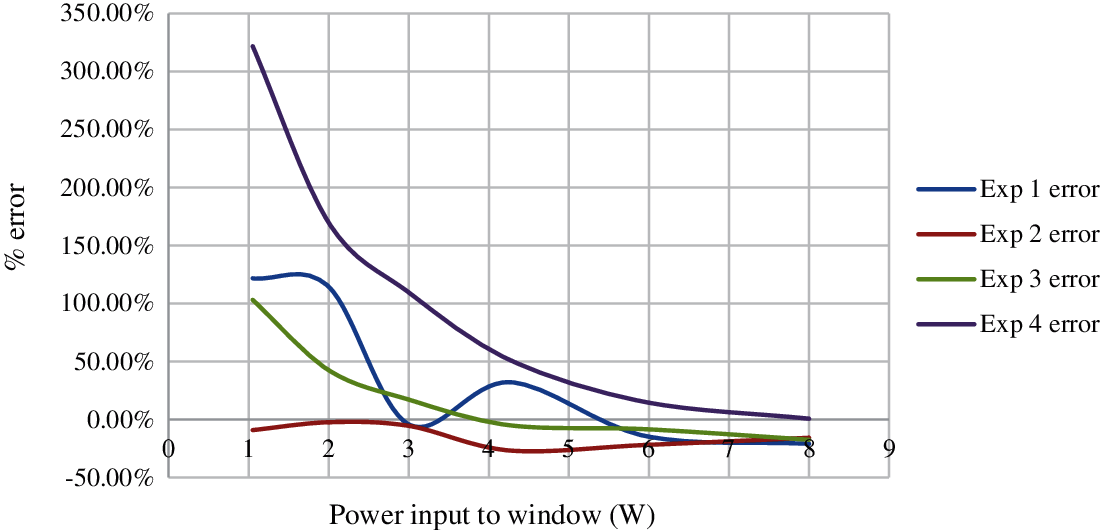
Figure 6: Error in heat output calculated vs. power input
The heat loss to the box when the window is un-heated and heated for Experiment 1, is plotted vs. time and shown in Fig. 7. The heat loss from the heated window to the cold outside, represented by the inside of the box, is about half of what it is for a non-heated window. It must be noted that only one case is considered here since the room temperature for both the heated, and the unheated windows were close to each other, around 73°F (23°C or 296 K). In all other cases, the temperature difference was more than 1°F (0.56°C). An interesting thing to note here is that the heat loss through the window is at its lowest between 40 to 50 min. This is the same time range when the face of the window facing the warm room is hot enough to match the room temperature. As the temperature of the window is raised beyond the room temperature, the heat loss through the window starts increasing again. This indicates that the heated window may be effective when used within a specific temperature range, which coordinates closely with the room temperature. In general, the heat loss through the heated window, vs. a non-heated window, is reduced by as much as 50% per unit window area. The total heat loss reduction from the heating system, however, might be a small fraction of the full heat put out by the furnace.
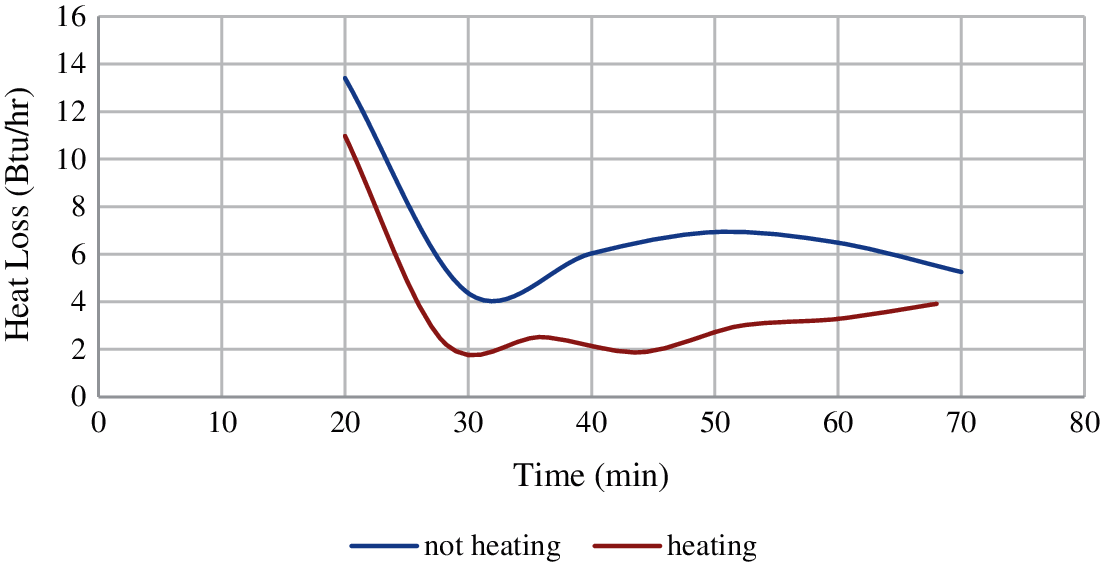
Figure 7: Comparison of heat loss (Q2∗) for heated vs. unheated window
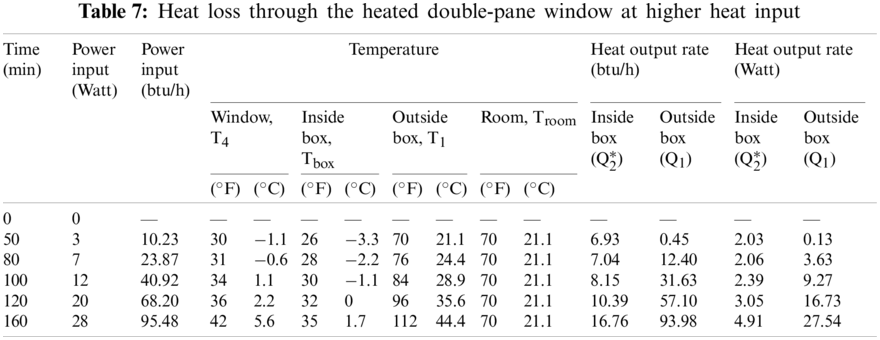
It must be noted that in Table 7, the box temperature is increasing with increasing heat input or increasing window temperature. This illustrates a significant drawback of the current setup. Given the limited amount of ice packs added to the box, the box is not able to sustain a constant temperature with increasing window temperature. This can create anomalies in the data, like underestimating the actual heat loss through the window. Fig. 8 shows the relationship between heat loss through the window to outside, vs. the heated window temperature.
4.2 Effective Resistance of the Heated Window
The effective resistance is a measure of thermal resistance, or ability of heat to transfer from hot to cold, through materials or assemblies of materials. The effective resistance of the heated window may be estimated for the cases when the heated window temperature is close to room temperature. Effective resistance may be defined as follows:
where,
R = effective resistance of the window, °F-ft2-hr/Btu (°K-m2/W)
k = thermal conductivity, Btu/hr-ft-°F (W/m°K)
U = thermal transmittance, Btu/hr-ft2-°F (W/m2-°K)
Q = Heat loss through the window, Btu/hr (W)
ΔX = Thickness of the window, 1/12 ft (2.54 cm)
A = Area of the window face, 1.5 ft2 (0.14 m2)
ΔT = Temperature difference across the two faces of the window.
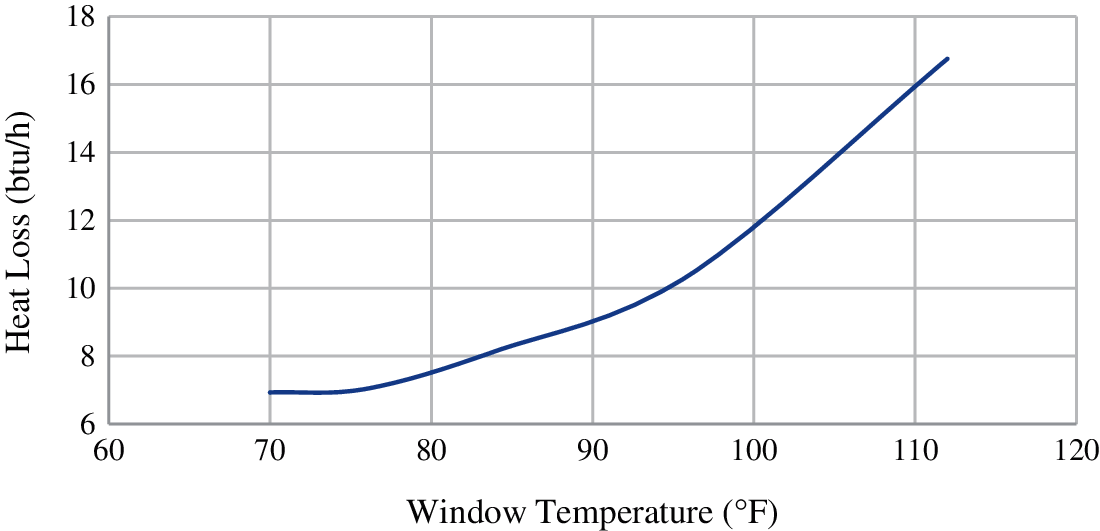
Figure 8: Relationship between window temperature and heat loss
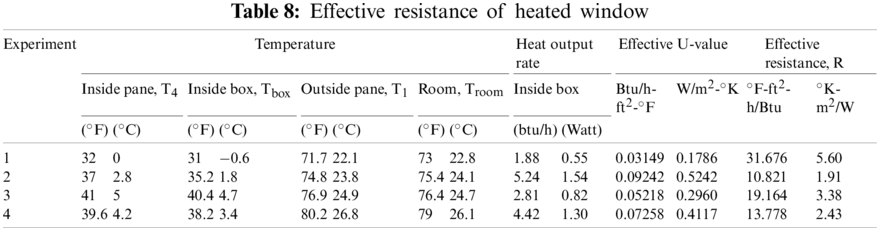
Table 8 shows the various parameters in four different experiments, when the window was heated close to the room temperature, while the box was being cooled. For these cases, the heat loss through the window was found to be minimum. The equivalent effective resistances for each of the cases is also noted.
The effectiveness of a heated double-pane window vs. a standard double-pane window, was tested. A temperature gradient was developed across the window by installing it on an insulated box and placing ice packs inside the box. The temperature of the room, box, and inside and outside panes of the window were recorded. The following conclusions were drawn:
1. The heated double pane window appears to show benefits over an un-heated counterpart provided that the windowpane, facing the room, is maintained close to the room temperature.
2. Conduction is the dominant mode of heat propagation. This ensures that most the heat from the heated window goes into the room.
3. The heat loss through a heated window when compared to an unheated window appears to reduce by as much as 50% when the window is heated to the temperature of the room.
Acknowledgement: This research work acknowledges the association with the TransTech Conference held annually by the National Research Center for Coal and Energy at West Virginia University.
Funding Statement: This research work was funded in part by the Industrial Assessment Center Project, supported by grants from the US Department of Energy and by the West Virginia Development Office.
Conflicts of Interest: The authors declare that they have no conflicts of interest to report regarding the present study.
1. Department of Energy (2015). US energy consumption by sector, Table 2.1. https://www.eia.gov/energyexplained/us-energy-facts. [Google Scholar]
2. Department of Energy (2015). US energy consumption by sector, Table 2.1. https://www.eia.gov/energyexplained/us-energy-facts. [Google Scholar]
3. Department of Energy (2011). Buildings energy data book, Chapter 1. https://ieer.org/resource/energy-issues/2011-buildings-energy-data-book. [Google Scholar]
4. Department of Energy, Energy efficient window attachments. https://www.energy.gov/sites/prod/files/2013/11/f5/energy_savings_from_windows_attachments.pdf. [Google Scholar]
5. NFRC (2012). Benefits of improving windows. https://nfrccommunity.org/blogpost/925129/181481/High-Performance-Windows-Deliver-Invisible-Benefits. [Google Scholar]
6. U.S. Energy Information Administration, Average retail price of electricity. https://www.eia.gov/electricity/state. [Google Scholar]
7. US-Department of Labor and Statistics (2013). The effects of shale gas production on natural gas prices. https://www.bls.gov/opub/btn/volume-2/the-effects-of-shale-gas-production-on-natural-gas-prices.htm. [Google Scholar]
8. Hodge, T. (2015). Growth in residential electricity prices highest in 6 years, but expected to slow in 2015. Washington D.C., United States: US Energy Information Administration. [Google Scholar]
9. Bastien, D., Athienitis, A. K. (2015). Methodology for selecting fenestration systems in heating dominated climates. Applied Energy, 154(9), 1004–1019. DOI 10.1016/j.apenergy.2015.05.083. [Google Scholar] [CrossRef]
10. Apte, J. S., Arasteh, D. K. (2006). Window-related energy consumption in the us residential and commercial building stock. Lawrence Berkeley National Laboratory Report, LBNL-60146. [Google Scholar]
11. Özkan, D. B., Onan, C. (2011). Optimization of insulation thickness for different glazing areas in buildings for various climatic regions in Turkey. Applied Energy, 88(4), 1331–1342. DOI 10.1016/j.apenergy.2010.10.025. [Google Scholar] [CrossRef]
12. Manz, H., Menti, U. P. (2012). Energy performance of glazings in European climates. Renewable Energy, 37(1), 226–232. DOI 10.1016/j.renene.2011.06.016. [Google Scholar] [CrossRef]
13. Lam, T. C., Ge, H., Fazio, P. (2015). Impact of curtain wall configurations on building energy performance in the perimeter zone for a cold climate. Energy Procedia, 78, 352–357. DOI 10.1016/j.egypro.2015.11.665. [Google Scholar] [CrossRef]
14. Gustavsen, A., Grynning, S., Arasteh, D., Jelle, B. P., Goudey, H. (2011). Key elements of and material performance targets for highly insulating window frames. Energy and Buildings, 43(10), 2583–2594. DOI 10.1016/j.enbuild.2011.05.010. [Google Scholar] [CrossRef]
15. Arasteh, D., Selkowitz, S., Apte, J., LaFrance, J. (2006). Zero energy windows. Proceedings of the 2006 ACEEE Summer Study on Energy Efficiency in Buildings, pp. 1–14. Niagara, NY, USA. [Google Scholar]
16. Jelle, B. P., Hynd, A., Gustavsen, A., Arasteh, D., Goudey, H. et al. (2012). Fenestration of today and tomorrow: A state-of-the-art review and future research opportunities. Solar Energy Materials and Solar Cells, 96, 1–28. DOI 10.1016/j.solmat.2011.08.010. [Google Scholar] [CrossRef]
17. Kurnitski, J., Jokisalo, J., Palonen, J., Jokiranta, K., Seppänen, O. (2004). Efficiency of electrically heated windows. Energy and Buildings, 36(1), 1003–1010. DOI 10.1016/j.enbuild.2004.06.007. [Google Scholar] [CrossRef]
18. Moreau, A., Sc, M. A., Sansregret, S., Sc, E. M. A., Fournier, M. et al. (2008). Modeling and study of the impacts of electrically heated windows on the energy needs of buildings. International Conference on Heat Transfer, Thermal Engineering and Environment, pp. 76–83. Rhodes, Greece. [Google Scholar]
19. Myhren, J. A., Holmberg, S. (2008). Flow patterns and thermal comfort in a room with panel, floor and wall heating. Energy and Buildings, 40(4), 524–536. DOI 10.1016/j.enbuild.2007.04.011. [Google Scholar] [CrossRef]
20. Gong, X., Claridge, D. E. (2007). Impact of the position of the radiators on energy consumption and thermal comfort in a mixed radiant and convective heating system. ASHRAE Transactions, 113(1), 494–503. DOI 10.32604/EE.2020.011406d. [Google Scholar]
21. Ryan, E. M., Sanquist, T. F. (2012). Validation of building energy modeling tools under idealized and realistic conditions. Energy and Buildings, 47, 375–382. DOI 10.1016/j.enbuild.2011.12.020. [Google Scholar] [CrossRef]
22. Borgstein, E. H., Lamberts, R., Hensen, J. L. M. (2016). Evaluating energy performance in non-domestic buildings: A review. Energy and Buildings, 128(3), 734–755. DOI 10.1016/j.enbuild.2016.07.018. [Google Scholar] [CrossRef]
23. Virote, J., Neves-Silva, R. (2012). Stochastic models for building energy prediction based on occupant behavior assessment. Energy and Buildings, 53, 183–193. DOI 10.1016/j.enbuild.2012.06.001. [Google Scholar] [CrossRef]
24. Zhao, H., Magoulès, F. (2012). A review on the prediction of building energy consumption. Renewable and Sustainable Energy Reviews, 16(6), 3586–3592. DOI 10.1016/j.rser.2012.02.049. [Google Scholar] [CrossRef]
25. La Fleur, L., Moshfegh, B., Rohdin, P. (2017). Measured and predicted energy use and indoor climate before and after a major renovation of an apartment building in Sweden. Energy and Buildings, 146, 98–110. DOI 10.1016/j.enbuild.2017.04.042. [Google Scholar] [CrossRef]
26. Pérez-Lombard, L., Ortiz, J., Coronel, J. F., Maestre, I. R. (2011). A review of HVAC systems requirements in building energy regulations. Energy and Buildings, 43(2–3), 255–268. DOI 10.1016/j.enbuild.2010.10.025. [Google Scholar] [CrossRef]
27. Yaşar, Y., Kalfa, S. M. (2012). The effects of window alternatives on energy efficiency and building economy in high-rise residential buildings in moderate to humid climates. Energy Conversion and Management, 64, 170–181. DOI 10.1016/j.enconman.2012.05.023. [Google Scholar] [CrossRef]
28. Bojic, M., Yik, F., Sat, P. (2002). Energy performance of windows in high-rise residential buildings in Hong Kong. Energy and Buildings, 34(1), 71–82. DOI 10.1016/S0378-7788(01)00079-2. [Google Scholar] [CrossRef]
29. Ulavi, T., Hebrink, T., Davidson, J. H. (2014). Analysis of a hybrid solar window for building integration. Energy Procedia, 57(3), 1941–1950. DOI 10.1016/j.egypro.2014.10.058. [Google Scholar] [CrossRef]
30. Maerefat, M., Zolfaghari, A., Omidvar, A. (2012). On the conformity of floor heating systems with sleeping in the eastern-style beds; physiological responses and thermal comfort assessment. Building and Environment, 47(2), 322–329. DOI 10.1016/j.buildenv.2011.07.008. [Google Scholar] [CrossRef]
31. Ren, J., Zhu, L., Wang, Y., Wang, C., Xiong, W. (2010). Very low temperature radiant heating/cooling indoor end system for efficient use of renewable energies. Solar Energy, 84(6), 1072–1083. DOI 10.1016/j.solener.2010.03.015. [Google Scholar] [CrossRef]
32. Causone, F., Baldin, F., Olesen, B. W., Corgnati, S. P. (2010). Floor heating and cooling combined with displacement ventilation: Possibilities and limitations. Energy and Buildings, 42(12), 2338–2352. DOI 10.1016/j.enbuild.2010.08.001. [Google Scholar] [CrossRef]
33. Jammulamadaka, H. (2017). Evaluation of energy efficiency performance of heated windows (M.S. Thesis). USA: West Virginia University. [Google Scholar]
 | This work is licensed under a Creative Commons Attribution 4.0 International License, which permits unrestricted use, distribution, and reproduction in any medium, provided the original work is properly cited. |