| Energy Engineering |
DOI: 10.32604/EE.2022.017715
ARTICLE
The Effect of a Liquid Cover on the Thermal Performance of a Salinity Gradient Solar Pond: An Experimental Study
1Department of Chemistry, College of Science, University of Thi-Qar, Thi-Qar, Iraq
2Department of Chemical and Process Engineering, Faculty of Engineering and Physical Sciences, University of Surrey, Guildford, UK
3Department of Chemical and Biological Engineering, Faculty of Engineering, University of Sheffield, Sheffield, UK
*Corresponding Author: Hameed B. Mahood. Email: hbmahood@yahoo.com
Received: 01 June 2021; Accepted: 09 August 2021
Abstract: Salinity Gradient Solar Ponds (SGSPs) offer the potential to capture and store solar energy for use in a range of domestic and industrial activities in regions with high solar insolation. However, the evaporation of water from these ponds is a significant problem that must be overcome for them to be deployed successfully. Thus, two ponds were constructed in the city of Nasiriya, Iraq. The two ponds were cylindrical with a diameter of 1.4 m and a total depth of 1.4 m. The water body in the two ponds was constructed with layer depths of 0.5, 0.75 and 0.1 m for the lower convective zone (LCZ), non-convective zone (NCZ) and the upper convective zone (UCZ) respectively. One of the two ponds was covered with a thin liquid paraffin layer (0.5 cm) to eliminate evaporation from the surface of the UCZ. The behavior of the standard SGSP and that of the covered pond with evaporation suppressed can be straightforwardly compared. The experimental units were run for six months from 1st of February to 31st of July 2019. It was shown in the first instance that by covering the pond with a thin layer of paraffin, that evaporation could be suppressed. The results showed that for the conventional SGSP, the temperature of the LCZ reached a maximum of ca. 76°C while in the covered pond the temperature of the LCZ was consistently lower than that in the uncovered pond by approximately 5–6°C. The results also indicated that the temperature of the UCZ in the covered pond was higher than that in the uncovered pond by about 10°C in the second half of the study period. However, it was noted that on rainy days the paraffin layer was swept away from the surface; and this could hinder the implementation of thin liquid cover in the large SGSP.
Keywords: Salinity gradient solar pond; paraffin cover; comparison study; experimental technique
Because of continuing industrialization, population growth and modern lifestyles that are increasingly dependent on electricity, the rising demand for energy and the ability to deliver it cleanly has become more problematic. To account for this growth in energy demand, the consumption of conventional fuels, such as coal, oil and gas has significantly increased. This, of course, has led to increases in the emission of greenhouse gases, such as CO2. There is a broad consensus around the world that the solution to many energy supply and environmental problems is through the use of alternative energy sources or renewable energy.
Amongst the multitude of different possible renewable energy sources, solar energy shows the most promise. Tremendous solar irradiance reaches the earth’s surface every day (about 174 PW); approximately 51% (about 89 PW) of it reaches the land [1]. Thus, there exists a vast reservoir of potential energy that could be tapped for various applications. Accordingly, different technologies have been utilised to harvest solar energy depending on the solar radiation intensity [2,3].
The salinity gradient solar pond (SGSP) is one such technology. It is a large reservoir of water used to both absorb the direct solar radiation and to store it in the form of heat. This thermal energy can be used later for different applications, such as domestic solar heating and water desalination. The SGSP consists of three functional layers: the upper convective zone (UCZ), the nonconductive zone (NCZ) and the lower convective zone (LCZ). The UCZ is a salt free or low salinity zone and thus it is normally made up of fresh water. Typically, the UCZ can have a depth of up to 0.5 m. The NCZ, which lies in between the UCZ and LCZ, functions as an insulation by hindering heat loss to the UCZ by preventing natural convection using a salinity gradient. The salt concentration is maximum at the bottom of the zone and it is often nearly a salt free at its top. The density of the solution is a function of salt concentration and hence the salinity density gradient opposes the thermal gradient. Finally, the LCZ is the deepest zone with the highest salt concentration (it is often, though not always, a saturated solution); it is this zone where the solar radiation is captured and stored.
The SGSP can be used in applications where the heat is to be delivered at a temperature of below 100°C. Examples of such low temperature applications include the supply of warm air for industrial salt production processes, agricultural crop drying, water desalination and power production [4]. Before the SGSP can be deployed to these applications, a number of challenges, such as evaporation and the diffusion of salt between the layers, must be overcome. In addition to heat loss from the side walls and top and bottom of the pond which is negatively affect the performance of the pond. Thus, numerous attempts, especially in regions where abundant solar radiation is available, have been made to improve the thermal performance of the SGSP.
Many previous studies have concentrated on the thermodynamics of solar ponds with a view to better understanding the heat transfer process [5–16]. These studies take into account the intensity of solar radiation to predict the temperature distribution in the solar pond. Several papers have focused on the simulation of heat transfer and thermal storage in the solar pond using finite difference and finite volume methods [17–22]. Furthermore, the improvement of the thermal efficiency of solar ponds has been the subject of many studies. For example, Akbarzadeh et al. [23], Leblanc et al. [24], and Dah et al. [25] investigated the improvement in the solar pond efficiency resulting from heat extraction from both the non-convective (NCZ) and the lower convective (LCZ) layers, using heat exchangers inside the pond. Their results concluded that using heat exchangers within the solar pond can significantly enhance the thermal efficiency of the solar pond. Leblanc et al. [24] demonstrated experimentally that the overall thermal efficiency could be improved by ca. 55%. ALMeshaal [26] conducted a three-dimensional numerical study to investigate the effect of double-diffusive natural convection in a pond with a trapezoidal geometrical shape. It was found that the ununiform heat extraction from the LCZ would affect the water body structure of the pond.
Khalilian [27] investigated the temperature distribution and the thermal efficiency of the non-convective zone (NCZ) of a square salinity gradient solar pond located in Urmia, Iran. The effect of shading on the thermal efficiency was analysed. The results indicated that the maximum efficiencies of the specific SGSP were about 9.3% and 6.57% for the cases with and without shading. Similarly, Khalilian [28] studied numerically the effect of shadow on the vertical temperature distribution in the SGSP. The new numerical results were compared with his previous observations [27]. The results showed that the maximum temperature reached in the pond for the cases with and without the shadow effect were 66.8°C and 65.8°C. Thereafter, Khalilian et al. [29] studied theoretically the effect of four different extraction techniques on the transient thermal performance of a SGSP: extraction from the lower zone, extraction from only the non-convective zone, extraction from both LCZ and NCZ and finally the extraction from LCZ and from the ground beneath the pond. A one-dimensional numerical model utilising an implicit finite difference method was solved using MATLAB. It was shown that the maximum thermal efficiency was 29.18% for the cases of the heat extraction from NCZ, or for a combination of NCZ and LCZ, while it was ~24.92% for the case with ground extraction and finally it was only ~17.95% when heat was extracted from only the LCZ.
One of the most significant benefits of solar energy applications is the ability to combine many technologies to achieve a particular goal. Consequently, the influence of coupling a solar collector with a heat transfer area of about 10 m2 with a relatively large SGSP (about 50 m2 area) on the thermal performance of the pond under different season conditions was investigated experimentally by Alcaraza et al. [30] in Barcelona (Spain). In their study, two in-pond heat exchangers were used for heat extraction. It was observed that using the solar collector as an external heat source with the SGSP led to an increase in the overall thermal efficiency of the pond during the cold season by 50%. In the same direction, Satish et al. [31] discussed the heat extraction from the LCZ of the pond and the effectiveness of coupling the SGSP with a desalination unit. It was concluded that SGSPs can be integrated with other solar applications to provide heat for the desalination process.
Evaporation from the top of the pond (UCZ) can significantly affect its performance. Consequently, the elimination or suppression the evaporation would decrease heat and mass loss from the pond. Sayer et al. [32] investigated theoretically the improvement of SGSP by suppressing surface evaporation with an air layer. Their results for a year-long period illustrated that adding the air cover improved the LCZ temperature with a total average increase of approximately 9% over the conventional pond (uncovered). Furthermore, there was an average increase about 45% in the temperature of the UCZ.
Seeking to extend the heat extraction time from the lower zone of a pond, Beika et al. [33] proposed using paraffin wax as a phase change material (PCM) in the lower zone of a solar pond. Their analysis involved the use of a one-dimensional numerical model to investigate the transient behaviour of the temperature distribution in the pond. The results revealed that because of the various losses, such as reflection, conduction through the walls and convection, only 6% of the solar irradiance was stored within the lower zone. Furthermore, the use of the PCM led to a more stable temperature in the pond during heat extraction. In other words, it can reduce the temperature variation in the LCZ between day and night; this variation negatively affects the amount of heat stored in the LCZ and consequently affects its performance. Similarly, Ines et al. [34] studied experimentally the effect of adding salt hydrate PCM on the behaviour of a SGSP using a mini SGSP working under simulated lab conditions. It was shown that the solar pond with the proposed PCM could effectively provide hot water for different domestic applications. The capability of an industrial solar pond to provide a low temperature heat (about 60°C) during two working seasons (2014–2015) for the flotation stage of a mineral plant in Solvay Minerales in Granada, Spain was assessed by Montalà et al. [35]. To ascertain the stability of the salinity gradient, two methods based on the principle of stratification were implemented. A distortion of the upper zone of the pond during the first season was observed; the thickness of the zone changed from 0.3 to 0.8 m. Additionally, it was concluded that the thermal and salinity expansion coefficient assessment methods were the most useful tool that can be used to control the solar pond technology. The capability of enhancing the thermal performance and increasing the SGSP heat storage was investigated experimentally by Ganguly et al. [36]. The improvement of the pond was achieved by increasing its thermal mass by adding an external heat source to the pond. The results revealed that the thermal efficiency of SGSP can be improved significantly by increasing the thermal mass of the pond. Recently, Das [37] investigated the conventional assumptions that have been used to simulate the effect of ground heat extraction using different overall heat transfer coefficient values with closed form solutions. They obtained results for how the temperature distribution of the three zones deviated from the ideal temperature distribution.
According to the IEA report in 2012, Iraq has one of the highest levels of solar irradiance in the Middle East [38]. There are considerable periods of sunshine and vast tracts of land are available. There also exist significant problems in energy supply and water desalination. Additionally, there is a continuous increase in demand on energy. Therefore, using SGSP technology for different applications in Iraq could mitigate the power and pure water crisis. The lack of experimental data is a substantial barrier hindering the implementation of SGSPs in Iraq. To this end, this study evaluates experimentally the possibility of using the SGSP in the south of Iraq, and whether the thermal performance can be improved by the use of liquid covers. This thin liquid cover is used to eliminate the evaporation from the top of the SGSP. Evaporation is a considerable challenge to the implementation of solar ponds in hot and arid areas. It was shown previously that heat loss from the pond surface (UCZ) is mainly by evaporation. Evaporated water from the surface needs to be substituted to replenish the UCZ and this will increase operating costs.
2.1.1 Construction of Solar Ponds
Two experimental ponds were constructed at the College of Science of the University of Thi-Qar in the city of Nasiriya in Southern Iraq. Construction began with the preparation of the base of the two ponds; the first layer on the ground was a sand layer of thickness 10 cm on the top of which was laid a layer of polystyrene (5 cm thickness) to insulate the base of the pond from the ground. The final layer of the base was a layer of 10 cm thick layer of concrete. The concrete was left for several days to cure before the walls of the two ponds were built on top. The walls of the ponds were built from brick with a wall thickness of 20 cm. A cylindrical shape was selected for the two ponds to decrease shadow effects. The two ponds had a diameter of 1.4 m and a total depth of 1.4 m.
After the construction of the main structure of the two ponds, they were skimmed internally and externally with a layer of concrete to leak-proof; this layer had a thickness of 2 cm. To reduce the heat loss to the environment, each pond was surrounded by a 10 cm layer of insulating material. To hold and support this layer of insulation, the ponds were enclosed by a layer of galvanized iron (0.7 mm thickness), with a 10 cm gap left between this iron layer and the walls of the pond. Two types of insulation were used: the first was a 5 cm layer of glass wool, and the second was a 5 cm layer of polystyrene. To make sure that there were no significant voids within and between the layers of insulation, sawdust was added. Finally, the two ponds were painted black on inside to promote absorption of the incoming radiation. Photographs of the two ponds that were constructed are shown in Fig. 1.
2.1.3 Establishing the SGSP Layers
Before the water was added, a layer of nylon was used to cover the inside walls of the two ponds to further prevent leakage. The body of water in a SGSP consists of three distinct layers: the lower convective zone (LCZ), the non-convective zone (NCZ) and the upper convective zone (UCZ). Construction of these layers started by establishing the LCZ (the storage zone). The salt selected was sodium chloride (NaCl). It was selected because it is safe, readily available and has a solubility which is only a weak function of temperature. The water in this layer had a NaCl concentration of 0.25 kg/l and a depth of 0.5 m. The salty water was prepared in a separate mixing tank and then pumped to the pond. The second layer of the water body is the NCZ, which is crucial to the functionality of the SGSP. This layer prevents convection and hence suppresses heat loss from the LCZ. Moreover, it is transparent, and this allows light to penetrate to the storage zone (LCZ) [39–42]. This layer is located on the top of the LCZ and was constructed with a depth of 0.75 m. The salinity gradient was established by the addition of five 15 cm layers of salty water of decreasing salinity. The concentrations of the five layers were successively 0.2, 0.15, 0.1, 0.05, and 0.025 kg/l. Each layer of the NCZ was prepared separately in the mixing tank and gently poured on the surface of the previous layer to discourage mixing and keep the NCZ intact. The salty liquid was pumped gently with a flow rate of 1.25 l/min, and to minimise mixing was introduced via a submerged perforated polystyrene plate.
Finally, the UCZ was formed; it had a depth of 10 cm and was made from the available local fresh water. On the top of the UCZ of Pond 2, a layer of paraffin liquid (0.5 cm thickness) was added to prevent evaporation from the pond. Fig. 1 shows pictures of the ponds filled with water.
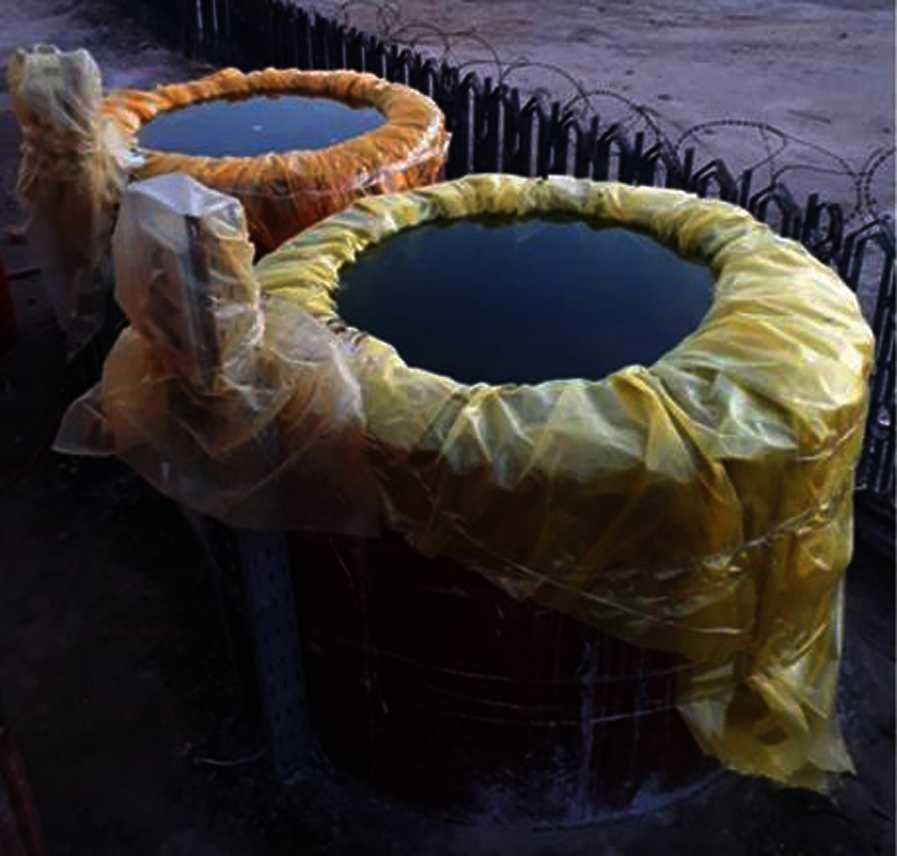
Figure 1: Pictures of the ponds after the final construction and filling with water and the filled ponds
Concentration measurements were performed by the use of a calibrated conductivity meter (HANA HI2300). The calibration of the conductivity meter was performed by the utility of standard solutions recommended by the company with PH values of 4, 7 and 9. Samples were taken from the zones of the two pond periodically and measurements were recorded throughout the study period.
To measure temperatures throughout the two ponds, K-type thermocouples were used. For each pond nine sensors were used, with three in the LCZ, five in the NCZ and the last one in the UCZ. In the LCZ, thermocouples were placed at distances of 5, 25 and 45 cm from the bottom of the pond. In the NCZ, the thermocouples were fixed at 60, 75, 90, 105 and 120 cm from the bottom of the pond. All of the thermocouples from each pond were connected to a selector switch to allow measurement of the temperature at any selected location. All the used thermocouples were calibrated by comparing their measurements with boiling (100°C) and melting (0°C) water measured by a thermometer. The uncertainty was estimated to be ±2°C.
The vertical concentration profiles of the both the conventional uncovered pond and the covered pond, were measured every ten days. The evolution of the profiles is presented in Fig. 2, for the uncovered pond, and Fig. 3, for the covered pond over the first 30 days after pond construction.

Figure 2: The measured concentration profiles for the uncovered pond at day 0 (when the body of water was constructed) and after 10 and 30 days

Figure 3: The measured concentration profiles for the pond covered with a 0.5 cm layer of paraffin at day 0 (when the body of water was constructed) and after 10 and 30 days
The initial profiles shown in Figs. 2 and 3 show that the concentration is approximately constant at 250 g/L over the bottom 40 cm of the ponds. There is then in both cases an approximately linear decrease in concentration as the surface is approached. The surface concentration in both cases is negligible. Upon inspection of the profiles for day 10, it is clear that the concentration near the bottom of the pond has decreased somewhat, and concentration varies more smoothly at the transition from the LCZ to the NCZ. Both of these observations are consistent with mass transfer along the concentration gradient being significant. Thus, to maintain the desired concentration profiles within the ponds, salt was added to the bottom of the LCZ whilst the UCZ was washed with fresh water. Washing or replenishing the UCZ was performed by adding fresh water on the top of the zone. The fresh water was pumped very gently with a flow rate of 1.25 l/min, and to minimise mixing water was poured on a submerged perforated polystyrene plate. Sayer et al. [43] derived two analytical equations to calculate concentrations of the LCZ and UCZ of any uncovered salinity gradient solar pond at any time; the two equations are as follows:
where
Considering depths of the water body of the uncovered pond of the present study Eqs. (1) and (2) for the pond can be written as below:
The measured concentrations of the LCZ and UCZ of the uncovered pond of the present study for Day 10 where compared with the concentrations calculated using Eqs. (4) and (5). It was found that there is an acceptable agreement between the measured and calculated concentrations with relative errors of 0.07 and 0.2 for the LCZ and UCZ, respectively, these errors might be due to the wind effect which was not considered in the analytical equations of Sayer et al. [43]. The comparison introduced further evidence to the use of the analytical solution to predict concentrations of the LCZ and UCZ with the time.
The effect of this maintenance is clear in that the concentration in the LCZ on day 30 has returned to close to its original value, and the concentration in the LCZ is close to uniform. Interestingly, despite the washing procedure, a non-zero concentration was observed at the surface. It is clear that the desired pond structure was established and maintained, thus allowing the pond to capture and store heat.
It is interesting to investigate if there is any influence on the concentration profile of adding the thin paraffin layer. Thus, the concentrations measured on day 30 in each of the two ponds appear in Fig. 4.
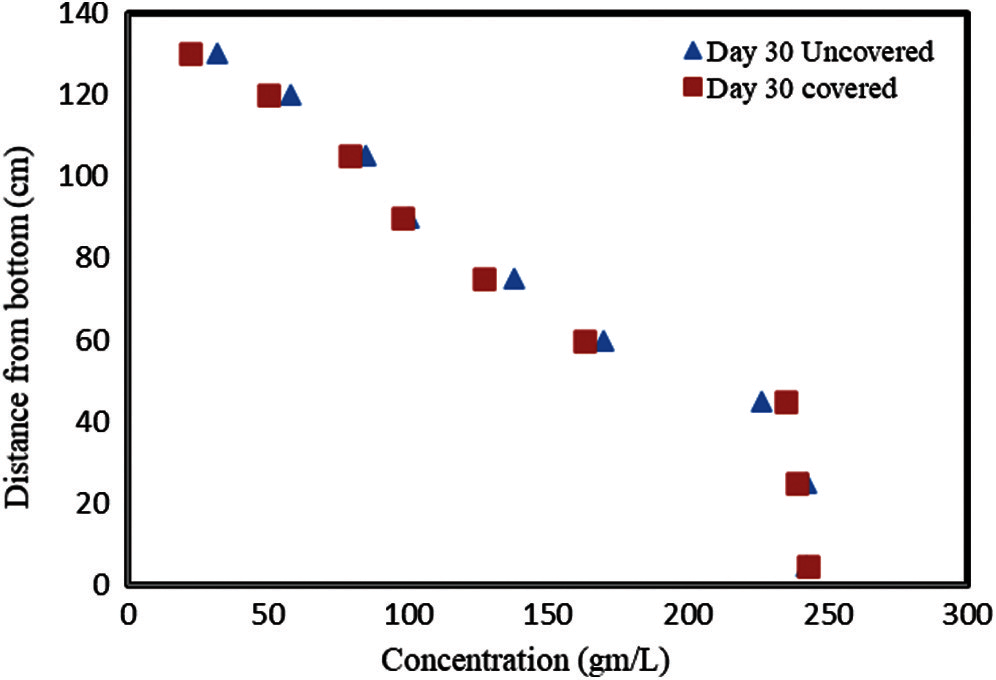
Figure 4: A comparison of the concentration gradients in the covered and uncovered ponds after 30 days of operation
Fig. 4 shows that the profile is similar in both ponds. The concentrations in the UCZ and the top layers of the NCZ in the uncovered pond are slightly higher than those in the covered pond. This may be due to evaporation from the UCZ of the uncovered pond which would clearly increase the concentration of the UCZ. Little to no evaporation occurs from the surface of the covered pond.
3.2.1 Temporal Variation of the Temperature in the UCZ and LCZ
The temperatures of the UCZ and LCZ of the two ponds were monitored throughout the study. Simultaneously, the ambient temperature was also recorded. The variations of these temperatures with time are shown in Fig. 5 for the conventional uncovered pond and in Fig. 6 for the covered pond.
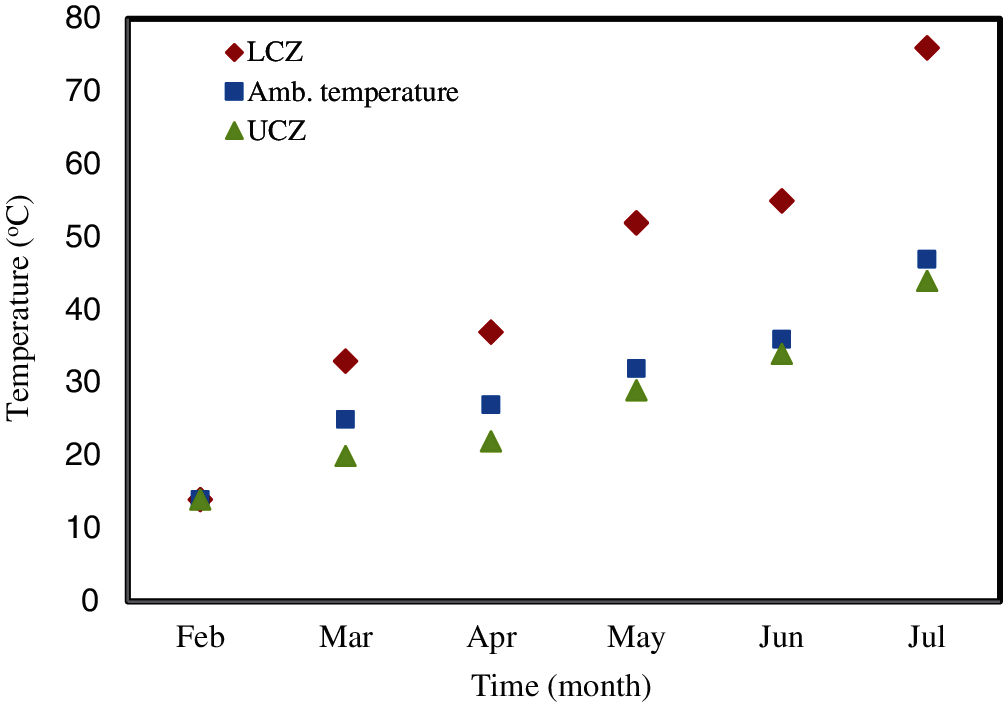
Figure 5: The variation of the temperature in the LCZ, UCZ and ambient for the uncovered pond in the day-time (afternoon 2 pm)
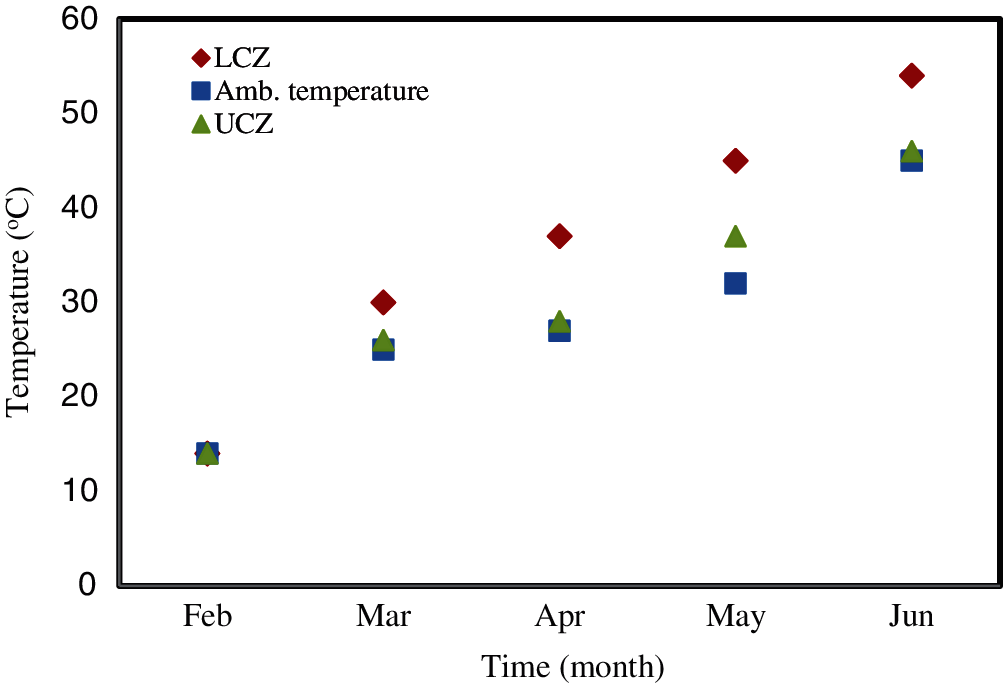
Figure 6: The variation of the temperature in the LCZ, UCZ and ambient for the covered pond in the day-time (afternoon 2 pm)
Fig. 5 illustrates that in the conventional pond, the temperatures of the LCZ and UCZ increase monotonically from February to the end of July. Their profiles are similar to that of the ambient temperature. The temperature of the LCZ reached its maximum at the end of July, where a temperature of 76°C was observed. This is significantly hotter than the ambient temperature, which shows that heat has been successfully captured and stored in the lower zone of the pond. This temperature would be sufficiently high to use for thermal desalination. The daytime temperature of the UCZ was always slightly lower than the ambient temperature over the period of the study (from 1st of February to 31st of July). The observed behaviour was similar to previous studies [44–45]. Moreover, Fig. 5 shows that temperature difference between the LCZ and UCZ increased with time. Whilst it was small at the beginning of the study, around 5°C in March, it rose to more than 15°C in May and approximately 30°C in July.
Fig. 6 shows the variation in the temperatures of the LCZ, UCZ, and ambient for the covered pond. The temperatures were measured from the 1st of February to the 20th of June. This period was shorter than that for the uncovered pond due to a leakage from the base of the pond. It is clear from Fig. 6 that temperatures increased in similar manner to those in the conventional uncovered pond. The temperature of the LCZ reached around 54°C in the covered pond while it was around 60°C in the uncovered (Fig. 5) on the same date (20th of June). Interestingly, the temperature of the UCZ was higher than the ambient temperature (Fig. 6), this is in contrast to the behavior of the uncovered pond. Moreover, Fig. 6 illustrates that the gap between temperatures of the LCZ and UCZ becomes smaller as time progresses, and this is dissimilar to the behavior in the uncovered (conventional) pond. The recorded results agree with the results observed by Sayer et al. [44].
To elucidate further, a comparison between temperatures of the UCZ in the two ponds is presented in Fig. 7.
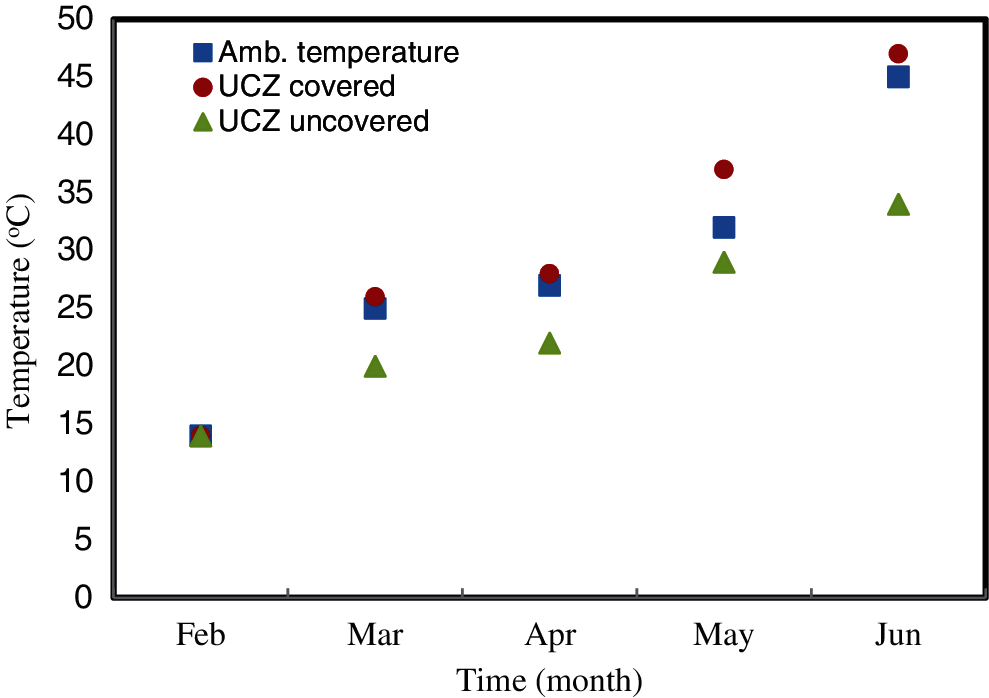
Figure 7: A comparison between the temperatures of the UCZ in the covered and uncovered ponds
It is apparent from Fig. 7 that in the covered pond, the temperature of the UCZ was higher than the temperature of the uncovered pond. The difference between the temperatures was about 5°C in March and was more than 10°C at the end of the study. Moreover, the figure also illustrates that the ambient temperature was between the two temperatures. Sayer et al. [44] observed that when the SGSP was covered, the temperature of the UCZ increased significantly. It was claimed that such behavior might be because the heat accumulated in the UCZ due to evaporation being suppressed and thus the temperature increased and could be a second heat storage. A similar behaviour was also observed elsewhere [46–48].
3.2.2 Temperature Variation with the Depth of the Two Ponds
The temperature variation with pond depth for the two ponds was recorded and illustrated in Figs. 8 and 9 for a range of different days.
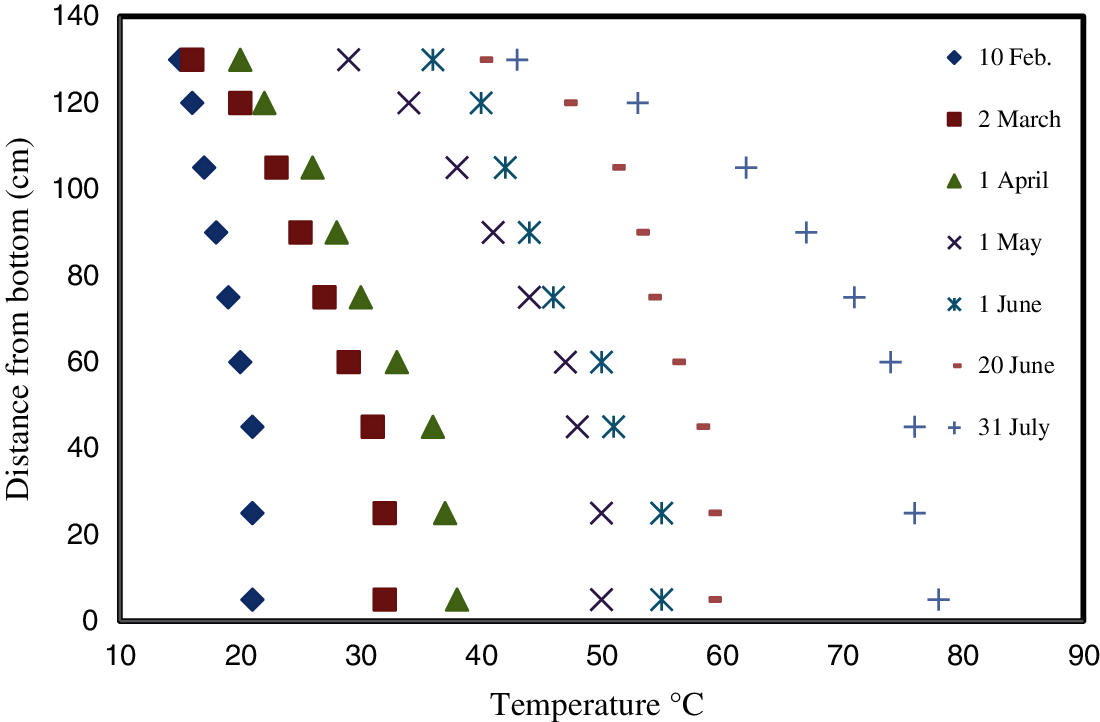
Figure 8: Temperature variation with the depth of the uncovered pond over 180 days
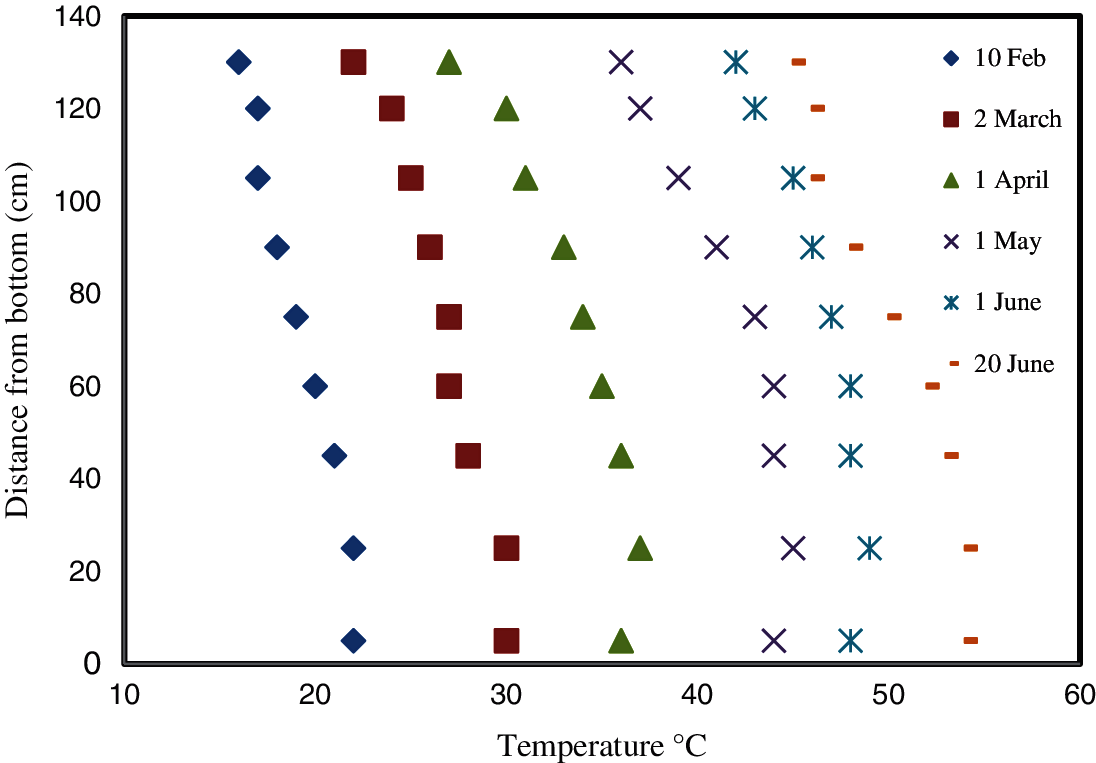
Figure 9: Temperature variation with the depth of the covered pond over 140 days
Fig. 8 shows the temperatures at different depths for Days 10, 30, 60, 90, 120, 140, and 180; Day 180 was the last day of the study. It is clear from the figure that in the conventional (uncovered) pond the temperature gradient was very small initially, and it increased with time gradually over the remainder of the study. On Day 30, the gradient became clearer and is also clear on the following next days (Days 60, 90, 120, 140 and 180). The temperature gradient is as would be expected if there was a concentration gradient.
Fig. 9 shows temperature measurements in the covered pond for the same days excluding Day 180. As mentioned previously, the covered pond was stopped in Day 140 as a result of leakage. It is evident from Fig. 9 that unlike in the conventional pond, the temperature gradient is unclear. In other words, the temperature variation with the depth was minimal for the days considered. This is abnormal in SGSPs, and might be result from the prevention of evaporation from the surface of the UCZ by the addition of the thin paraffin layer. The elimination of evaporation from the UCZ increased the temperature in the UCZ. This increased the temperature of the layers of the NCZ located directly below the NCZ. On the other hand, the paraffin layer reduced the solar radiation penetrating to the LCZ and consequently decreased its temperature by about 6°C lower than the uncovered pond. This made the gap between the two temperatures smaller.
For ease of comparison, the measured temperature profiles of each pond on Days 30, 90, and 140 are shown in Fig. 10.
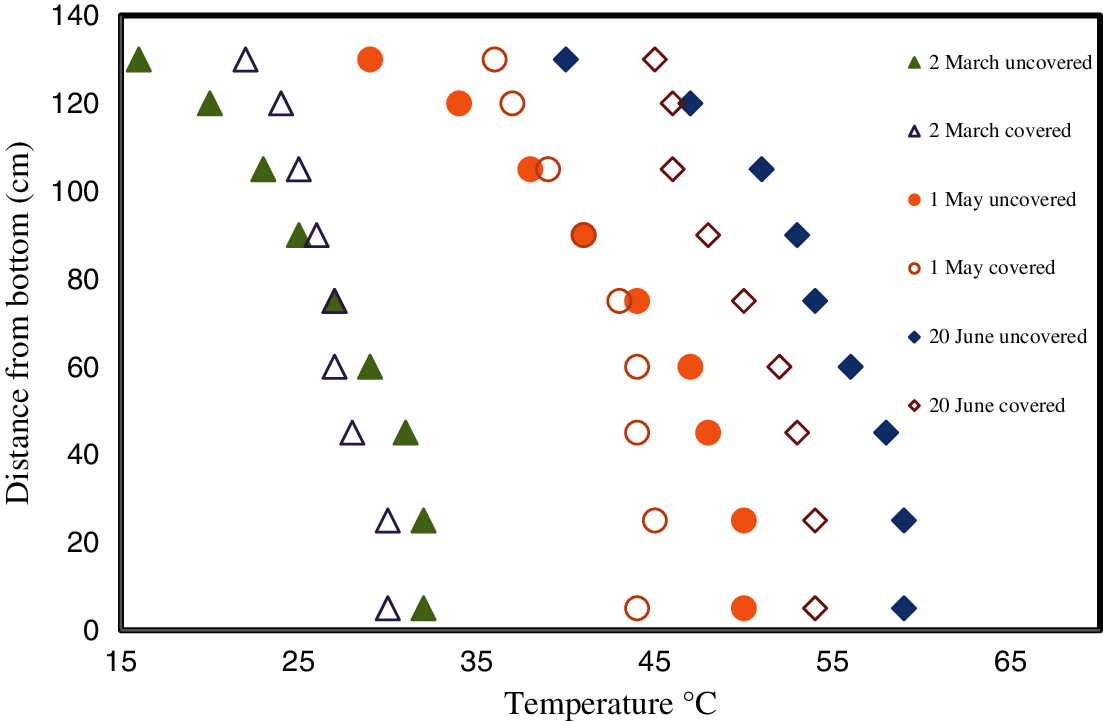
Figure 10: Measured temperature profiles for the covered and uncovered ponds on Days 30, 90 and 140
It is evident from Fig. 10 that on Day 30 (2nd of March) there was a small temperature gradient in the covered pond while it was more substantial in the uncovered pond. It is also clear that the temperatures in the LCZ of the two ponds were more similar than was the case in the UCZ. The suppression of heat loss via evaporation clearly leads to the accumulation of heat in the UCZ even at this early stage. Moreover, Fig. 10 shows that the gradient in the uncovered pond became clearly established as time progressed. However, the temperature in the covered pond is much more spatially uniform. This is consistent with the results of Sayer et al. [44].
3.2.3 Diurnal Temperature Variation
Heat loss from the pond is one of the most significant barriers to the implementation of SGSPs. This loss to the ground and surrounding environment varies between day and night leading to greater losses at night and hence larger decreased in the temperature of the LCZ. This behavior was clearly observed in the present study. Measurements of temperatures of the LCZ during the day and night for 140 days were recorded and are shown in Fig. 11 for the (a) the uncovered, and (b) the covered ponds. The figure also illustrates a comparison between temperatures of the LCZ in the two ponds.
It is evident from Fig. 11 that there is clear diurnal variation in the LCZ of each pond. The daily range was small at the beginning of the experiment and became larger with the time to reach ~6°C in the uncovered pond and 4–5°C in the covered pond. It is apparent that the heat is lost during the night, and this will slow the temperature increase in the LCZ.
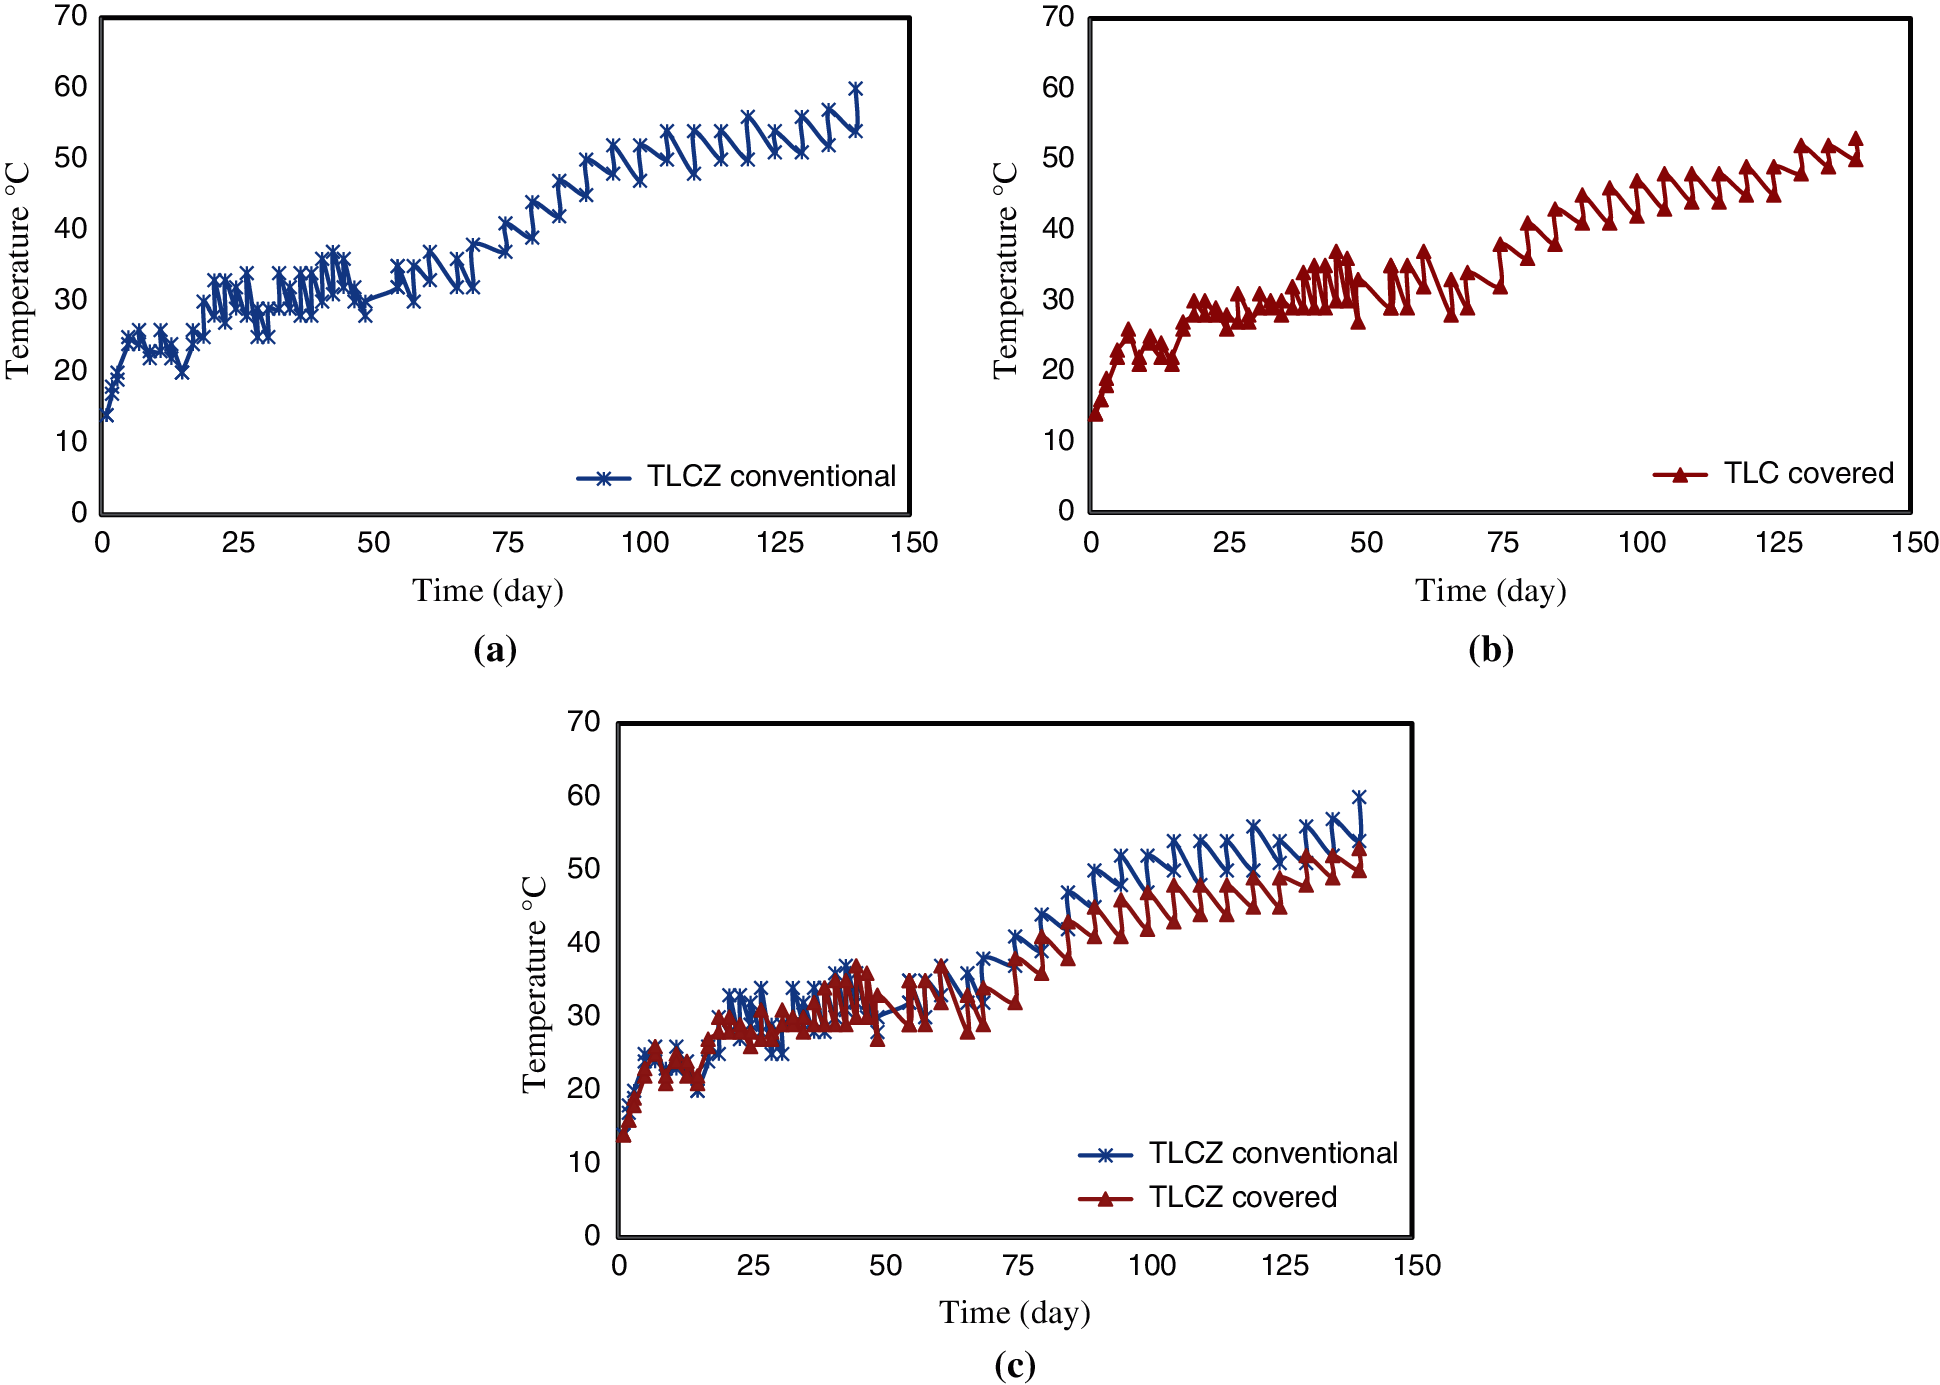
Figure 11: Measurements of the daily and nightly temperatures of the LCZ and a comparison of the uncovered and covered ponds (a) Measurements of the temperature of the LCZ of the uncovered pond (conventional), (b) Measurements of the temperature of the LCZ of the covered pond, (c) A comparison of the temperatures of the LCZ of the two ponds
Evaporation levels from the surface of the uncovered pond were recorded and the results were compared with meteorological measurements of Nasiriya City presented in Sayer et al. [44]. The comparison is shown in Fig. 12.
It is clear from Fig. 12 that evaporation levels in the present study are lower than the measurements of the meteorological station. There are two possible causes of this discrepancy. Firstly, rain levels in the area of the study during the study period were high; they were significantly higher than in previous years. The increase in the rain levels leads to an increase in relative humidity and this will decrease evaporation. Rainy weather means cloudy and humid weather with the sun therefore being obscured, which also decreases evaporation. Secondly, as Sayer et al. [44] reported, the meteorological measurements used fresh water while measurements in the present study had a non-zero salinity in the UCZ, due to salt diffusing to the UCZ. Salinity will decrease evaporation levels from open water surfaces [46]. In spite of evaporation levels being less than the normal, the recorded measurements are still substantial and have to be considered. The maximum was in June at ca. 13.5 l/m2 day. The results in Fig. 12 indicate that evaporation is a significant challenge to the operation of SGSPs. Evaporation involves both mass and heat loss and consequently would profoundly affect the performance of the SGSP.

Figure 12: A comparison between evaporation levels of the present study and evaporation meteorological measurements of Nasiriya City presented in Sayer et al. [44]
3.4 Difficulties with the Paraffin Liquid Layer
As was previously mentioned, the experiment ran from 1st February to 31st July 2019. This means that the measurements were mostly in winter and spring. In the period of the study, the weather was significantly wetter than average, and this affected the ponds and in particular the covered pond. For the covered pond, it was observed that on rainy days, the thin paraffin layer was swept away from the surface of the pond by the rain. Consequently, there was a need to re-cover the top surface of the pond with a new paraffin layer. This occurred many times throughout the investigation. Therefore, it is significant to emphasise here that the use of a liquid paraffin layer will come with some difficulties for the implementation in large ponds. Moreover, it was observed that dust mostly accumulated on the surface of the paraffin layer and had an influence on the incident solar radiation which penetrates to the LCZ; this contributed to its temperature being lower than the uncovered pond by approximately 5–6°C.
A comparison of the thermal performance of two solar ponds with and without a paraffin cover was conducted experimentally with two identical ponds installed in the College of Science of the University of Thi-Qar, in the South of Iraq. The ponds were operated for the period from 1st of February to 31st of July 2019. This means that the experimental measurements were achieved mostly in winter and spring. From the experimental results the following conclusions can be drawn:
1. No noticeable effect of the paraffin cover on the salt concentration gradient was observed.
2. The temperature of the LCZ of the uncovered pond was higher than that of the covered one. The maximum temperature of the LCZ was about 76°C in the uncovered pond while it was about 71°C for the covered pond. This is in contrast to the UCZ, where the covered pond had higher UCZ temperatures than the uncovered one.
3. The results showed a range in the LCZ temperature between the day and night for each pond. The average fluctuation in the temperature was a slightly higher for the uncovered pond in comparison with the covered pond. The average variation was about 6°C in the uncovered pond and 4–5°C in the covered pond.
4. In contrast to the uncovered pond, the variation of the temperature of the covered pond with depth was significantly lower. This is likely due to the suppression of surface evaporation.
Funding Statement: The authors received no specific funding for this study.
Conflicts of Interest: The authors declare that they have no conflicts of interest to report regarding the present study.
1. Mahdi, M. S., Mahood, H. B., Khadom, A. A., Campbell, A. N., Hasan, M. et al. (2019). Experimental investigation of the thermal performance of a helical coil latent heat thermal energy storage for solar energy applications. Thermal Science and Engineering Progress, 10(5), 287–298. DOI 10.1016/j.tsep.2019.02.010. [Google Scholar] [CrossRef]
2. Baqir, A. S., Mahood, H. B., Sayer, A. H. (2018). Temperature distribution measurements and modelling of a liquid-liquid-vapour spray column direct contact heat exchanger. Applied Thermal Engineering, 139(1), 542–551. DOI 10.1016/j.applthermaleng.2018.04.128. [Google Scholar] [CrossRef]
3. Sayer, A. H., Al-Hussaini, H., Campbell, A. N. (2021). The utilisation of statistics to estimate evaporation from the surface of solar ponds. Journal of Science, 8(1), 161–169. [Google Scholar]
4. Sayer, A. H., Al-Hussaini, H., Campbell, A. N. (2016). New theoretical modelling of heat transfer in solar ponds. Solar Energy, 125(3), 207–218. DOI 10.1016/j.solener.2015.12.015. [Google Scholar] [CrossRef]
5. Abbassi Monjezi, A., Campbell, A. N. (2016). A comprehensive transient model for the prediction of the temperature distribution in a solar pond under mediterranean conditions. Solar Energy, 135(4), 297–307. DOI 10.1016/j.solener.2016.06.011. [Google Scholar] [CrossRef]
6. Ghaffour, N., Lattemann, S., Missimer, T., Kim, C. N., Sinha, S. et al. (2014). Renewable energy-driven innovative energy-efficient desalination technologies. Applied Energy, 136, 1155–1165. DOI 10.1016/j.apenergy.2014.03.033. [Google Scholar] [CrossRef]
7. Abbassi Monjezi, A., Campbell, A. N. (2017). Comparative study of the performance of solar ponds under middle eastern and mediterranean conditions with batch and continuous heat extraction. Applied Thermal Engineering, 120(2005), 728–740. DOI 10.1016/j.applthermaleng.2017.03.086. [Google Scholar] [CrossRef]
8. Own, S. H., Ambel, A. B. (1982). Net energy analysis of residential solar ponds. Energy, 7(5), 457–463. DOI 10.1016/0360-5442(82)90055-X. [Google Scholar] [CrossRef]
9. Beniwal, R. S., Singh, R. V., Chaudhary, D. R. (1985). Heat losses from a salt-gradient solar pond. Applied Energy, 19(4), 273–285. DOI 10.1016/0306-2619(85)90002-9. [Google Scholar] [CrossRef]
10. Zaragoza, G., Ruiz, A., Guillen, B. E. (2014). Efficiency in the use of solar thermal energy of small membrane desalination systems for decentralized water production. Applied Energy, 130, 491–499. DOI 10.1016/j.apenergy.2014.02.024. [Google Scholar] [CrossRef]
11. Karakilcik, M., Kıymac, K., Dincer, I. (2006). Experimental and theoretical temperature distributions in a solar pond. Heat and Mass Transfer, 49(5–6), 825–835. DOI 10.1016/j.ijheatmasstransfer.2005.09.0-26. [Google Scholar] [CrossRef]
12. Mazidi, M., Shojaeefard, M. H., Mazidi, M. S., Shojaeefard, H. (2011). Two-dimensional modeling of a salt gradient solar pond with wall shading effect and thermo-physical properties dependent on temperature and concentration. Thermal Science, 20(4), 362–370. DOI 10.1007/s11630-011-0482-5. [Google Scholar] [CrossRef]
13. Sakhrieh, A., Al-Salaymeh, A. (2013). Experimental and numerical investigations of salt gradient solar pond under jordanian climate conditions. Energy Conversion and Management, 65(3), 725–728. DOI 10.1016/j.enconman.2012.01.046. [Google Scholar] [CrossRef]
14. Bernad, F., Casas, S., Gibert, O., Akbarzadeh, A., Cortina, J. L. et al. (2013). Salinity gradient solar pond: Validation and simulation model. Solar Energy, 98, 366–374. DOI 10.1016/j.solener.2013.10.004. [Google Scholar] [CrossRef]
15. Kumar, A., Das, R. (2021). Effect of peripheral heat conduction in salt-gradient solar ponds. Journal of Energy Storage, 33, 102084. DOI 10.1016/j.est.2020.102084. [Google Scholar] [CrossRef]
16. Rghif, Y., Zeghmati, B., Bahraoui, F. (2021). Soret and dufour effects on thermosolutal convection developed in a salt gradient solar pond. International Journal of Thermal Sciences, 161(4), 106760. DOI 10.1016/j.ijthermalsci.2020.106760. [Google Scholar] [CrossRef]
17. Hull, J. R. (1980). Computer simulation of solar pond thermal behaviour. Solar Energy, 25, 33–40. DOI 10.1016/0038-092X(80)90404-1. [Google Scholar] [CrossRef]
18. Hawlader, M. N. A., Brinkworth, B. J. (1981). An analysis of the non convecting solar pond. Solar Energy, 27(3), 195–204. DOI 10.1016/0038-092X(81)90121-3. [Google Scholar] [CrossRef]
19. Rubin, H., Benedict, B. A., Bachu, S. (1984). Modeling the performance of a solar pond as a source of thermal energy. Solar Energy, 32(6), 771–778. DOI 10.1016/0038-092X(84)90251-2. [Google Scholar] [CrossRef]
20. Karakilcik, M., Kıymac, K., Dincer, I. (2006). Experimental and theoretical temperature distributions in a solar pond. Heat and Mass Transfer, 49(5–6), 825–835. DOI 10.1016/j.ijheatmasstransfer.2005.09.026. [Google Scholar] [CrossRef]
21. Kurt, H., Ozkaymak, M., Binark, A. K. (2006). Experimental and numerical analysis of sodium-carbonate salt-gradient solar pond performance under simulated solar radiation. Applied Energy, 83(4), 324–342. DOI 10.1016/j.apenergy.2005.03.001. [Google Scholar] [CrossRef]
22. Suarez, F., Tyler, S., Childress, A. A. (2010). Fully coupled, transient double-diffusive convective model for salt-gradient solar ponds. International Journal of Heat and Mass Transfer, 53(9–10), 1718–1730. DOI 10.1016/j.ijheatmasstransfer.2010.01.017. [Google Scholar] [CrossRef]
23. Akbarzadeh, A., Andrews, J., Golding, P. (2005). Solar pond technologies: A review and future directions in Y. In: Goswami, Y. (ed.Advances in solar energy, pp. 233–294. London, UK: Earthscan. [Google Scholar]
24. Leblanc, J., Akbarzadeh, A., Andrews, J., Lu, H., Golding, P. (2011). Heat extraction methods from salinity-gradient solar ponds and introduction of a novel system of heat extraction for improved efficiency. Solar Energy, 85(12), 3103–3142. DOI 10.1016/j.solener.2010.06.005. [Google Scholar] [CrossRef]
25. Dah, M. M., Ouni, M., Guizani, A., Belghith, A. (2020). The influence of the heat extraction mode on the performance and stability of a mini solar pond. Applied Energy, 87, 3005–3010. DOI 10.1016/j.apenergy.2010.04.004. [Google Scholar] [CrossRef]
26. ALMESHAAL, M. A. (2021). Double-diffusive natural convection in a trapezoidal solar pond with discrete heat boundary conditions: Effects on nonconvective zones. Journal of Thermal Science and Technology, 16(2), JTST0019. DOI 10.1299/jtst.2021jtst0019. [Google Scholar] [CrossRef]
27. Khalilian, M. (2017). Energetic performance analysis of solar pond with and without shading effect. Solar Energy, 157(4), 860–868. DOI 10.1016/j.solener.2017.09.005. [Google Scholar] [CrossRef]
28. Khalilian, M. (2018). Experimental and numerical investigations of the thermal behavior of small solar ponds with wall shading effect. Solar Energy, 159(3), 55–65. DOI 10.1016/j.solener.2017.10.065. [Google Scholar] [CrossRef]
29. Khalilian, M., Pourmokhtar, H., Roshan, A. (2018). Effect of heat extraction mode on the overall energy and exergy efficiencies of the solar ponds: A transient study. Energy, 154(4), 27–37. DOI 10.1016/j.energy.2018.04.120. [Google Scholar] [CrossRef]
30. Alcaraz, A., Montalà, M., Valderrama, C., Cortina, J. L., Akbarzadehd, A. et al. (2018). Increasing the storage capacity of a solar pond by using solar thermal collectors: Heat extraction and heat supply processes using in-pond heat exchangers. Solar Energy, 171(1), 112–121. DOI 10.1016/j.solener.2018.06.061. [Google Scholar] [CrossRef]
31. Sathish, D., Jegadheeswaran, S. (2021). Evolution and novel accomplishments of solar pond, desalination and pond coupled to desalination systems: A review. Journal of Thermal Analysis and Calorimetry, 75(1), 415. DOI 10.1007/s10973-021-10579-8. [Google Scholar] [CrossRef]
32. Sayer, A. H., Mahood, H. B. (2020). Improved thermal efficiency of salinity gradient solar pond by suppressing surface evaporation using an air layer. Energy Engineering, 117(6), 367–379. DOI 10.32604/EE.2020.011156. [Google Scholar] [CrossRef]
33. Beik, A. J., Assari, M. R., Tabrizi, H. B. (2019). Transient modeling for the prediction of the temperature distribution with phase change material in a salt-gradient solar pond and comparison with experimental data. Journal of Energy Storage, 26(7520), 101011. DOI 10.1016/j.est.2019.101011. [Google Scholar] [CrossRef]
34. Ines, M., Paolo, P., Roberto, F., Mohamed, S. (2019). Experimental studies on the effect of using phase change material in a salinity-gradient solar pond under a solar simulator. Solar Energy, 186(9), 335–346. DOI 10.1016/j.solener.2019.05.011. [Google Scholar] [CrossRef]
35. Montalà, M., Cortina, J. L., Akbarzadehd, A., Valderrama, C. (2019). Stability analysis of an industrial salinity gradient solar pond. Solar Energy, 180(2012), 216–225. DOI 10.1016/j.solener.2019.01.017. [Google Scholar] [CrossRef]
36. Ganguly, S., Date, A., Akbarzadeh, A. (2019). On increasing the thermal mass of a salinity gradient solar pond with external heat addition: A transient study. Energy, 168(2), 43–56. DOI 10.1016/j.energy.2018.11.090. [Google Scholar] [CrossRef]
37. Verma, S., Das, R. (2020). Effect of ground heat extraction on stability and thermal performance of solar ponds considering imperfect heat transfer. Solar Energy, 198(5), 596–604. DOI 10.1016/j.solener.2020.01.085. [Google Scholar] [CrossRef]
38. International Energy Agency (2012). Iraq energy outlook. World Energy Outlook Special Report. [Google Scholar]
39. Karakilcik, M., Dincer, I., Marc, A. R. (2006). Performance investigation of a solar pond. Applied Thermal Engineering, 26(7), 727–735. DOI 10.1016/j.applthermaleng.2005.09.003. [Google Scholar] [CrossRef]
40. Velmurugan, V., Srithar, K. (2008). Prospects and scopes of solar pond: A detailed review. Renewable and Sustainable Energy Reviews, 12(8), 2253–2263. DOI 10.1016/j.rser.2007.03.011. [Google Scholar] [CrossRef]
41. Abbassi Monjezi, A., Mahood, H. B., Campbell, A. N. (2017). Regeneration of dimethyl ether as a draw solute in forward osmosis by utilising thermal energy from a solar pond. Desalination, 415(4), 104–114. DOI 10.1016/j.desal.2017.03.034. [Google Scholar] [CrossRef]
42. Anagnostopoulos, A., Sebastia-Saez, D., Campbell, A. N., Garcia, A. H. (2020). Finite element modelling of the thermal performance of salinity gradient solar ponds. Energy, 203(4), 117861. DOI 10.1016/j.energy.2020.117861. [Google Scholar] [CrossRef]
43. Sayer, A. H., Al-Hussaini, H., Campbell, A. N. (2017). An analytical estimation of salt concentration in the upper and lower convective zones of a salinity gradient solar pond with either a pond with vertical walls or trapezoidal cross section. Solar Energy, 158(2), 207–217. DOI 10.1016/j.solener.2017.09.025. [Google Scholar] [CrossRef]
44. Sayer, A. H., Al-Hussaini, H., Campbell, A. N. (2017). Experimental analysis of the temperature and concentration profiles in a salinity gradient solar pond with, and without a liquid cover to suppress evaporation. Solar Energy, 155(36), 1354–1365. DOI 10.1016/j.solener.2017.08.002. [Google Scholar] [CrossRef]
45. Jaefarzadeh, M. R. (2004). Thermal behaviour of a small salinity-gradient solar pond with wall shading effect. Solar Energy, 77(3), 281–290. DOI 10.1016/j.solener.2004.05.013. [Google Scholar] [CrossRef]
46. Assari, M. R., Tabrizi, H. B., Nejad, A. K., Parvar, M. (2015). Experimental investigation of heat absorption of different solar pond shapes covered with glazing plastic. Solar Energy, 125, 569–578. DOI 10.1016/j.solener.2015.09.013. [Google Scholar] [CrossRef]
47. Ruskowitz, J. A., Suarez, F., Tyler, S. W., Childress, A. E. (2014). Evaporation suppression and solar energy collection in a salt-gradient solar pond. Solar Energy, 99(15), 36–46. DOI 10.1016/j.solener.2013.10.035. [Google Scholar] [CrossRef]
48. Finch, J. W., Hall, R. L. (2011). R&D Technical Report W6-043/TR. https://www.environmentagency.Gov.uk. [Google Scholar]
 | This work is licensed under a Creative Commons Attribution 4.0 International License, which permits unrestricted use, distribution, and reproduction in any medium, provided the original work is properly cited. |