| Energy Engineering |
DOI: 10.32604/EE.2022.017843
ARTICLE
Effects of Spark Energy on Spark Plug Fault Recognition in a Spark Ignition Engine
1Faculty of Mechanical and Automotive Engineering Technology, Universiti Malaysia Pahang, Pekan, 26600, Malaysia
2Centre for Automotive Engineering, Universiti Malaysia Pahang, Pekan, 26600, Malaysia
3Automotive Technology Center (ATeC), Politeknik Sultan Mizan Zainal Abidin, Dungun, 23000, Malaysia
4Automotive Engineering Department Education, Engineering Faculty, Universitas Negeri Yogyakarta, Yogyakarta, 55281, Indonesia
*Corresponding Author: A. A. Azrin. Email: azrynabdulazyz@ump.edu.my
Received: 10 June 2021; Accepted: 09 August 2021
Abstract: The increasing demands for fuel economy and emission reduction have led to the development of lean/diluted combustion strategies for modern Spark Ignition (SI) engines. The new generation of SI engines requires higher spark energy and a longer discharge duration to improve efficiency and reduce the backpressure. However, the increased spark energy gives negative impacts on the ignition system which results in deterioration of the spark plug. Therefore, a numerical model was used to estimate the spark energy of the ignition system based on the breakdown voltage. The trend of spark energy is then recognized by implementing the classification method. Significant features were identified from the Information Gain (IG) scoring of the statistical analysis.
Keywords: Spark energy; numerical model; breakdown voltage; fault recognition; classification
The depletion of non-renewable energy resources such as fossil fuels has become a huge concern for the global economy [1]. In the last 90 years, studies show that they always had a major share in primary energy consumption and remain a leading key issue for researchers. Due to the increasing fuel economy and emission regulations, the development of modern SI engines has shifted to a lean or diluted combustion strategy and engine downsizing.
In a four-stroke engine, direct downsizing can cause significant irregular combustion [2,3], such as knocking and low-speed pre-ignition [4]. On the contrary, a two-stroke engine's peak in-cylinder pressure may be reduced at the same torque output [5], reducing the risk of irregular combustion observed in four-stroke engines [6]. A two-stroke engine also has a higher power-to-weight ratio, which improves fuel efficiency. Recent development of SI engines requires higher spark energy and longer discharge duration during the breakdown phase of the spark plug discharge process to overcome the hard ignition caused by the diluted in-cylinder charge and increased backpressure. A higher energy transfer efficiency of the ignition system should also be increased.
The electrical field between the electrodes of a spark plug is built up before the breakdown. Thermal electrons are accelerated towards the anode as the electrical field increases. The electrons will ionize molecules in collisions if the electrical field intensity is strong enough, resulting in an avalanche-like rise of electrons and ions. Subsequently, the excited atoms produce UV radiation with a short wavelength. Ionized streamers pass from one electrode to the next, forming conductive plasma channels between the spark plug's electrodes. When conduction is generated between the opposing electrodes, the impedance between them is dramatically reduced. The breakdown phase is depicted schematically in Fig. 1. The parasitic capacitor's energy inside the spark plug is released. The breakdown phase occurs when the voltage is high (e.g., 15 kV), the peak current is large (e.g., 200 A), and the duration is extremely short (e.g., 1–3 ns) [7,8].

Figure 1: Schematic of breakdown phase of spark discharge process
However, the increased spark energy can have negative impacts on the ignition system. One of them is the increased burn rate of electrodes, which deteriorates and shortens the life of a spark plug [9]. Therefore, to value the significance of SI engines and maintain their useful life, a numerical model was used to estimate the spark energy of the ignition system based on the breakdown voltage. The trend of spark energy is then recognized by implementing the g classification method. Successful engine condition monitoring by spark plug fault recognition can keep a vehicle from breaking down. Several spark plug conditions should be observed. Carbon-fouling, oil-fouling, and spark plug gap are only a few of the spark plug health issues to be aware of. When the spark plug distance between the hot top and the ground strap is too narrow or under specifications, the air-fuel mixture gap between the hot top and the ground strap is reduced. Since the spark has a shorter travel path, it does not remain hot enough to ignite the air-fuel mixture. A clear (continuous) missing cylinder, a hard start if all plugs have narrow gaps, a rough idle, and engine reluctance are all signs of a narrow gap. A spark plug that does not burn and comes from a short distance can appear black or wet when examined. An unwanted spark irregularity happens when the voltage has to travel a longer path. The increased travel time of the spark weakens it, robbing it of the hot, solid ignition charge needed to fire the plug. An unnecessary trigger cylinder misfiring, a possible no-start situation, wet, black, or fouled plugs, engine hesitation, and rough idle.
In the past years, many researchers have investigated the fault recognition of spark plugs in SI engines which in those researches, many methods have been implemented. Using spectroscopy, Merola et al. [10] applied modeling and knock intensity monitoring in a SI engine that is one of the causes of a faulty spark plug. They used the method of chemiluminescence together with natural emission spectroscopy. They aim to spot radical species of knocking signs that can be valuable for the reaction mechanisms verification. Their studies presented that during the knocking phase, not only the ignition surface but the temperature and pressure are also improved.
Antoni et al. [11] proposed a method for analyzing vibrations in Internal Combustion (IC) engines. In their research, they proposed a cyclo system for vibration control of IC engines. They used vibration measurements to test the combustion process, demonstrating how cyclostationarity can help solve some problems. They discovered that the solution to spark plug fault diagnosis lies in passing the classical hypothesis of stationarity or quasi-stationarity by specifically modeling the form of non-stationarity involved accomplished through the framework of cyclostationarity, based on all of the evidence they gathered. They also developed a fault diagnostic for a four-stroke compression ignition engine using this method [12].
Basir et al. [13] used a data fusion technique to diagnose a fault in an IC engine. They used D–S theory to gather data from four separate sensors and then attached it. They stated that using multiple sources of information at the same time, as well as using the D–S theory as a device for modeling and fusing multi-sensory pieces of validation, would significantly improve the accuracy of fault detection and thus improve engine efficiency.
Meanwhile, Wang et al. [14] discovered a way to diagnose a diesel engine fault involving vibration signals using an adaptive wavelet packet. In this analysis, fuel injection faults were identified using Ensemble Empirical Mode Decomposition (EEMD) and Correlation Dimension (CD) methods. The advantage of using EEMD and CD together is that classifiers are not needed to distinguish the different types of diesel engine faults. This approach has solved the problem of detecting fault states when several fractal dimensions occur close together.
Vong et al. [15] on the other hand, developed a tool called Fuzzy and Probabilistic Simultaneous-Fault Diagnosis (FPSD) to detect certain failures in automotive engines. Fuzzification, decision-by-threshold, and pairwise probabilistic multi-label sorting are all part of this modern FPSD. This approach is particularly useful for resolving the essential and difficult task of engine simultaneous-fault-diagnosis using qualitative symptom recognition. Another benefit of FPSD is that it is both feasible and affordable.
Increased spark plug gap leads to common faults in SI engines [16], resulting in engine output degradation. Misfire and knock, for example, are caused by pre-ignition due to a spark plug gap fault, which causes the spark to be delayed between two electrodes. Higher ignition energy is needed as the gap between the spark plugs grows. Unfortunately, the high ignition voltage can cause damage to the engine's electrical system. This weakness in SI engines can be considered a significant electrical system flaw in general [17,18].
The maintenance of IC engines is critical to their long-term viability. As a result, they are critical for periodically tracking its state and diagnosing its faults. Various methods of condition control that were implemented by most researchers are undeniably formidable, but they require a lot of time for analysis and they also cost a lot. The implementation of numerical model and classification gives significant advantages in spark plug fault detection and has a great potential to be popular in real-time practical application analysis techniques. These methods can be used to manage engines efficiently and reliably. Since most failures have the potential to influence and change engine sound, vibration, and spark plug behaviors. A substantial amount of literature has been published on using acoustics and vibrations analyses to diagnose faults and track engine conditions [18–20].
This article set out to study the effects of spark energy on the fault recognition of spark plugs in a SI engine. A secondary ignition pickup and digital oscilloscope are used to collect the data of breakdown voltage. Breakdown voltage will be derived into a numerical model which computes the value of spark energy. The spark energy from ignition the system can be analyzed and used as an indicator to determine when a spark plug starts to deteriorate by using the evaluation of machine learning model KNN to classify the spark plug health condition. The advantage of the proposed procedure is to detect a slight fault the in spark plug with high accuracy. The suggested approach can look at the spark plug, the ignition coil, and it can show how well the fuel is combusting in the cylinder in a more practical approach and cost-efficient.
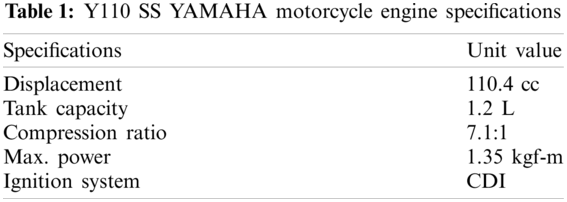
The 2-stroke engine of Y110 SS YAMAHA Motorcycle, FLUKE Secondary Ignition Pickup, and Tektronix TBS 1152B Digital Oscilloscope were used to record the breakdown voltage of the spark plug. The specifications of the 2-stroke engine are shown in Table 1.
2.2 Spark Plug and Ignition Coil
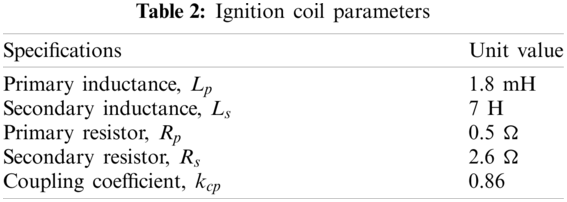
An NGK BP7HS spark plug was used in Capacitor Discharge Ignition (CDI) system. The spark plug gap was measured by using a filler gauge and confirmed to be 0.7 mm. The resistance of the embedded resistor of the NGK spark plug is 1 kΩ. The embedded resistor functions as a filter of the electrical field noise of the spark discharge process. The parameters of the ignition coil used are shown in Table 2. The primary inductance of the ignition coil is 1.8 mH and the secondary inductance is 7 H.
To prepare the engine as planned, the motorcycle rides along the test route (as shown in Fig. 2) of 5.1 km for 60 min per day. One round of the route takes five minutes. Therefore, six rounds of the route per day are required to prepare the 2-stroke engine for data collection. The lifespan of conventional spark plugs like NGK BP7HS ranging from 3000 to 5000 km [21]. After 10 weeks, a total of 50 h of engine runtime which equals 3060 km was recorded.

Figure 2: Test route for fulfilling engine runtime
The capability of the oscilloscope can only hold and treat 7 cycles (about 2,500 points). Then the whole breakdown voltage cycle would be represented by the peak breakdown voltage of each cycle. Fig. 3 shows a scatter plot of the peak breakdown voltage of a healthy and faulty spark plug. It is hard to differentiate between spark plug health conditions using only the data spark energy produced based on the peak of breakdown voltage PBDV only.

Figure 3: Scatter plot of peak breakdown voltage PBDV for (a) 1st week and (b) 10th week
A numerical model was used to estimate the spark energy of the ignition system based on the breakdown voltage of the spark plug as well as the spark plug and ignition coil parameters. The spark energy is determined by integrating the product of discharge current (
where
where
where
The primary current is calculated with the Eq. (6) [22,23].
where
2.5 Feature Extraction and Selection
Spyder 4.1.6 extracts statistical features such as standard deviation, mean, skewness, and kurtosis from the transformed data (frequency domain) for all readings. Subsequently, using IG to define the significant features via an open-source platform, Orange V3.11, a sensitivity analysis was performed. IG is an entropy-based function evaluation approach that calculates a feature's reliance on its target variable [25].
Several classifiers, including KNN, ANN, and SVM, were investigated for their effectiveness in classifying spark plug health conditions. It should be remembered that the default settings (hyperparameters) from the Orange platform are used in this preliminary investigation. The Classification Accuracy (CA), precision, sensitivity, recall, accuracy, and the F1 score derived from the confusion matrix were all used to test the classifiers.
It is hard to differentiate between spark plug engine profiles in time domain as a dataset. This is because of the slight fault considered in the current research. However, the waveform of breakdown voltage depicted in Fig. 4, can distinguish between a good and a bad spark plug.

Figure 4: Waveform of breakdown voltage during discharge process
The result of the spark energy for the ignition coil is plotted in Fig. 5. The measurement of the numerical model to estimate spark energy based on the breakdown voltage of the discharge process is slightly different compared to the experimental system due to measurement errors of the ignition coil parameters and the parasitic inductance of the experimental system. Higher ignition energy is needed as the gap between the spark plugs grows over time.
In the feature selection stage after several trials, the standard deviation is selected as the best feature for the spark energy. A total of 50 h of engine runtime is carried out within 10 weeks. After 5 h of engine runtime, one dataset of raw data is collected every week. The entire featured dataset was randomly divided into training and testing data sets with a ratio of 70–30 for each class.

Figure 5: Numerical model result of spark energy during the discharge process
The effectiveness of the classifiers was assessed in two ways: by taking into account all features and important features. Standard deviation, mean, kurtosis, and skewness corresponding to the y-axis of acceleration readings were all selected using the feature selection process. As shown in Fig. 6, the KNN and SVM models trained with all features had an overfitting trend, with the test CA slightly lower than the train CA, while the ANN model had no discernible CA for both train and test evaluations.

Figure 6: Graph of comparison between 3 classifiers
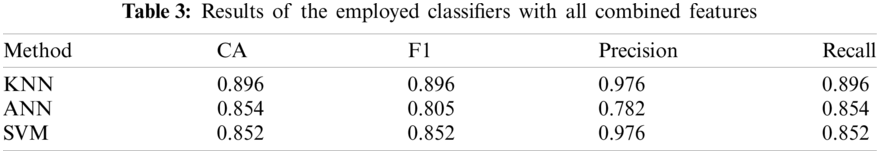
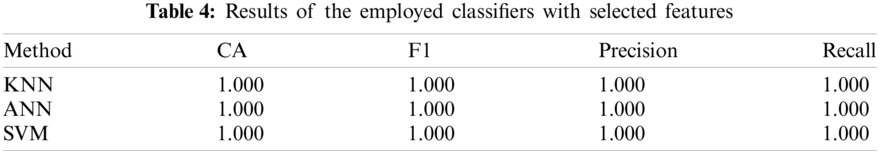
In contrast, using the selected features, both ANN and SVM models generated the same CA for both the train and test datasets, with no misclassification on the dataset. Despite this, the KNN model outperformed the other tested models in terms of CA on the train dataset, with a CA of 94.1 percent and no misclassification on the test dataset, suggesting that the KNN model is the best classifier based on the significant features discovered through IG scoring. Table 3 displays the outcomes of the models that were evaluated using different performance metrics while taking all of the dataset's features into account. Table 4, on the other hand, displays the outcomes based on the features selected.
Further examination of the fine and weighted KNN models in Fig. 7, showed that the KNN model does not report any misclassification. By increasing the amount of data collected, testing the sensitivity of the features chosen to classification accuracy, and optimizing the hyperparameter of the built model, misclassification can be reduced.

Figure 7: Test set of KNN model with selected features
A spark plug fault detection classification method based on the effects of spark energy was created as part of this preliminary investigation. The investigation revealed that the model measurement of spark energy requires further improvement for a better result. Selecting the features is not easy to provide a fairly accurate classification of the tested spark plug. It was also demonstrated that by using the IG to identify characteristics, all of the evaluated models (KNN, ANN, and SVM) on the dataset could achieve a CA of 100%. It is worth noting that the research is still in its early stages, so more data subjects will be added, different features will be engineered, and hyperparameter optimization on different machine learning models will be performed in the future. The preliminary findings also point to the proposed system's suitability for offering an objective based on judgment in the detection of spark plug faults. In comparison to the traditional approaches commonly used in spark plug fault recognition, this will assist the 2-stroke engine user in providing a more reliable assessment of spark plug health status.
Funding Statement: The authors would like to express their gratitude to the sponsorship by Universiti Malaysia Pahang under Research University Grants RDU1903101 and PGRS2003142 for laboratory facilities and financial aid.
Conflicts of Interest: The authors declare that they have no conflicts of interest to report regarding the present study.
1. Zhao, W., Ci, S. (2019). 7-Nanomaterials as electrode materials of microbial electrolysis cells for hydrogen generation. In: Nanomaterials for the removal of pollutants and resource utilization, pp. 213–242. DOI 10.1016/B978-0-12-814837-2.00007-X. [Google Scholar] [CrossRef]
2. Wang, X., Zhao, H. (2019). A high-efficiency Two-stroke engine concept: The boosted uniflow scavenged direct-injection gasoline (BUSDIG) engine with air hybrid operation. Engineering, 5(3), 535–547. DOI 10.1016/j.eng.2019.03.008. [Google Scholar] [CrossRef]
3. Fraser, N., Blaxill, H., Lumsden, G., Bassett, M. (2009). Challenges for increased efficiency through gasoline engine downsizing. SAE International Journal of Engines, 2(1), 991–1008. DOI 10.4271/2009-01-1053. [Google Scholar] [CrossRef]
4. Dingle, S. F., Cairns, A., Zhao, H., Williams, J., Williams, O. et al. (2014). Lubricant induced Pre-ignition in an optical SI engine. SAE Technical Paper. DOI 10.4271/2014-01-1222. [Google Scholar] [CrossRef]
5. Tribotte, P., Benajes, J., Novella, R., de Lima, D. (2015). Investigation on multiple injection strategies for gasoline PPC operation in a newly designed 2-stroke HSDI compression ignition engine. SAE International Journal of Engines, 8(2), 758–774. DOI 10.4271/2015-01-0830. [Google Scholar] [CrossRef]
6. Nora, D., Lanzanova, M., Zhang, T., Zhao, Y., H. (2016). Engine downsizing through two-stroke operation in a four-valve GDI engine. SAE Technical Paper. DOI 10.4271/2016-01-0674. [Google Scholar] [CrossRef]
7. Zhu, H. (2018). Spark energy and transfer efficiency analyses on various transistor coil ignition systems (Electronic Theses and Dissertations). https://scholar.uwindsor.ca/etd/7456. [Google Scholar]
8. Abe, Y., Sugiura, A., Doi, K., Shibata, M., Yokoo, N. et al. (2015). Study of ignition system for demand voltage reduction. SAE Technical Paper. DOI 10.4271/2015-01-0777. [Google Scholar] [CrossRef]
9. Zhang, D. (2010). 8-Direct injection natural gas engines. Advanced Direct Injection Combustion Engine Technologies and Development, 199–228. DOI 10.1533/9781845697327.199. [Google Scholar] [CrossRef]
10. Merola, S. S., Vaglieco, B. M. (2007). Knock investigation by flame and radical species detection in spark ignition engine for different fuels. Energy Conversion and Management, 48(11), 2897–2910. DOI 10.1016/j.enconman.2007.07.011. [Google Scholar] [CrossRef]
11. Antoni, J., Daniere, J., Guillet, F., Randall, R. B. (2002). Effective vibration analysis of IC engines using cyclostationarity. Part II—New results on the reconstruction of the cylinder pressures. Journal of Sound and Vibration, 257(5), 839–856. DOI 10.1006/jsvi.2002.5063. [Google Scholar] [CrossRef]
12. Antoni, J., Daniere, J., Guillet, F. (2002). Effective vibration analysis of IC engines using cyclostationarity. Part I–A methodology for condition monitoring. Journal of Sound and Vibration, 257(5), 815–837. DOI 10.1006/jsvi.2002.5062. [Google Scholar] [CrossRef]
13. Basir, O., Yuan, X. (2007). Engine fault diagnosis based on multi-sensor information fusion using dempster–Shafer evidence theory. Information Fusion, 8(4), 379–386. DOI 10.1016/j.inffus.2005.07.003. [Google Scholar] [CrossRef]
14. Wang, X., Liu, C., Bi, F., Bi, X., Shao, K. (2013). Fault diagnosis of diesel engine based on adaptive wavelet packets and EEMD-fractal dimension. Mechanical Systems and Signal Processing, 41(1–2), 581–597. DOI 10.1016/j.ymssp.2013.07.009. [Google Scholar] [CrossRef]
15. Vong, C. M., Wong, P. K., Wong, K. I. (2014). Simultaneous-fault detection based on qualitative symptom descriptions for automotive engine diagnosis. Appied Soft Computing, 22, 238–248. DOI 10.1016/j.asoc.2014.05.014. [Google Scholar] [CrossRef]
16. Azrin, A. A., Yusri, I. M., Sudhakar, K., Nor, C. W. M., Zainal, A. et al. (2021). An overview of the spark plug engine profile in a spark ignition engine. {IOP} Conference Series: Materials Science and Engineering, 1092(1), 1–10. DOI 10.1088/1757-899x/1092/1/012030. [Google Scholar] [CrossRef]
17. Han, J., Yamashita, H., Hayashi, N. (2011). Numerical study on the spark ignition characteristics of hydrogen–air mixture using detailed chemical kinetics. International Journal of Hydrogen Energy, 36(15), 9286–9297. DOI 10.1016/j.ijhydene.2011.04.190. [Google Scholar] [CrossRef]
18. Safizadeh, M. S., Latifi, S. K. (2014). Using multi-sensor data fusion for vibration fault diagnosis of rolling element bearings by accelerometer and load cell. Information Fusion, 18, 1–8. DOI 10.1016/j.inffus.2013.10.002. [Google Scholar] [CrossRef]
19. Jena, D. P., Panigrahi, S. N. (2014). Motor bike piston-bore fault identification from engine noise signature analysis. Applied Acoustics, 76, 35–47. DOI 10.1016/j.apacoust.2013.07.023. [Google Scholar] [CrossRef]
20. Zarei, J., Tajeddini, M. A., Karimi, H. R. (2014). Vibration analysis for bearing fault detection and classification using an intelligent filter. Mechatronics, 24(2), 151–157. DOI 10.1016/j.mechatronics.2014.01.003. [Google Scholar] [CrossRef]
21. DENSO Corporation (2018). Warnings and precautions regarding safety and usage | SPARK PLUG | automotive service parts and accessories | DENSO global website. https://www.denso.com/global/en/products-and-services/automotive-service-parts-and-accessories/plug/search/information.html. [Google Scholar]
22. Liu, M., Yu, X., Yu, S., Tan, Q., Ives, M. et al. (2017). Improvement on energy efficiency of the spark ignition system. SAE Technical Paper. DOI 10.4271/2017-01-0678. [Google Scholar] [CrossRef]
23. Liu, M., Yu, X., Yu, S., Tan, Q., Ives, M. et al. (2016). Parametric analysis of ignition circuit components on spark discharge characteristics. DOI 10.4271/2016-01-1011. [Google Scholar] [CrossRef]
24. Duarte, R., Klaric, G. (2014). Analysis of the coupling coefficient in inductive energy transfer systems. Active and Passive Electronic Components, 2014, 1–6. DOI 10.1155/2014/951624. [Google Scholar] [CrossRef]
25. Lei, S. (2012). A feature selection method based on information gain and genetic algorithm. International Conference on Computer Science and Electronics Engineering, vol. 2, pp. 355–358. DOI 10.1109/ICCSEE.2012.97. [Google Scholar] [CrossRef]
 | This work is licensed under a Creative Commons Attribution 4.0 International License, which permits unrestricted use, distribution, and reproduction in any medium, provided the original work is properly cited. |