| Energy Engineering |
DOI: 10.32604/ee.2022.016079
ARTICLE
Angle Scattering Method for Soot Concentration Measurement under Ultra-Low Emissions Condition
1School of Energy and Power Engineering, Shanghai Key Laboratory of Multiphase Flow and Heat Transfer in Power Engineering, University of Shanghai for Science and Technology, Shanghai, 200093, China
2State Key Laboratory of Coal Combustion, Huazhong University of Science and Technology, Wuhan, 430074, China
*Corresponding Author: Bin Yang. Email: yangbin@usst.edu.cn
Received: 04 February 2021; Accepted: 26 August 2021
Abstract: Aiming at the problem of soot concentration measurement under ultra-low emission conditions, a forward small angle soot concentration measurement method is proposed. Taking a typical boiler emission of 0.1 μm–3.0 μm bimodal distribution soot as an object, the particle scatter simulation calculation under different parameters is carried out, and the influence of detection angle and particle size on the angular scattering measurement of ultra-low emission soot is analyzed. The influence of detection angle and particle size on the angular scattering measurement of ultra-low emission soot is analyzed. Preferably, the wavelength of incident light is 650 nm, and the forward detection angle parameter is 15° for the design of forward small angle soot concentration measurement system. An experimental system for measuring soot with standard concentration is built. Experiments of particle concentration measurement of 1.0 μm and 3.0 μm under ultra-low emission conditions are carried out. The results show that the average deviation of soot concentration measurement is less than 0.10 mg/m3 under the condition of ultra-low emission by using 15° of forward detection, which provides an effective way for monitoring ultra-low emission soot concentration in coal-fired power plants.
Keywords: Emission monitoring; ultra-low emission; soot concentration; angular scattering
Coal-fired pollution has become one of the main sources of air pollution, which not only seriously effects the regional ecological environment, but also poses a great threat to human health [1]. All countries in the world have set strict emission standards for coal-fired pollutants [2]. “Work Plan for the Full Implementation of Ultra-low Emission and Energy Saving Transformation of Coal-fired Power Plants” was issued by the Ministry of Ecology and Environment of the People's Republic of China as well as the National Development and Reform Commission and the National Energy Administration in December 2015, in which that all coal-fired power plants with transformation conditions in the country should strive to achieve ultra-low emissions by 2020. It is proposed that the mass concentration of soot emission should not be higher than 10 mg/m3 when the reference oxygen content is 6% [3]. With the implementation of ultra-low emission transformation in coal-fired power plants, the soot emission concentration has been greatly reduced, which puts forward higher requirements for soot concentration monitoring technology. According to the requirements of ultra-low emission, the Ministry of Ecology and Environment of the People's Republic of China revised and issued “HJ76-2017Y Technical Requirements and Detection Methods for Continuous Monitoring System of Flue Gas (SO2, NOx, Particulate Matter) Emission from Fixed Pollution Sources” in 2017, which requires that when the mass concentration of particulate matter emission is not higher than 10 mg/m3, the absolute deviation between the measured value of the continuous monitoring system of flue gas emission and the average value of the measured results of the reference method should not exceed 5 mg/m3 [4].
At present, there are mainly two types of continuous monitoring methods for soot concentration: Oscillating balance method, β-ray method and other automatic continuous cumulative measurement methods [5,6]; on-line soot concentration measurement methods such as light scattering method and micro-charge method [7,8]. The automatic continuous cumulative measurement method is based on the principles of particle mass measurement such as oscillating balance method and β-ray method. The design of automatic sampling and measuring device can eliminate the artificial operation deviations in sampling, weighing and other processes, and can reduce the detection time from several hours to tens of minutes. However, it is still insufficient for the instantaneous monitoring and optimal control of boiler coal-fired particulate matter. In the on-line soot concentration measurement method, the light scattering method obtains the smoke concentration by measuring the scattered light intensity distribution caused by the interaction between light and particulate matter, which has the advantages of low minimum detection limit, high measurement sensitivity, good real-time performance, and is not effected by changeable coal types and operating conditions. According to its detection angle, the light scattering method can be divided into backward scattering method [9] and forward angle scattering method [10], etc. Due to the complexity of the actual operating conditions and flue gas conditions of boilers, different forms of light scattering methods have their own applicable characteristics in the minimum detection limit and measurement range. Among them, the forward angular scattering method is more applicable to the monitoring of ultra-low emission flue gas from coal-fired power plants with particle size of 0.1–3.0 μm and concentration of less than <10 mg/m3. At present, DRUGA D-R820F and SICK SMC-9021, which are widely used in monitoring ultra-low emission smoke from coal-fired power plants, all adopt the measurement principle of forward angular scattering method. However, the characteristic of ultra-low emission soot particles from coal-fired power plant are influenced by the operation conditions of boilers and the quality of coal, and the factors such as particle size, density and refractive index have great influence on the inversion of soot concentration by angular scattering method. Thus, it is necessary to analyze the influencing factors of soot concentration measurement by angular scattering method in combination with the characteristics of ultra-low emission soot particles from coal-fired power plants. The parameters of angular scattering measurement system are optimized, and corresponding experimental research and verification are carried out, thus providing an effective method for monitoring ultra-low emission soot concentration in coal-fired power plants.
2 Measurement Principle of Angle Scattering Method for Soot Concentration
Light scattering refers to the phenomenon that light deviates from its original direction and spreads to all directions when passing through uneven media. When a spherical particle is irradiated by a monochromatic parallel laser beam, the particle would scatter the incident light, and the intensity of the scattered light will change with different detection angles. The relationship between the scattered light intensity Is(θ) and the incident light intensity I0 can be described by Mie scattering theory [11]. A strict mathematical solution to the boundary conditions of Maxwell's equation for a single dielectric sphere in homogeneous medium isotropic by monochromatic parallel light as follows:
where
For monodisperse soot particles with particle size D and mass concentration Cm, the scattered light intensity It(θ) of the measured particle group can be described by the following equation:
where V(θ) is the volume size of the scattering area where the particles collected with scattered light are located, and N is the concentration of the number of particles.
Since the relationship between the mass concentration Cm of spherical particles and the number concentration N of particles is:
where ρ is the particle density.
Therefore, when Eq. (3) is substituted into Eq. (2), the relationship between scattered light intensity It and particulate matter mass concentration Cm can be obtained as follows:
where
From Eq. (4), it can be seen that the ratio of scattered light intensity to particle mass concentration will be effected by parameters such as incident laser wavelength, particle density, particle size, particle refractive index, scattering angle and scattering volume. For particles with known composition and determined measuring devices, the ratio of scattered light intensity to particle mass concentration would be fixed, which provides a direct and simple calibration inversion method for particle concentration measurement by angular scattering method. Therefore, the design of angular scattering soot concentration measurement system needs to optimize the parameters such as incident laser wavelength and detection angle of the measurement system combined with the characteristics of particle objects.
3 Design of Angular Scattering Measurement System for Soot Concentration
3.1 Analysis of Soot Particle Characteristics under Ultra-Low Emission Conditions
The technical route of “Low Nitrogen Combustion → Selective Catalytic Reduction (SCR) → Electrostatic Precipitator → Limestone-Gypsum Wet Flue Gas Desulfurization Unit → Phase Change Heat Exchanger → Wet Electrostatic Precipitator” is usually selected for ultra-low emission transformation of coal-fired power plants [12]. The distribution characteristics of the particle size and mass concentration of soot sampled from the outlet of the wet electrostatic precipitator are showed in Fig. 1 [13,14], which shows a bimodal distribution characteristics of 0.1 μm– 3.0 μm particle sizes, and the particle mass with a particle size of about 0.1 μm accounts for about 20% of the mass of soot, and the mass of soot with a particle size of about 1.0 μm or 3.0 μm accounts for about 80% of the total mass. Though there are different bimodal distributions of soot particle sizes in different technical routes, the volume fraction of 1.0 μm–3.0 μm particles is the majority.
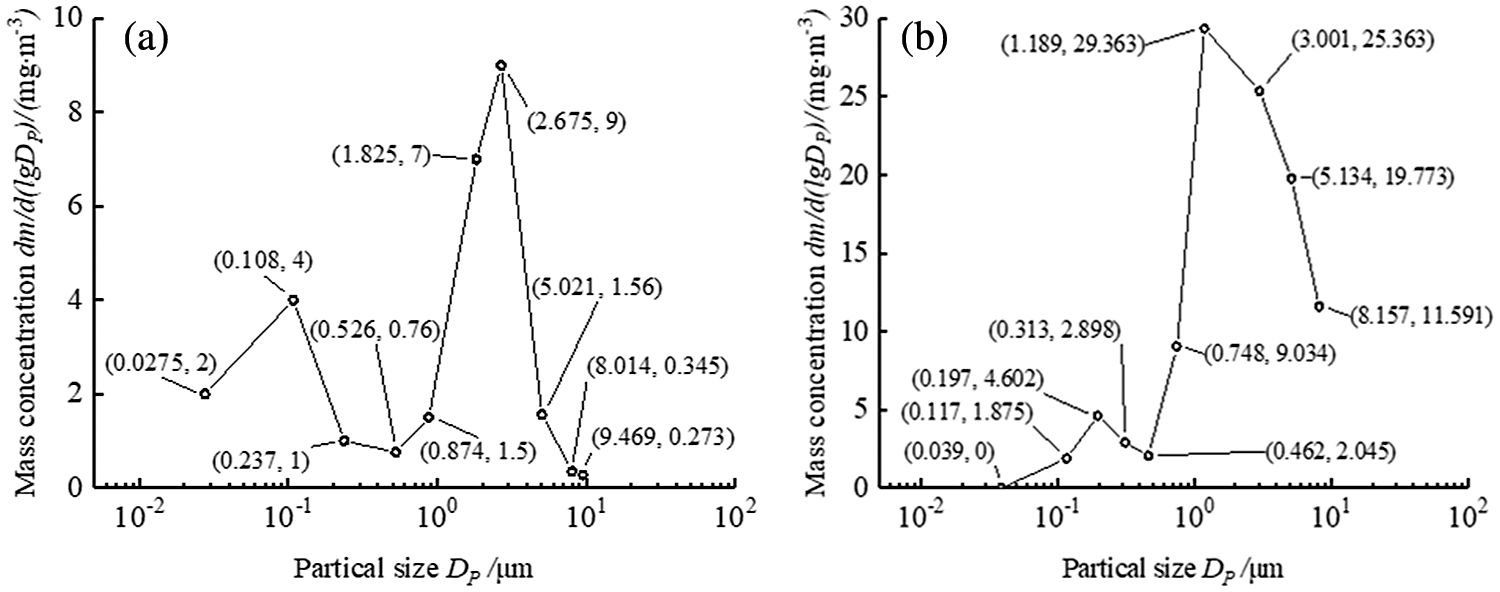
Figure 1: Particle size distribution of soot sampled from the outlet of the wet electrostatic precipitator (a) Data from reference [13] (b) Data from reference [14]
3.2 Simulation Calculation and Analysis of Soot Particles under Ultra-Low Emission Condition
Due to the different light scattering characteristics of submicron scale and micron scale particles, so the scattering intensity of different size scale particles are simulated calculation. According to the characteristics of ultra-low emission soot particles from the coal-fired power plants, the particle sizes of 0.1 μm and 3.0 μm are selected for simulation calculation of scattered light intensity distribution. The results are showed in Fig. 2, where the incident laser wavelength is 650 nm and the relative refractive index is 1.30. It can be seen that for particles with different sizes, the distribution range and size of scattered light intensity are different. The scattered light intensity of particles with size of 3.0 μm is concentrated at a small forward angle in the forward direction, and the scattered light intensity is relatively large. The scattering light intensity of particles with particle size of 0.1 μm is distributed in both of the forward and the backward directions with a large distribution range, while the scattered light intensity is small.
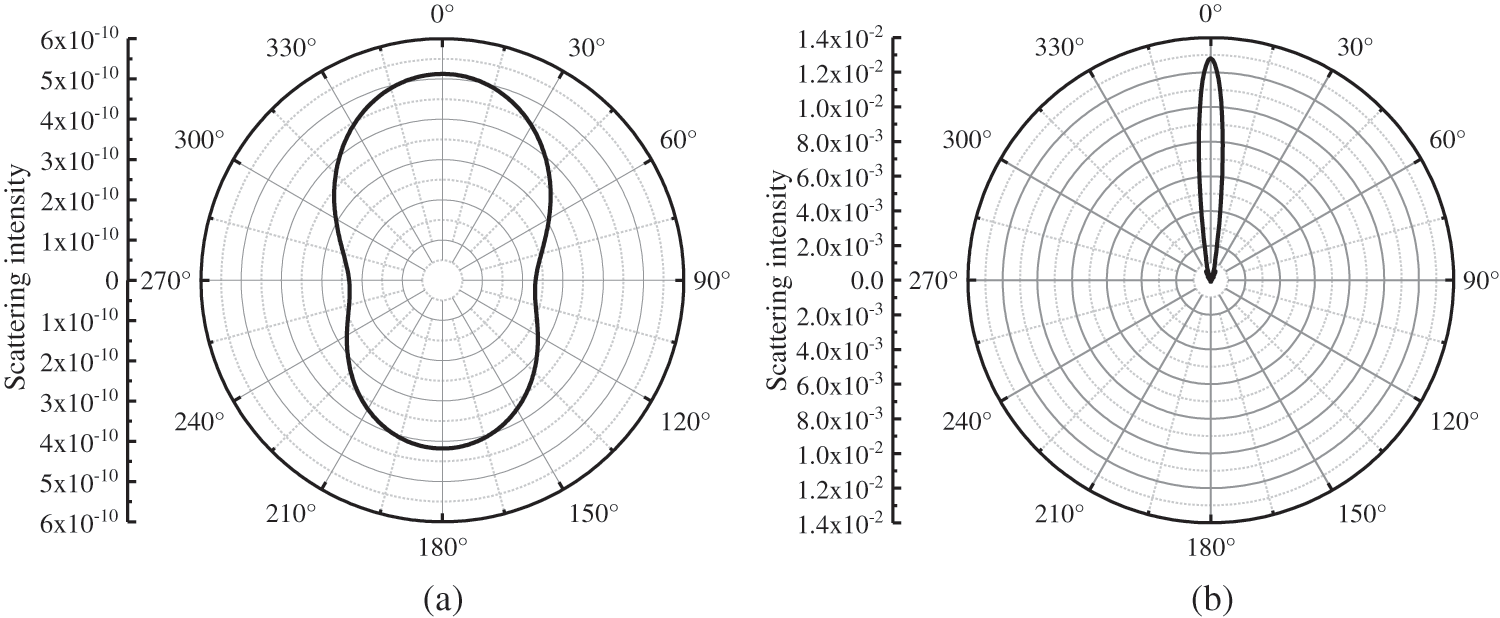
Figure 2: Scattering intensity distribution of different sizes of particle (a) 0.1 μm (b) 3.0 μm
In order to obtain the concentration of bimodal distribution characteristic of soot particles within the range of 0.1 μm–3.0 μm at the same time, combined with the above 0.1 μm and 3.0 μm particle scattering light intensity distribution characteristics, the soot concentration monitoring of 0.1 μm–3.0 μm particle size bimodal distribution characteristic under ultra-low emission conditions should select 10°–20° forward small angle detection. Therefore, the relationship between the mass concentration of particles with size of 0.1 μm and 3.0 μm and the scattered light intensity at three detection angles of 10°, 15° and 20° is simulated and calculated, and the results are showed in Fig. 3. It can be seen that when the detection angle of a particle with a particle size of 0.1 μm changes from 10° to 20°, the slope of the curve between the scattered light intensity and the particle mass concentration does not change much. While the scattering angle of large particles with a particle size of 3.0 μm changes from 10° to 20°, the slope relationship between the scattered light intensity and the particle mass concentration changes greatly, and the scattered light intensity decreases rapidly. This shows that in the range of 10°–20°, the change of detection angle has little influence on the scattered light intensity of 0.1 μm particles, while it has great influence on the scattered light intensity of 3.0 μm particles. Therefore, the design of soot concentration measurement system under ultra-low emission conditions should integrate factors such as scattered light intensity distribution of particles with different particle sizes and optical system designs, and then select a forward detection angle of 15°. Moreover, the measurement of micron particles above 1.0 μm is the key to verify the accuracy of the soot concentration monitoring system under ultra-low emission conditions.
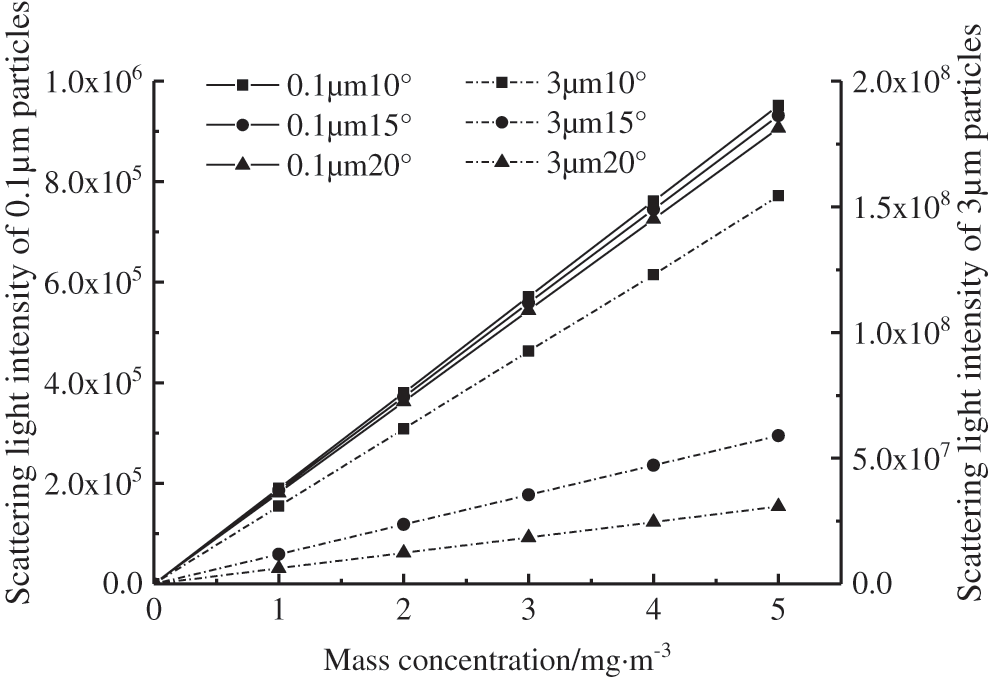
Figure 3: Relationship between the mass concentration with different particle sizes and the scattered light intensity at three detection angles
4 Experiments of Angular Scattering Measurement for Soot Concentration
4.1 Experimental System for Soot Concentration Measurements under Ultra-Low Emission Condition
In order to verify the accuracy of soot concentration measurement under the condition of ultra-low angular scattering emission, an experimental system for soot concentration measurement as shown in Fig. 4 is built. This system consists of aerosol generator (TSI 3400A), buffer cavity (d = 0.3 m, h = 0.4 m), electrostatic neutralizer (TSI 3088), laser light source (Oxxius LBX-650S), aperture (d = 2 mm), photodetector, light trap, data acquisition card, electronic low-voltage particulate impactor (ELPI, Dekati), vacuum pump (10.0 L/min) and computer. The aerosol generator generates soot with a concentration range of 0–20.0 mg/m3, which enters the measurement area through the buffer cavity and the electrostatic neutralizer under the action of air induction by the vacuum pump. After the incident laser emitted by the laser light source passes through the diaphragm, it irradiates the particles in the measurement area. Then, the scattered light is received by the photodetector, and the light intensity and voltage signals are collected by the data acquisition card and transmitted to the computer for storage and processing. Light trap is used to eliminate the scattering effect of incident light irradiating the wall of the measurement area on particle scattering light detection. The detection angle of the photodetector is at an angle of 15° with the laser transmission direction. After passing through the area to be tested, the particles enter ELPI to obtain the particle size and concentration, which are used as reference values for concentration comparison. Due to main soot particle size range of 1.0 μm–3.0 μm, silica particles with sizes of 1.0 μm and 3.0 μm are used for experimental measurement verification.
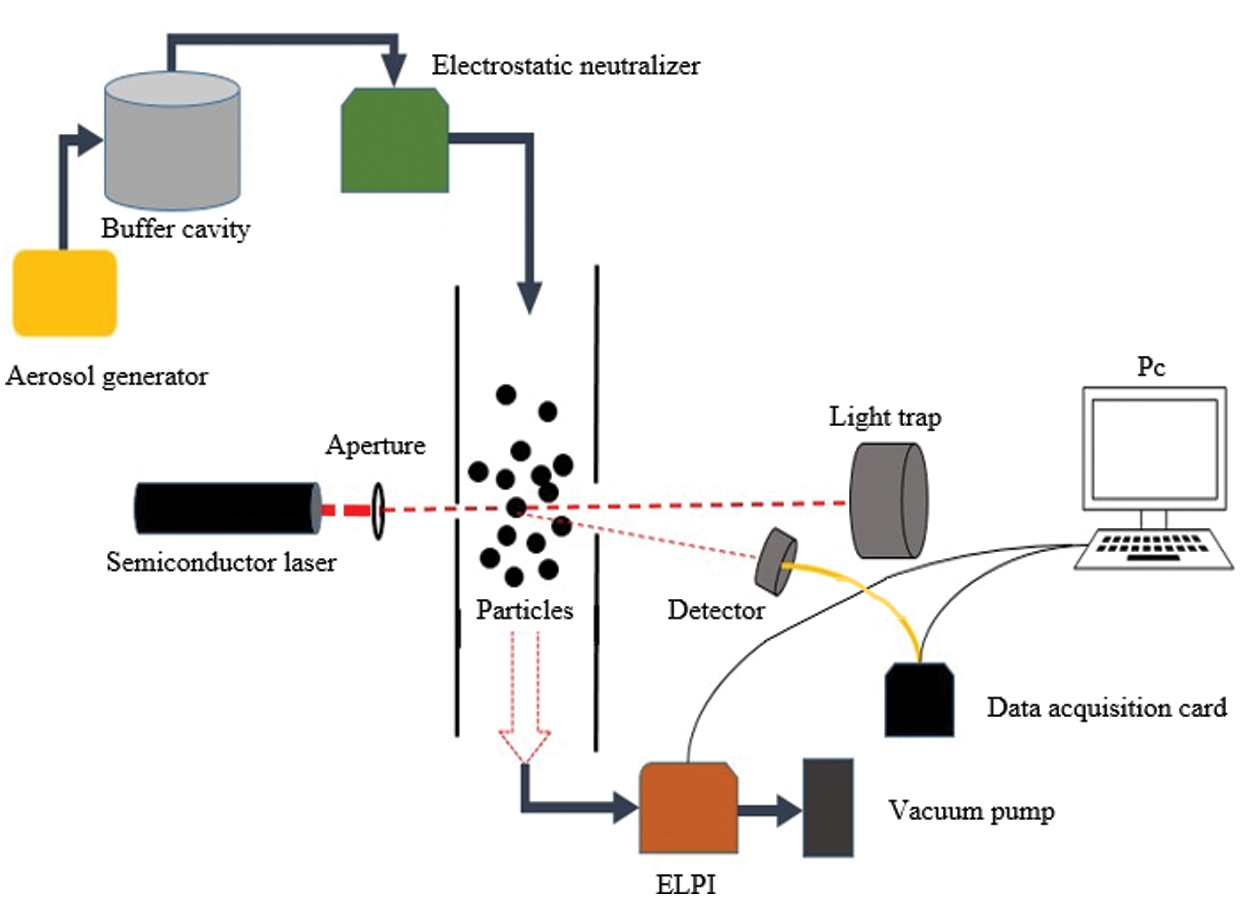
Figure 4: Soot concentration measurement system
4.2 Measurement Results and Analysis of Soot Concentration
The measurement results of scattering light intensity and ELPI particle concentration for silica particles with size of 1.0 μm are showed in Fig. 5. The gas-solid two-phase flow of particles generated by the aerosol generator enters ELPI analysis through a pipeline after passing through the light scattering measurement area. Compared with angular scattering measurement, ELPI measurement results have time lag. In order to better compare the measurement consistency between these two, the data in Fig. 5 have been corrected for time lag, unifying the zero point of experimental time. As can be seen from Fig. 5, the ELPI measurement results at the beginning of the experiment (0–300 s) are relatively small, which is mainly due to the fact that the particles generated by the aerosol generator would adhere to the inner wall of the pipeline between the angular scattering measurement area and the ELPI after the gas-solid two-phase flow through the light scattering measurement area. After the particles in the pipeline adhere stably (300--1300 s), the measurement results of these two methods have better consistency. Therefore, the time period data of 300–1300 s is selected, and the variation of scattered light intensity-particle concentration ratio with time is calculated according to Eq. (4), as shown in Fig. 6. It can be seen that the scattering light intensity-particle concentration ratio is relatively stable with time, with an average value of 753.60 and a fluctuation range within ±207.26. Based on the average value of the coefficients, the scattered light intensity signal in the 300–1300 s period in Fig. 5 is converted into particle concentration parameters and compared with ELPI particle concentration measurement results, as shown in Fig. 7. It can be seen that in the concentration range of 0.60–17.50 mg/m3, the deviation of 1.0 μm silica particle concentration angular scattering measurement result is within ±2.15 mg/m3 compared with ELPI particle concentration measurement result by using the same scattered light intensity-particle concentration ratio for particle concentration conversion. The average deviation of particle concentration with size of 1.0 μm during the period of 300–1300 s is 0.06 mg/m3.
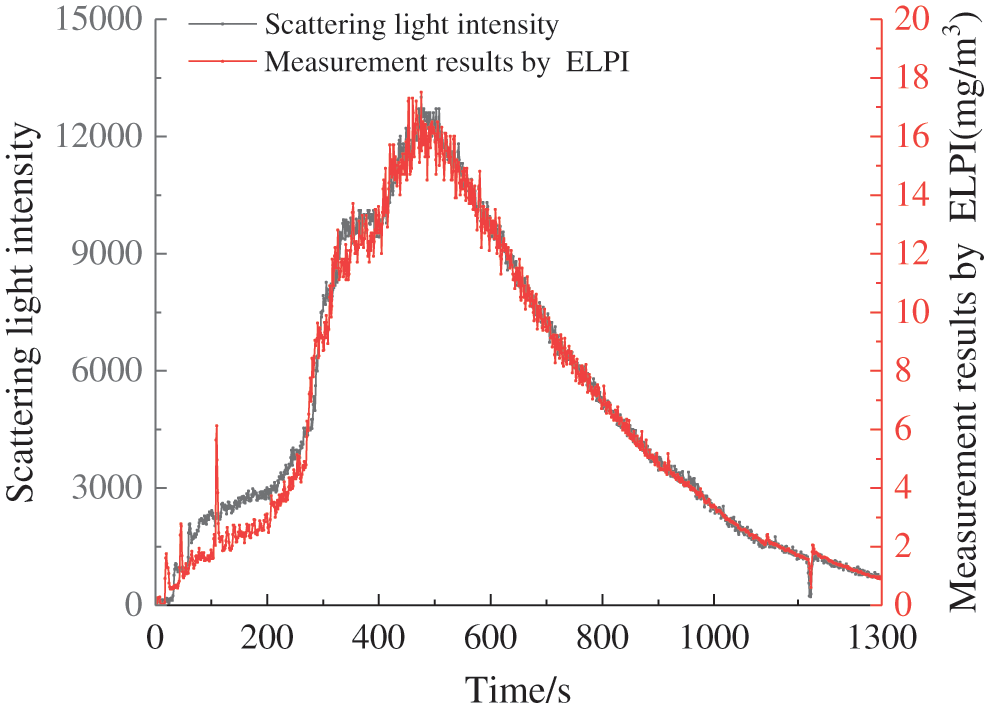
Figure 5: Measurement results of scattered light intensity and ELPI particle concentration for silica particles with size of 1.0 μm
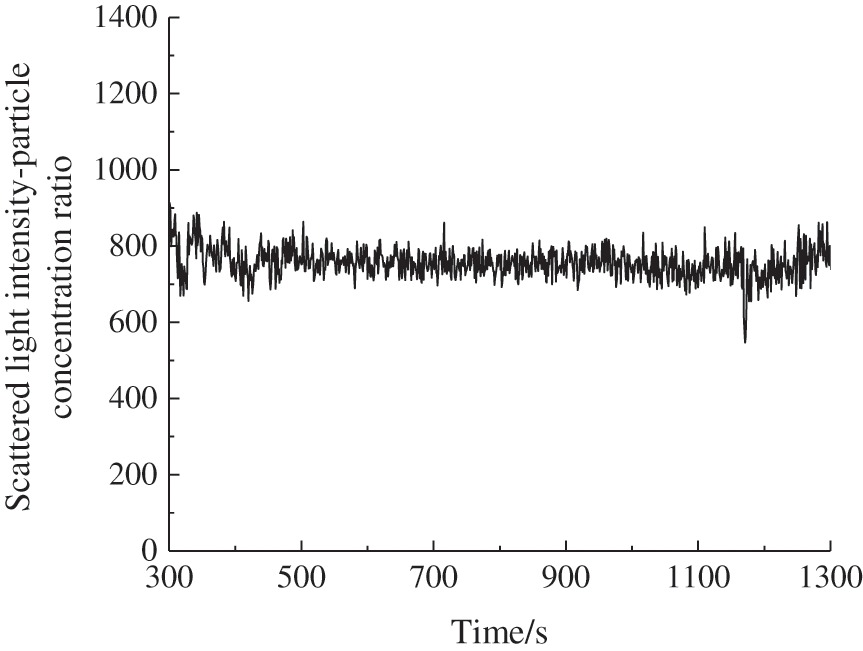
Figure 6: Variation of scattered light intensity-particle concentration ratio with time
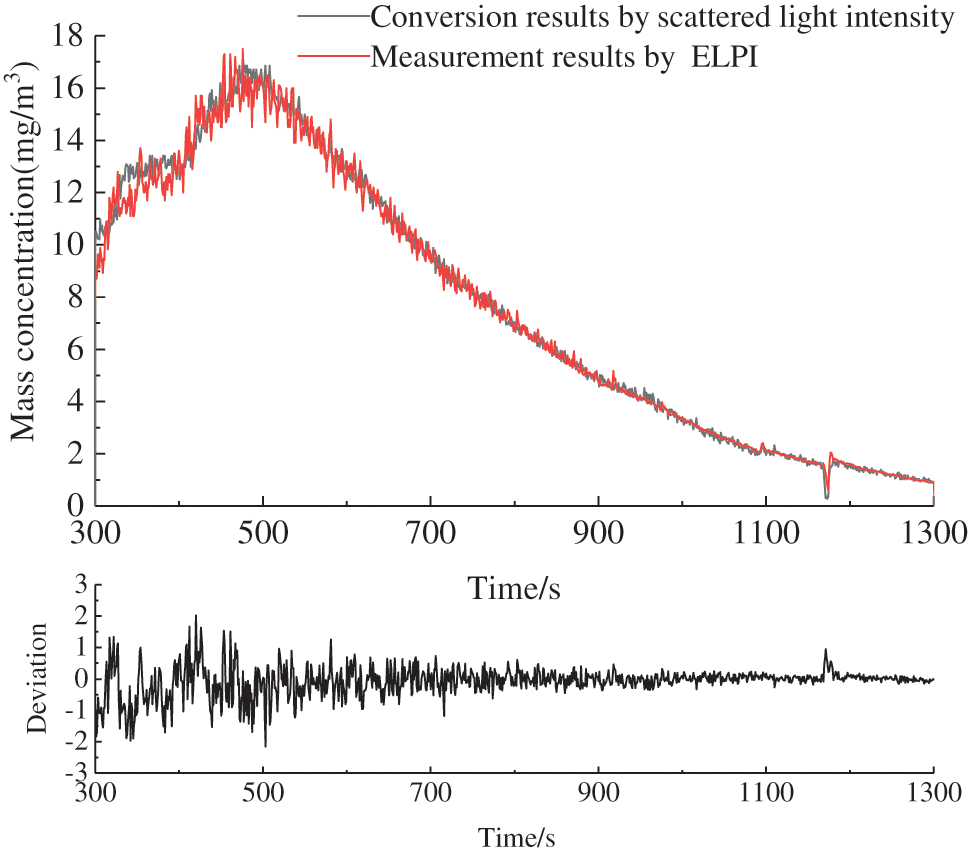
Figure 7: Particle concentration parameters converted from the scattered light intensity signal compared with ELPI particle concentration measurement results
The measurement results of scattered light intensity and ELPI particle concentration of silica particles with size of 3.0 μm are showed in Fig. 8. The gas-solid two-phase flow of particles generated by the aerosol generator enters ELPI analysis through a pipeline after passing through the light scattering measurement area. Compared with the angular scattering measurement, ELPI measurement results have time lag. In order to better compare the measurement consistency between these two, the data in Fig. 8 has been corrected for time lag, unifying the zero point of experimental time. As can be seen from Fig. 8, the experimental phenomenon is same with experiments of 1.0 μm particles. The ELPI measurement results in the initial stage of the experiment (0–200 s) are relatively small. After the particles in the pipeline adhere stably (200– 800 s), the measurement results of the two have better consistency. Therefore, the time period data of 200–800 s is selected, and the variation of scattered light intensity-particle concentration ratio with time is calculated according to Eq. (4), as shown in Fig. 9. It can be seen that the scattering light intensity-particle concentration ratio is relatively stable varying with time, with an average value of 722.88 and a fluctuation range of ±272.56. Based on the average value of this coefficient, the scattered light intensity signal in the period of 200–800 s in Fig. 8 is converted into particle concentration parameters and compared with ELPI particle concentration measurement results, as shown in Fig. 10. It can be seen that in the concentration range of 5.85–10.51 mg/m3, the deviation of the angular scattering measurement result of silica particle concentration with size of 3.0 μm is within ±2.01 mg/m3 compared with the ELPI particle concentration measurement result by the same scattered light intensity-particle concentration ratio for particle concentration conversion. The average deviation of particle concentration with size of 3.0 μm during the period of 200–800 s is 0.07 mg/m3.

Figure 8: Measurement results of scattered light intensity and ELPI particle concentration for silica particles with size of 3.0 μm
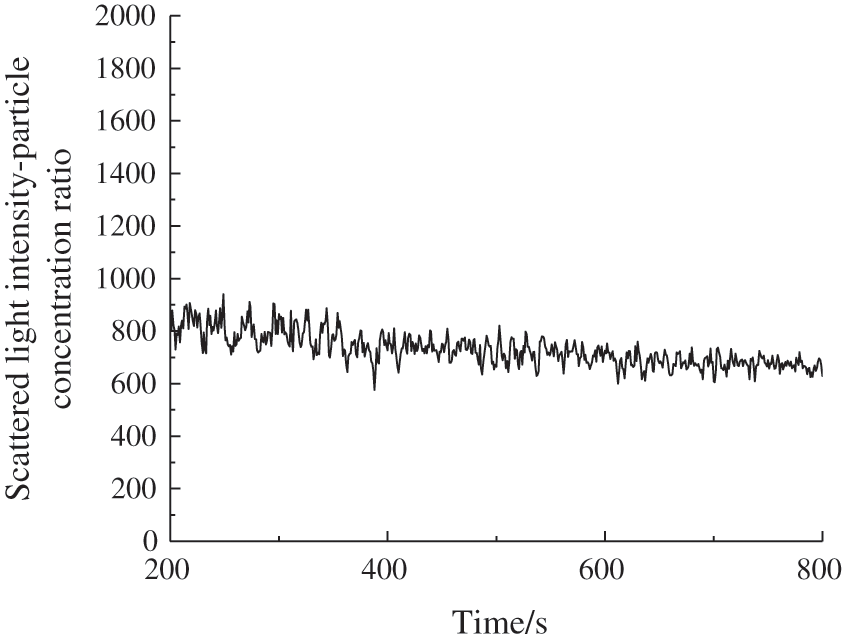
Figure 9: Variation of scattered light intensity-particle concentration ratio varying with time
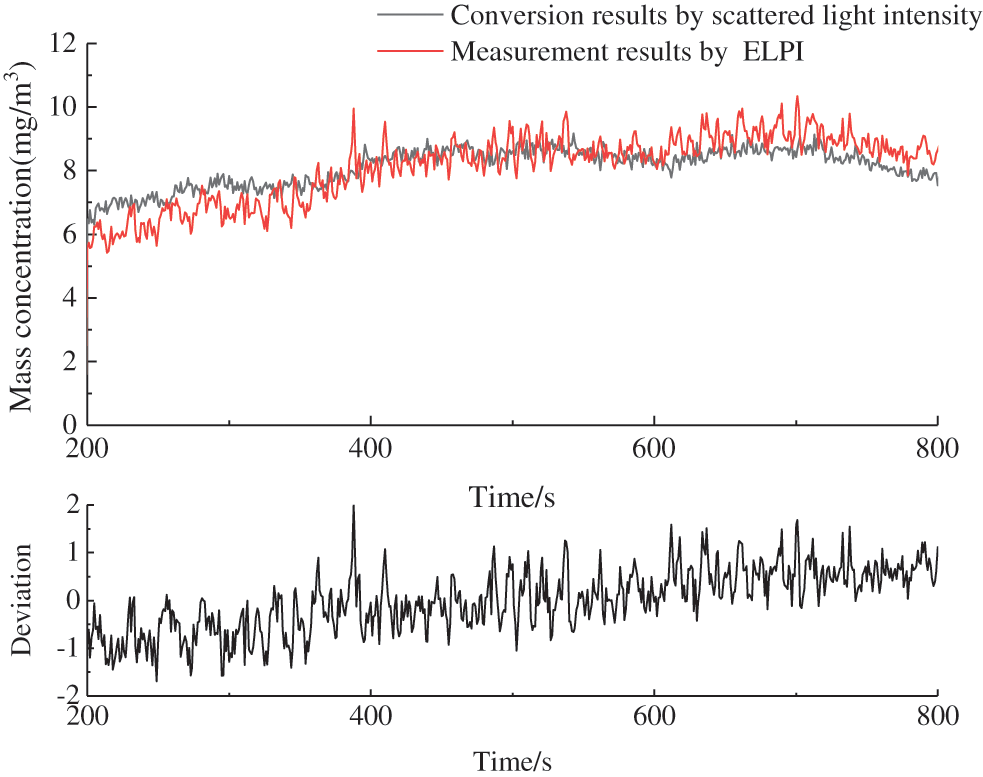
Figure 10: Particle concentration parameters converted from the scattered light intensity signal compared with ELPI particle concentration measurement results
From Figs. 7 and 10, it can be found that the real-time particulate matter concentration measured by the light scattering method is generally very close to the mass concentration measured by ELPI. However, in the measurement of silica particles with particle size of 1.0 μm, it is found from Fig. 7 that the measured values for some time are still quite different, which may be caused by factors such as unstable laser or effected detector in light scattering measurement when measuring particles with size of 1.0 μm. Generally speaking, the measurement results of light scattering method for particles with different particle sizes are very close to those of ELPI. The average deviation of soot concentration measurement is less than 0.10 mg/m3 under the condition of ultra-low emission by using 15° of forward detection. Therefore, light scattering method is feasible for the measurement of different particle size concentrations.
(1) Aiming at the problem of soot concentration measurement under ultra-low emission conditions, a forward small angle soot concentration measurement method is proposed. Taking a typical boiler emission of bimodal distribution soot with size of 0.1 μm– 3.0 μm as an object, the particle scatter simulation calculation under different parameters is carried out, and the influence of detection angle and particle size on the angular scattering measurement of ultra-low emission soot is analyzed. The influence of detection angle and particle size on the angular scattering measurement of ultra-low emission soot is analyzed. The optimal wavelength of incident light is 650 nm, and the forward detection angle parameter is 15° for the design of forward small angle soot concentration measurement system.
(2) The tower has built a standard concentration soot measurement experimental system and carried out experimental research on the concentration measurement of particles with sizes of 1.0 μm and 3.0 μm under ultra-low emission conditions. The results show that the average deviation of soot concentration measurement is less than 0.10 mg/m3 under the condition of ultra-low emission by using 15° of forward detection, which provides an effective way for monitoring ultra-low emission soot concentration in coal-fired power plants.
Funding Statement: This research was supported by National Key Research and Development Program of China (2016YFB0600601) and National Natural Science Foundation of China (51806144).
Conflicts of Interest: The authors declare that they have no conflicts of interest to report regarding the present study.
1. George, A., Shen, B. X., Kang, D. R., Yang, J. C., Luo, J. Z. (2020). Emission control strategies of hazardous trace elements from coal-fired power plants in China. Journal of Environmental Sciences, 7, 66–90. DOI 10.1016/j.jes.2020.02.025. [Google Scholar] [CrossRef]
2. Deng, H. B., Wang, Z. S. (2016). Considerations of applicable emission standards for managing atmospheric pollutants from new coal chemical industry in China. International Journal of Sustainable Development & World Ecology, 24(5), 427–432. DOI 10.1080/13504509.2016.1273266. [Google Scholar] [CrossRef]
3. Ministry of Ecology and Environment of the People’s Republic of China (2015). Fully implement the work plan to upgrade coal-fired power plants to achieve ultra-low emissions and conserve energy (2014∼2020). http://www.mee.gov.cn/gkml/hbb/bwj/201512/t20151215_319170.htm. [Google Scholar]
4. Ministry of Ecology and Environment of the People's Republic of China (2017). Specifications and test procedures for continuous emission monitoring system for SO2, NOx and particulate matter in flue gas emitted from stationary sources. HJ76–2017. [Google Scholar]
5. Cheng, Y., Lee, S. C., Gao, Y., Cui, L., Deng, W. J. et al. (2015). Real-time measurements of PM2.5, PM10–2.5, and BC in an urban street canyon. Particuology, 20, 134–140. DOI 10.1016/j.partic.2014.08.006. [Google Scholar] [CrossRef]
6. Jerez, S. B., Zhang, Y. H., McClure, J. W., Jacobson, L., Heber, A. et al. (2006). Comparison of measured total suspended particulate matter concentrations using tapered element oscillating microbalance and a total suspended particulate sampler. Journal of the Air & Waste Management Association, 56(3), 261–270. DOI 10.1080/10473289.2006.10464460. [Google Scholar] [CrossRef]
7. Knotter, D. M., Wolters, S. A. M., Kasanrokijat, M. A. (2007). Particle concentration measurements in process liquids using light-scattering techniques. Particulate Science and Technology, 25(5), 435–447. DOI 10.1080/02726350701487272. [Google Scholar] [CrossRef]
8. Zhu, X. S., Ahn, C. H. (2005). Electrochemical determination of reversible redox species at interdigitated array micro/nanoelectrodes using charge injection method. IEEE Transactions on Nanobioscience, 4(2), 164–169. DOI 10.1109/tnb.2005.850476. [Google Scholar] [CrossRef]
9. Sommersten, E. R., Lotsberg, J. K., Stamnes, K., Stamnes, J. J. (2010). Discrete ordinate and monte carlo simulations for polarized radiative transfer in a coupled system consisting of two media with different refractive indices. Journal of Quantitative Spectroscopy and Radiative Transfer, 111(4), 616–633. DOI 10.1016/j.jqsrt.2009.10.021. [Google Scholar] [CrossRef]
10. Haessler, W. M. (1965). Smoke detection by forward light scattering. Fire Technology, 1(1), 43–51. DOI 10.1007/bf02588443. [Google Scholar] [CrossRef]
11. Chen, X. W., Yin, G. F., Zhao, N. J., Yang, R. F., Xia, M. et al. (2021). Turbidity compensation method based on Mie scattering theory for water chemical oxygen demand determination by UV-Vis spectrometry. Analytical and Bioanalytical Chemistry, 413, 877–883. DOI 10.1007/s00216-020-03042-4. [Google Scholar] [CrossRef]
12. Yan, J., Bao, J., Yang, L., Fan, F. X., Shen, X. L. (2011). The formation and removal characteristics of aerosols in ammonia-based wet flue gas desulfurization. Journal of Aerosol Science, 42(9), 604–614. DOI 10.1016/j.jaerosci.2011.05.005. [Google Scholar] [CrossRef]
13. Wang, L. N., Zhu, L., Wang, D. G., Wang, K. (2016). Application of wet electrostatic precipitation technology in coal-fired power plants. China Electric Power, 49(6), 157–160. DOI 10.11930/j.issn.1004-9649.2016.06.157.04. [Google Scholar] [CrossRef]
14. Yi, H. H., Guo, X. M., Hao, J. M., Duan, L., Li, X. H. (2006). Characteristics of inhalable particulate matter concentration and size distribution from power plants in China. Journal of the Air & Waste Management Association, 56(9), 1243–1251. DOI 10.1080/10473289.2006.10464590. [Google Scholar] [CrossRef]
 | This work is licensed under a Creative Commons Attribution 4.0 International License, which permits unrestricted use, distribution, and reproduction in any medium, provided the original work is properly cited. |